Chapter 3 Three-Dimensional Transesophageal Echocardiography Systems
Introduction
Technologic advances continue to propel cardiac visualization forward. Advances in miniaturization, computer processing, and algorithms continue to have significant momentum. New acquisition technologies, coupled with the ability to process, display, and quantify enormous amounts of data, have pushed echocardiography forward into becoming a modality that will change cardiac intervention as well.1–13 Today, three-dimensional transesophageal echocardiography (3DTEE) has generated near-optical cardiac images. An understanding of cardiac mechanical motion in all of its spatial and temporal dimensions is providing valuable general physiologic insight for echocardiography as well as precise diagnoses for patients.
Transducer Technology
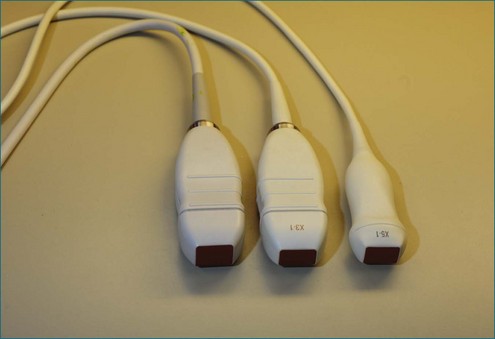
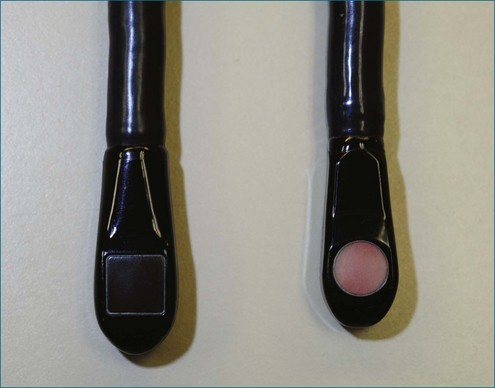
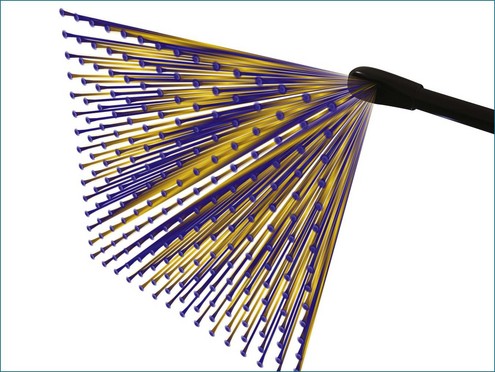
Conventional two-dimensional (2D) imaging, commonly used in echocardiography, uses transducers with several elements (Figure 3-1). Specifically, elements are oriented in a single row containing 48 to 128 elements, with each element electrically isolated from the others. Individual wavefronts are generated by firing elements in a certain sequence. Each element, constructively and destructively, adds and subtracts pulses, respectively, to generate a focused wave that has direction. This creates the radially propagated scan line. For example, if the farthest element on the right fires first and a timed sequence propagates along the element to the left, the beam will be steered to the left (Figures 3-2 and 3-3). Each element fires with a delay in phase with respect to a transmit initiation time. To further clarify this point, this one-dimensional array of elements can fire in two dimensions: radially and azimuthally (laterally). This spatiotemporal orientation of elements and their phase-timed firing sequence form the underpinning of any modern phased-array system.
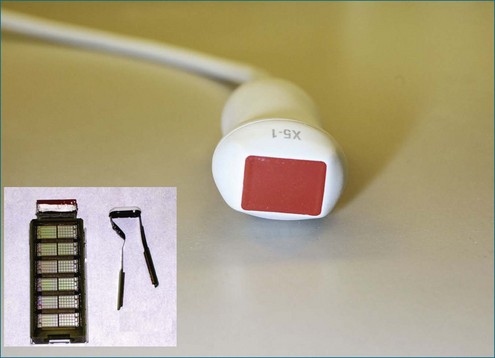
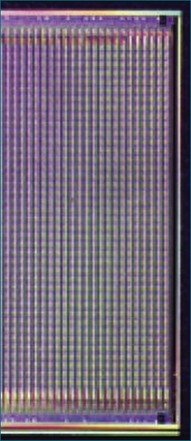
The key aspects pertinent to 3D echocardiography (3DE) imaging involve imaging moving structures. If a static structure that is not moving in space needs to be visualized, a 2D imaging transducer could be swept if the third spatial dimension could be additionally registered within the coordinate space. By using electromagnetic trackers, early gated 3D methodologies exploited this paradigm. Naturally, the 2D images needed to be gated to the electrocardiogram (ECG). This could lead to error caused by movement or arrhythmias, and these lengthy scans could take tens of minutes, requiring a few hundred heart cycles. Ultimately, high-resolution cardiac imaging requires instantaneous imaging to overcome these limitations. The key difference between a 2D imaging transducer and an instantaneous 3D imaging transducer is the arrangement of elements (Figures 3-4 to 3-7). Although a one-dimensional row is used for 2D imaging, a 2D matrix or checkerboard is used to steer an ultrasound scan line in the azimuthal as well as the elevational direction. A conventional 2D imaging transducer of one row steers energy in the azimuthal plane but unintentionally propagates elevational energy above and below the scanning plane. This checkerboard pattern allows phasic firing of elements to generate a radially propagated scan line that can be steered laterally and in elevation. Thus, the true 3D imaging transducer is born.
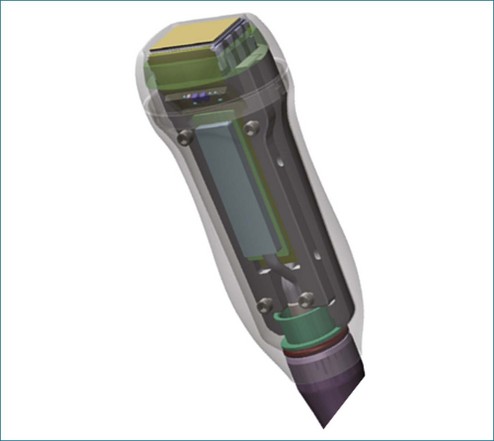
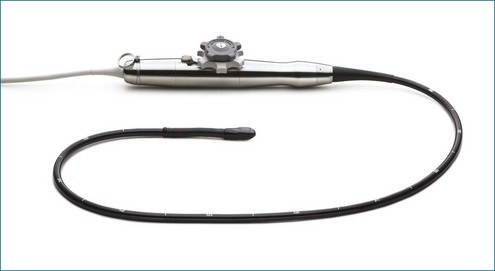
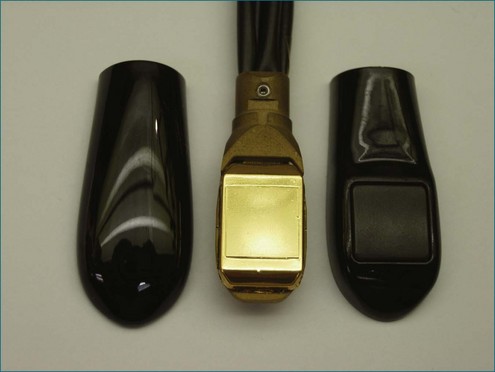
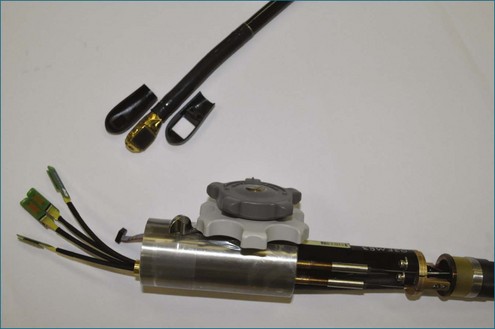
3DE depends on micro-beamforming miniaturization. By reducing the electronic substrate required to beamform onto a single chip, the transducer chip is miniaturized sufficiently to pass into the human esophagus. It also significantly reduces the power requirement and hence the amount of heat generated by live circuitry (Figures 3-8 to 3-10).
Beamforming
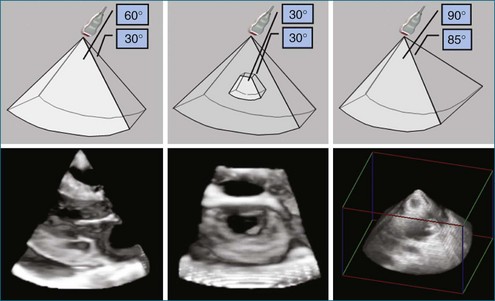
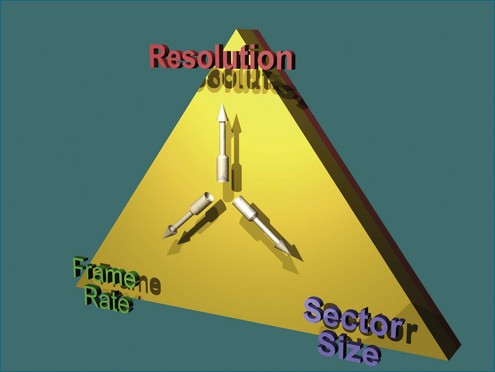
Ultimately, the constraint of a system can be described by a triangle whose boundaries are defined by the number of transmit lines that can be fired. Lines widely spaced can increase the volume size at the cost of lowering the resolution for a constant frame rate (Figure 3-11). Tight line spacing can be used in zoom modes to increase resolution, but at the price of a smaller volume. The number of transmit lines is a key determinant of frame rate; more lines increase the resolution but lower the frame rate.
1. Compute (direction and aperture) and fire the transmit scanline.
2. Listen, or sense, the returning echoes and digitally sample and store them.
3. Create multiple listening (after the fact) directions and foci (receive steering and dynamic focusing) from the digital data.
4. Compute the radiofrequency signal strength (envelope detection).
5. Scan to convert the 3D spherical system to the Cartesian (cubic) voxel system.
3D ultrasound imaging is still subject to the laws of acoustic physics even though it is ungated or “live 3D.” First, the aperture is an important determinant of image quality. Larger apertures allow better beamforming from a focus point of view. Unlike abdominal imaging, transthoracic echocardiography is limited by the ultrasound aperture that can fit between a rib space. In TEE, the aperture is limited by dimensions that can be accommodated within an adult esophagus. TEE generally uses higher frequencies compared with its transthoracic counterparts. This allows better image resolution for a given aperture size. (The higher the frequency, the better the ultrasound beam can focus, but this comes at the loss of penetration.) Since TEE is not limited by significant chest wall acoustic aberration, the higher frequencies and better acoustic substrate allow higher resolution compared with transthoracic imaging (Figures 3-11 and 3-12).
Quantification for Three-Dimensional Echocardiography
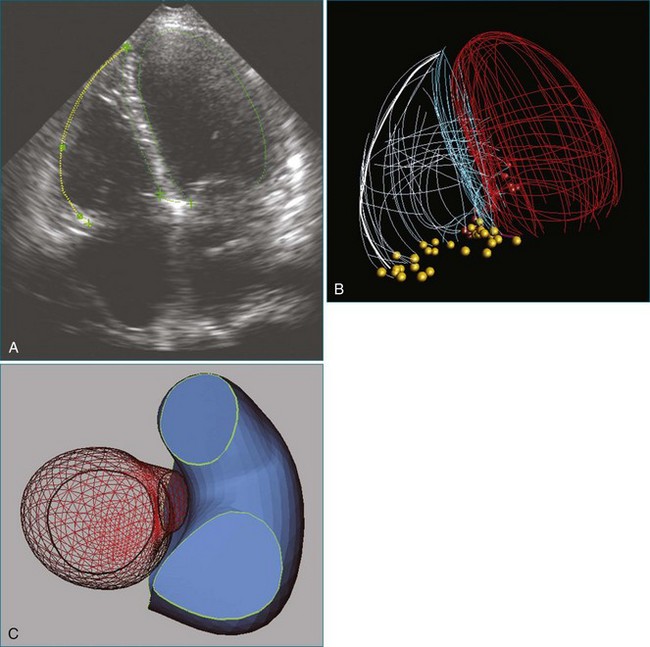
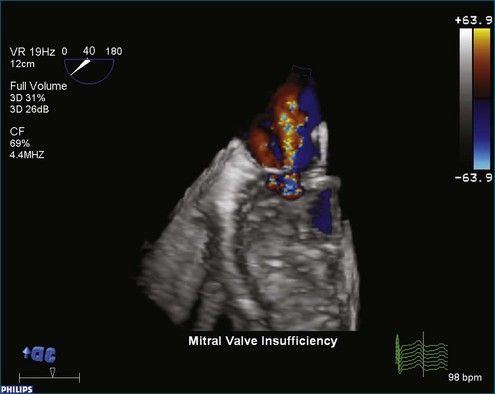
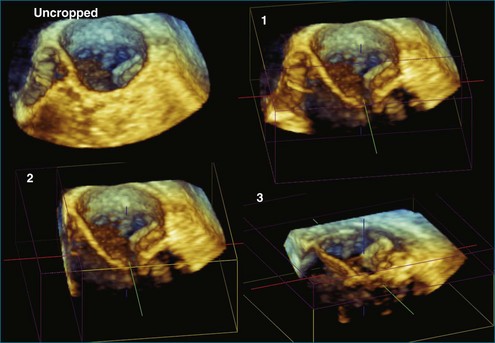
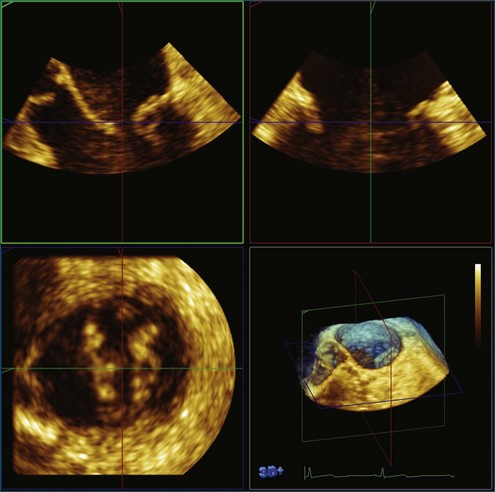
Once 3D data are processed, they are “volume rendered” to create the appearance of three dimensions (Figures 3-13 to 3-16). 3D color voxels can be rendered as well (see Figure 3-12). The considerable advantage of 3DE in acquiring ultrasound images of the beating heart makes it especially useful for cardiac quantification. While the display of anatomy in its true 3D state is important, many physicians believe that the single most significant value that 3DE has is its ability to quantify. Myocardial and valvular motion occurs in three spatial dimensions. Traditional 2D scanning planes do not capture this entire motion, or the plane can “slip” during scanning. Quantifying requires segmenting or separating out structures of interest from the 3D image. Machine vision techniques use methods that define an interface, such as a left ventricular (LV)-endocardial border. This interface is generated as a mesh of points and lines and displayed by a process known as surface rendering (Figure 3-17).
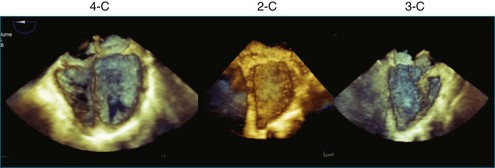
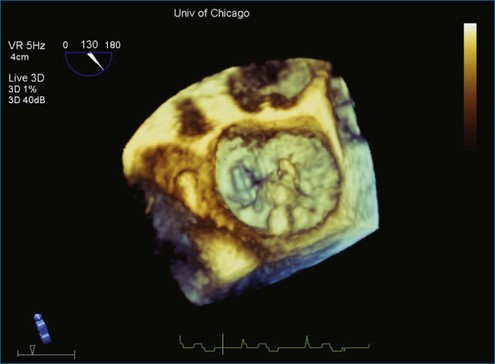
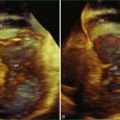
Figure 3-14 Three-dimensional transesophageal echocardiography of the mitral valve showing a flail segment near P2.
The application of 3D beamforming in a TEE probe allows visualization of the beating mitral valve. The mitral valve can be segmented with significant accuracy by using this approach. The true 3D structure of the mitral annulus, leaflets, and chordal apparatus can be measured. This further allows sophisticated analyses of the nonplanar shape of the mitral annulus.13–24 These 3D measurements include the following:


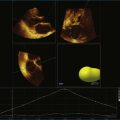
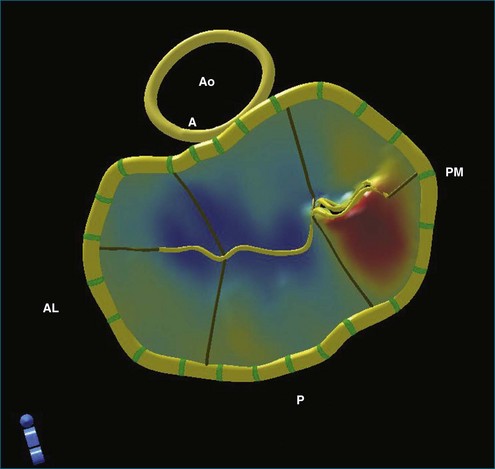
The ability to acquire structural data of the mitral valve allows advanced engineering techniques to examine the nature of fluid flow in three dimensions. For example, the proximal isovelocity surface area (PISA) technique is an important quantitative tool to estimate the degree of mitral regurgitation. It depends, however, on geometric assumptions, which must be respected.25 By using actual echocardiographic data from a mitral valve that has been segmented after 3DTEE, the flow of blood through the orifice can be simulated to see the nature of converging isovelocity fluid zones. Near an irregularly shaped orifice, the zone is necessarily irregular and nonspherical. This indicates that care should be exercised in selecting the PISA aliasing velocity to select a near-hemispherical convergence zone (Figure 3-18).26
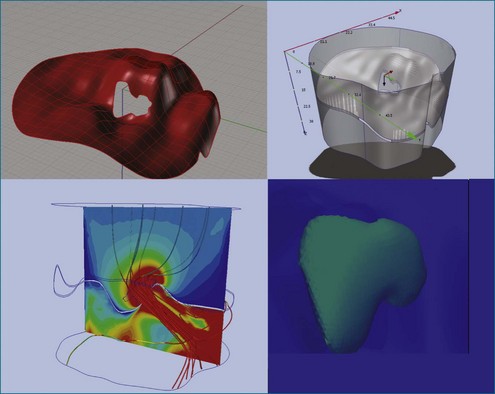
Figure 3-18 Three-dimensional (3D) computational fluid dynamics flow simulation of proximal isovelocity surface area using 3D transesophageal echocardiography segmentation of a regurgitant mitral orifice. Upper left, using similar technology as in Figure 3-17, a 3D mesh is created from 3D data and imported into a finite element environment (upper right). After setting initial pressure conditions, 3D stream lines pass through the regurgitant orifice from top to bottom (bottom left) (valve is upside down as from the left ventricular point of view). Close to the orifice, finite element simulation indicates that the proximal isovelocity convergence zone is not necessarily hemispherical (bottom right).
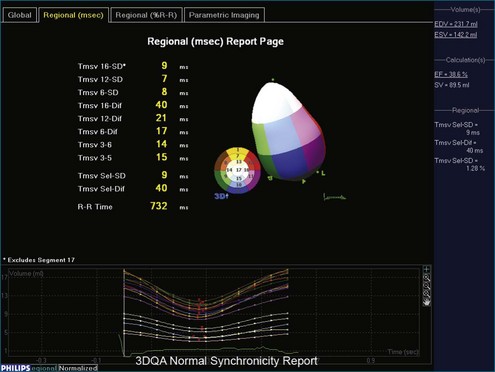
3D has a significant benefit over 2D in that if the entire LV chamber is encompassed in the acquisition volume, no foreshortening errors or assumption of LV volume are created. Biplane and triplane methods help avoid foreshortening errors and benefit from higher frame rates than 3D live acquisitions; however, if an aneurysmal dilation occurs between planes, the computed LV volumes will have some interpolation error. Surface rendering of the LV is used for chamber quantification. This can be used on all four chambers. Computer techniques allow calculation of volume, regional wall motion, and regional synchrony.27–43 Specifically, a 3D deformable model is used to find the LV endocardial surface in three dimensions. This is the most accurate way to quantify LV volumes. Moreover, 3D LV remodeling can be parametrically displayed using differential geometry techniques.44 This is done by calculating local curvatures around the LV endocardium (Figure 3-19). Since the normal LV is not a sphere, local radii of curvature vary around the segments of the LV. For example, the normal septum has different geometric characteristics from those of the apex. Quantification of LV synchrony is possible in 3D as well. The required frame rate depends on the questions being asked. Frame rates of 30 Hz (33 ms between frames) are inadequate to quantify intramyocardial motion; these are better suited to be studied by tissue Doppler or speckle tracking techniques. However, regional synchrony can be measured by 3D endocardial excursion because it assesses blood ejection, not tissue motion. 3DE provides a more complete assessment of 3D wall motion. Challenges in frame rate limitations, however, must be taken into account. Assessment of global function is more tolerant of lower frame rate acquisitions compared with that of regional function. That is, to find the ejection fraction, only accurate estimates of end-diastolic and end-systolic volumes are needed (Figure 3-20).
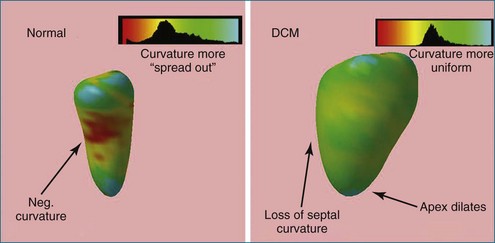
Figure 3-19 The left ventricular (LV) segmentation mesh technique (shown in Figure 3-19) can be used to create parametric displays of regional LV remodeling. At left is a normal patient with a smaller endocardial cavity and inward curvature of the LV septum. Patients with dilated cardiomyopathy (DCM) lose septal curvature and also have concomitant apical dilation (right). The histogram of curvatures has a smaller standard deviation and hence is more spherical in character. (A sphere has zero standard deviation since it has uniform radius.) Neg, negative.
1 Lee AP-W, Lam YY, Yip GW, et al. Role of real time three-dimensional transesophageal echocardiography in guidance of interventional procedures in cardiology. Heart. 2010;96:1485–1493.
2 Lang RM, Mor-Avi V, Dent JM, et al. Three-dimensional echocardiography: Is it ready for everyday clinical use? JACC. Cardiovasc Imag. 2009;2:114–117.
3 Lodato JA, Cao QL, Weinert L, et al. Feasibility of real-time three-dimensional transoesophageal echocardiography for guidance of percutaneous atrial septal defect closure. Eur J Echocardiogr. 2009;10:543–548.
4 Perk GM, Lang R. Transesophageal echocardiography: Three-dimensional echocardiography, percutaneous interventions. Use of real time three-dimensional transesophageal echocardiography in intracardiac catheter based interventions. J Am Soc Echocardiogr. 2009;22:865–882.
5 Perrin DP, Vasilyev NV, Novotny P, et al. Image guided surgical interventions. Curr Prob Surg. 2009;46:730–766.
6 Fischer GW, Salgo IS, Adams DH, et al. Real-time three-dimensional transesophageal echocardiography: The matrix revolution. J Cardiothorac Vasc Anesth. 2008;22:904–912.
7 Muller S, Feuchtner G, Bonatti J, et al. Value of transesophageal 3D echocardiography as an adjunct to conventional 2D imaging in preoperative evaluation of cardiac masses. Echocardiography. 2008;25:624–631.
8 Sugeng L, Shernan SK, Salgo IS, et al. Live 3-dimensional transesophageal echocardiography initial experience using the fully-sampled matrix array probe. J Am Coll Cardiol. 2008;52:446–449.
9 Vasilyev NV, Novotny PM, Martinez JF, et al. Stereoscopic vision display technology in real-time three-dimensional echocardiography-guided intracardiac beating-heart surgery. J Thorac Cardiovasc Surg. 2008;135:1334–1341.
10 Vasilyev NV, Melnychenko I, Kitahori K, et al. Beating-heart patch closure of muscular ventricular septal defects under real-time three-dimensional echocardiographic guidance: A preclinical study. J Thorac Cardiovasc Surg. 2008;135:603–609.
11 Suematsu Y, Marx GR, Stoll JA, et al. Three-dimensional echocardiography-guided beating-heart surgery without cardiopulmonary bypass: A feasibility study. J Thorac Cardiovasc Surg. 2004;128:579–587.
12 Cannon JW, Stoll JA, Salgo IS, et al. Real-time three-dimensional ultrasound for guiding surgical tasks. Comp Aid Surg. 2003;8:82–90.
13 Hung J, Guerrero JL, Handschumacher MD, et al. Reverse ventricular remodeling reduces ischemic mitral regurgitation: Echo-guided device application in the beating heart. Circulation. 2002;106:2594–2600.
14 Chandra SM, Salgo ISMM, Sugeng LMM, et al. Characterization of degenerative mitral valve disease using morphologic analysis of real-time three-dimensional echocardiographic images: Objective insight into complexity and planning of mitral valve repair. Circ Cardiovasc Imag. 2011;4:24–32.
15 Otani K. Assessment of aortic valve annulus size and shape using real-time 3D transesophageal echocardiography: P3-47. J Am Soc Echocardiogr. 2010;23:B76–BB77.
16 Malagoli A, Bursi F, Modena MG, et al. Failure of mitral valve repair: Partial detachment of valvular ring by 3D transesophageal echocardiography reconstruction. Echocardiography. 2009;26:111–112.
17 Sugeng L, Chandra S, Lang R. Color flow Doppler, mitral regurgitation, three-dimensional echocardiography. Three-dimensional echocardiography for assessment of mitral valve regurgitation.[Miscellaneous Article]. Curr Opin Cardiol. 2009;24:420–425.
18 Valocik G, Kamp O, Mannaerts HF, et al. New quantitative three-dimensional echocardiographic indices of mitral valve stenosis: New 3D indices of mitral stenosis. Int J Cardiovasc Imag. 2007;23:707–716.
19 Messas E, Yosefy C, Chaput M, et al. Chordal cutting does not adversely affect left ventricle contractile function. Circulation. 2006;114:I524–I528.
20 Sugeng L, Coon P, Weinert L, et al. Use of real-time 3-dimensional transthoracic echocardiography in the evaluation of mitral valve disease. J Am Soc Echocardiogr. 2006;19:413–421.
21 Ton-Nu TT, Levine RA, Handschumacher MD, et al. Geometric determinants of functional tricuspid regurgitation: Insights from 3-dimensional echocardiography. Circulation. 2006;114:143–149.
22 Watanabe N, Ogasawara Y, Yamaura Y, et al. Quantitation of mitral valve tenting in ischemic mitral regurgitation by transthoracic real-time three-dimensional echocardiography. J Am Coll Cardiol. 2005;45:763–769.
23 Watanabe N, Ogasawara Y, Yamaura Y, et al. Mitral annulus flattens in ischemic mitral regurgitation: Geometric differences between inferior and anterior myocardial infarction: A real-time 3-dimensional echocardiographic study. Circulation. 2005;112:I458–I462.
24 Salgo IS, Gorman JH, III., Gorman RC, et al. Effect of annular shape on leaflet curvature in reducing mitral leaflet stress. Circulation. 2002;106:711–717.
25 Schwammenthal E, Chunguang C, Giesler M, et al. New method for accurate calculation of regurgitant flow rate based on analysis of Doppler color flow maps of the proximal flow field: validations in a canine model of mitral regurgitation with initial application in patients. J Am Coll Cardiol. 1996;27:161–172.
26 Chandra S, Salgo IS, Sugeng L, et al. A three-dimensional insight into the complexity of flow convergence in mitral regurgitation: adjunctive benefit of anatomic regurgitant orifice area. Am J Physiol Heart Circ Physiol. 2011;301:H1015–H1024.
27 Caiani EG, Corsi C, Sugeng L, et al. Improved quantification of left ventricular mass based on endocardial and epicardial surface detection with real time three dimensional echocardiography. Heart. 2006;92:213–219.
28 Yang HS, Pellikka PA, McCully RB, et al. Role of biplane and biplane echocardiographically guided 3-dimensional echocardiography during dobutamine stress echocardiography. J Am Soc Echocardiogr. 2006;19:1136–1143.
29 Jacobs LD, Salgo IS, Goonewardena S, et al. Rapid online quantification of left ventricular volume from real-time three-dimensional echocardiographic data. Eur Heart J. 2006;27:460–468.
30 Jenkins C, Chan J, Hanekom L, et al. Accuracy and feasibility of online 3-dimensional echocardiography for measurement of left ventricular parameters. J Am Soc Echocardiogr. 2006;19:1119–1128.
31 Marsan NAMD, Bleeker GBMDP, Ypenburg CMD, et al. Real-time three dimensional echocardiography permits quantification of left ventricular mechanical dyssynchrony and predicts acute response to cardiac reynchrononization therapy. J Cardiovasc Electrophysiol. 2008;19:392–399.
32 Abraham TMD, Kass DMD, Tonti GMD, et al. Imaging cardiac resynchronization therapy. J Am Coll Cardiol Imag. 2009;2:486–497.
33 Marsan NAMD. Real-time three-dimensional echocardiography as a novel approach to quantify left ventricular dyssynchrony: A comparison study with phase analysis of gated myocardial perfusion single photon emission computed tomography. J Am Soc Echocardiogr. 2008;21:801–807.
34 Kapetanakis SM, Kearney MTMD, Siva AP, et al. Real-time three-dimensional echocardiography a novel technique to quantify global left ventricular mechanical dyssynchrony. Circulation. 2005;112:992–1000.
35 Agler DA, Adams DB, Waggoner AD, et al. Cardiac resynchronization therapy and the emerging role of echocardiography (part 2): The comprehensive examination. J Am Soc Echocardiogr. 2007;20:76–90.
36 Takeuchi M, Jacobs A, Sugeng L, et al. Assessment of left ventricular dyssynchrony with real-time 3-dimensional echocardiography: Comparison with Doppler tissue imaging. J Am Soc Echocardiogr. 2007;20:1321–1329.
37 Zamorano J, Perez DI, Roque C, et al. The role of echocardiography in the assessment of mechanical dyssynchrony and its importance in predicting response to prognosis after cardiac resynchronization therapy. J Am Soc Echocardiogr. 2007;20:91–99.
38 Pulerwitz T, Hirata K, Abe Y, et al. Feasibility of using a real-time 3-dimensional technique for contrast dobutamine stress echocardiography. J Am Soc Echocardiogr. 2006;19:540–545.
39 Mor-Avi V, Sugeng L, Weinert L, et al. Fast measurement of left ventricular mass with real-time three-dimensional echocardiography: Comparison with magnetic resonance imaging. Circulation. 2004;110:1814–1818.
40 Qin JX, Jones M, Travaglini A, et al. The accuracy of left ventricular mass determined by real-time three-dimensional echocardiography in chronic animal and clinical studies: A comparison with postmortem examination and magnetic resonance imaging. J Am Soc Echocardiogr. 2005;18:1037–1043.
41 Nishikage T, Nakai H, Mor-Avi V, et al. Quantitative assessment of left ventricular volume and ejection fraction using two-dimensional speckle tracking echocardiography. Eur J Echocardiogr. 2009;10:82–88.
42 Thomas JD, Popovi ZB. Assessment of left ventricular function by cardiac ultrasound. J Am Coll Cardiol. 2006;48:2012–2025.
43 Takeuchi M, Nishikage T, Mor-Avi V, et al. Measurement of left ventricular mass by real-time three-dimensional echocardiography: Validation against magnetic resonance and comparison with two-dimensional and m-mode measurements. J Am Soc Echocardiogr. 2008;21:1001–1005.
44 Salgo IS, Tsang W, Ackerman W, et al. Geometric assessment of regional left ventricular remodeling by three-dimensional echocardiographic shape analysis correlates with left ventricular function. J Am Soc Echocardiogr. 2012;25:80–88.