[level-membership-for-basic-science-category]Chapter 20
The Visual System
Neural Retina and Pigment Epithelium
Processing of Visual Input in the Retina
Outer and Inner Plexiform Layers
Optic Nerve, Chiasm, and Tract
Visual Fields Correlated with Visual Structures as Seen in Magnetic Resonance Imaging
Magnocellular and Parvocellular Layers
Ipsilateral and Contralateral Layers
Functional Organization of Visual Cortex
Receptive Field Properties of Cortical Neurons
Vision is the sensory modality that perhaps captures the imagination more than any other. Phrases such as “He is the apple of my eye,” or “Her eyes flashed with anger,” or “I see what you mean” are common in the language and literature of most cultures and date back thousands of years. Furthermore, because of the way the nervous system converts optical images into neural signals and eventually visual experiences, it is technically easier to study the visual system than other sensory systems. The visual system has consequently been studied in greater depth, in both its anatomy and its physiology, than other sensory systems, and the neural mechanisms by which physical energy in the environment is translated into psychological perceptions are better understood in the visual system than in any other sensory system. It turns out that many of the basic anatomic features and physiologic properties of the visual system, especially at the level of the cerebral cortex, are shared with other sensory systems. This chapter presents the visual system both as a sensory system important in its own right, particularly with respect to its importance in neurologic diagnosis, and as a convenient example of some basic principles of neural processing that are found in many neural systems, including sensory, motor, and associational systems.
OVERVIEW
Like other sensory systems, the visual system creates a location-coded (visuotopic) “map” of its sensory field (the visual world) that is preserved at all levels. Light information is received by the retinal photoreceptors, and the initial processing of the visual signal occurs in the retina. Although the retina projects to several diencephalon and midbrain structures, most retinal axons terminate in a thalamic relay nucleus, the lateral geniculate nucleus, which in turn innervates the primary visual cortex, a region in the occipital lobe. From there, visual information is sent to a number of visual association areas in the occipital, temporal, and parietal lobes.
ANATOMY OF THE EYE
The human eye forms an optical image of an individual’s surroundings and focuses that image on an array of approximately 125 million photoreceptors (rods and cones) that are located in the neural retina. The image is inverted and reversed by the lens. The anatomy of the eye is summarized here.
Cornea
The cornea provides a transparent protective coating for the optical structures of the eye (Fig. 20-1). Its lateral margin is continuous with the conjunctiva, a specialized epithelium covering the “white” (sclera) of the eye. Although the conjunctiva and sclera have a blood supply (most evident when the eyes are irritated), the central cornea is normally not vascularized.
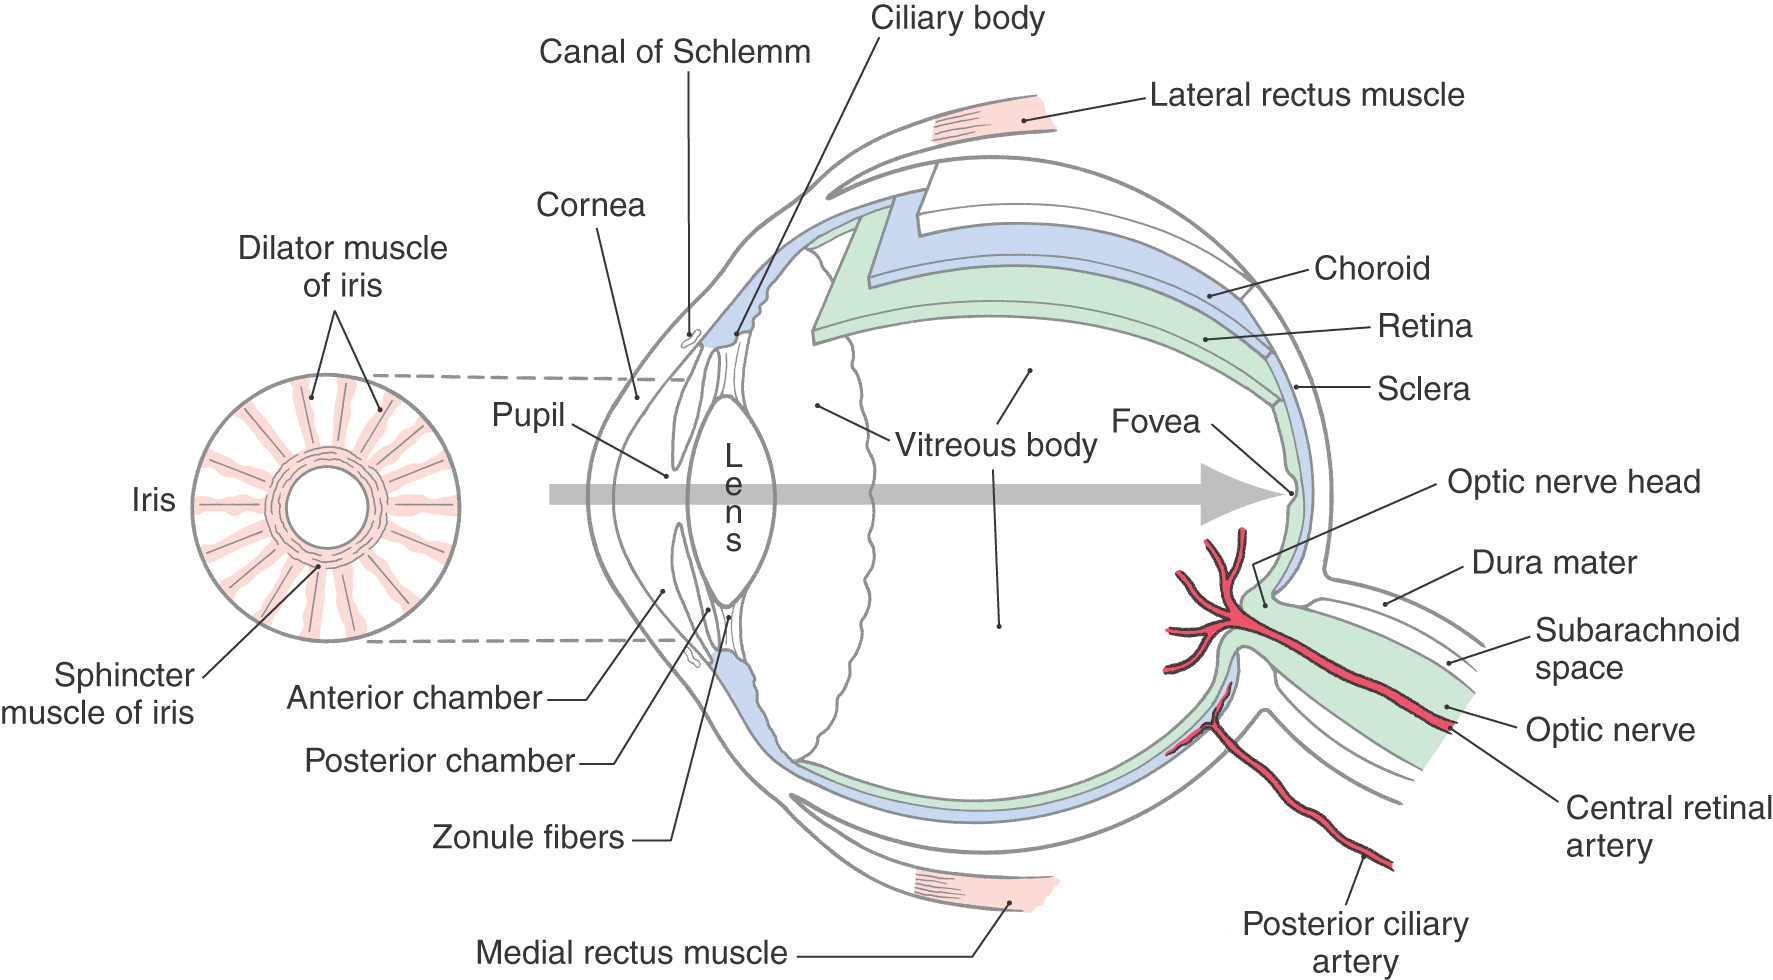
Figure 20-1. Cross section of the human eye. The gray arrow shows the path of light through the optical apparatus.
A variety of conditions may affect the cornea and, by disturbing the transmission of light through the cornea, degrade the quality of the visual image. Damage to the cornea may occur in chronic infections of herpesvirus, of Chlamydia trachomatis, or of the bacteria that cause conjunctivitis. Trauma may, of course, cause permanent damage to the cornea. In addition, various metabolic diseases may result in crystal deposits or other opacities in the cornea.
Chambers of the Eye
Just behind the cornea is the fluid-filled anterior chamber, which is bound posteriorly by the iris and the opening of the pupil (Fig. 20-1). A second fluid-filled space, the posterior chamber, is bound anteriorly by the iris and posteriorly by the lens and its encircling suspensory ligament (zonule fibers). Fluid is continuously produced by the epithelium over the ciliary body around the rim of the posterior chamber and flows through the pupillary opening into the anterior chamber. It then drains into a set of modified veins, the canals of Schlemm, that are located around the rim of the anterior chamber in the angle where the iris meets the cornea. Because the suspensory ligament encircling the lens consists of discrete strands, the fluid in the posterior chamber is in contact with the vitreous body, the gelatinous mass that fills the main space of the eyeball between the lens and the retina.
Any condition that obstructs the outflow of fluid via the canals of Schlemm can lead to glaucoma, a buildup of fluid and hence pressure in the entire eyeball, with resultant damage to the retina and optic nerve and eventual blindness. Patients with glaucoma often comment that their vision is blurred but not dimmed. A normal amount of light reaches the retina, but the progressive loss of photoreceptors causes blurring of the visual image. Damage proceeds from the periphery of the retina toward the central region where the fovea is located. In most cases of glaucoma (about 90%), the angle between the iris and cornea is normal (open-angle glaucoma), and the cause of the increase of pressure is unknown. In about 5% of patients, the angle between cornea and iris is abnormally acute (closed-angle glaucoma) and blocks the normal flow of fluid. In the remaining cases, the canals of Schlemm are blocked by debris from infection, complications of diabetes, or hemorrhage into the anterior chamber. When the intraocular pressure is above 20 mm Hg, optic nerve damage is a concern. The resulting visual loss proceeds from partial (in the periphery first) to total.
Iris
The iris is a pigmented structure lying directly anterior to the lens (Fig. 20-1). The connective tissue, or stroma, of the iris contains melanocytes that reflect or absorb light to give the iris its characteristic color. Also embedded in the stroma are the circumferentially organized sphincter muscle of the iris and the radially arranged dilator muscle (Fig. 20-1).
The innervation of the iris sphincter, which closes the pupil, is parasympathetic. This pathway begins with preganglionic neurons whose cell bodies lie in the Edinger-Westphal preganglionic nucleus and whose axons terminate in the ciliary ganglion. Axons of postganglionic ciliary ganglion neurons, in turn, end as neuromuscular synapses on the sphincter muscle and release acetylcholine. When activated, this pathway results in a reduction in pupil diameter, or miosis.
The innervation of the iris dilator, which opens the pupil, is sympathetic. The pathway begins with preganglionic neurons whose cell bodies lie in the intermediolateral cell column of the spinal cord at upper thoracic levels and whose axons terminate in the superior cervical ganglion. Axons of postganglionic superior cervical ganglion neurons, in turn, end as neuromuscular synapses on the dilator muscle and release norepinephrine. When activated, this pathway results in an increase in pupil diameter, or mydriasis. This phenomenon is a measure of the general state of the sympathetic tone. Anger, pain, or fear may result in an enlargement of the pupil in the absence of a change in lighting conditions. The pupillary light reflex, a contraction of the pupil in response to light, is used to assess the function of the nervous system, particularly at midbrain levels (see Chapter 28).
The circumference of the pupillary margin changes by a factor of six. This proportional change in muscle length is greater than any other in the human body. To accomplish this change, acetylcholine is released onto both the sphincter and dilator muscles. The effect is to activate muscarinic receptors that depolarize sphincter muscle cells and cause contraction. In addition, acetylcholine released by collaterals onto the dilator muscle mediates presynaptic inhibition of norepinephrine release and blocks dilator contraction. Thus, as the sphincter contracts, the dilator relaxes, strengthening the pupillary response to light.
Lens
The lens is a clear structure that focuses light on the retina (Fig. 20-1). The lens of the eye is a simple convex lens that inverts and reverses the image on the retina. Mechanisms that change the curvature of the lens are discussed in detail in Chapter 28.
Beginning at about the age of 40 years, the lens begins to lose its elasticity so that the shape it adopts when relaxed is more flattened than earlier in life. This change reduces the affected person’s ability to focus on near objects, a condition called presbyopia. Reading or bifocal corrective lenses are prescribed to aid the patient in performing tasks requiring close, detailed vision.
Cataract
Opacities in the lens, known as cataracts, are relatively common and can be seen as a cloudiness of the lens. Cataracts may be caused by congenital defects (e.g., secondary to maternal infection with rubella), persistent exposure to ultraviolet light, diabetes, high doses of some medications, radiation therapy, or poorly understood mechanisms that occur in aging. Current therapy consists of replacement of the lens with an inert plastic prosthesis, restoring sight but with a concomitant loss of accommodation.
Uvea
The iris, ciliary body, and choroid make up the vascular tunic of the eye, also called the uvea. The choroid is a highly vascularized, pigmented tissue layer lying between the retinal pigment epithelium and the sclera, the tough outer coating of the eye. Uveitis is an inflammation of these structures, often secondary to eye injury.
NEURAL RETINA AND PIGMENT EPITHELIUM
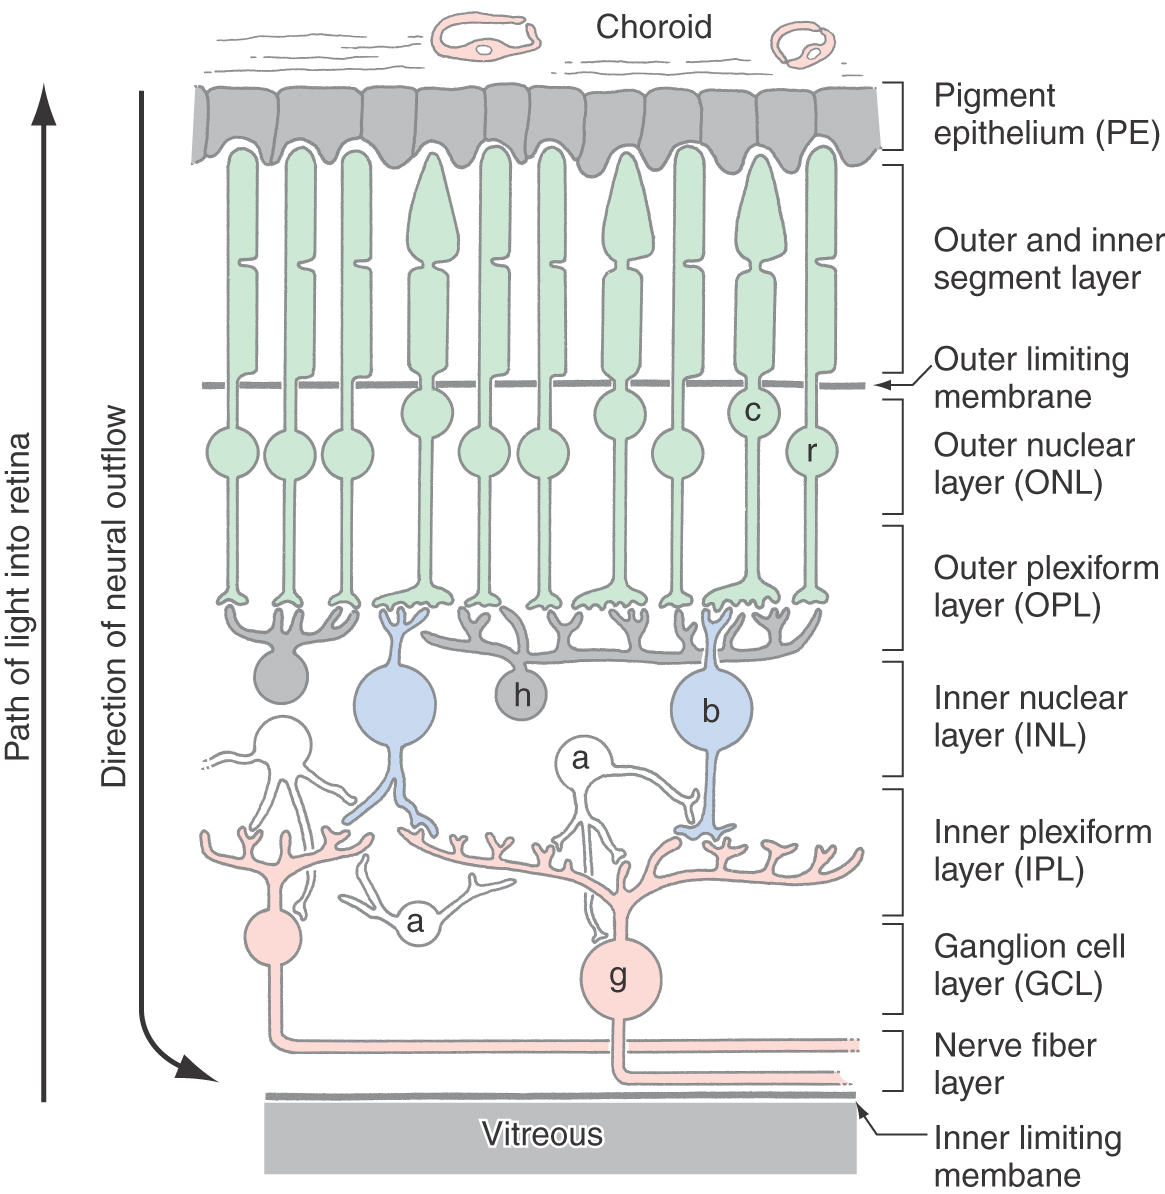
The inner surface of the posterior aspect of the eye is covered by the retina, which is composed of the neural retina and the retinal pigment epithelium (Fig. 20-2). In describing the layers and cells of the retina, it is common to use the terms inner and outer. Inner refers to structures located toward the vitreous (i.e., the center of the eyeball), whereas outer is used in reference to structures located toward the pigment epithelium and choroid.
The retinal pigment epithelium is a continuous sheet of pigmented cuboidal cells bound together by tight junctions that block the flow of plasma or ions. Its functions are as follows: (1) it supplies the neural retina with nutrition in the form of glucose and essential ions; (2) it protects retinal photoreceptors from potentially damaging levels of light; and (3) it plays a key role in the maintenance of photoreceptor anatomy via phagocytosis.
The neural retina contains the photoreceptors and associated neurons of the eye and is specialized for sensing light and processing the resultant information. The photoreceptors absorb quanta of light (photons) and convert this input to an electrical signal. The signal is then processed by retinal neurons, as discussed further on. Finally, the retinal neurons called ganglion cells send the processed signal to the brain via axons that collectively form the optic nerve.
The contact between the neural retina and the pigment epithelium is the adult remnant of the ventricular space of the developing eye cup. As such, it is mechanically unstable. This instability is demonstrated in a retinal detachment, in which the neural retina tears away from the pigment epithelium. Retinal detachment is more commonly seen in male patients and may result from a range of factors, such as trauma to the orbit or head, sequela to cataract surgery, genetic predisposition, degenerative diseases of the eye or optic nerves, and aging. Because photoreceptors are metabolically dependent on their contact with pigment epithelial cells, a detached retina must be repaired to avoid further damage. The detached part of the neural retina is reattached to the pigment epithelium by surgical procedures. The degree of functional recovery in the reattached part of the retina depends on its location. It also depends on how soon the reattachment is performed after the injury.
The neural retina has seven characteristic layers (Fig. 20-2). From outer to inner they are (1) a layer containing the photoreceptor cell outer and inner segments; (2) an outer nuclear layer, consisting of the nuclei of photoreceptor cells; (3) the outer plexiform layer, consisting of the synaptic connections of photoreceptors with second-order retinal cells; (4) the inner nuclear layer, containing somata of second-order and some third-order retinal cells; (5) the inner plexiform layer, another area of synaptic contact; (6) the ganglion cell layer, containing the cell bodies of the ganglion cells; and (7) the nerve fiber layer (or optic fiber layer), composed of the axons of the ganglion cells. These axons converge at the optic disc to form the optic nerve. Layers 2 through 7 are flanked by a pair of limiting membranes, which consist of glial cell processes joined by tight junctions. The outer limiting membrane is located between layers 1 and 2, and the inner limiting membrane is located between the nerve fiber layer and the vitreous.
The photoreceptor outer segments interdigitate with the melanin-filled processes of pigment epithelial cells (Fig. 20-2). These processes are mobile, and they elongate into the pigmented layer when the light is bright (photopic conditions) and retract when the light is dim (scotopic conditions). This mechanism combines with contractions of the iris to protect the retina from light conditions that would otherwise damage the photoreceptors. The iris, pigment epithelium, and circuitry of the retina all contribute to the eye’s ability to resolve the visual world over a wide range of light conditions.
The blood supply of the neural retina arises from branches of the ophthalmic artery; these branches are the central artery of the retina and the ciliary arteries. The central artery is usually the first branch of the ophthalmic, passes rostral and inferiorly adjacent to the dural sheath, and then enters the sheath and the optic nerve about 1.25 cm caudal to the bulb of the eye. After entering the eyeball, it branches out from the optic nerve head to serve inner portions of the neural retina. The ciliary arteries penetrate the sclera around the exit of the optic nerve and feed the choriocapillaris (a portion of the choroid), which in turn provides nutrients to the outer portions of the neural retina.
PHOTORECEPTOR CELLS
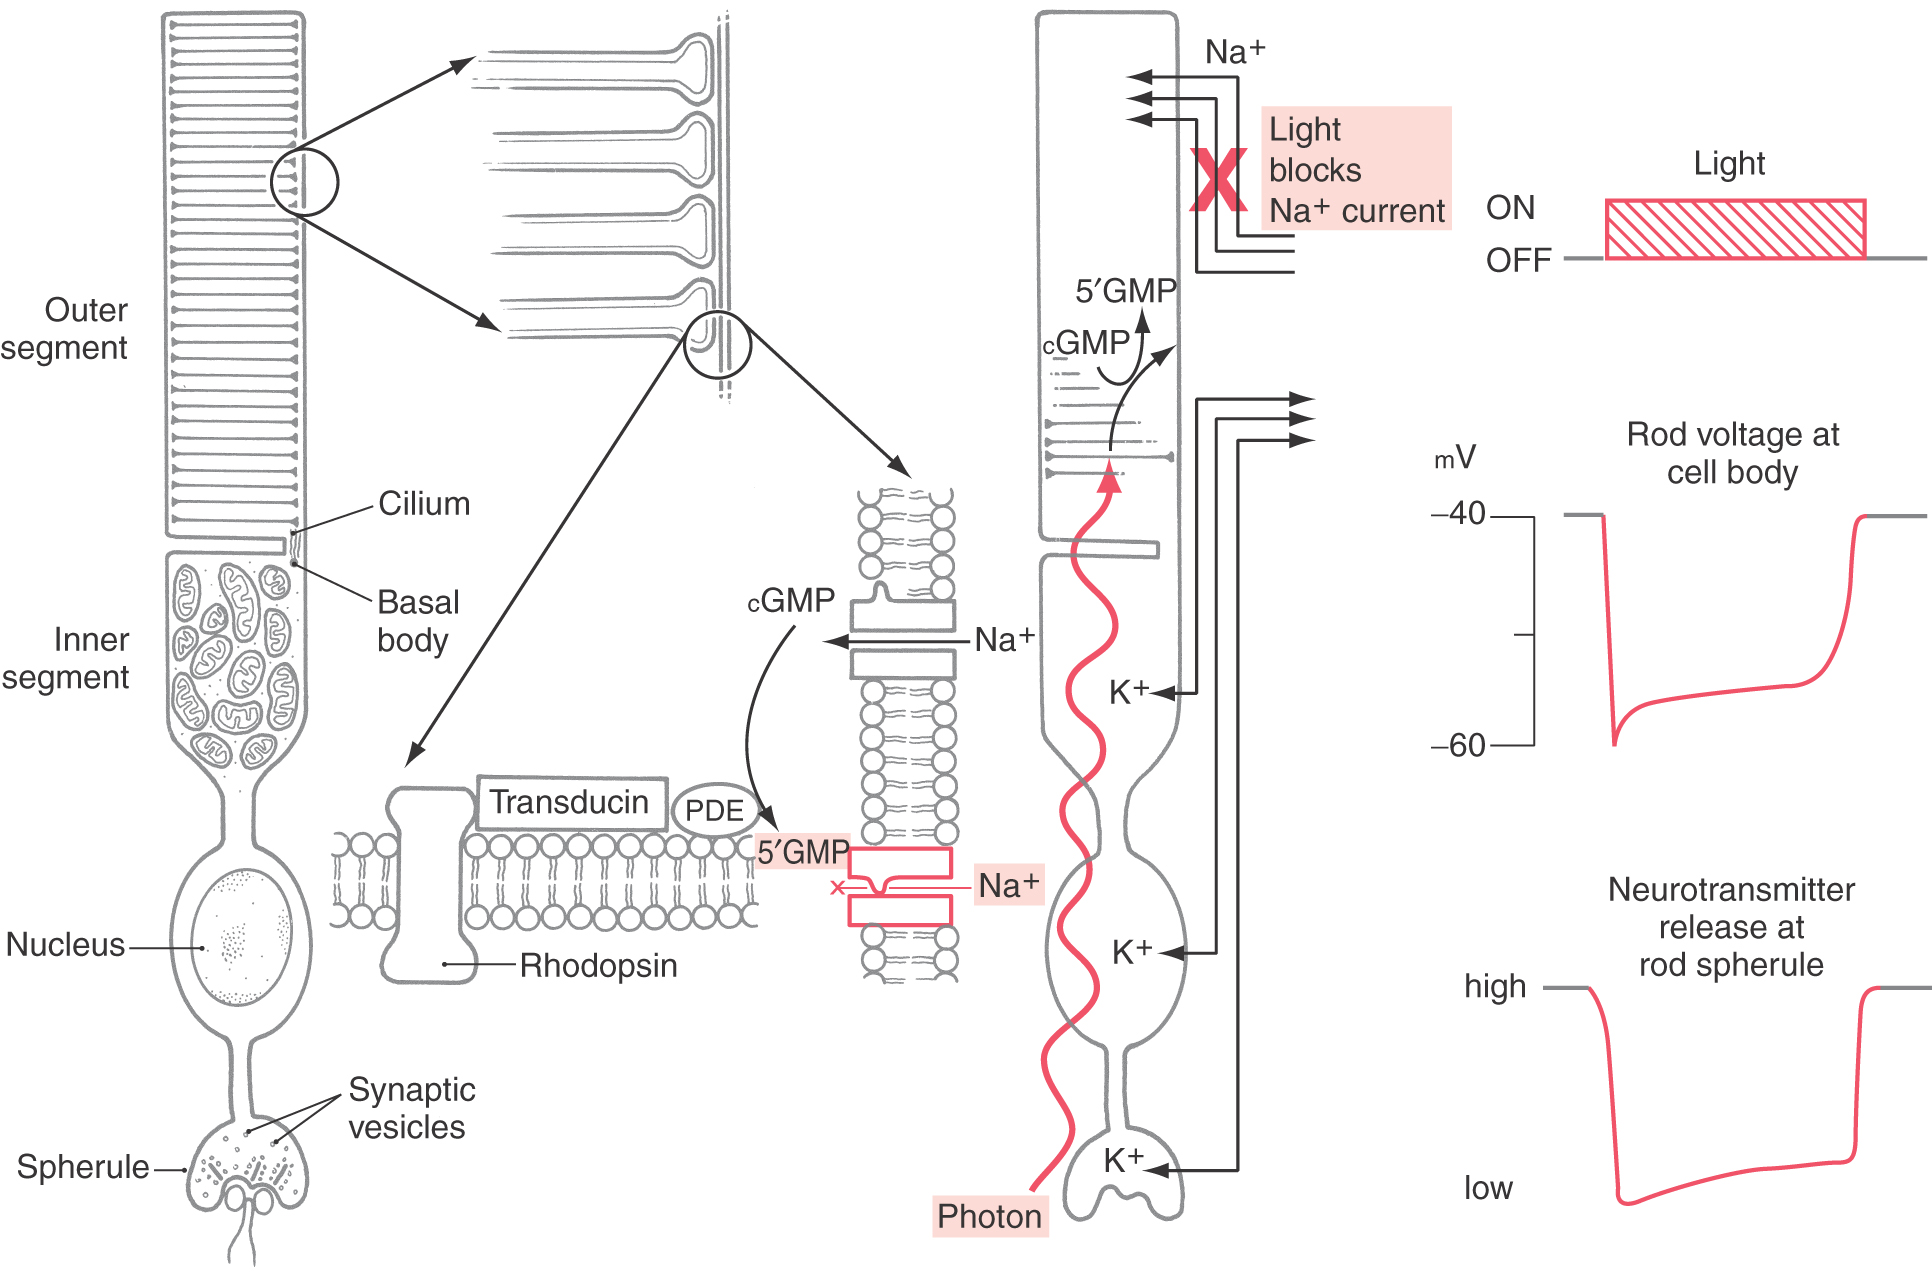
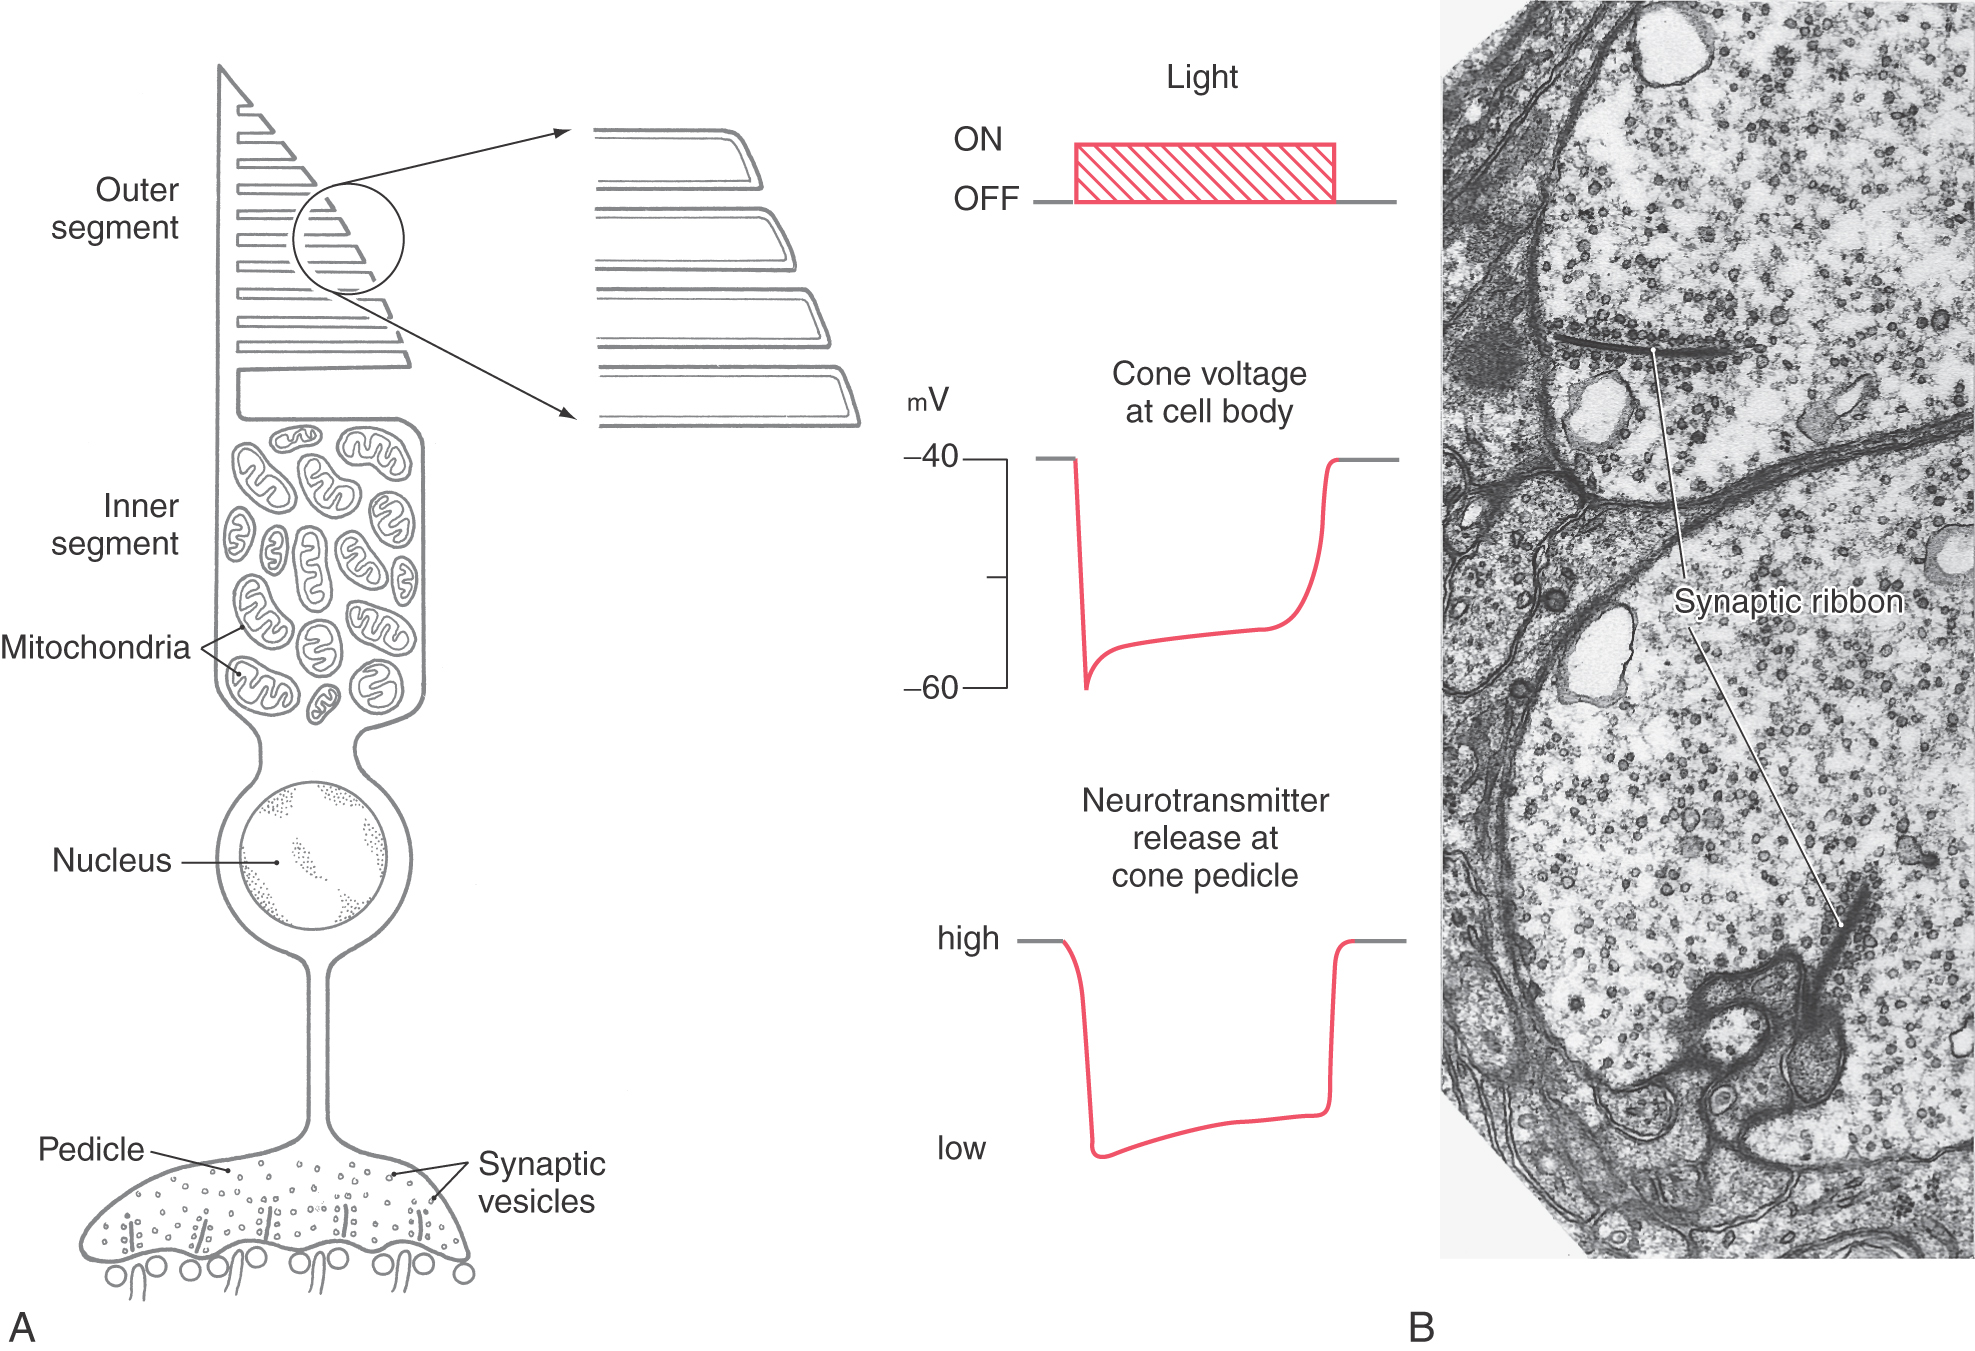
The rods and cones of the retina are responsible for photoreception, the process by which photons are detected and the information is transduced into an electrochemical signal. There are two basic types of photoreceptors, rods and cones (Figs. 20-3 and 20-4), although a special class of ganglion cell (melanopsin-containing ganglion cell) may be considered a third type of photoreceptor (see later). Rods and cones have the same general overall design. Light is detected and transduced in an outer segment that points toward the pigment epithelium. A narrow stalk, the cilium, connects the outer segment to a second expanded region called the inner segment, which contains mitochondria and produces the energy that maintains the cell. The cilium contains nine pairs of microtubules emanating from a basal body located in the inner segment. The nucleus and perikaryon of the cell are found in the outer nuclear layer; finally, the cell terminates in the outer plexiform layer in an expansion that makes synaptic contacts with neurons. This synaptic expansion is called the spherule in rod cells and the pedicle in cone cells. Both rod and cone synaptic terminals contain a characteristic dark sheet of protein called the synaptic ribbon. This structure may act as a “conveyor belt,” organizing vesicular release of transmitter.
Rods
Rod cells are named for the shape of their outer segment, which is a membrane-bound cylinder containing hundreds of tightly stacked membranous discs (Fig. 20-3). The rod outer segment is a site of transduction. Photons travel through cells of the neural retina before striking the membranous discs of the rod outer segment. Molecules of rhodopsin within these membranes undergo a conformational change and along with transducin and phosphodiesterase induce biochemical changes in the rod outer segment, which reduce levels of cyclic guanosine monophosphate (cGMP). In the dark, cGMP levels in the rod outer segment are high. This cGMP mediates a standing sodium current. At rest, in the dark, sodium ions flow into the rod outer segment. This high resting level of sodium permeability results in a relatively high resting potential for rod cells, about −40 mV. These sodium channels of the outer segment membrane, which are normally open, close in response to increased calcium or a reduction in cGMP. This drives the membrane potential away from the sodium equilibrium potential and toward the potassium equilibrium potential, and the rod cell is hyperpolarized in response to a light stimulus (Fig. 20-3). Note that photoreceptors are the only sensory neurons that hyperpolarize in response to the relevant stimulus.
The hyperpolarization of the rod outer segment propagates passively (i.e., without firing an action potential) through the perikaryon to the rod spherule. In the absence of light, the photoreceptor terminals constantly release the transmitter glutamate at these synapses. The arrival of a light-induced wave of hyperpolarization causes a transient reduction in this tonic release of glutamate. As explained further on, this event can depolarize some of the cells that receive synapses from photoreceptor terminals while hyperpolarizing others.
Rhodopsin molecules are capable of a huge but finite number of photoisomerization events. Rather than replace individual rhodopsin molecules, every morning the distal one tenth of the outer segment is broken off and phagocytosed by the pigment epithelium. Through this process of rod shedding, the outer segment is constantly renewed. New discs are formed at the base of the outer segment and move outward so that the shed discs are replaced. In this way, the rod remains a constant length and the outer segment is renewed about every 10 days.
Cones
Like rod outer segments, cone outer segments also consist of a membranous stack (Fig. 20-4). Unlike in rods, however, these stacks of cone membranes are of constantly decreasing diameter (from cilium to tip), giving the cell its characteristic shape. Also, they are not enclosed within a second membrane but are open to the extracellular space adjacent to the pigment epithelium (Fig. 20-4).
The process of transduction in cones is generally similar to that in rods. Cone opsin absorbs photons and undergoes a conformational change, resulting in a hyperpolarization of the cell membrane (Fig. 20-4). This hyperpolarization propagates passively to the cone’s synaptic ending, the cone pedicle, in the outer plexiform layer. Cone pedicles and rod spherules both contain synaptic ribbons surrounded by vesicles, but cone pedicles are larger (Fig. 20-4). Serial-section electron microscopy has shown that the synaptic ribbons are actually a single extensive sheet of protein. Like rods, cones release the neurotransmitter glutamate tonically in the dark and respond to light with a decrease in glutamate release.
There are three types of cones, each tuned to a different light wavelength (Fig. 20-5). L-cones (red cones) are sensitive to long wavelengths, M-cones (green cones) to medium wavelengths, and S-cones (blue cones) to short wavelengths. Because any pure color represents a particular wavelength of light, each color will be represented by a unique combination of responses in the L-, M-, and S-cones.
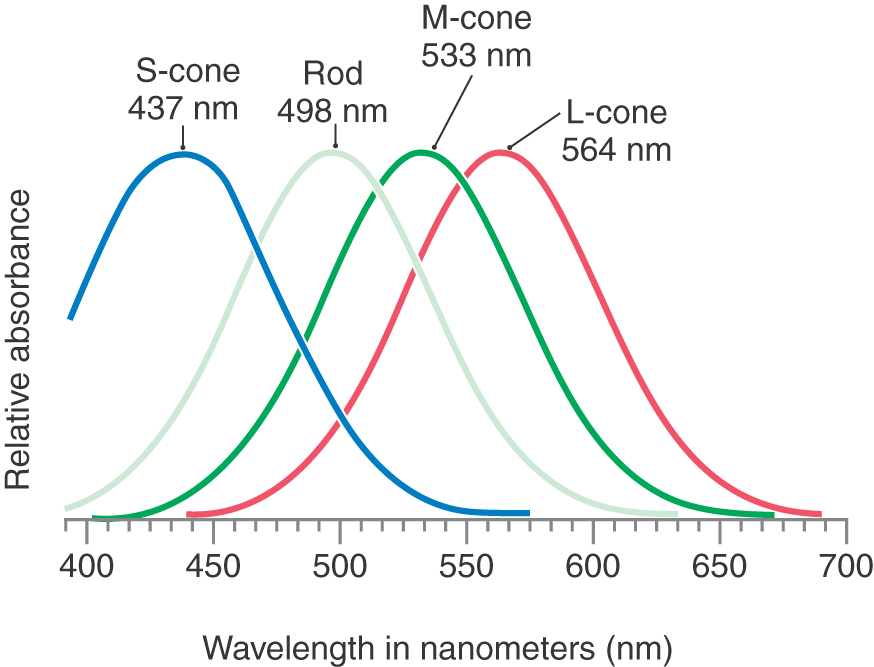
If one of these cone types is absent because of a genetic defect in the corresponding opsin, the affected person will confuse certain colors that look different to visually normal individuals and is said to be color blind. It is better, however, to think of this condition as “color confusion” because the patient can still see all colors of the visible spectrum; it is the ability to distinguish certain colors that has been lost. Because the genes for the L-cone (red-absorbing) and M-cone (green-absorbing) opsins are located on the X chromosome, color blindness is more common in men. Alteration of the gene for the S-cone (blue-sensitive) pigment, which is located on an autosome, is much rarer. The inability to detect a pure red is known as protanopia, and inability to detect green is known as deuteranopia.
Macula and Fovea
At the posterior pole of the eye is a yellowish spot, the macula lutea, the center of which is a depression called the fovea centralis (Fig. 20-6). Near the fovea, the inner retinal layers become thinner and eventually disappear so that at the bottom of the foveal pit, only the outer nuclear layer and photoreceptor outer segments remain. This allows a maximum amount of light to reach the photoreceptors with optimal fidelity.
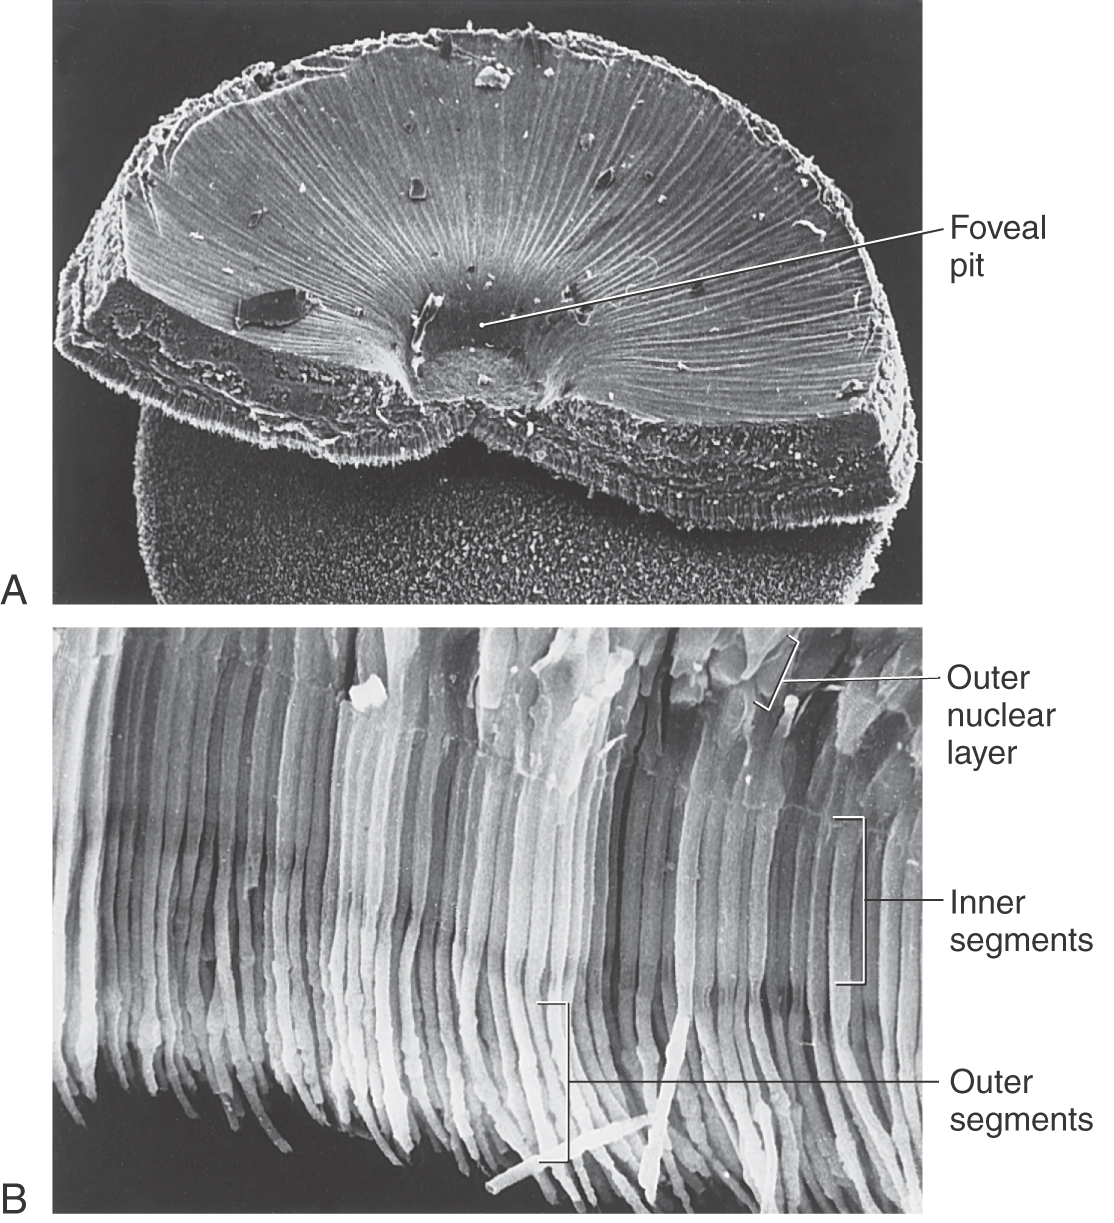
Most of the visual input that reaches the brain comes from the fovea. Cones, which are responsible for color vision, are the only type of photoreceptor present in the fovea. In contrast, rods, which are most sensitive at low levels of illumination, are the predominant photoreceptors in the periphery of the retina. The visual world is a composite formed from a succession of foveal images carrying form and color information supplemented with input from the peripheral retina carrying motion information.
RECEPTIVE FIELDS
The receptive field of a visually responsive neuron is defined as that region of the visual world in which a stimulus of the proper characteristics will influence the activity of the neuron. The influence may be either excitatory or inhibitory. Some neurons will exhibit an excitatory influence when the stimulus is in one location and an inhibitory influence when the stimulus is in a nearby location. The receptive field of a neuron is the sum of the areas in which the stimulus affects the activity of that neuron.
In the early stages of visual information processing, receptive fields have a characteristic concentric center-surround organization. The receptive field is roughly circular (Fig. 20-7). Stimuli in the center of this circle tend to evoke one type of response (e.g., depolarization), whereas stimuli in the doughnut-shaped outer rim evoke the opposite response (e.g., hyperpolarization). In later stages of visual processing, in the visual cortex, receptive field properties are more complicated.
PROCESSING OF VISUAL INPUT IN THE RETINA
Among retinal cells, only retinal ganglion cells have voltage-gated sodium channels on their axonal membranes. As a result, only ganglion cells use action potentials to carry information. So-called calcium spikes resulting from an increase in calcium permeability are seen in amacrine cells. All other retinal cells use only graded potentials to process information.
The receptive field properties of each retinal cell depend on the processing of information passing through the neurons between the photoreceptor and the retinal cell in question. For example, a bipolar cell’s response is directly related to the activity of photoreceptors and horizontal cells (Figs. 20-7 and 20-8). As with all sensory systems, the structural, electrical, and synaptic properties of the cell are reflected in receptive field properties.
Outer and Inner Plexiform Layers
Synaptic contacts in the retina are concentrated in the outer and inner plexiform layers (Fig. 20-2). The outer plexiform layer contains synapses among and between retinal photoreceptors, horizontal cells, and bipolar cells. Contacts between a single cone pedicle or rod spherule, a centrally placed postsynaptic bipolar cell process, and two laterally placed horizontal cell processes form a triad.
The inner plexiform layer contains synaptic contacts among and between bipolar, amacrine, and ganglion cells. In this layer, “off” and “on” bipolar cells terminate, making synaptic contact with the corresponding type ganglion cell. Amacrine cells also synapse with ganglion cells, other amacrine cells, and bipolar cells.
Horizontal Cells
Horizontal cells consist of a cell body and its associated dendrites and an axon that courses parallel to the plane of the retina to nearby and distant photoreceptors (Fig. 20-2). These cells receive glutaminergic input from photoreceptors and in turn form GABAergic synaptic contacts on adjacent rods and cones. Horizontal cells play a critical role in establishing the concentric center-surround receptive field organization of retinal ganglion cells (Figs. 20-7 and 20-8; see also Fig. 20-22A). They also mediate a process termed lateral inhibition that is responsible for sharpening the edges of images perceived in the visual system.
Bipolar Cells
In their position between photoreceptor cells and ganglion cells, bipolar cells help form a straight-through pathway for visual input (Fig. 20-2). Cone bipolar cells and rod bipolar cells are differentiated on the basis of their principal synaptic inputs.
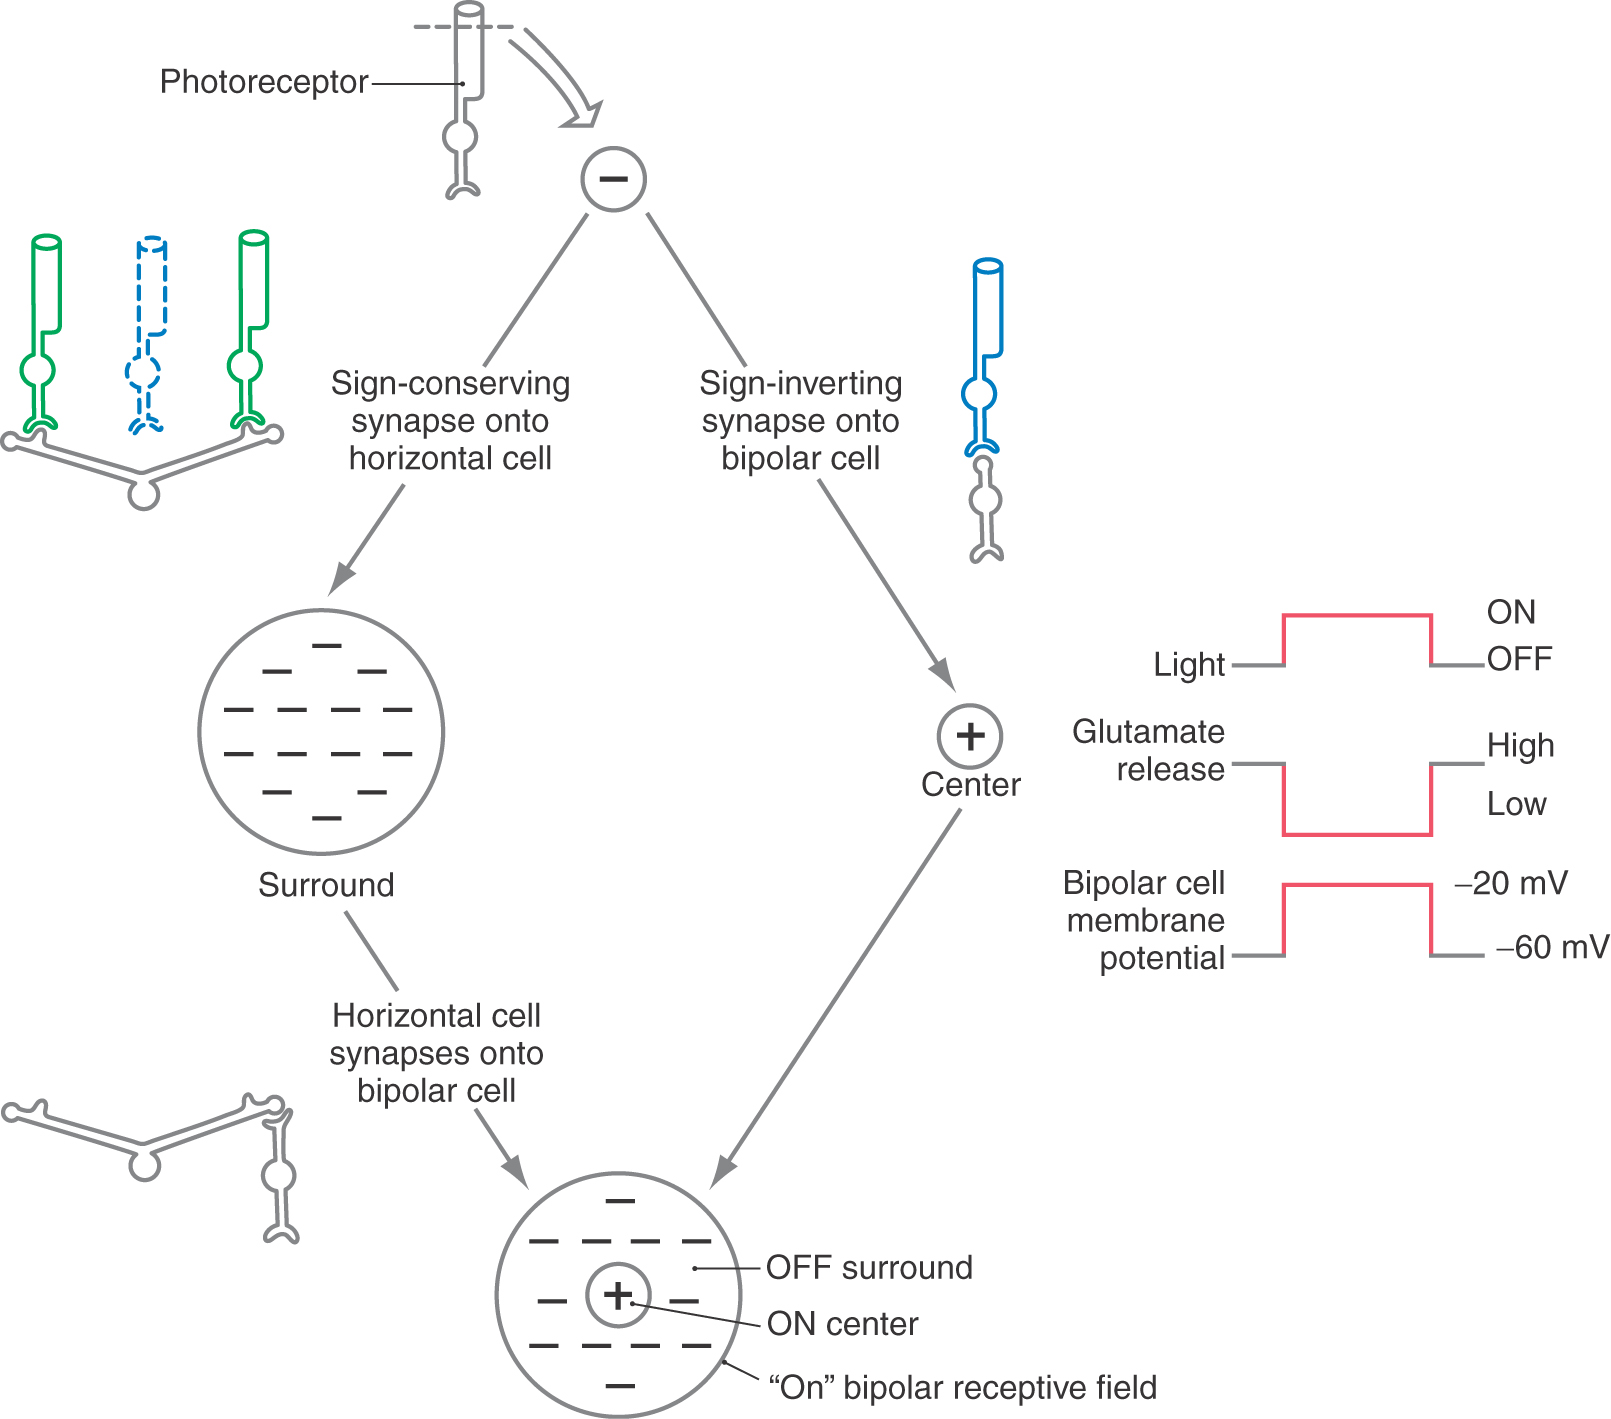
Bipolar cells are the comparators, or edge detectors, of the retina. With the horizontal cells, they compare the activity in each region of the visual field with that in a nearby location. They are the first visual cells to exhibit the center-surround receptive field organization. In terms of physiologic response, there are two basic types of bipolar cells. On, or depolarizing, cells respond to a light stimulus in the receptive field center by depolarizing, whereas off, or hyperpolarizing, bipolar cells have the opposite center response (Figs. 20-7 and 20-8).
Imagine a series of photons striking a photoreceptor outer segment. Recall that the photoreceptor is hyperpolarized in response to light input, so that release of its neurotransmitter, glutamate, is decreased in the presence of light.
In an on bipolar cell, glutamate must act through receptors to hyperpolarize the bipolar cell. Then, when the glutamate that is released constantly in the dark is removed by the presence of light, the on bipolar cell depolarizes. This effect can be confusing because we are used to thinking of most glutamate receptors as excitatory or sign conserving. These receptors must be of a different type from that found elsewhere, namely, inhibitory or sign inverting (Table 20-1).
Table 20-1 Responses of Bipolar Cells to Stimuli
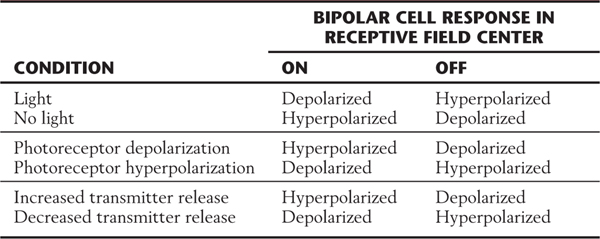
In an off bipolar cell, the opposite type of glutamate receptor must be present on the postsynaptic membrane. In the dark, glutamate released tonically by the photoreceptor depolarizes the off bipolar cell. Then, when photons activate the photoreceptor, it hyperpolarizes and reduces its release of glutamate. The decrease in the amount of neurotransmitter causes a hyperpolarization of the postsynaptic off bipolar cell membrane. This effect could take place by use of the “conventional” type of glutamate receptor, which is excitatory or sign conserving.
Thus the designation sign conserving means that the electrical responses of the photoreceptor and bipolar cell are the same (hyperpolarization in one leads to hyperpolarization in the other; depolarization in one leads to depolarization in the other), and sign inverting means that the electrical response is inverted (hyperpolarization in one leads to depolarization in the other, and vice versa). The terms excitation and inhibition lead to confusion in this context and therefore are avoided.
Amacrine Cells
These cells have a small soma, no obvious axon, and dendrites that are few but highly branched (Fig. 20-2). Their cell bodies are usually found in the inner nuclear layer but may be displaced into the ganglion cell layer. Amacrine cells may contain two different transmitters, for example, γ-aminobutyric acid (GABA) and acetylcholine or glycine and a neuropeptide.
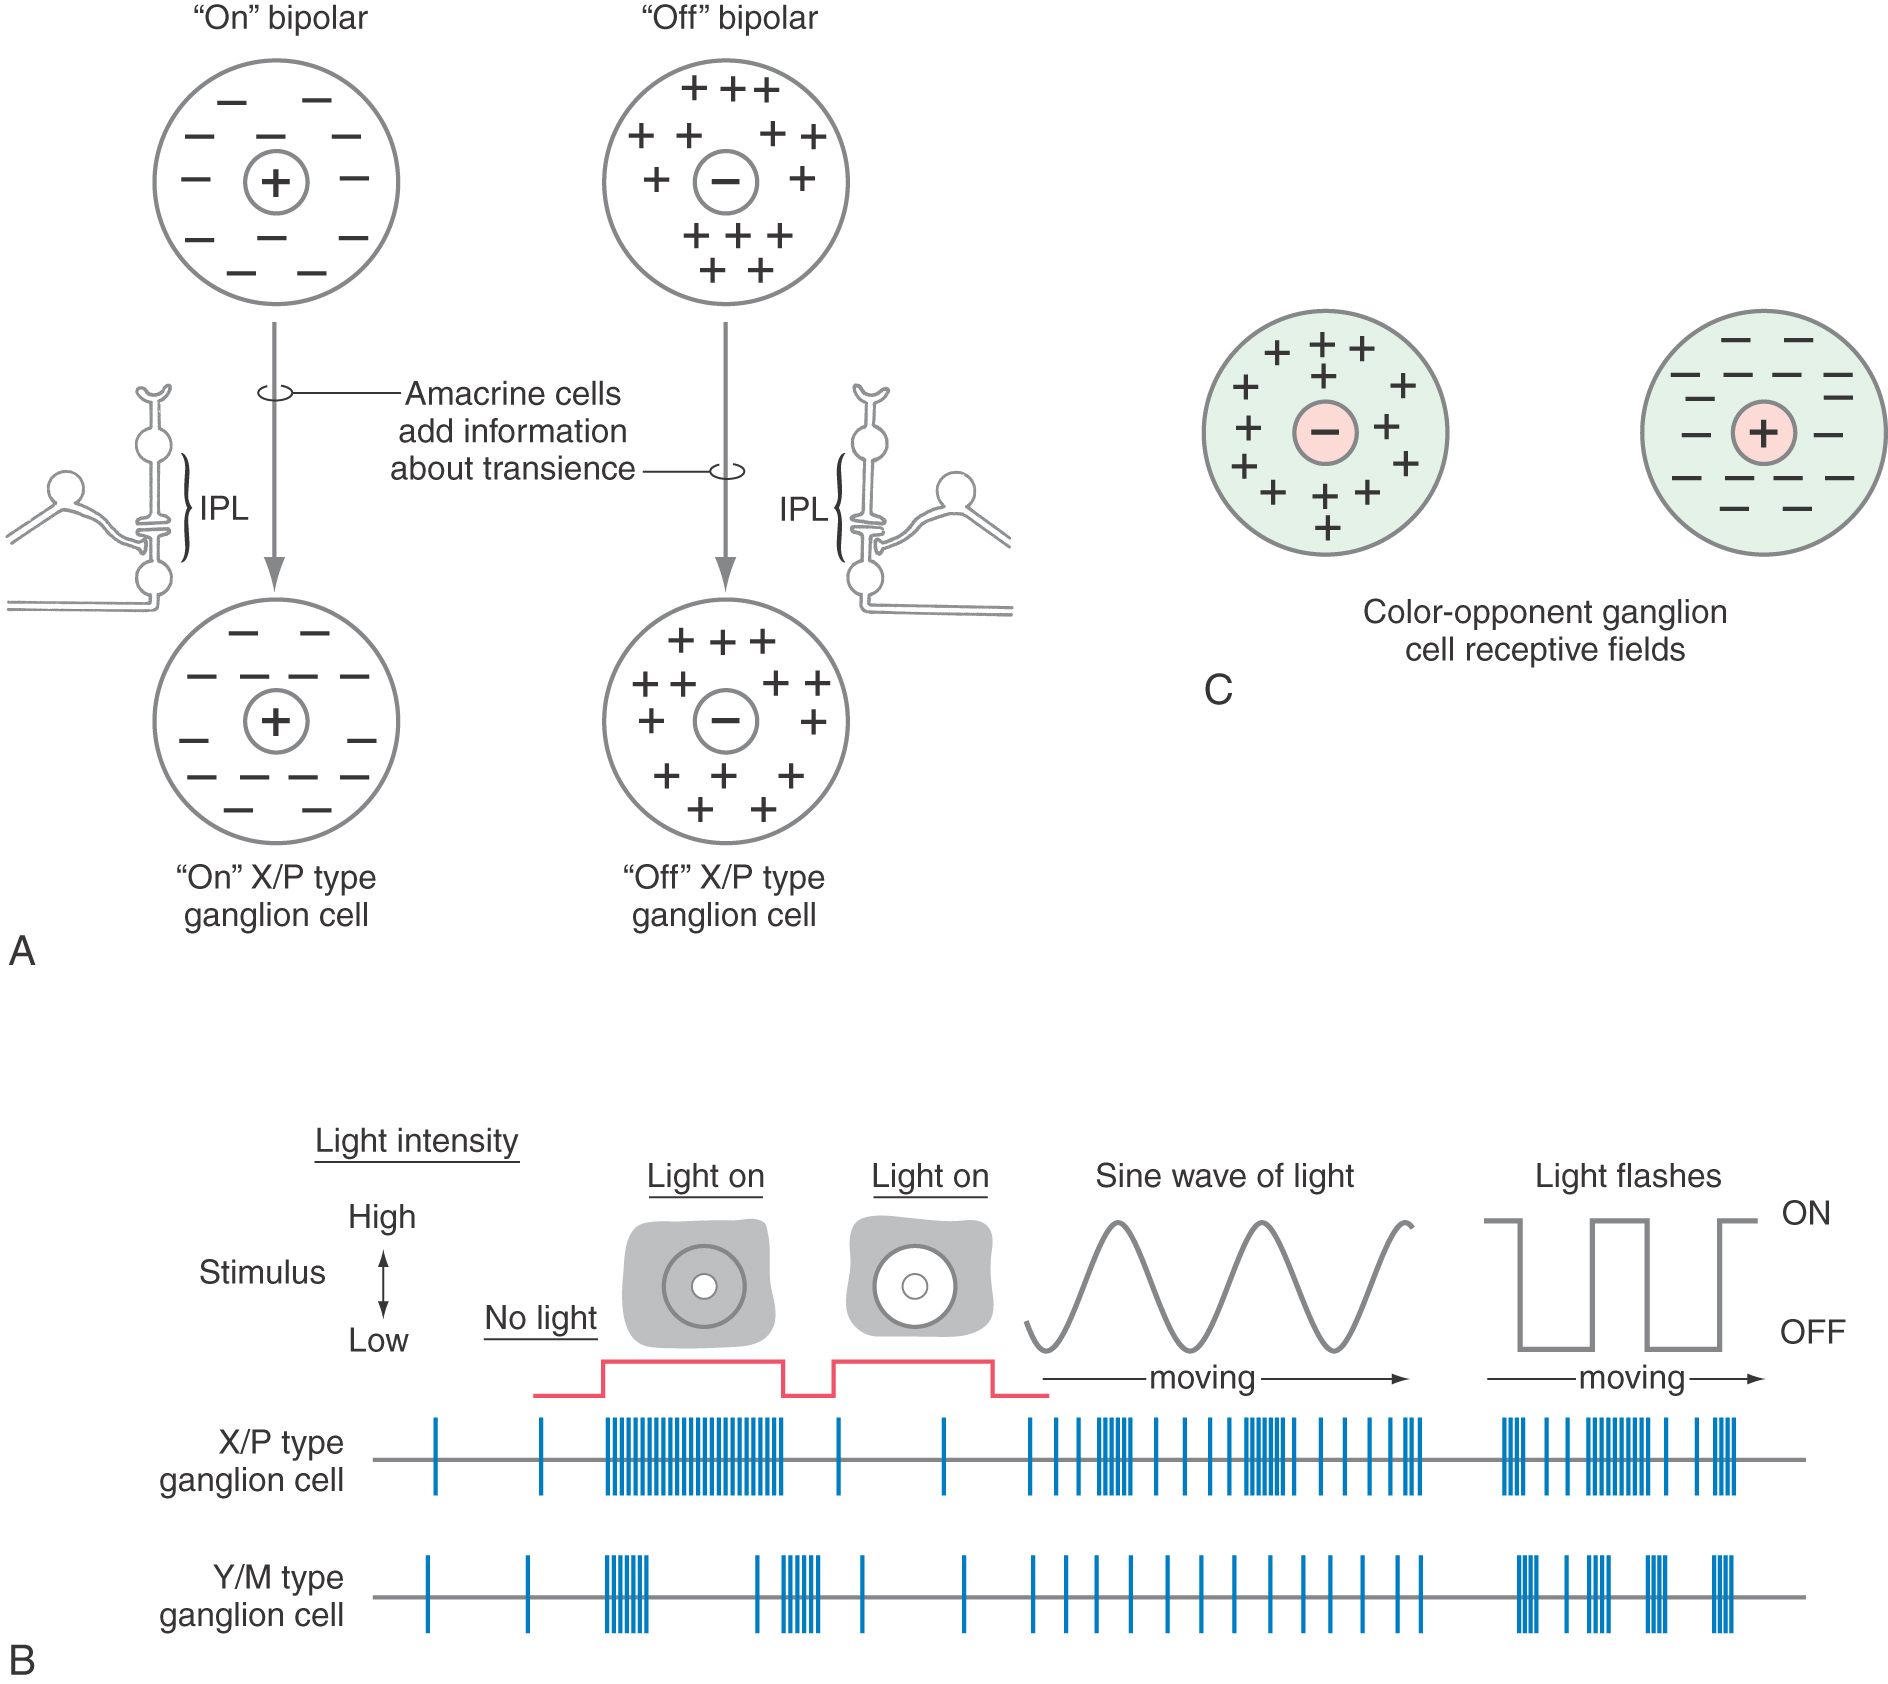
Like horizontal cells, amacrine cells also have dendrites that extend over long distances, sampling and modifying bipolar cell output. Amacrine cells modify the input of groups of bipolar cells onto Y class ganglion cells in a way that makes the Y class of ganglion cells exquisitely sensitive to moving visual stimuli.
Ganglion Cells
There are two types of ganglion cells in the human retina. The first type, comprising more than 99% of all ganglion cells, is concerned with details of image formation and receive input from rods and cones via synaptic relays through the layers of the retina. These cells are further characterized by their involvement in circadian rhythms and the pupillary light reflex. The second type, comprising less than 1% of all ganglion cells, are melanopsin-containing ganglion cells. These particular cells are characterized by the large size of their cell bodies and expansive overlapping dendritic fields, their presence in the ganglion cell layer with some cells found in the inner nuclear layer, their particular sensitivity to blue light (in the general range of 480 nm), their lack of participation in the details of image formation, and their connections to the suprachiasmatic and pretectal nuclei.
A particularly important characteristic is the fact that these melanopsin ganglion cells are intrinsically sensitive to light; they will generate action potentials in response to light shined in the eye in the absence of any input originating from rods and cones. A patient with advanced retinitis pigmentosa, or other conditions that may damage the layers of rods and cones, will not see a light shined in the eye (blind in that eye) but may have a pupillary reflex in that (the blind) eye. Although the patient is blind, that individual may have intact pupillary light reflexes (the speed of the reflex may be slightly slower than that in a normal person) and will have normal circadian rhythms because of the projections of these melanopsin ganglion cells to the hypothalamus. However, these patients will not “see” because melanopsin cells are basically not involved in image formation; these cells may also be considered a third type of photoreceptor because of their sensitivity to light.
Ganglion cells are the output cells of the retina (Fig. 20-2). Their somata form the ganglion cell layer, and their axons converge on the optic disc and form the optic nerve. Ganglion cells are grouped in two ways: by size and by physiologic role. These classifications largely coincide. Like bipolar cells, ganglion cells have center-surround types of receptive fields.
One class of retinal ganglion cells is characterized by large cell bodies and widely branching dendritic fields. These cells are classified as alpha cells, are found predominantly in the peripheral retina, and receive input mainly from rods. They have more extensive dendritic trees and thicker axons than those of other ganglion cell types. Physiologically, alpha cells correspond to the cell type called Y cells. They participate little in color perception, in line with their largely rod input, and they show the on or off center-surround patterns of the bipolar cells with which they connect. These cells are also called M cells because in humans and other primates, they consistently connect to other large cells in the magnocellular layers in the lateral geniculate nucleus (see Fig. 20-17). A minority of the population of large ganglion cells are those containing melanopsin. These cells are not involved in image formation but do participate in the maintenance of biologic (circadian) rhythms and are an important source of input to the pupillary light pathway.
A second class of retinal ganglion cells, beta cells, have medium-sized cell bodies and more restricted dendritic fields. Beta cells are found predominantly in the central retina and receive input mainly from cones. They correspond to the physiologic class of X cells. In keeping with their central location and small dendritic arbors, they have small receptive fields. They are responsive to color stimuli, and this fact gives the center-surround organization a new twist. The center responds to one color, and the surround responds maximally to the color opposite it on a color wheel (Fig. 20-8C). For example, an X cell may have a yellow-responsive center and a blue-responsive surround. Still, the on center and off center categories remain. These cells are also called P cells because in humans and other primates, they consistently connect to other, smaller cells in the parvocellular layers in the lateral geniculate nucleus.
All ganglion cells left out of the preceding two categories are classified anatomically as gamma, delta, and epsilon cells and physiologically as W cells. These cells tend to have smaller cell bodies and axons, and they show a variety of receptive field sizes and physiologic responses.
RETINAL PROJECTIONS
Retinal ganglion cells send axons to a variety of locations in the diencephalon and midbrain. Among the targets are the suprachiasmatic nucleus, a hypothalamic region that controls diurnal rhythms (see Chapter 30); the accessory optic and olivary pretectal nuclei, which subserve the pupillary light reflex (see Chapter 28); and the superior colliculus, which helps control eye movements (see Chapter 28) and mediates so-called visual reflexes. The superior colliculus, in turn, projects to the pulvinar, the largest nucleus of the thalamus. The pulvinar receives input from the superior colliculus, pretectum, and visual cortex (see later) and sends information to visual association areas. This brief overview illustrates the point that the visual system influences a wide range of areas of the brain.
Lesions of the retina or to the optic nerve result in visual deficits characteristic of their location. Scotoma may be manifested as a randomly shaped region in one or both visual fields in which vision is either lost or significantly reduced. A scotoma may be symmetric or asymmetric and unilateral or bilateral; it may be manifested in a wide variety of shapes (annular, ring, sickle) and locations (central, peripheral, paracentral) within the retina. Causes of scotoma are varied and include exposure to toxins, retinal hemorrhage, trauma, and tumors that impinge on the eyeball. The most common deficits related to damage to the optic nerve are partial or complete blindness in that eye and the potential loss of the direct and consensual pupillary light reflex when light is shined in that eye. The blind eye will have a consensual response when a light is shined in the opposite eye because the efferent limb of the reflex is intact in the blind eye.
Retinogeniculate Projections
Most retinal ganglion cells send their axons to the lateral geniculate nucleus by way of the optic nerve, chiasm, and tract. This connection is called the retinogeniculate projection or optic radiations (Fig. 20-9). A commonly used alternative term for this pathway is the geniculocalcarine radiations. In this pathway, an orderly map of visual space must be maintained. The receptive fields of photoreceptors (and of the ganglion cells to which they are connected) lie in a precise arrangement on the retinal surface. Adjacent points in the visual world are perceived by adjacent ganglion cells. This orderly representation of the visual world on the retina is called a retinotopic map.
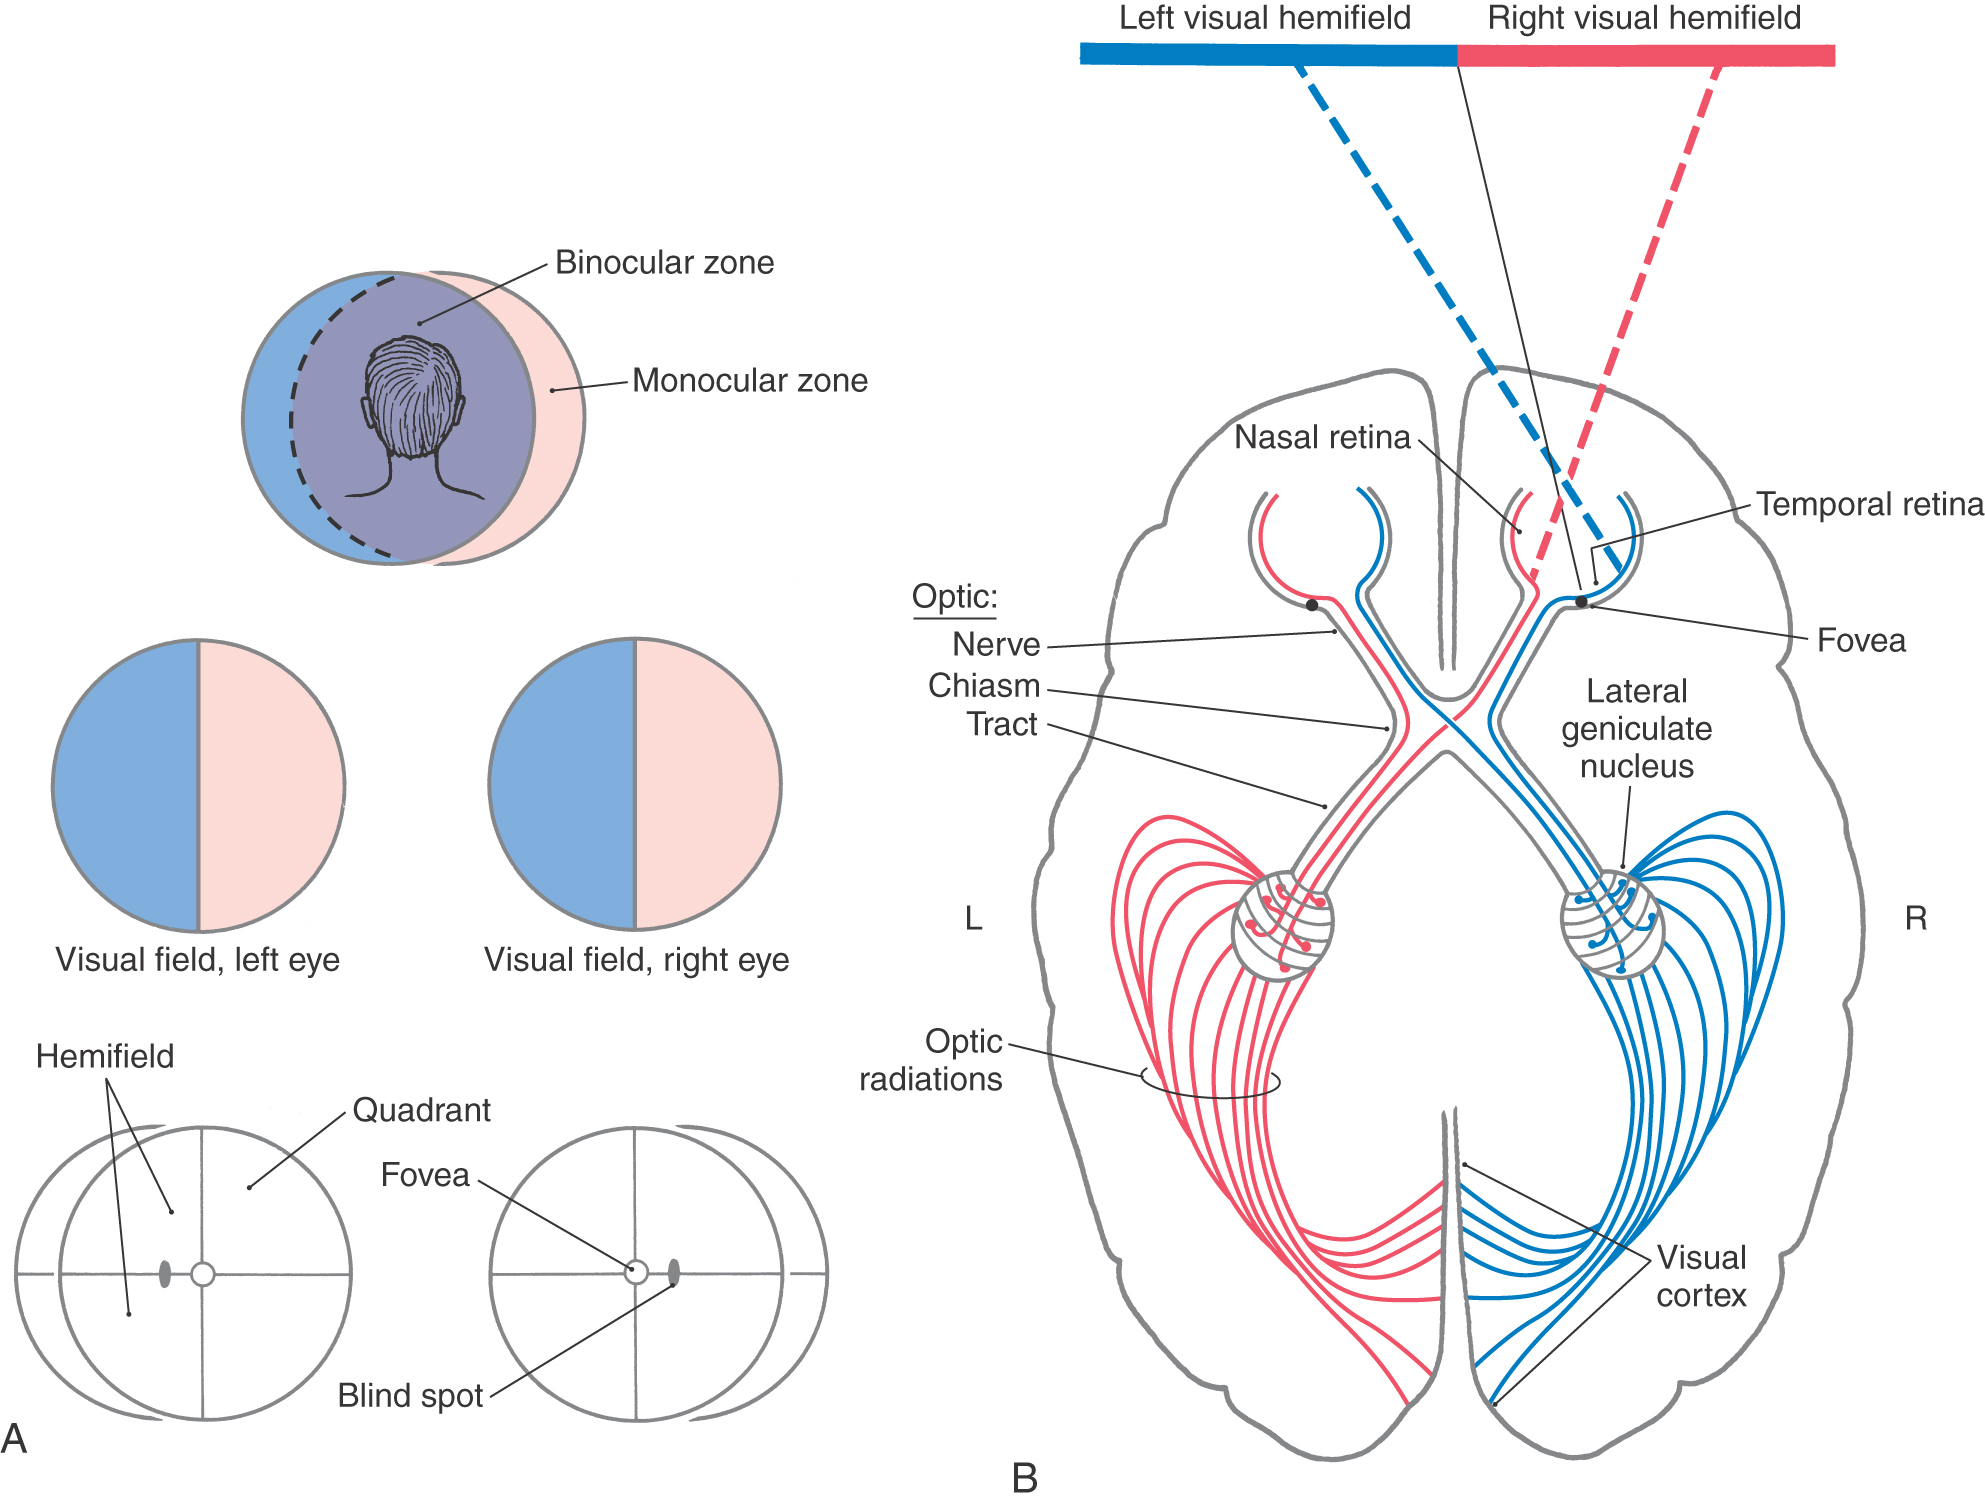
Figure 20-9. Overview of the visual fields (A) and of the visual pathway as viewed from above (B).
The visual field is the part of the world seen by the patient with both eyes open and looking straight ahead (Fig. 20-9A). It consists of a binocular zone—a broad central region seen by both eyes—and right and left monocular zones (or monocular crescents) seen only by the corresponding eye. In the clinical setting, it is common to test the visual function of the two eyes separately by covering first one eye and then the other (see Chapter 33). Consequently, visual field deficits are commonly illustrated as losses from the visual field of each eye (see, for example, Figs. 20-14 and 20-15). Each visual field is divided into nasal and temporal halves (hemifields), and each of these halves is divided into upper and lower parts (resulting in quadrants) (Fig. 20-9A).
A stream of photons can be thought of as a ray of light that enters the eye. The light ray is bent (refracted) by the cornea and lens so that the image is focused on the retina. The image is inverted and reversed by the lens. Light from the inferior visual world strikes the superior retina. Light from the right visual world (in the binocular zone) strikes the temporal retina of the left eye and the nasal retina of the right eye (Fig. 20-9). These patterns are essential to understanding normal vision and the defects in visual fields seen in patients with lesions in the visual pathways. The retinotopic map is maintained throughout the visual system.
Optic Nerve, Chiasm, and Tract
Axons of retinal ganglion cells conveying input from all areas of the retina converge at the optic disc, where they penetrate the choroid and sclera to form the optic nerve. Within the nerve fiber layer of the retina, ganglion cell axons are unmyelinated. However, as they pass through the sclera, they become ensheathed with myelin formed by oligodendrocytes. Because there are no photoreceptor cells in the optic disc (only ganglion cell axons), light striking this area is not perceived. Consequently, this part of the retina is commonly called the blind spot (Fig. 20-10A, B). Visual acuity is greatest at the fovea, but the peripheral retina has little form vision; fine details cannot be perceived in the peripheral retina because the “pixel density” (density of rod photoreceptors) is much lower.
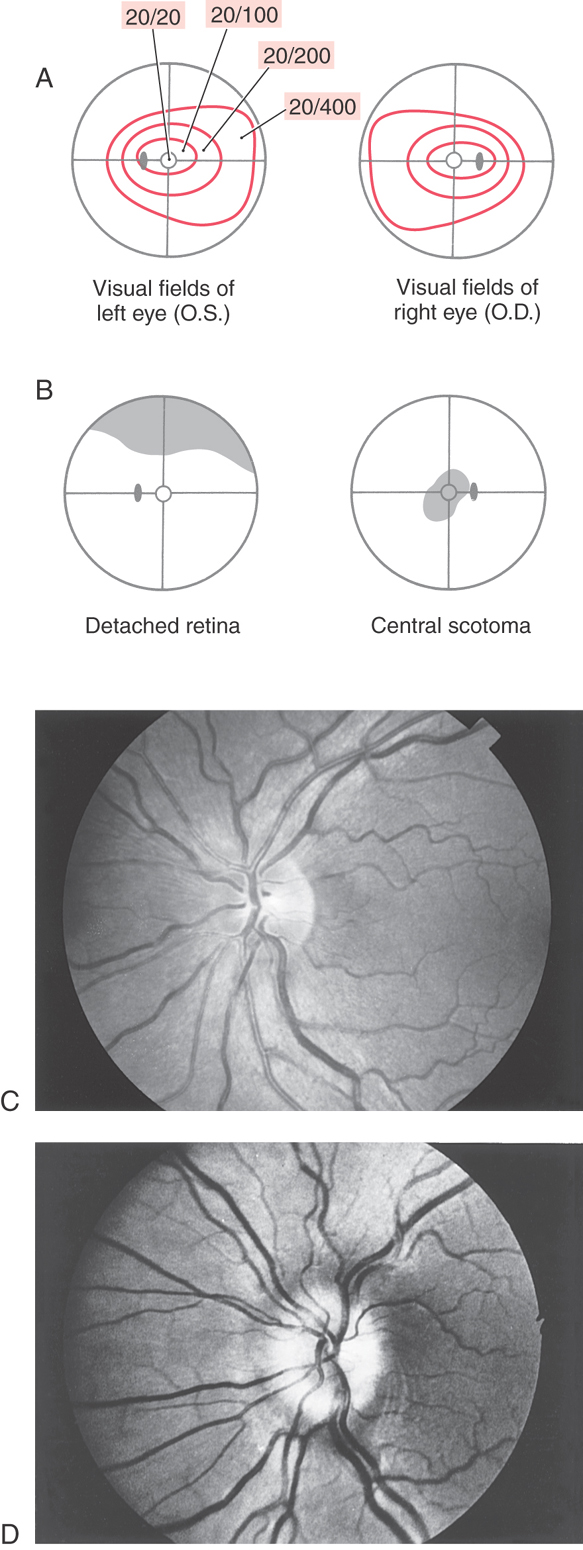
The optic nerve extends from the caudal aspect of the eye to the optic chiasm (Fig. 20-9). This nerve is enclosed in a sleeve of dura and arachnoid mater that is continuous with the same layers around the brain. Thus the subarachnoid space extends along the optic nerve, which is bathed in cerebrospinal fluid. For this reason, increases in intracranial pressure may be transmitted along the optic nerves and can cause blockage of axoplasmic flow at the optic nerve head. This axoplasmic stasis results in swelling of the optic nerve head (papilledema) (Fig. 20-10D). The damage to the optic nerve may result in partial or complete loss of vision in that eye (similar to Fig. 20-15).
Terminal branches of the central retinal artery, a branch of the ophthalmic artery, issue from the optic disc and radiate over the retina. Examination of these vessels through an ophthalmoscope can help assess the health of the eye and the central nervous system (Fig. 20-10C, D). Changes in the configuration of the retinal vessels or in the size or shape of the optic disc may indicate diseases of the retina, the vascular system, or the central nervous system.
Just rostral to the pituitary stalk, the optic nerves come together to form the optic chiasm, from which the optic tracts diverge as they pass caudally. In the chiasm, the fibers from the nasal half of each retina (corresponding to the temporal hemifields) cross to enter the contralateral optic tract, whereas the fibers from the temporal half of each retina (corresponding to the nasal hemifields) remain on the same side and enter the ipsilateral optic tract. In this way, each half of the brain receives the fibers corresponding to the contralateral half of the visual world (Figs. 20-9, 20-11, and 20-12).
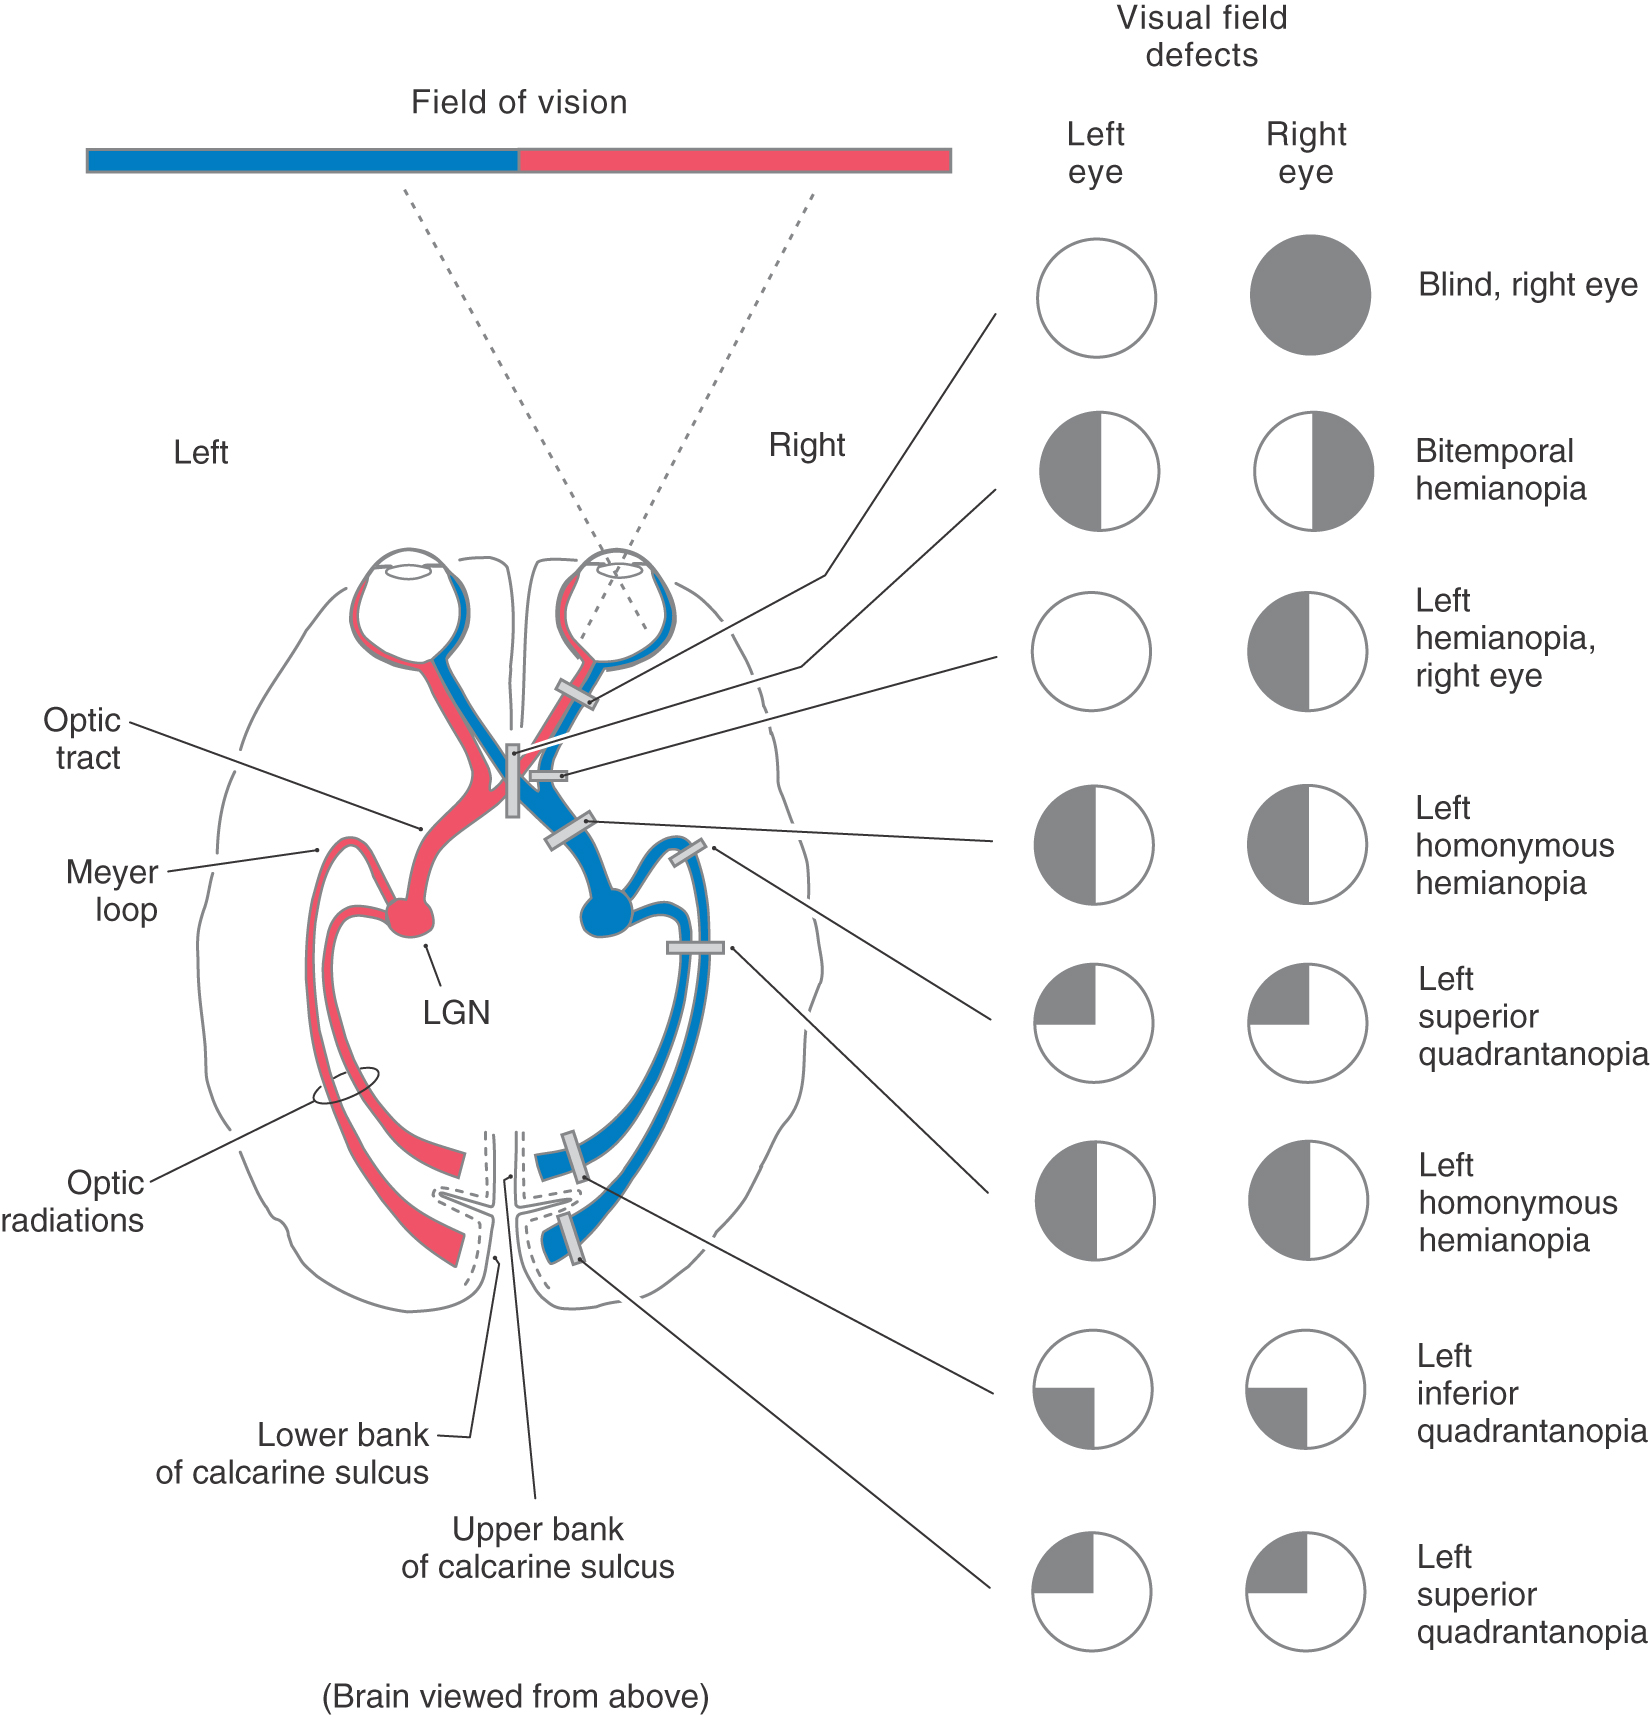
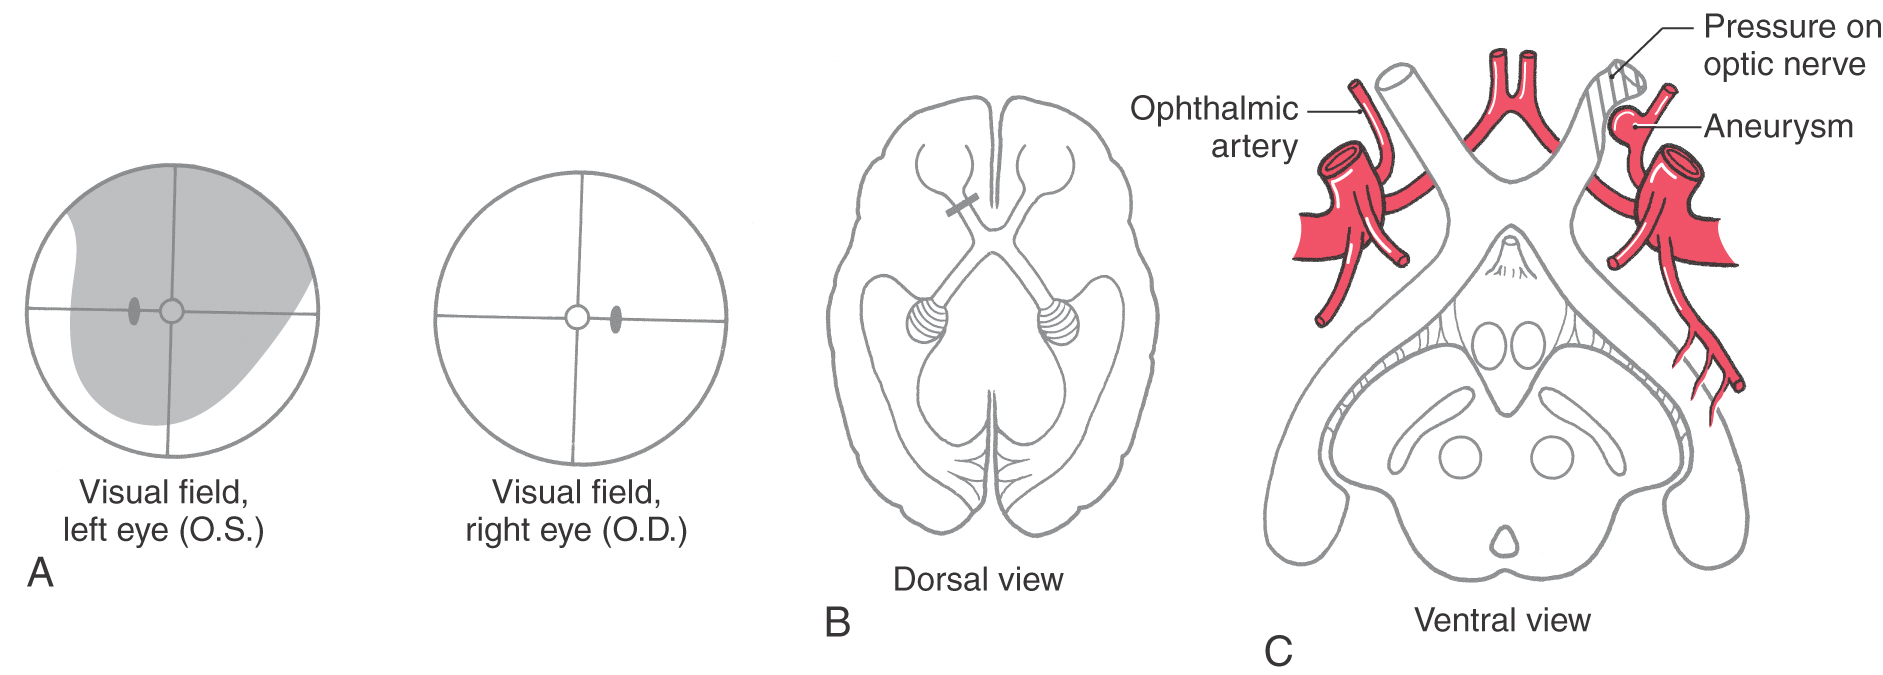
Figure 20-11. Visual field defects produced by lesions at different places in the visual pathway. Visual fields are diagrammed as described in Figure 20-9. Regions of normal vision are indicated in white; regions of loss of vision are indicated in black. LGN, lateral geniculate nucleus.
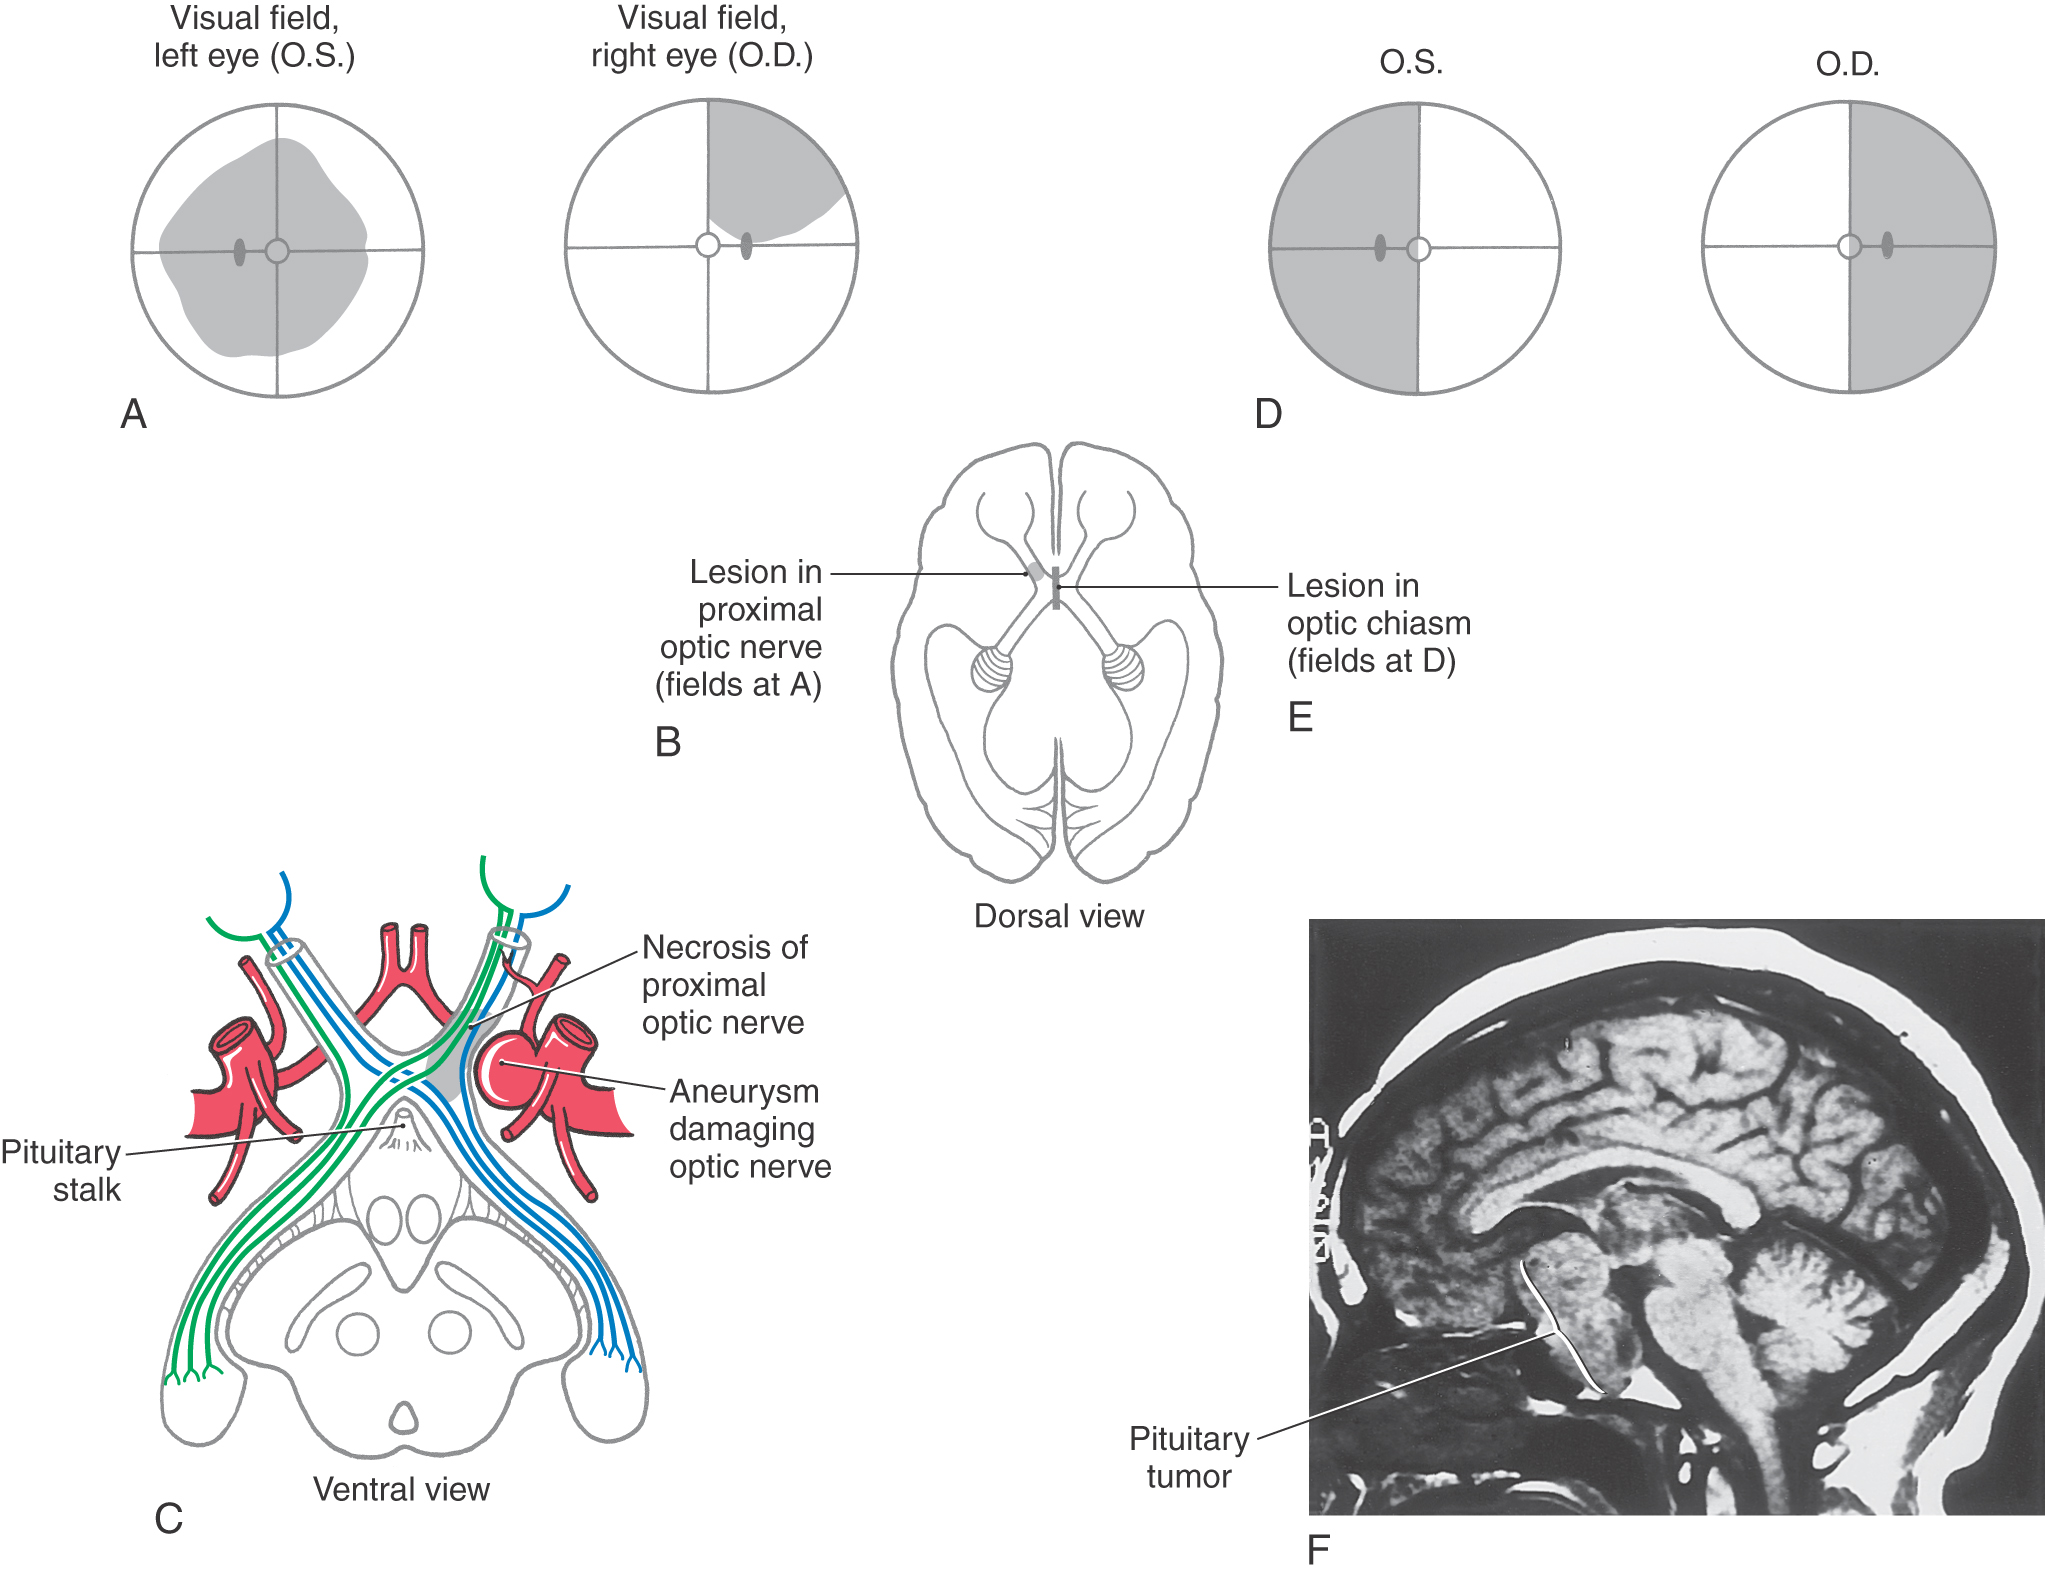
Although many clinical events can affect the optic chiasm, this structure is especially susceptible to tumors of the pituitary gland. Enlarging pituitary tumors that damage the crossing fibers in the midline of the chiasm will interrupt visual input from the temporal halves of both visual fields, resulting in a bitemporal hemianopia (Figs. 20-11 and 20-12D-F). A lesion that damages the lateral part of the chiasm may interrupt only fibers conveying information from the nasal visual field on the same side, although in practice this situation is rare. This deficit is called an ipsilateral (right or left) nasal hemianopia.
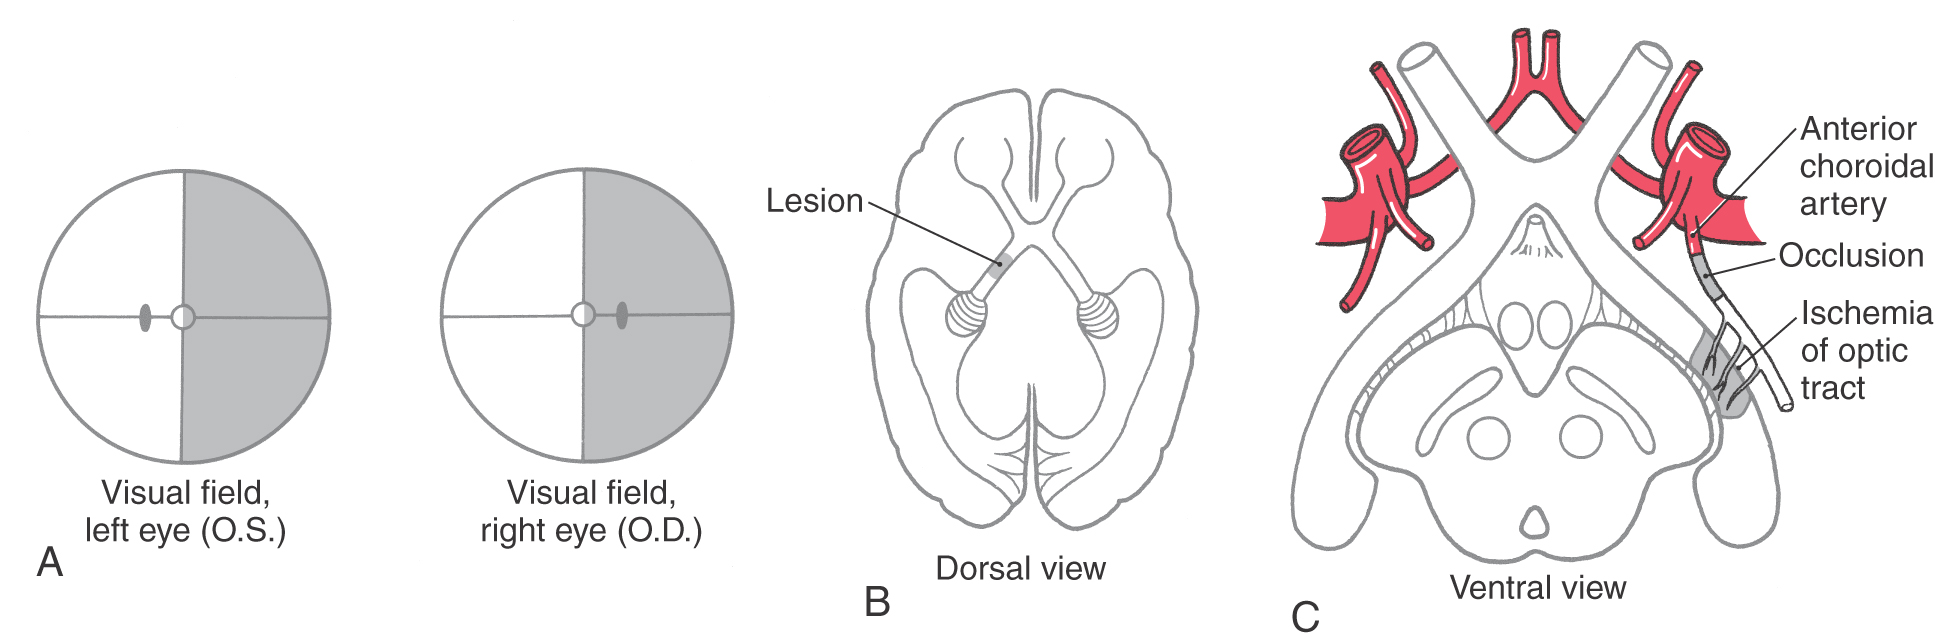
Extending caudolaterally from the chiasm, the axons of retinal ganglion cells continue as a compact bundle, the optic tract. This structure courses over the surface of the crus cerebri at its junction with the hemisphere and ends in the lateral geniculate nucleus of the diencephalon (see Fig. 15-5). Because the optic tract contains fibers conveying visual input from the ipsilateral nasal hemifield and the contralateral temporal hemifield, lesions of the optic tract result in a contralateral (either right or left) homonymous hemianopia (Fig. 20-11; see also Fig. 20-16).
The optic chiasm receives blood from the small anteromedial branches of the anterior communicating artery and A1 segment of the anterior cerebral artery. The optic nerve receives its blood supply from small branches of the ophthalmic artery traveling parallel to the nerve. As noted previously, the optic nerve head and retina are supplied by the central artery of the retina. The optic tract receives its main blood supply from the anterior choroidal artery (see Fig. 15-16 and Fig. 15-18), whereas the lateral geniculate nucleus is in the domain of the thalamogeniculate artery, a branch of the posterior cerebral artery.
VISUAL FIELDS CORRELATED WITH VISUAL STRUCTURES AS SEEN IN MAGNETIC RESONANCE IMAGING
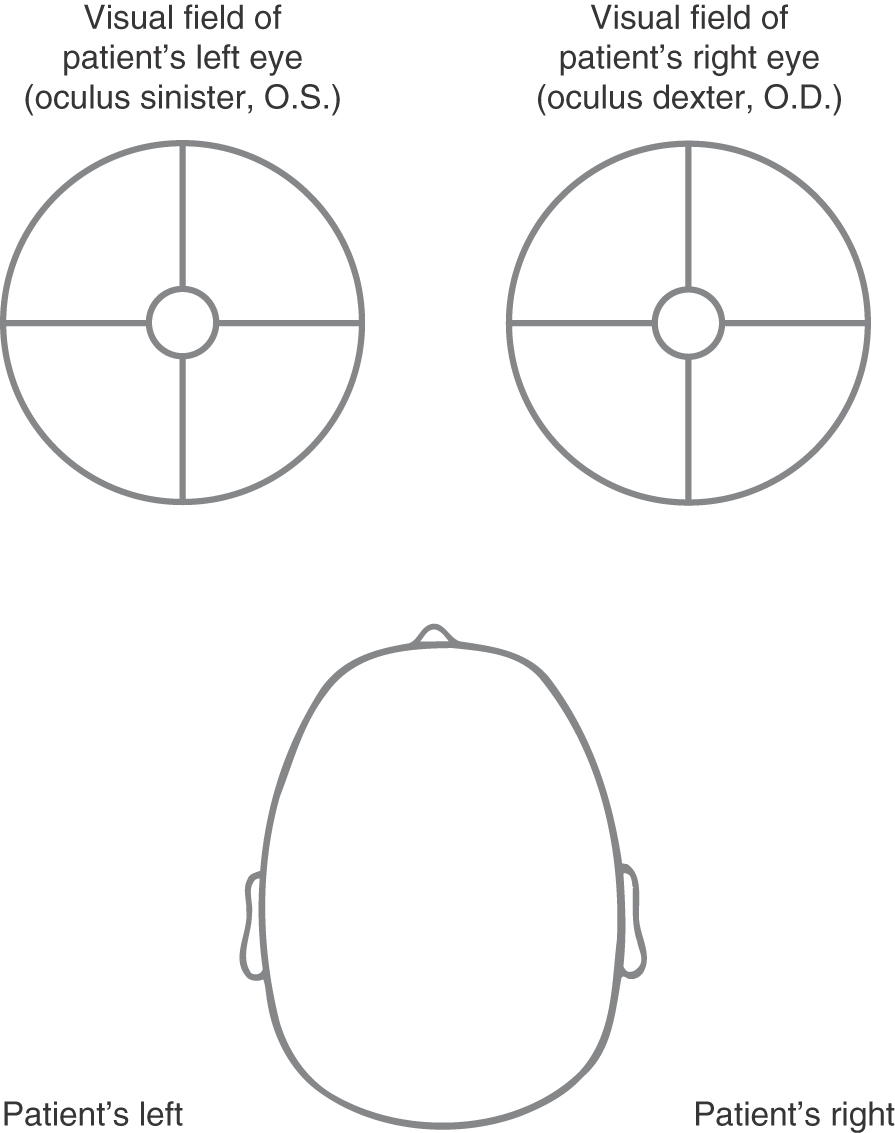
The convention for describing and illustrating visual fields was established long before the advent of magnetic resonance imaging (MRI) or computed tomography (CT) and continues long after this imaging technology has become commonplace. This convention dictates that visual fields are shown as the patient would see the environment (Fig. 20-13). This is also as the examiner sees his or her environment. In this format, the visual field of the patient’s right eye (oculus dexter, O.D.) is on the right and the visual field of the patient’s left eye (oculus sinister, O.S.) is on the left.
Early in the development of MRI and CT technology, it became the standard to view axial images as if the observer were standing at the patient’s feet looking toward the head and to view coronal images as if standing in front of the patient looking at his or her face (Fig. 20-14; see also Chapter 1). In both axial and coronal images, the left side of the patient is on the observer’s right and the right side of the patient is on the observer’s left (Fig. 20-14). Understanding of this relationship between the observer (the physician) and the patient is absolutely essential to the successful diagnosis and treatment of the neurologically compromised patient. This applies to all aspects of the clinical neurosciences, not only to just the visual system.
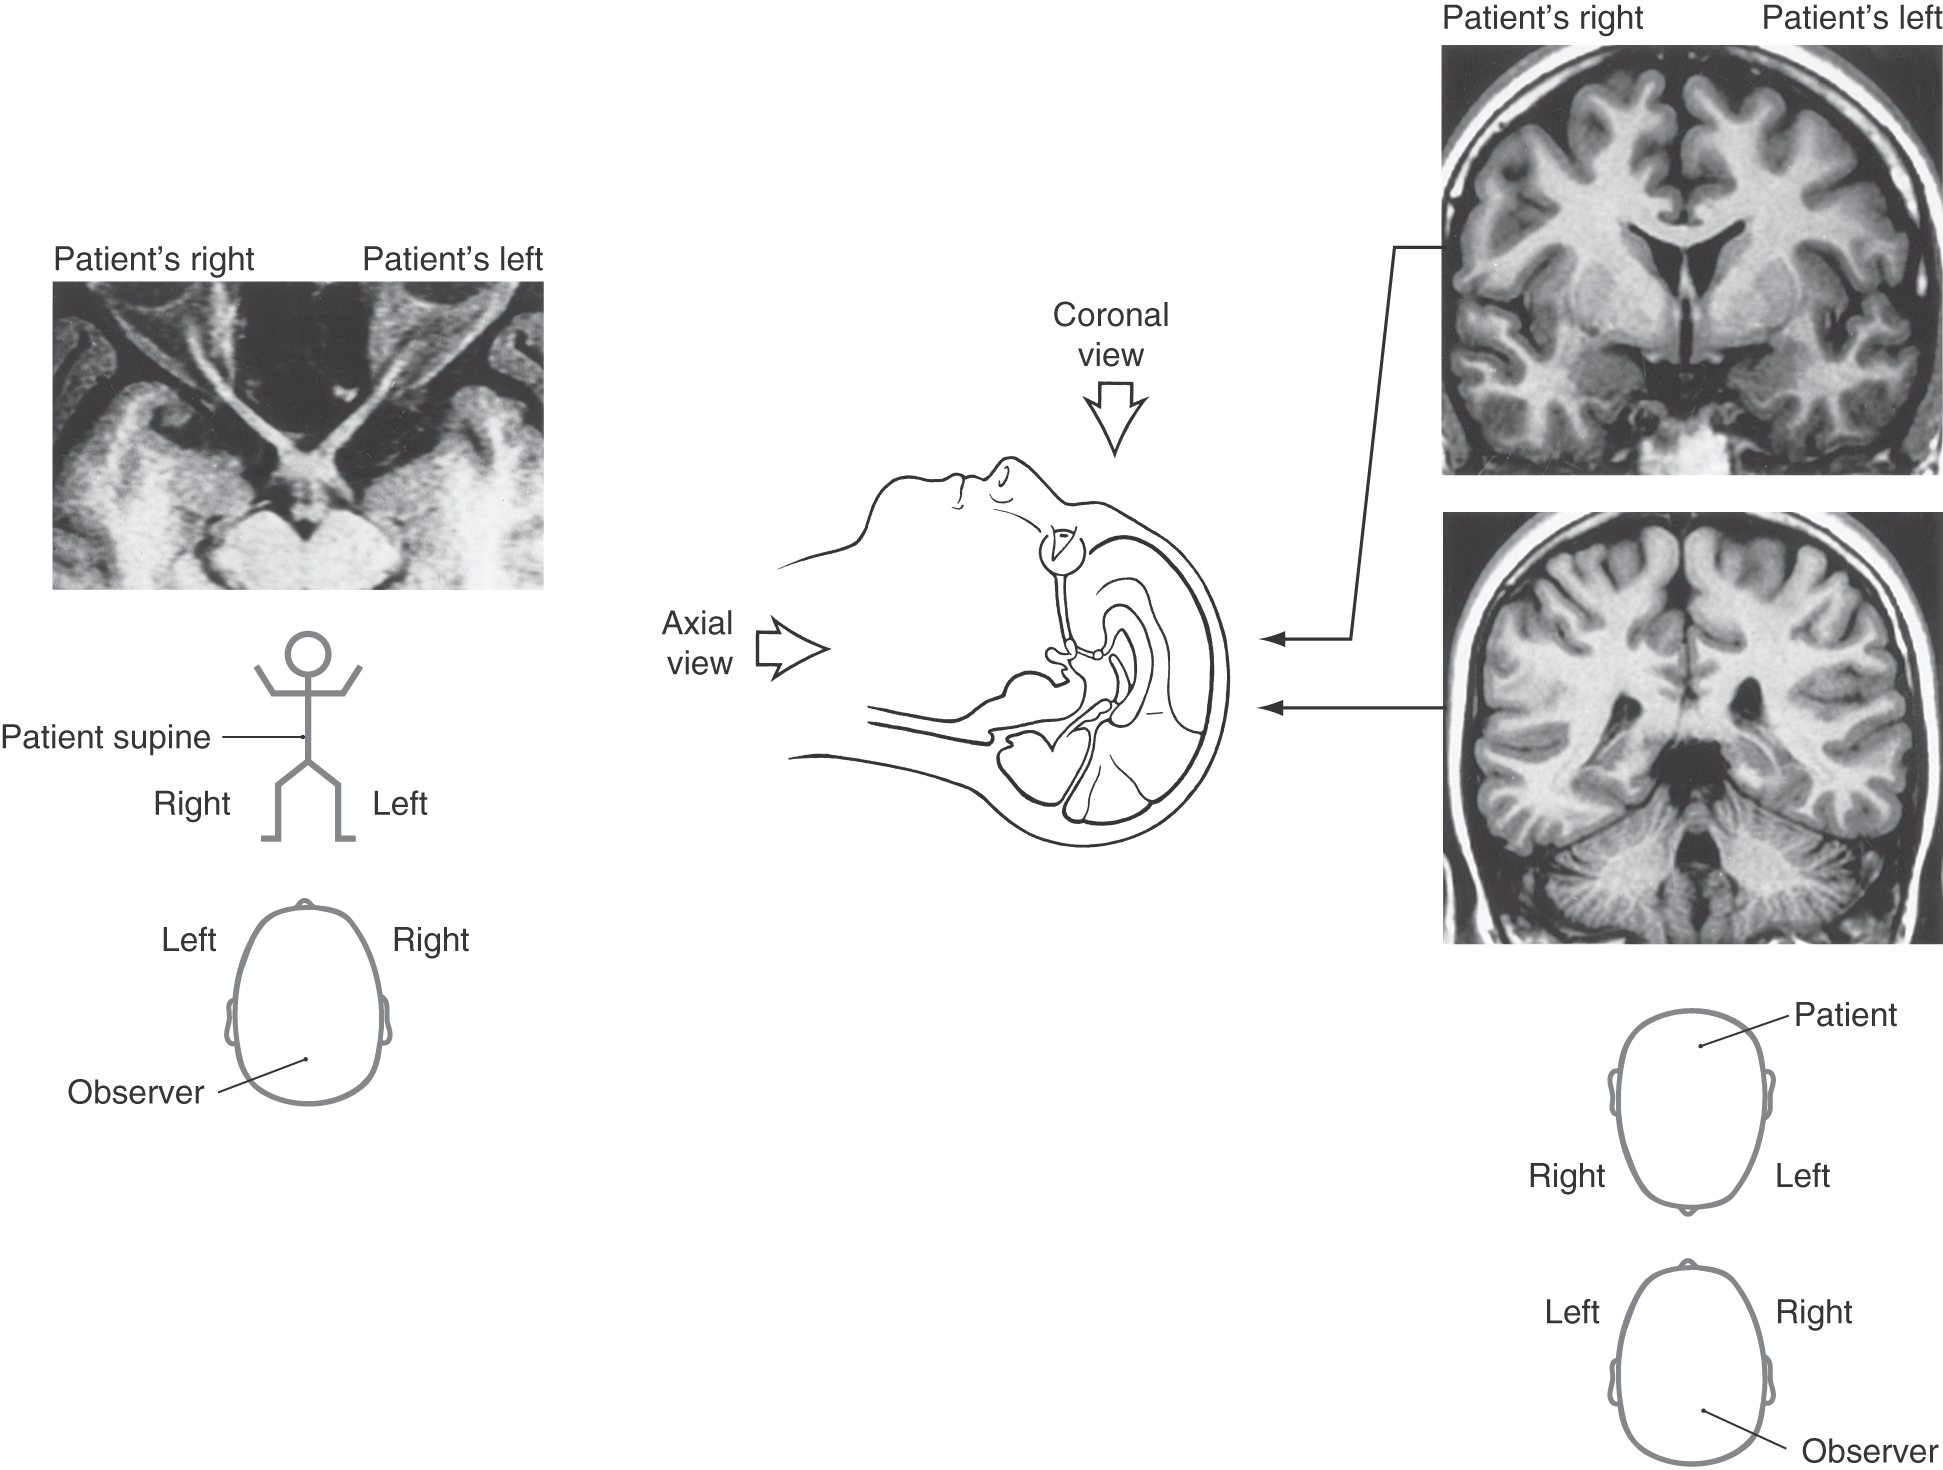
With this in mind, it is not difficult to make the correlation between a visual field deficit and the location of a central lesion as seen in MRI or CT. Just remember, when looking at a representation of the patient’s visual field, you see what the patient sees; the patient’s right visual field is on the physician’s right and the patient’s left visual field is on the physician’s left (Fig. 20-13). When looking at a lesion of a visual structure in MRI, the physician is looking at the patient’s face or feet; the patient’s right is on the physician’s left and the patient’s left is on the physician’s right (Fig. 20-14). As we will see later in this chapter, this correlates with the deficits seen after lesions at various points in the visual pathway. For example, a lesion of the right optic nerve (the left side of the magnetic resonance image as the physician looks at the image) will result in a complete loss of vision in the right eye (Figs. 20-11 and 20-15). On the other hand, a lesion of the left optic tract, which is caudal to the partial crossing of optic fibers in the optic chiasm, will result in a loss of vision in the right half of the visual field in each eye—a hemianopia (Figs. 20-11 and 20-16). The patterns of deficits after lesions at representative points in the visual pathway are explored in the following sections of this chapter.
LATERAL GENICULATE NUCLEUS
The lateral geniculate nucleus is located internal to an elevation on the caudoventral aspect of the diencephalon, the lateral geniculate body (Fig. 20-17). The human lateral geniculate nucleus consists of six cellular layers with thin sheets of myelinated fibers sandwiched between them. The ventral base of this nucleus is formed by the incoming optic tract fibers, whereas its dorsal and lateral borders are formed by the outgoing optic radiations. The cell layers are numbered 1 through 6 from ventral to dorsal. As explained in the next two sections, the layers can be grouped by both the type of ganglion cell input they receive and the side of the retina from which the input originates.
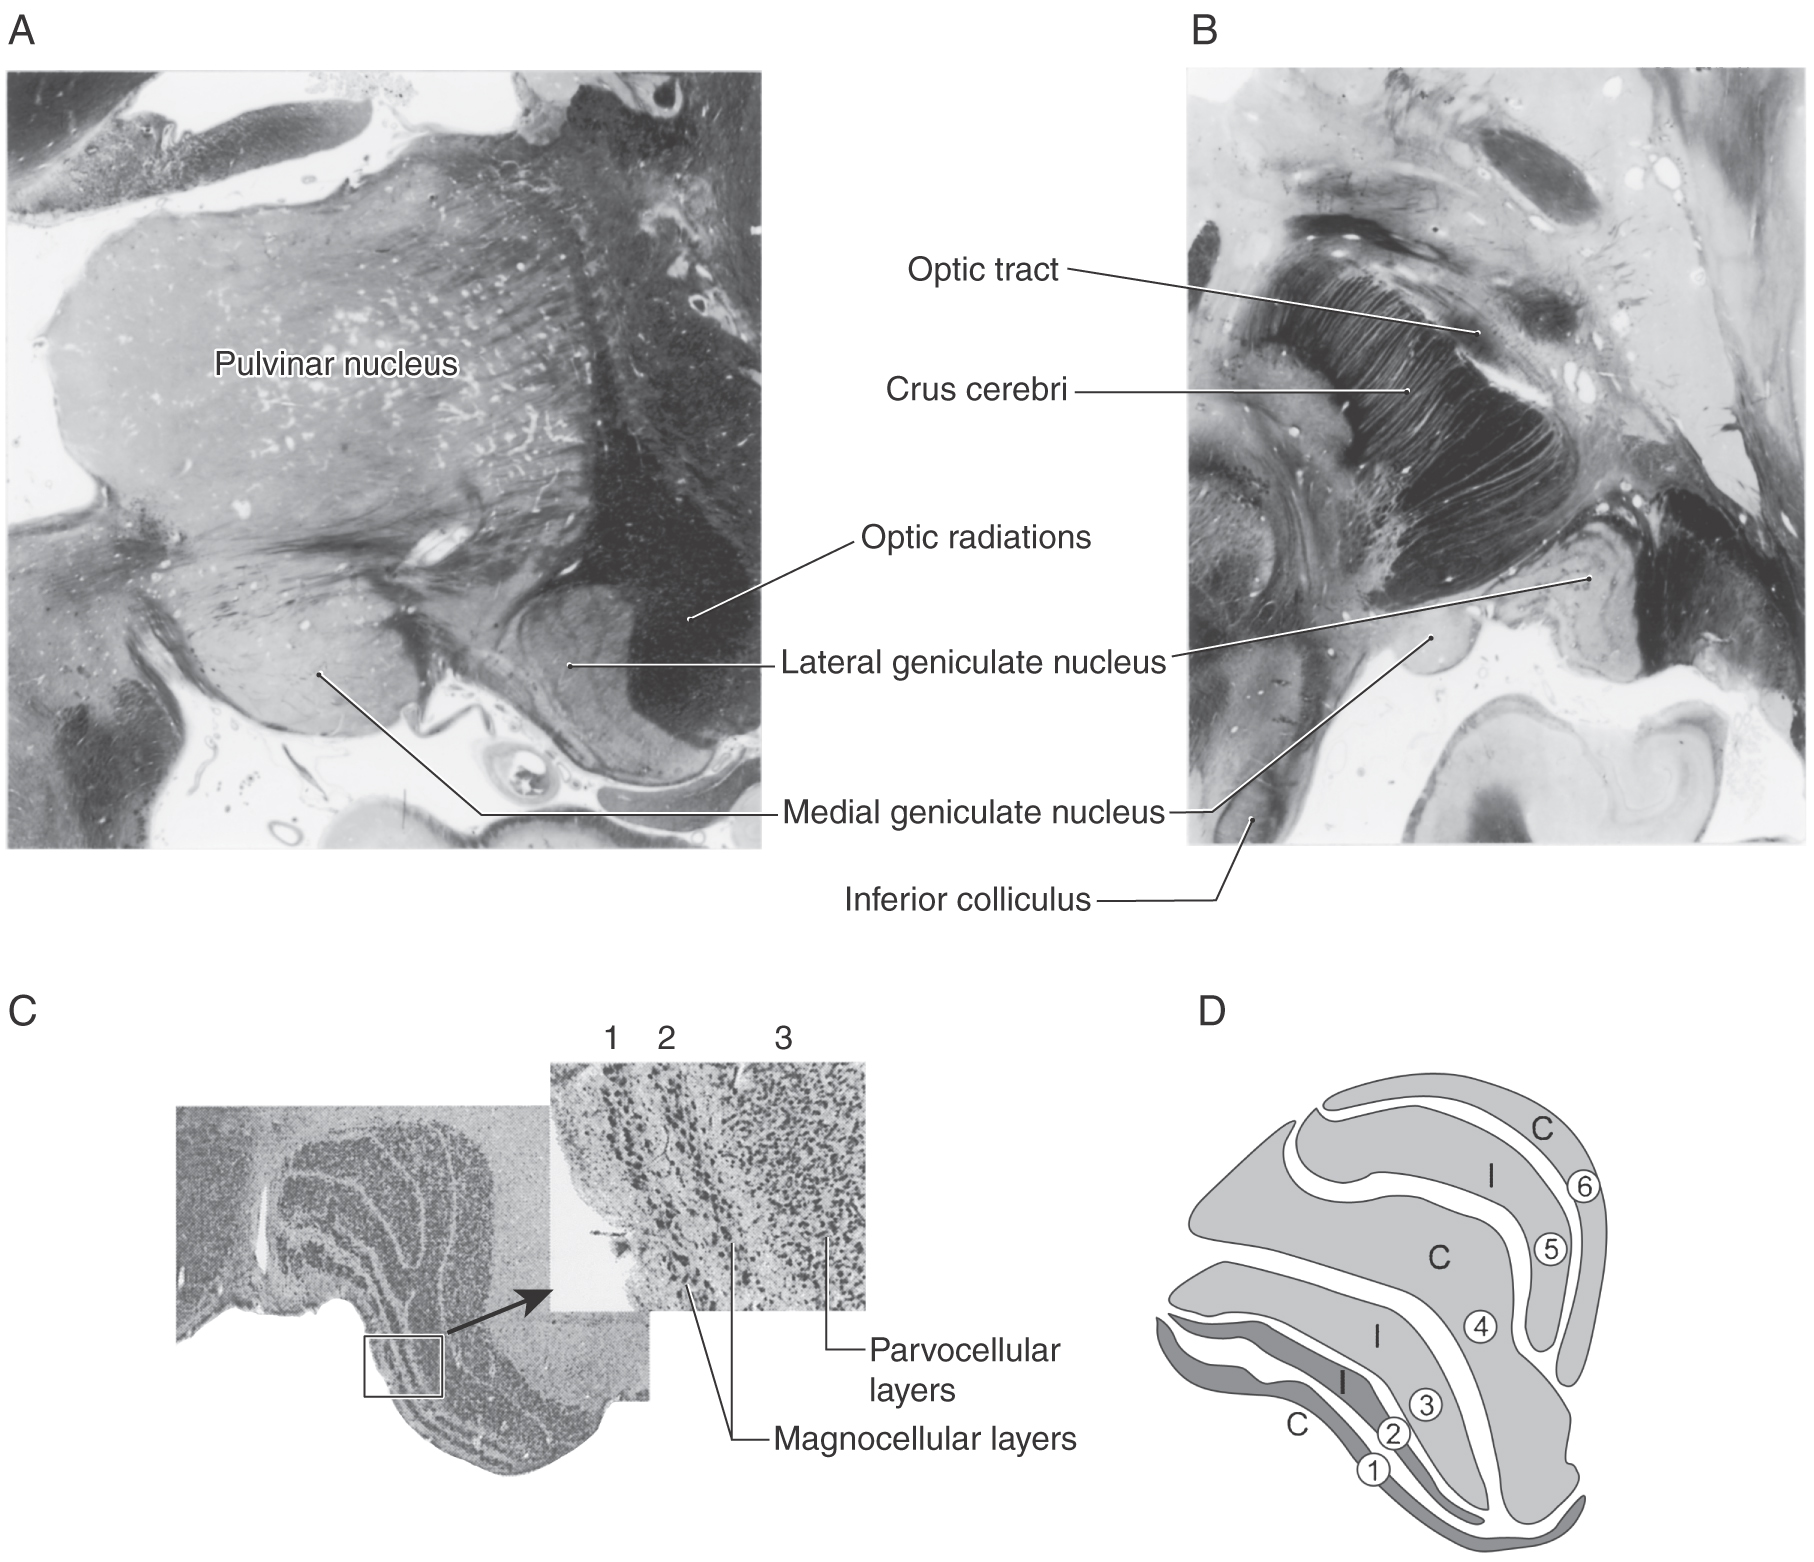
Magnocellular and Parvocellular Layers
Layers 1 and 2 of the lateral geniculate contain cells with large somata and are called the magnocellular (M) layers. Layers 3 through 6 contain small cells and are therefore termed the parvocellular (P) layers (Fig. 20-17C, D). The subdivision of the lateral geniculate into magnocellular and parvocellular layers correlates with the subdivision of the retinal ganglion cells into Y and X classes. The Y (or M) fibers terminate in the magnocellular layers (layers 1 and 2), whereas the X (or P) fibers terminate in the parvocellular layers (layers 3 through 6). Recall that the Y (M) ganglion cells receive their input mainly from rods, have larger receptive fields and thick, rapidly conducting axons, and are particularly sensitive to moving stimuli. The X (P) ganglion cells receive input mainly from cones, have small receptive fields and slower conducting axons, and are tonically responsive to stationary stimuli; they arise mainly in the central retina and are responsible for high-acuity color vision. The ganglion cells of the remaining, mixed W class (also known as K cells) terminate on small cells scattered between the main layers. Melanopsin-containing ganglion cells constitute a portion of the W (or K) cell class.
Ipsilateral and Contralateral Layers
The ganglion cell axons that arise in the temporal retina remain uncrossed as they pass through the chiasm and terminate in layers 2, 3, and 5 of the ipsilateral lateral geniculate nucleus. On the other hand, the axons that arise in the nasal retina cross in the chiasm and terminate in layers 1, 4, and 6 of the contralateral lateral geniculate (Fig. 20-9).
Ganglion cell axon terminals and relay cells on which they synapse are arranged so that the same point in visual space is represented six times, once for each layer of the lateral geniculate nucleus, and at the same medial-lateral point in each layer. The map progresses from the midline to the periphery in visual space as the layer runs from medial to lateral in the lateral geniculate nucleus. Layers also run rostral to caudal, representing the inferior-superior axis.
OPTIC RADIATIONS
Relay cells forming the layers of the lateral geniculate nucleus receive input from ganglion cells (as retinogeniculate fibers) and send their axons to the ipsilateral primary visual cortex as a large bundle of myelinated fibers, the optic radiations (Figs. 20-9, 20-18, and 20-19). The primary visual cortex (striate cortex) is located on the upper and lower banks of the calcarine sulcus. Consequently, the optic radiations are also called the geniculostriate or geniculocalcarine pathway.
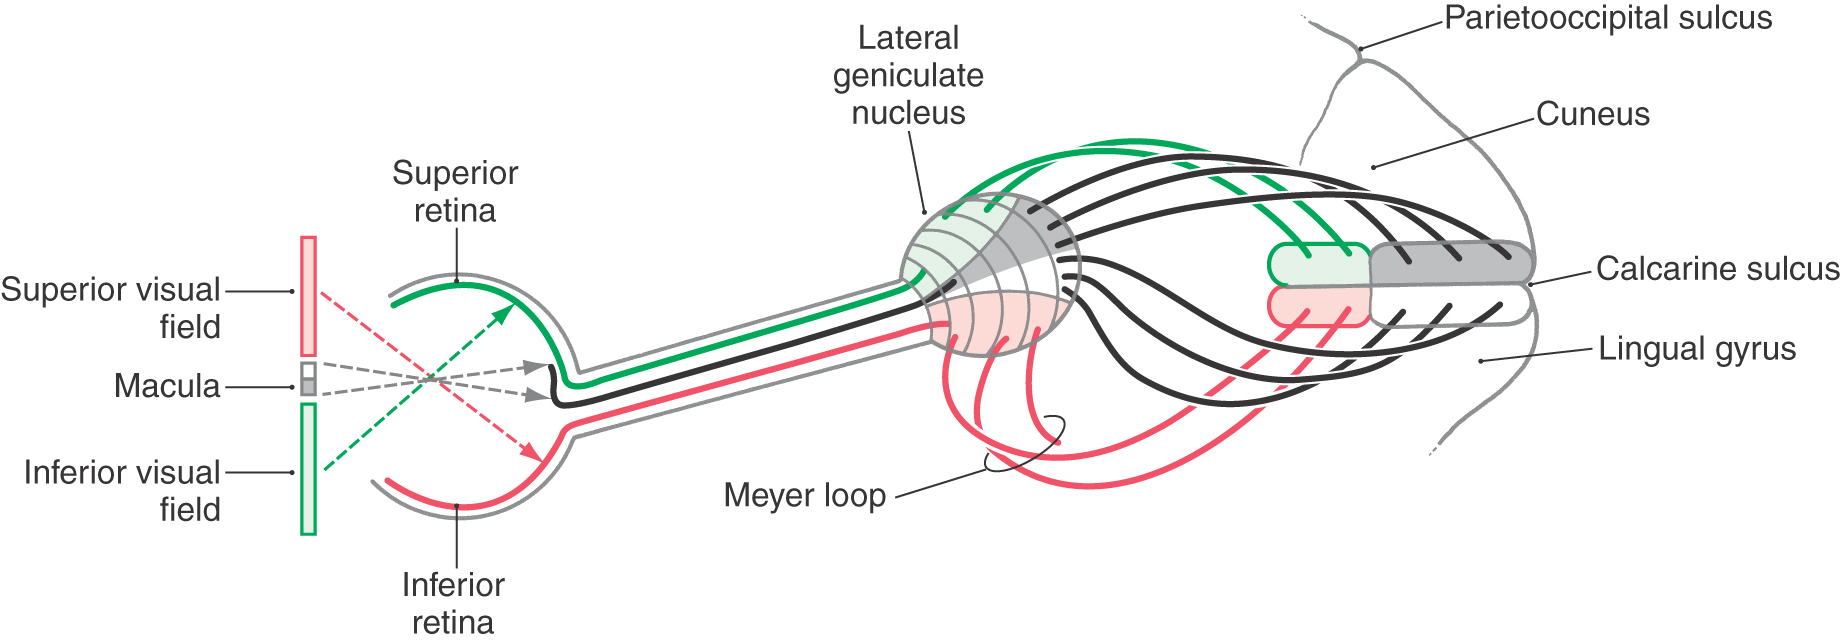
The optic radiations can be divided into two main bundles, one serving the lower and one serving the upper quadrant of the contralateral hemifields (Figs. 20-18 and 20-19). The fibers that carry visual information from the lower quadrant of the contralateral hemifields originate from the dorsomedial portion of the lateral geniculate nucleus, arch directly caudally to pass through the retrolenticular limb of the internal capsule, and synapse in the cortex of the superior bank of the calcarine sulcus, on the cuneus. Consequently, a lesion in the upper portion of the optic radiations results in a loss of vision in the contralateral inferior visual field, termed contralateral (right or left) inferior quadrantanopia (Fig. 20-11).
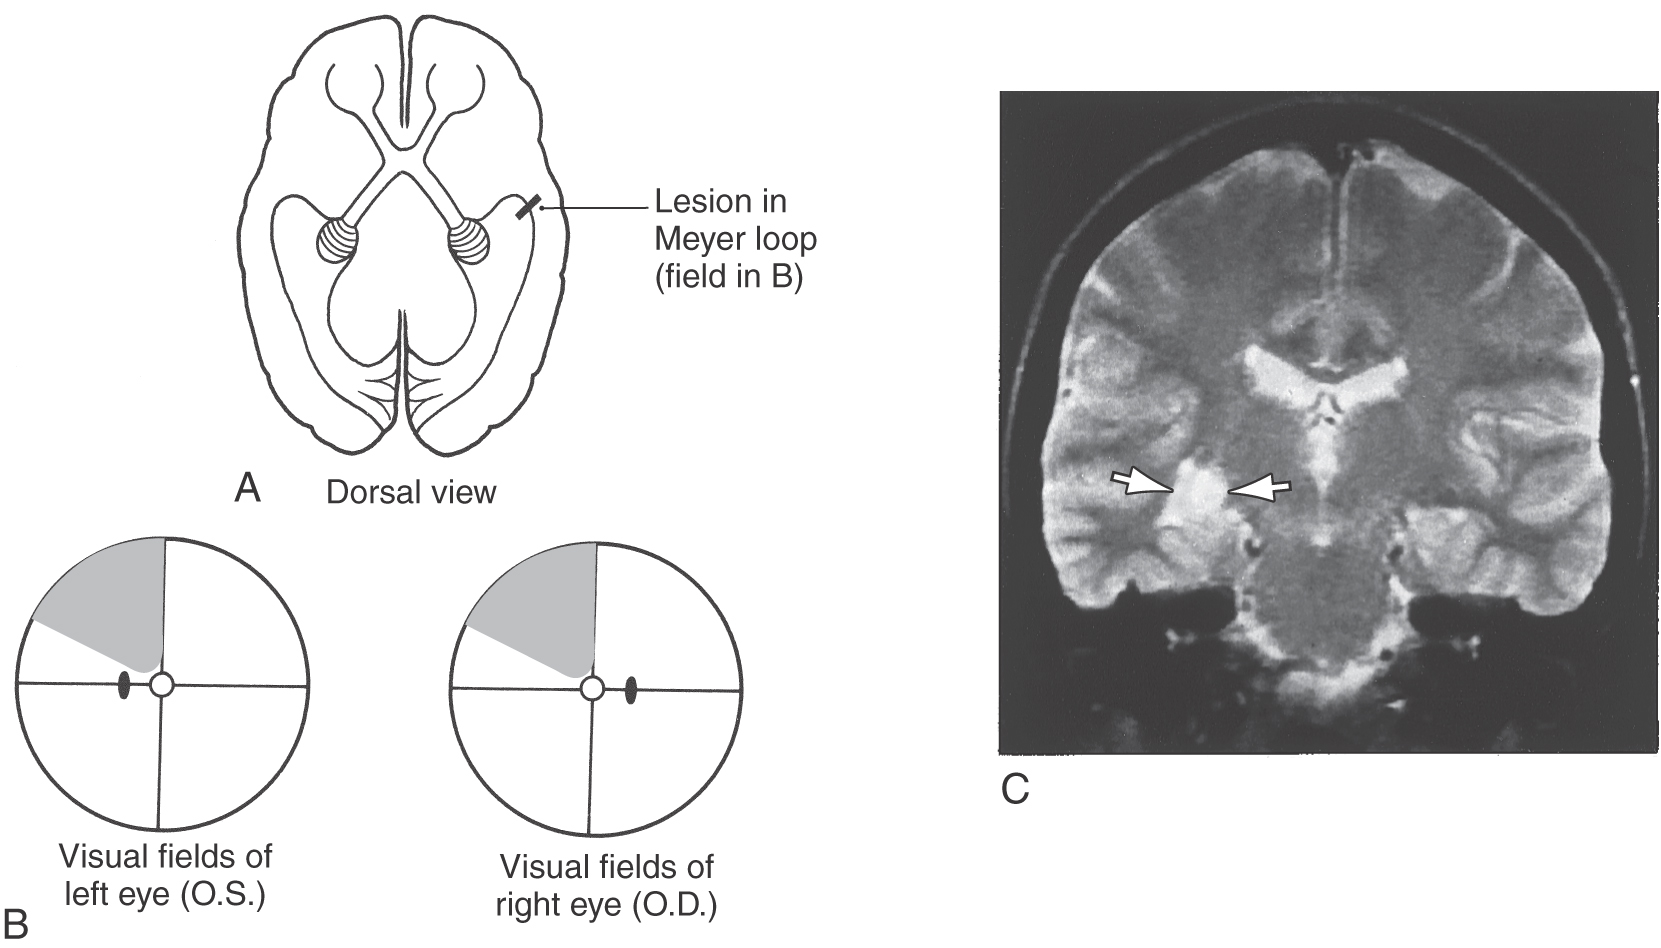
The fibers corresponding to the upper quadrant of the contralateral hemifields originate from the ventrolateral portion of the lateral geniculate nucleus. These fibers do not pass directly caudal to the visual cortex. Instead they arch rostrally, passing into the white matter of the temporal lobe to form a broad U-turn (loop of Meyer or Archambault) before passing caudally to synapse in the inferior bank of the calcarine sulcus, on the lingual gyrus (Figs. 20-11, 20-18, and 20-19). Damage to the Meyer loop in the temporal lobe or to these fibers en route to the calcarine sulcus results in a contralateral (right or left) superior quadrantanopia (Fig. 20-19). Geniculostriate fibers conveying information from the macula (and fovea) originate from central regions of the lateral geniculate nucleus and pass to caudal portions of the visual cortex.
Lesions of the optic radiations may result in a quadrantanopia or may involve only a portion of a quadrant of the visual field (Fig. 20-19). Lesions in the optic tracts and optic radiations are described as congruous or incongruous. A deficit is called congruous when the visual field loss of one eye can be superimposed on that of the other eye. The closer a lesion is to the visual cortex, the more congruous it is likely to be. Conversely, the more anterior a lesion is in the optic tract or radiations, the more likely it is that it will be incongruous.
The blood supply to the optic radiations is via branches of the middle and posterior cerebral arteries that penetrate deep into the white matter. In general, the more laterally located fibers of the optic radiations and the fibers of the loop of Meyer are served by branches of the middle cerebral artery. The more medially located fibers and the visual cortex receive their blood supply predominantly from the posterior cerebral artery.
PRIMARY VISUAL CORTEX
The primary visual cortex (striate cortex, area 17, V1) receives most of the axons from the lateral geniculate nuclei. It lies on either bank of the calcarine sulcus in the occipital lobe. The superior bank of the calcarine sulcus, on the cuneus, receives input from the inferior part of the contralateral hemifields, whereas the inferior bank of the sulcus, on the lingual gyrus, receives input from the superior part of the hemifields (Fig. 20-11). The central part of the visual field (i.e., the macula and fovea) is represented in the portion of the primary visual cortex closest to the occipital pole, and the more peripheral regions of the visual field are represented more rostrally in the cuneus and lingual gyrus (Fig. 20-11). The central 10 degrees of the visual field occupies about half of the visual cortex.
The six-layered neocortex of area 17 is characterized by a wide layer IV. This layer contains an extra band of myelinated fibers, the stria of Gennari (Fig. 20-20). This structure is visible to the naked eye in the freshly cut brain and accounts for the name striate cortex. It is indicative of the large geniculocalcarine input to this layer. Layer VI is also prominent in striate cortex. It is the source of a cortical feedback projection to the lateral geniculate nucleus. The neurons of the visual cortex are organized into an elaborate array of cortical columns (see later), which extend perpendicularly from the pial surface to the white matter.
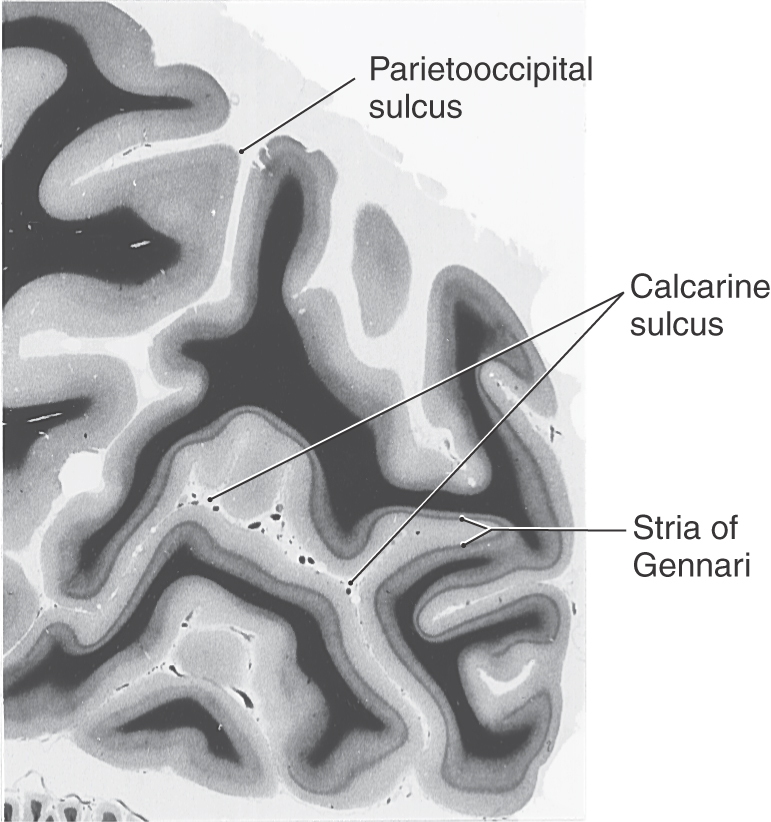
Figure 20-20. The characteristic appearance of the stria of Gennari in the human primary visual cortex bordering on the calcarine sulcus.
A large lesion of the visual cortex on one side (e.g., from occlusion of the calcarine artery) will result in a contralateral (right or left) hemianopia. Macular sparing may result because caudal parts of the visual cortex can also be served by collateral branches of the middle cerebral artery.
Functional Organization of Visual Cortex
The functional organization of the visual cortex has for decades been the subject of intense anatomic and physiologic investigation. Much is now known about the receptive field properties and the neural connections of neurons in the visual cortex and about the neurotransmitters they employ. Although most of the information was initially gained from animal research, experiments using functional MRI have confirmed that the physiologic and anatomic organization of the visual system in humans is extremely similar to that in nonhuman primates. Consequently, the general principles of organization described here are directly applicable to the human visual system.
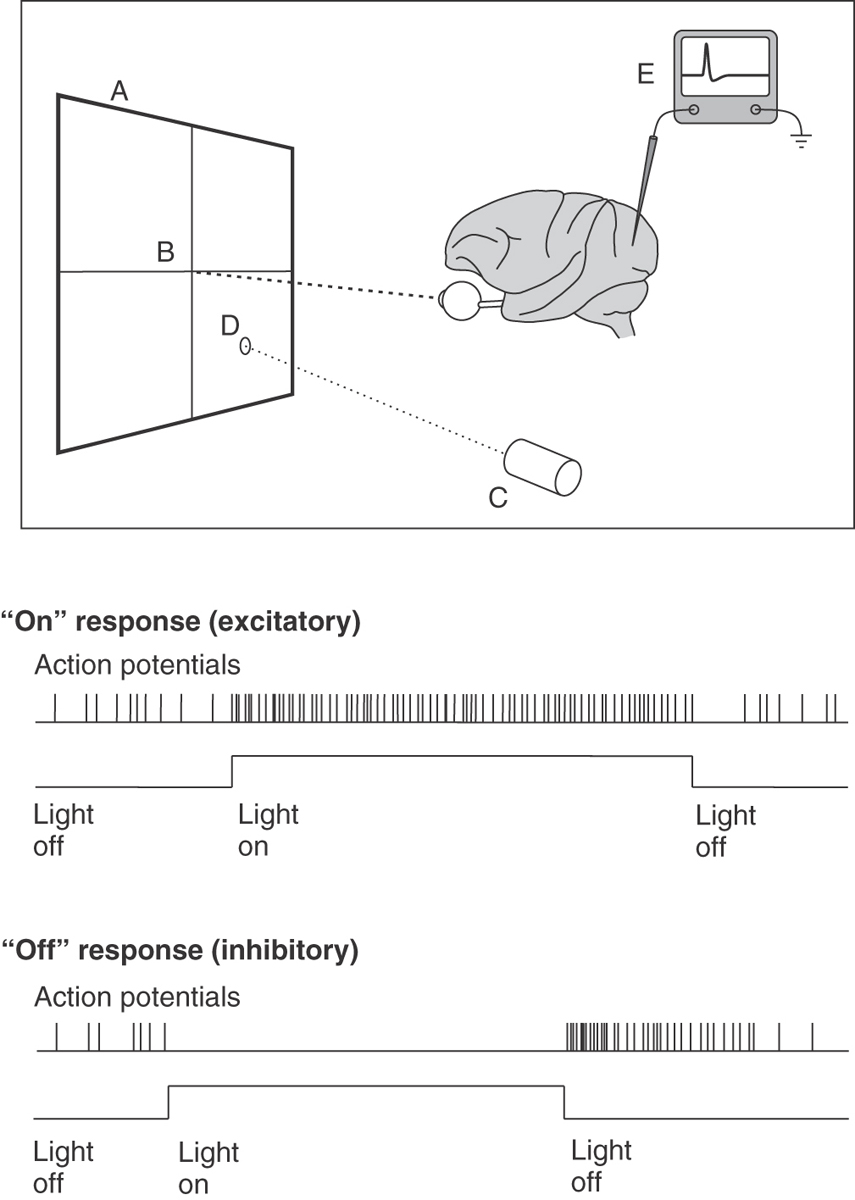
In a typical study of the receptive field properties of neurons in the visual cortex, an anesthetized primate is placed in front of a projection screen (Fig. 20-21), with its eyes directed toward and focused on a fixation point in the center of the screen. The neural activity of a single cortical neuron is isolated with a microelectrode, amplifier, and oscilloscope. A movable projector projects a small circular spot of light or a long, narrow bar of light onto the screen, and it is moved around the screen until a location is found at which the light causes action potentials to occur in the neuron under study.
Receptive Field Properties of Cortical Neurons
The receptive field of a neuron is defined as that region of the visual field in which the correct stimulus will have an effect on the activity of the neuron (either excitatory or inhibitory). Depending on exactly where within the receptive field of the neuron the light is projected, the neuron may give an on response, when a burst of action potentials occurs when the light is turned on (Fig. 20-21), or an off response, when background activity in the neuron is inhibited when the light is turned on but a burst of action potentials occurs when the light is then turned off (rebound excitation) (Fig. 20-21).
The most common receptive field arrangements in the primary visual cortex are illustrated in Figure 20-22. Some cortical neurons have concentric receptive fields, similar to the receptive fields of retinal ganglion cells and lateral geniculate cells (Fig. 20-22A). Cortical neurons with concentric receptive fields are almost all in layer IV of the cortex and are probably stellate neurons that receive synaptic contacts from lateral geniculate nucleus neuron axons. A small spot of light within the center region of the receptive field will produce a small on response in the neuron being studied; a larger spot of light that completely fills the center of the receptive field will produce a stronger on response. In contrast, a small spot of light in the surround region of the receptive field will produce an off response, and a doughnut of light that completely fills the surround region will produce the maximal off response. As in the retina and lateral geniculate nucleus, about half of the cortical concentric neurons have receptive fields with on centers and off surrounds; the other half have off centers and on surrounds. A large spot of light that fills both the center and the surround regions of the receptive field produces no response at all as the excitatory and inhibitory influences on the neuron cancel each other out.
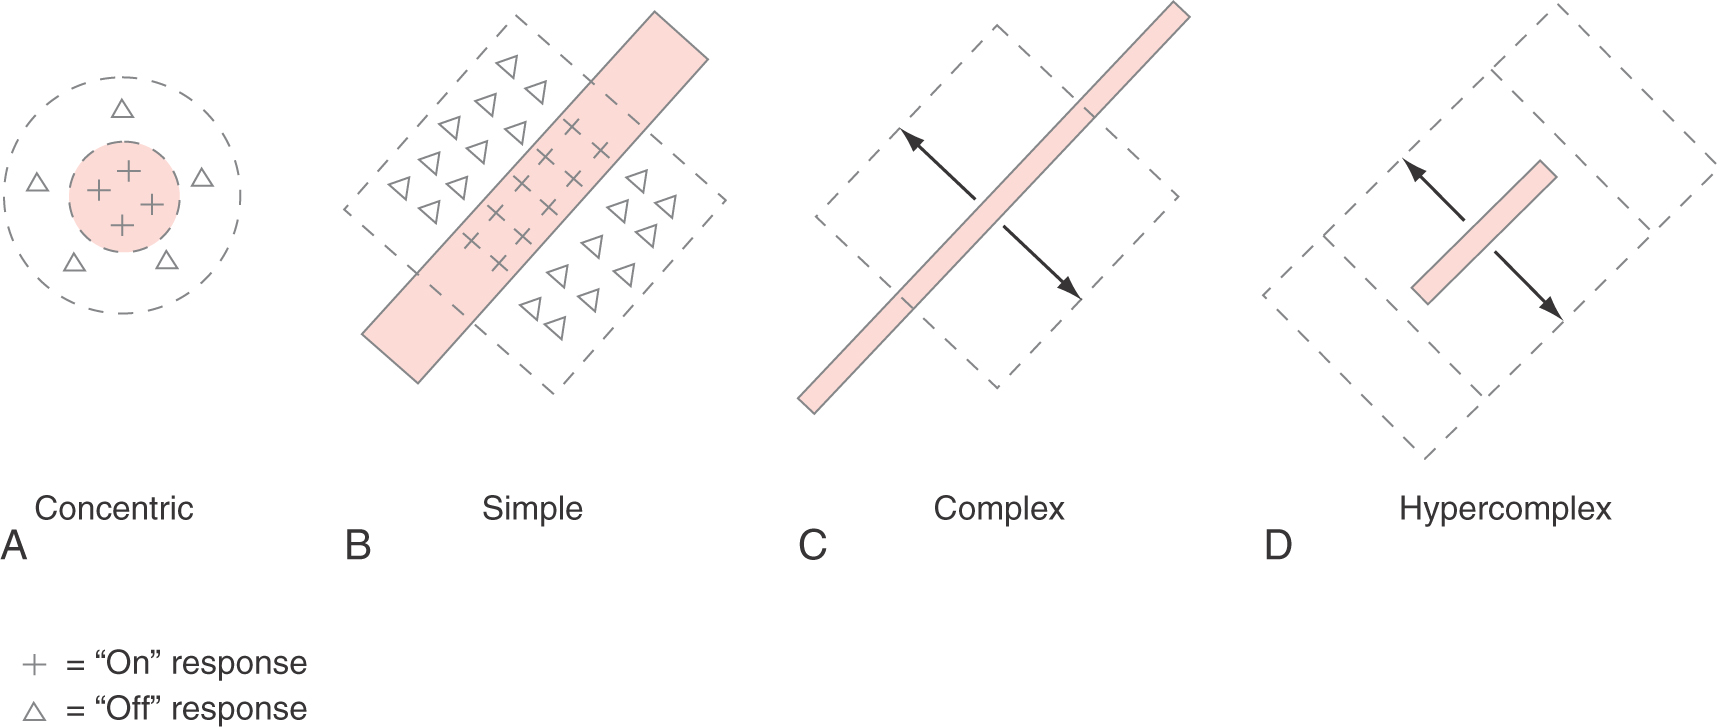
Figure 20-22. A to D, Representative receptive field organization of neurons in primary visual cortex.
In layers II, III, V, and VI of the visual cortex, the receptive fields of neurons are organized differently. Instead of circular receptive fields, virtually all other cortical neurons have elongated receptive fields and respond best to long, narrow bars of light. One class of neurons, those with simple receptive fields, give a small on response when a small spot of light is presented anywhere in the excitatory region of the receptive field (pluses, Fig. 20-22A, B) and a small off response when the spot of light is presented somewhere in the inhibitory region of the receptive field (triangles, Fig. 20-22A, B). However, the maximal response is produced by a bar of light that completely fills either the excitatory or inhibitory region of the field. To produce a maximal on response, the light bar must be positioned exactly within the excitatory zone of the receptive field, and its angle with respect to the horizontal must match the angle of the excitatory zone (pluses, Fig. 20-22B). Thus a neuron with simple receptive field characteristics is sensitive to both the position and the angle (or orientation) of the stimulus. Different simple cells have different preferred stimulus orientations throughout the entire range of 360 degrees.
A second class of visual neurons, which are also found throughout layers II, III, V, and VI, intermixed with simple cells, are cells with complex receptive field properties (Fig. 20-22C). A complex neuron responds best to a bar of light in a certain orientation, just as simple cells do. However, a complex cell will respond maximally to a stimulus of the correct orientation anywhere within its receptive field. Additional types of receptive fields have been described, including hypercomplex receptive fields, which are similar to complex receptive fields except that now the length of the stimulus is also critical to producing the maximal on response (Fig. 20-22D). If the stimulus is too long, it extends into inhibitory zones adjacent to the excitatory zone and diminishes the neuron’s response.
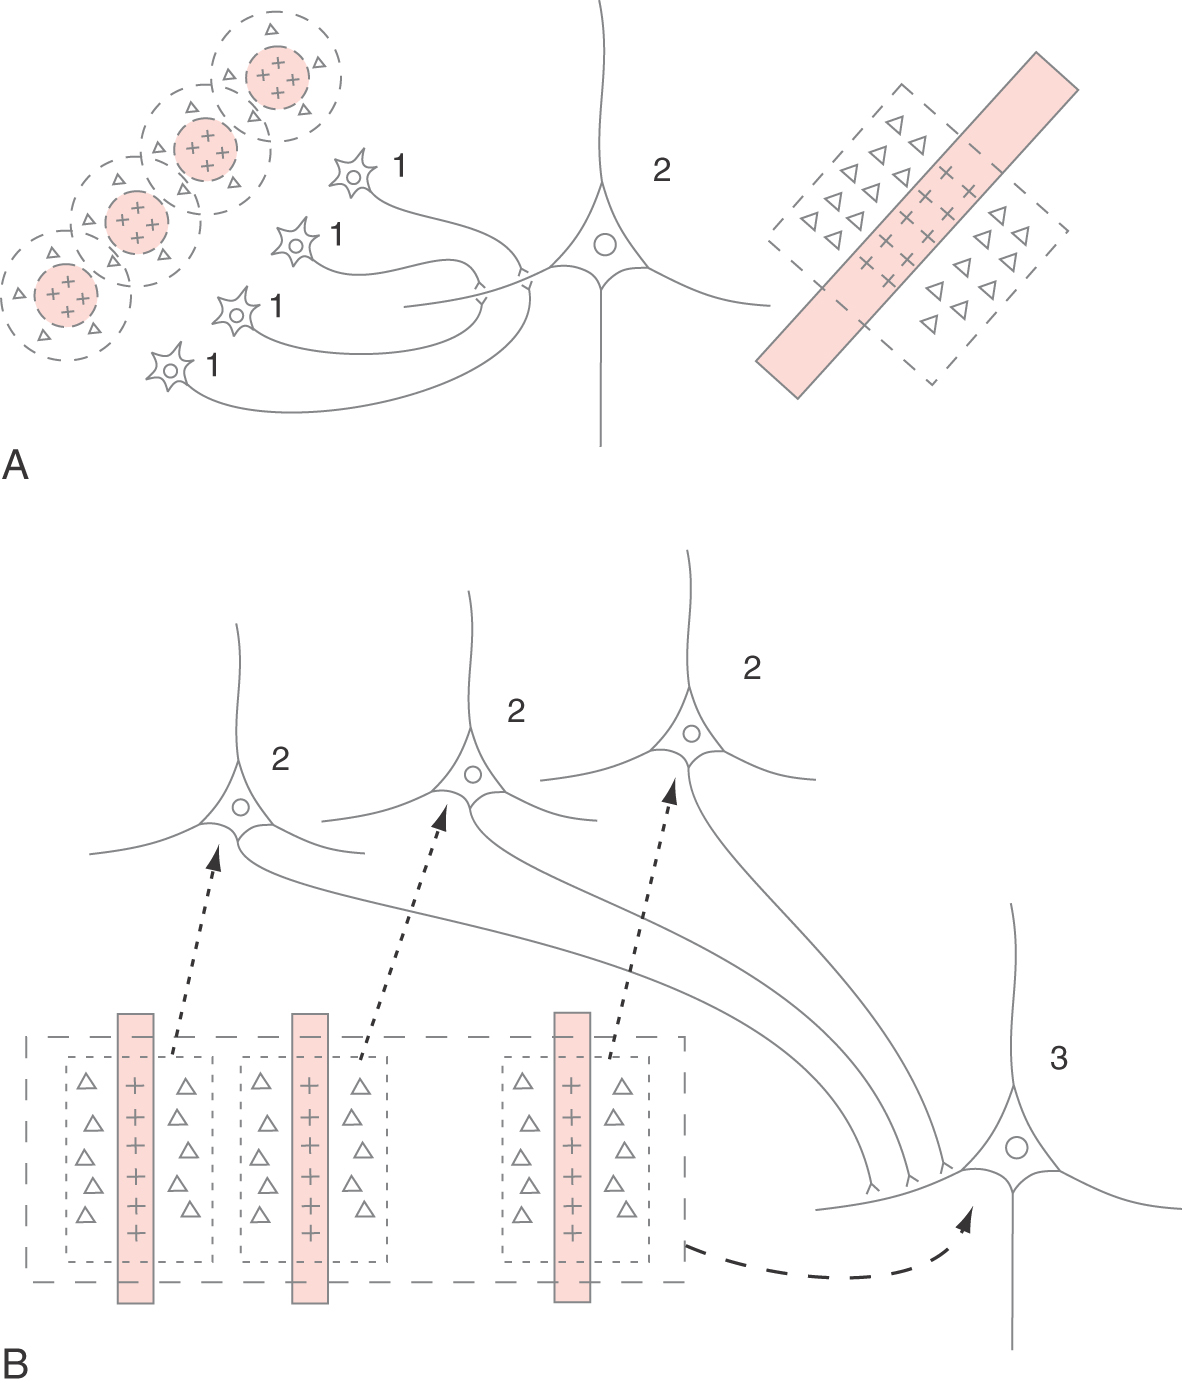
The variety of receptive field types that are observed in V1 are the result of progressive convergence of neural connections. Figure 20-23A illustrates how several stellate neurons (1) in layer IV, each having a concentric receptive field, converge on a pyramidal neuron (2) in layer II, III, V, or VI to produce a simple receptive field. A small spot of light in the center of the receptive field of any one of the stellate cells produces an on response in that cell, which in turn produces enough excitation in the pyramidal cell to generate a modest on response in it. A maximal on response in the pyramidal cell is generated when a long narrow bar of light is in the proper position and angle to activate the center of all of the concentric receptive fields simultaneously. If the light stimulus is moved laterally so that it illuminates only the inhibitory surrounds of the concentric fields, then the simple cell gives an off response. Similarly, several simple cortical cells (2, Fig. 20-23B) might converge on another neuron to produce a complex receptive field (3, Fig. 20-23B). In this case, a properly oriented bar of light that illuminates any of the simple receptive fields would produce enough excitation to generate activity in the complex cell.
Orientation Columns
Another general property of neural organization in the visual cortex is the columnar organization of the neurons. This is a general property of the cerebral cortex and was first described in the primary somatosensory cortex (see also Columnar Organization in Chapter 32). In the visual cortex, there are two types of cortical columns. The first are referred to as orientation columns (Fig. 20-24). If a microelectrode is introduced into the visual cortex at a right angle with respect to the cortical surface and is advanced slowly through the cortex, recording the receptive field properties of each neuron that is encountered, it will be observed that neurons with simple, complex, and hypercomplex receptive field properties are more or less randomly intermixed, but every neuron encountered, regardless of its type, will have the same optimal stimulus orientation. The exception would be that the neurons in layer IV, which receive direct input from lateral geniculate neurons, would have predominantly concentric receptive fields.
If another electrode penetration is made a few hundred microns away from the first, every neuron will again have the same preferred stimulus orientation, but in this case the preferred stimulus orientation will be slightly different from that in the first column of neurons. If a microelectrode were to traverse the cortex parallel to the surface, it would encounter neurons with regularly changing preferred stimulus orientations. Over a distance of about 800 µm, the preferred stimulus orientation would rotate through 180 degrees. The visual cortex is therefore divided into many small regions, or columns, that extend from the pial surface to the white matter and code the various angles that a linear stimulus might take. This columnar organization is repeated for each point on the retina as it is mapped onto the visual cortex.
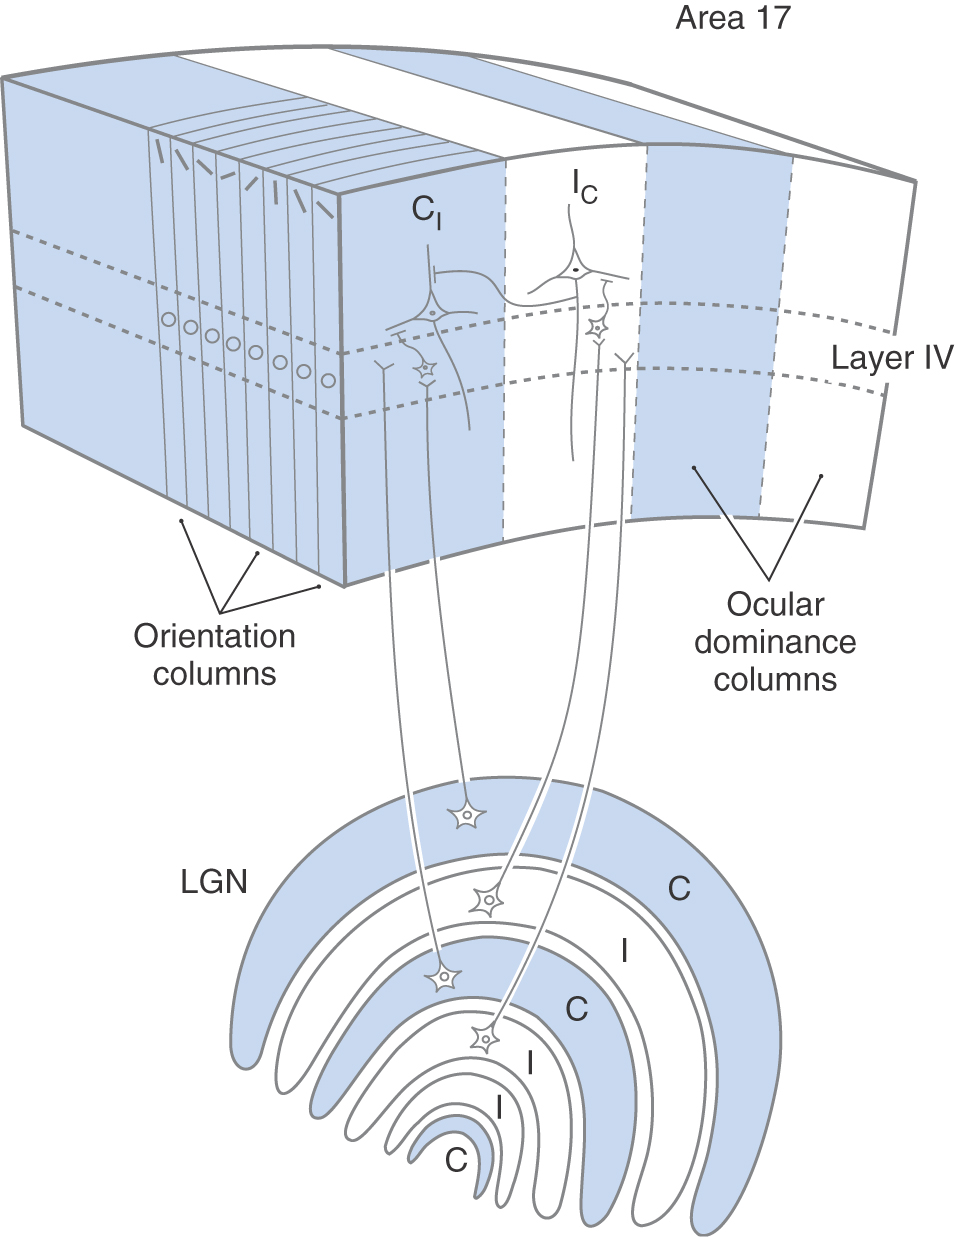
Ocular Dominance Columns
Superimposed on the orientation column organization is a second system of columns, the ocular dominance columns (Fig. 20-24; see also Chapter 32). These columns are critical to stereopsis, one of the ways in which depth is perceived in the visual world. Each eye receives a slightly different image in an individual’s surroundings. This can be verified by pointing your finger at an object in your immediate environment and closing first one eye and then the other. These two images are kept separate in the alternating layers of the lateral geniculate nucleus (Figs. 20-18 and 20-24) and in the projection of each lateral geniculate layer to the primary visual cortex (Fig. 20-24). In one cortical ocular dominance column, all simple, complex, and hypercomplex cells have a stronger response when the optimal stimulus is presented to one eye (e.g., contralateral) and a lesser response when the same stimulus is presented to the other eye (e.g., ipsilateral). In the adjacent ocular dominance column, the reverse relationship is observed. The relationship between ocular dominance columns and orientation columns is normally depicted as if they were arranged at right angles to each other, although their exact relationship is probably not so simple. Ocular dominance columns are about 400 µm wide. A collection of orientation columns in which the preferred stimulus orientation rotates through 180 degrees occupies about 800 µm. A combination of one contralateral-dominant column (blue, CI, Fig. 20-24) and one ipsilateral-dominant column (white, IC, Fig. 20-24), which includes a complete 180-degree shift in stimulus orientation, is referred to as a hypercolumn and occupies a region of cortex about 800 µm on a side.
The establishment of the neural connections in ocular dominance columns occurs after birth and requires proper visual stimulation in both eyes to develop normally. If disorders of vision such as strabismus, amblyopia, or congenital cataracts prevent the formation of simultaneous, superimposed, sharply focused images in both eyes during the early years of life, the neural connections that form the basis of the ocular dominance columns do not develop normally and the individual will not be able to experience stereopsis, although other aspects of vision may be normal or nearly normal.
Using the neural mechanisms described previously, the visual system assembles progressively more complex representations of the visual world, beginning with tiny dots in the retina that are translated into lines and areas of light and dark in primary visual cortex and then into more and more sophisticated representations in visual association cortex (see next). For additional information on the processing of neural signals in the visual system, see the list of suggested readings.
ABNORMAL DEVELOPMENT OF VISUAL CORTEX
During development of the visual system, the axons of visually responsive cells in the lateral geniculate nucleus compete for synaptic space on cortical cells. If both eyes receive the same detailed visual information, in focus and exactly superimposed in the two retinae, this competition results in the devotion of equal numbers of layer IV visual cortical cells to inputs from the right and the left eyes (Fig. 20-24). However, if the visual input from one eye is disrupted (e.g., by congenital cataracts, strabismus, or amblyopia), the lateral geniculate axons from that eye do not compete successfully and most of the layer IV stellate cells eventually receive synaptic contacts primarily from the normal eye. Stereopsis is then lost. This competition is limited to a critical period during postnatal development. At some point, the synaptic connections made during the competition phase become permanent, the lateral geniculate neurons that lost the competition are permanently shut out, and binocular vision cannot be regained. This critical period is believed to last several years in humans. Once the neural connections are established successfully, later disruption of visual input does not have a marked effect on the synaptic efficiency of the input to the visual cortex.
OTHER VISUAL CORTICAL AREAS
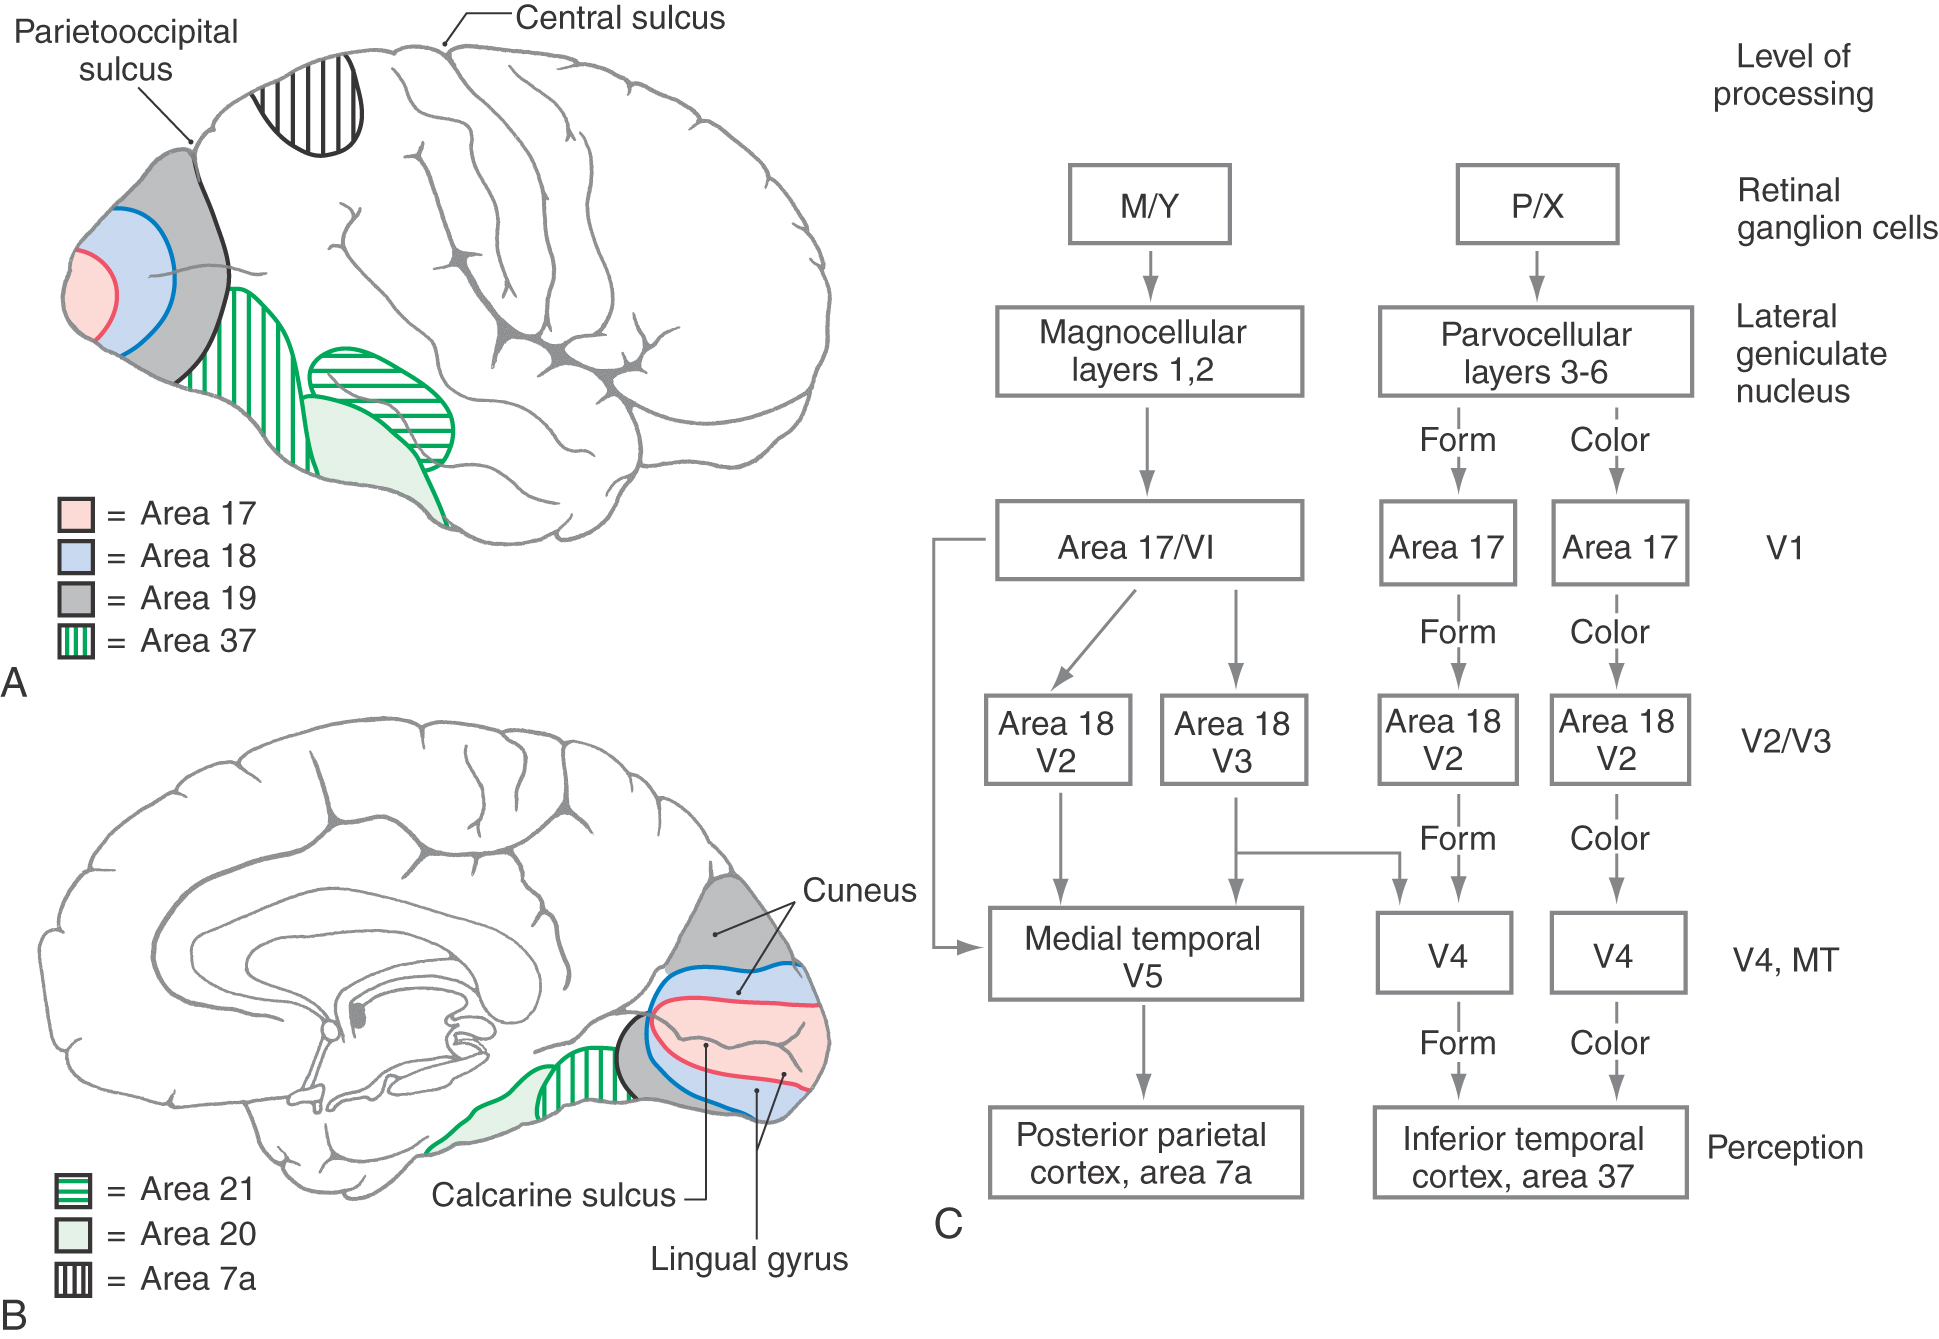
The primary visual cortex, which we have been discussing up to this point, is responsible for much of the initial cortical processing of neural information relating to vision. However, what happens in the primary visual cortex is only a first step in the conversion of an image on the retina into a psychological perception. Many additional regions of the brain, generally termed visual association cortex and multimodal association cortex (see Chapter 32), participate directly or indirectly in this process. Figure 20-25 depicts a simplified “road map” of some of the most important paths that visual information takes as it is processed by the brain.
One of the surprising features of the visual system is that different aspects of the visual experience are processed by different regions of visual association cortex. Thus localized damage in one region of visual association cortex can impair a person’s ability to perceive the colors of objects without impairing the person’s ability to recognize what the object is (achromatopsia). (This defect is different from color blindness of retinal origin.) Cortical damage in another region can impair a person’s ability to accurately perceive the speed and direction of moving objects in the visual field, and damage in yet another region can impair the person’s ability to recognize familiar faces, even though standard ophthalmologic tests might reveal normal visual acuity.
One feature of visual processing that contributes to the parcellation of different aspects of the overall perception has already been introduced. The ganglion cells in the retina that project to the parvocellular layers of the lateral geniculate nucleus are most sensitive to small, stationary stimuli and are concentrated in the central region of the retina. These cells are the origin of a pathway, or a “stream of processing,” that is specialized at every level for the processing of the finely detailed, high-resolution aspects of vision, the aspects necessary to recognize an object, a word, or a face in the visual environment. This pathway is called the parvocellular (P) stream of processing, or the “what” pathway (Fig. 20-25C).
A second general stream of processing originates in the retinal ganglion cells that project to the magnocellular layers of the lateral geniculate. These ganglion cells are most sensitive to moving stimuli and to relatively large areas of light and dark and are more common in the peripheral retina. This pathway is specialized for the detection and analysis of movement in the environment and also for the spatial localization of objects in the environment. Curiously, it is possible for damage in this pathway, particularly in the parietal association cortex, to render a person unable to judge which of two objects is closer to him, although he has no difficulty in recognizing what the objects are (see Chapter 32). This pathway is called the magnocellular (M) stream of processing, or the “where” pathway (Fig. 20-25C).
Starting in area 18, the M and P pathways that originate in the respective retinal ganglion cells diverge. Up to this level, both of these pathways, or streams of processing, have been located in the same general regions: M and P cells coexist in the retina, the lateral geniculate nucleus, and area 17, even though they process separate streams of information. This arrangement persists in the V2 subregion of area 18, but as the streams emerge from the V2 subregion, they take different routes (Fig. 20-25C). The M stream proceeds to a subregion of area 18 called V3, then to the medial temporal area (V5 or MT), and finally goes to the posterior parietal area (area 7). (Remember that the information carried by this stream originates largely in rod cells and in the peripheral portions of the retinas and that the receptive fields involved are large.) Appropriately, this information is used in determining where relevant visual stimuli are located and whether they are moving.
The P stream proceeds from the V2 subregion to the V4 subregion of Brodmann area 19 and from there to the inferior temporal cortex (area 37). This stream, which originates mainly in cones and in the central area of the retina, codes for form and for color (Fig. 20-19C). In fact, starting in the lateral geniculate nucleus, form and color information is carried by two separate portions of the P stream. The portion that subserves form perception makes use of the small receptive fields and consequent high acuity of the P ganglion cells. The color-opponent receptive fields of these ganglion cells form the basis for color perception, but these signals are relayed by a different subset of lateral geniculate neurons.
Stroke or trauma to higher order visual processing areas may produce syndromes that seem odd to the casual observer, some of which are described in the popular book The Man Who Mistook His Wife for a Hat, by Oliver Sacks. For example, the process of perception seems to be anatomically distinct from the process of attaching meaning to what we see. Thus an apperceptive agnosia, in which the patient cannot identify objects because of a perceptual deficit, is a separate entity from an associative agnosia, in which the patient can perceive the object, face, or photograph but cannot attach any meaning to it. This latter phenomenon was described by Teuber as “percepts stripped of their meaning.”
These agnosias arise from lesions of the inferotemporal region in areas 18, 20, and 21, alone or in combination. In most people, the left hemisphere is dominant for speech. Thus lesions in areas 18, 20, and 21 of the left (dominant) hemisphere typically result in object agnosia, in which the patient is unable to recognize (i.e., identify or name) real objects, although they are perceived. Lesions in these areas in the right (nondominant) hemisphere produce agnosia for drawings of objects. Smaller bilateral lesions in these areas, especially in the fusiform gyrus, may produce prosopagnosia, the inability to recognize faces. The patient can see the face and recognize it as a face but cannot distinguish one face from another, even the faces of old friends and family members.
Balint syndrome results from bilateral lesions in the parietooccipital junction region. It consists of impairment of voluntary eye movements (reflex eye movements are preserved) and optic ataxia (inaccurate eye movements related to visual-motor coordination).
Another dissociation of functions that we normally think of as linked occurs in the phenomenon of alexia without agraphia. In this syndrome, affected persons can write but cannot read what they have written (or what anyone else has written). A lesion of the splenium of the corpus callosum, carrying visual information from one visual cortex to another, combined with damage to the adjacent occipital region can produce this syndrome, which usually (but not always) occurs in conjunction with a homonymous hemianopia.
Sources and Additional Reading
Borwein B. Scanning electron microscopy of monkey foveal photoreceptors. Anat Rec. 1983;205:363–373.
Choisser B. Face Blind! Bill’s Face Blindness (Prosopagnosia) Pages. Available at http://www.choisser.com/faceblind/.
Hubel DH. Eye, Brain and Vision, New. York: Henry Holt & Co; 1995.
Koretz JF, Handelman GH. How the human eye focuses. Sci Am. 1988;259:92–99.
Masland RH. Functional architecture of the retina. Sci Am. 1986;255:102–111.
Rodieck RW. The First Steps in Seeing. Sunderland, Mass: Sinauer; 1998.
Stryker MP. Is grandmother an oscillation?. Nature. 1989;338:297–298.
Werblin FS. The control of sensitivity in the retina. Sci Am. 1973;228:70–79.
Zeki S. A Vision of the Brain. Boston: Blackwell Scientific Publications; 1993.
[/level-membership-for-basic-science-category][not-level-membership-for-basic-science-category]Chapter 20
The Visual System
Neural Retina and Pigment Epithelium
Processing of Visual Input in the Retina
Outer and Inner Plexiform Layers
Optic Nerve, Chiasm, and Tract
Visual Fields Correlated with Visual Structures as Seen in Magnetic Resonance Imaging
Magnocellular and Parvocellular Layers
Ipsilateral and Contralateral Layers
Functional Organization of Visual Cortex
Receptive Field Properties of Cortical Neurons
Vision is the sensory modality that perhaps captures the imagination more than any other. Phrases such as “He is the apple of my eye,” or “Her eyes flashed with anger,” or “I see what you mean” are common in the language and literature of most cultures and date back thousands of years. Furthermore, because of the way the nervous system converts optical images into neural signals and eventually visual experiences, it is technically easier to study the visual system than other sensory systems. The visual system has consequently been studied in greater depth, in both its anatomy and its physiology, than other sensory systems, and the neural mechanisms by which physical energy in the environment is translated into psychological perceptions are better understood in the visual system than in any other sensory system. It turns out that many of the basic anatomic features and physiologic properties of the visual system, especially at the level of the cerebral cortex, are shared with other sensory systems. This chapter presents the visual system both as a sensory system important in its own right, particularly with respect to its importance in neurologic diagnosis, and as a convenient example of some basic principles of neural processing that are found in many neural systems, including sensory, motor, and associational systems.
OVERVIEW
Like other sensory systems, the visual system creates a location-coded (visuotopic) “map” of its sensory field (the visual world) that is preserved at all levels. Light information is received by the retinal photoreceptors, and the initial processing of the visual signal occurs in the retina. Although the retina projects to several diencephalon and midbrain structures, most retinal axons terminate in a thalamic relay nucleus, the lateral geniculate nucleus, which in turn innervates the primary visual cortex, a region in the occipital lobe. From there, visual information is sent to a number of visual association areas in the occipital, temporal, and parietal lobes.
ANATOMY OF THE EYE
The human eye forms an optical image of an individual’s surroundings and focuses that image on an array of approximately 125 million photoreceptors (rods and cones) that are located in the neural retina. The image is inverted and reversed by the lens. The anatomy of the eye is summarized here.
Cornea
The cornea provides a transparent protective coating for the optical structures of the eye (Fig. 20-1). Its lateral margin is continuous with the conjunctiva, a specialized epithelium covering the “white” (sclera) of the eye. Although the conjunctiva and sclera have a blood supply (most evident when the eyes are irritated), the central cornea is normally not vascularized.
Figure 20-1. Cross section of the human eye. The gray arrow shows the path of light through the optical apparatus.
A variety of conditions may affect the cornea and, by disturbing the transmission of light through the cornea, degrade the quality of the visual image. Damage to the cornea may occur in chronic infections of herpesvirus, of Chlamydia trachomatis, or of the bacteria that cause conjunctivitis. Trauma may, of course, cause permanent damage to the cornea. In addition, various metabolic diseases may result in crystal deposits or other opacities in the cornea.
Chambers of the Eye
Just behind the cornea is the fluid-filled anterior chamber, which is bound posteriorly by the iris and the opening of the pupil (Fig. 20-1). A second fluid-filled space, the posterior chamber, is bound anteriorly by the iris and posteriorly by the lens and its encircling suspensory ligament (zonule fibers). Fluid is continuously produced by the epithelium over the ciliary body around the rim of the posterior chamber and flows through the pupillary opening into the anterior chamber. It then drains into a set of modified veins, the canals of Schlemm, that are located around the rim of the anterior chamber in the angle where the iris meets the cornea. Because the suspensory ligament encircling the lens consists of discrete strands, the fluid in the posterior chamber is in contact with the vitreous body, the gelatinous mass that fills the main space of the eyeball between the lens and the retina.
Any condition that obstructs the outflow of fluid via the canals of Schlemm can lead to glaucoma, a buildup of fluid and hence pressure in the entire eyeball, with resultant damage to the retina and optic nerve and eventual blindness. Patients with glaucoma often comment that their vision is blurred but not dimmed. A normal amount of light reaches the retina, but the progressive loss of photoreceptors causes blurring of the visual image. Damage proceeds from the periphery of the retina toward the central region where the fovea is located. In most cases of glaucoma (about 90%), the angle between the iris and cornea is normal (open-angle glaucoma), and the cause of the increase of pressure is unknown. In about 5% of patients, the angle between cornea and iris is abnormally acute (closed-angle glaucoma) and blocks the normal flow of fluid. In the remaining cases, the canals of Schlemm are blocked by debris from infection, complications of diabetes, or hemorrhage into the anterior chamber. When the intraocular pressure is above 20 mm Hg, optic nerve damage is a concern. The resulting visual loss proceeds from partial (in the periphery first) to total.
Iris
The iris is a pigmented structure lying directly anterior to the lens (Fig. 20-1). The connective tissue, or stroma, of the iris contains melanocytes that reflect or absorb light to give the iris its characteristic color. Also embedded in the stroma are the circumferentially organized sphincter muscle of the iris and the radially arranged dilator muscle (Fig. 20-1).
The innervation of the iris sphincter, which closes the pupil, is parasympathetic. This pathway begins with preganglionic neurons whose cell bodies lie in the Edinger-Westphal preganglionic nucleus and whose axons terminate in the ciliary ganglion. Axons of postganglionic ciliary ganglion neurons, in turn, end as neuromuscular synapses on the sphincter muscle and release acetylcholine. When activated, this pathway results in a reduction in pupil diameter, or miosis.
The innervation of the iris dilator, which opens the pupil, is sympathetic. The pathway begins with preganglionic neurons whose cell bodies lie in the intermediolateral cell column of the spinal cord at upper thoracic levels and whose axons terminate in the superior cervical ganglion. Axons of postganglionic superior cervical ganglion neurons, in turn, end as neuromuscular synapses on the dilator muscle and release norepinephrine. When activated, this pathway results in an increase in pupil diameter, or mydriasis. This phenomenon is a measure of the general state of the sympathetic tone. Anger, pain, or fear may result in an enlargement of the pupil in the absence of a change in lighting conditions. The pupillary light reflex, a contraction of the pupil in response to light, is used to assess the function of the nervous system, particularly at midbrain levels (see Chapter 28).
The circumference of the pupillary margin changes by a factor of six. This proportional change in muscle length is greater than any other in the human body. To accomplish this change, acetylcholine is released onto both the sphincter and dilator muscles. The effect is to activate muscarinic receptors that depolarize sphincter muscle cells and cause contraction. In addition, acetylcholine released by collaterals onto the dilator muscle mediates presynaptic inhibition of norepinephrine release and blocks dilator contraction. Thus, as the sphincter contracts, the dilator relaxes, strengthening the pupillary response to light.
Lens
The lens is a clear structure that focuses light on the retina (Fig. 20-1). The lens of the eye is a simple convex lens that inverts and reverses the image on the retina. Mechanisms that change the curvature of the lens are discussed in detail in Chapter 28.
Beginning at about the age of 40 years, the lens begins to lose its elasticity so that the shape it adopts when relaxed is more flattened than earlier in life. This change reduces the affected person’s ability to focus on near objects, a condition called presbyopia. Reading or bifocal corrective lenses are prescribed to aid the patient in performing tasks requiring close, detailed vision.
Cataract
Opacities in the lens, known as cataracts, are relatively common and can be seen as a cloudiness of the lens. Cataracts may be caused by congenital defects (e.g., secondary to maternal infection with rubella), persistent exposure to ultraviolet light, diabetes, high doses of some medications, radiation therapy, or poorly understood mechanisms that occur in aging. Current therapy consists of replacement of the lens with an inert plastic prosthesis, restoring sight but with a concomitant loss of accommodation.
Uvea
The iris, ciliary body, and choroid make up the vascular tunic of the eye, also called the uvea. The choroid is a highly vascularized, pigmented tissue layer lying between the retinal pigment epithelium and the sclera, the tough outer coating of the eye. Uveitis is an inflammation of these structures, often secondary to eye injury.
NEURAL RETINA AND PIGMENT EPITHELIUM
The inner surface of the posterior aspect of the eye is covered by the retina, which is composed of the neural retina and the retinal pigment epithelium (Fig. 20-2). In describing the layers and cells of the retina, it is common to use the terms inner and outer. Inner refers to structures located toward the vitreous (i.e., the center of the eyeball), whereas outer is used in reference to structures located toward the pigment epithelium and choroid.
The retinal pigment epithelium is a continuous sheet of pigmented cuboidal cells bound together by tight junctions that block the flow of plasma or ions. Its functions are as follows: (1) it supplies the neural retina with nutrition in the form of glucose and essential ions; (2) it protects retinal photoreceptors from potentially damaging levels of light; and (3) it plays a key role in the maintenance of photoreceptor anatomy via phagocytosis.
The neural retina contains the photoreceptors and associated neurons of the eye and is specialized for sensing light and processing the resultant information. The photoreceptors absorb quanta of light (photons) and convert this input to an electrical signal. The signal is then processed by retinal neurons, as discussed further on. Finally, the retinal neurons called ganglion cells send the processed signal to the brain via axons that collectively form the optic nerve.
The contact between the neural retina and the pigment epithelium is the adult remnant of the ventricular space of the developing eye cup. As such, it is mechanically unstable. This instability is demonstrated in a retinal detachment, in which the neural retina tears away from the pigment epithelium. Retinal detachment is more commonly seen in male patients and may result from a range of factors, such as trauma to the orbit or head, sequela to cataract surgery, genetic predisposition, degenerative diseases of the eye or optic nerves, and aging. Because photoreceptors are metabolically dependent on their contact with pigment epithelial cells, a detached retina must be repaired to avoid further damage. The detached part of the neural retina is reattached to the pigment epithelium by surgical procedures. The degree of functional recovery in the reattached part of the retina depends on its location. It also depends on how soon the reattachment is performed after the injury.
The neural retina has seven characteristic layers (Fig. 20-2). From outer to inner they are (1) a layer containing the photoreceptor cell outer and inner segments; (2) an outer nuclear layer, consisting of the nuclei of photoreceptor cells; (3) the outer plexiform layer, consisting of the synaptic connections of photoreceptors with second-order retinal cells; (4) the inner nuclear layer, containing somata of second-order and some third-order retinal cells; (5) the inner plexiform layer, another area of synaptic contact; (6) the ganglion cell layer, containing the cell bodies of the ganglion cells; and (7) the nerve fiber layer (or optic fiber layer), composed of the axons of the ganglion cells. These axons converge at the optic disc to form the optic nerve. Layers 2 through 7 are flanked by a pair of limiting membranes, which consist of glial cell processes joined by tight junctions. The outer limiting membrane is located between layers 1 and 2, and the inner limiting membrane is located between the nerve fiber layer and the vitreous.
The photoreceptor outer segments interdigitate with the melanin-filled processes of pigment epithelial cells (Fig. 20-2). These processes are mobile, and they elongate into the pigmented layer when the light is bright (photopic conditions) and retract when the light is dim (scotopic conditions). This mechanism combines with contractions of the iris to protect the retina from light conditions that would otherwise damage the photoreceptors. The iris, pigment epithelium, and circuitry of the retina all contribute to the eye’s ability to resolve the visual world over a wide range of light conditions.
The blood supply of the neural retina arises from branches of the ophthalmic artery; these branches are the central artery of the retina and the ciliary arteries. The central artery is usually the first branch of the ophthalmic, passes rostral and inferiorly adjacent to the dural sheath, and then enters the sheath and the optic nerve about 1.25 cm caudal to the bulb of the eye. After entering the eyeball, it branches out from the optic nerve head to serve inner portions of the neural retina. The ciliary arteries penetrate the sclera around the exit of the optic nerve and feed the choriocapillaris (a portion of the choroid), which in turn provides nutrients to the outer portions of the neural retina.
PHOTORECEPTOR CELLS
The rods and cones of the retina are responsible for photoreception, the process by which photons are detected and the information is transduced into an electrochemical signal. There are two basic types of photoreceptors, rods and cones (Figs. 20-3 and 20-4), although a special class of ganglion cell (melanopsin-containing ganglion cell) may be considered a third type of photoreceptor (see later). Rods and cones have the same general overall design. Light is detected and transduced in an outer segment that points toward the pigment epithelium. A narrow stalk, the cilium, connects the outer segment to a second expanded region called the inner segment, which contains mitochondria and produces the energy that maintains the cell. The cilium contains nine pairs of microtubules emanating from a basal body located in the inner segment. The nucleus and perikaryon of the cell are found in the outer nuclear layer; finally, the cell terminates in the outer plexiform layer in an expansion that makes synaptic contacts with neurons. This synaptic expansion is called the spherule in rod cells and the pedicle in cone cells. Both rod and cone synaptic terminals contain a characteristic dark sheet of protein called the synaptic ribbon. This structure may act as a “conveyor belt,” organizing vesicular release of transmitter.
Rods
Rod cells are named for the shape of their outer segment, which is a membrane-bound cylinder containing hundreds of tightly stacked membranous discs (Fig. 20-3). The rod outer segment is a site of transduction. Photons travel through cells of the neural retina before striking the membranous discs of the rod outer segment. Molecules of rhodopsin within these membranes undergo a conformational change and along with transducin and phosphodiesterase induce biochemical changes in the rod outer segment, which reduce levels of cyclic guanosine monophosphate (cGMP). In the dark, cGMP levels in the rod outer segment are high. This cGMP mediates a standing sodium current. At rest, in the dark, sodium ions flow into the rod outer segment. This high resting level of sodium permeability results in a relatively high resting potential for rod cells, about −40 mV. These sodium channels of the outer segment membrane, which are normally open, close in response to increased calcium or a reduction in cGMP. This drives the membrane potential away from the sodium equilibrium potential and toward the potassium equilibrium potential, and the rod cell is hyperpolarized in response to a light stimulus (Fig. 20-3). Note that photoreceptors are the only sensory neurons that hyperpolarize in response to the relevant stimulus.
The hyperpolarization of the rod outer segment propagates passively (i.e., without firing an action potential) through the perikaryon to the rod spherule. In the absence of light, the photoreceptor terminals constantly release the transmitter glutamate at these synapses. The arrival of a light-induced wave of hyperpolarization causes a transient reduction in this tonic release of glutamate. As explained further on, this event can depolarize some of the cells that receive synapses from photoreceptor terminals while hyperpolarizing others.
Rhodopsin molecules are capable of a huge but finite number of photoisomerization events. Rather than replace individual rhodopsin molecules, every morning the distal one tenth of the outer segment is broken off and phagocytosed by the pigment epithelium. Through this process of rod shedding, the outer segment is constantly renewed. New discs are formed at the base of the outer segment and move outward so that the shed discs are replaced. In this way, the rod remains a constant length and the outer segment is renewed about every 10 days.
Cones
Like rod outer segments, cone outer segments also consist of a membranous stack (Fig. 20-4). Unlike in rods, however, these stacks of cone membranes are of constantly decreasing diameter (from cilium to tip), giving the cell its characteristic shape. Also, they are not enclosed within a second membrane but are open to the extracellular space adjacent to the pigment epithelium (Fig. 20-4).
The process of transduction in cones is generally similar to that in rods. Cone opsin absorbs photons and undergoes a conformational change, resulting in a hyperpolarization of the cell membrane (Fig. 20-4). This hyperpolarization propagates passively to the cone’s synaptic ending, the cone pedicle, in the outer plexiform layer. Cone pedicles and rod spherules both contain synaptic ribbons surrounded by vesicles, but cone pedicles are larger (Fig. 20-4). Serial-section electron microscopy has shown that the synaptic ribbons are actually a single extensive sheet of protein. Like rods, cones release the neurotransmitter glutamate tonically in the dark and respond to light with a decrease in glutamate release.
There are three types of cones, each tuned to a different light wavelength (Fig. 20-5). L-cones (red cones) are sensitive to long wavelengths, M-cones (green cones) to medium wavelengths, and S-cones (blue cones) to short wavelengths. Because any pure color represents a particular wavelength of light, each color will be represented by a unique combination of responses in the L-, M-, and S-cones.
If one of these cone types is absent because of a genetic defect in the corresponding opsin, the affected person will confuse certain colors that look different to visually normal individuals and is said to be color blind. It is better, however, to think of this condition as “color confusion” because the patient can still see all colors of the visible spectrum; it is the ability to distinguish certain colors that has been lost. Because the genes for the L-cone (red-absorbing) and M-cone (green-absorbing) opsins are located on the X chromosome, color blindness is more common in men. Alteration of the gene for the S-cone (blue-sensitive) pigment, which is located on an autosome, is much rarer. The inability to detect a pure red is known as protanopia, and inability to detect green is known as deuteranopia.
Macula and Fovea
At the posterior pole of the eye is a yellowish spot, the macula lutea, the center of which is a depression called the fovea centralis (Fig. 20-6). Near the fovea, the inner retinal layers become thinner and eventually disappear so that at the bottom of the foveal pit, only the outer nuclear layer and photoreceptor outer segments remain. This allows a maximum amount of light to reach the photoreceptors with optimal fidelity.
Most of the visual input that reaches the brain comes from the fovea. Cones, which are responsible for color vision, are the only type of photoreceptor present in the fovea. In contrast, rods, which are most sensitive at low levels of illumination, are the predominant photoreceptors in the periphery of the retina. The visual world is a composite formed from a succession of foveal images carrying form and color information supplemented with input from the peripheral retina carrying motion information.
RECEPTIVE FIELDS
The receptive field of a visually responsive neuron is defined as that region of the visual world in which a stimulus of the proper characteristics will influence the activity of the neuron. The influence may be either excitatory or inhibitory. Some neurons will exhibit an excitatory influence when the stimulus is in one location and an inhibitory influence when the stimulus is in a nearby location. The receptive field of a neuron is the sum of the areas in which the stimulus affects the activity of that neuron.
In the early stages of visual information processing, receptive fields have a characteristic concentric center-surround organization. The receptive field is roughly circular (Fig. 20-7). Stimuli in the center of this circle tend to evoke one type of response (e.g., depolarization), whereas stimuli in the doughnut-shaped outer rim evoke the opposite response (e.g., hyperpolarization). In later stages of visual processing, in the visual cortex, receptive field properties are more complicated.
PROCESSING OF VISUAL INPUT IN THE RETINA
Among retinal cells, only retinal ganglion cells have voltage-gated sodium channels on their axonal membranes. As a result, only ganglion cells use action potentials to carry information. So-called calcium spikes resulting from an increase in calcium permeability are seen in amacrine cells. All other retinal cells use only graded potentials to process information.
The receptive field properties of each retinal cell depend on the processing of information passing through the neurons between the photoreceptor and the retinal cell in question. For example, a bipolar cell’s response is directly related to the activity of photoreceptors and horizontal cells (Figs. 20-7 and 20-8). As with all sensory systems, the structural, electrical, and synaptic properties of the cell are reflected in receptive field properties.
[/not-level-membership-for-basic-science-category]
