[level-membership-for-pediatrics-category]Chapter 95
The Spleen
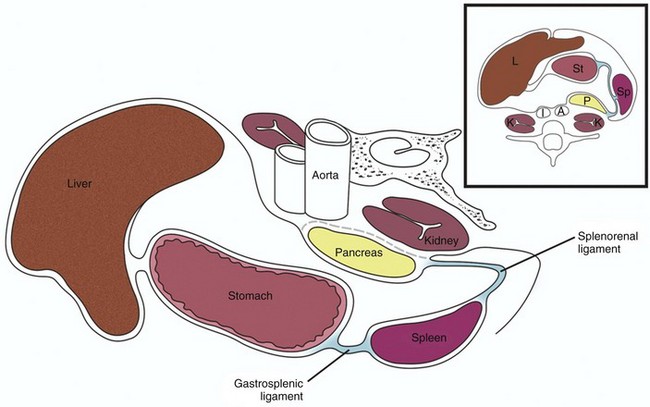
The spleen is maintained in its normal position by ligaments formed by peritoneal folds. The two major ligaments are the gastrosplenic ligament and the splenorenal ligament (Fig. 95-1). Other ligaments that help support the spleen are the phrenicosplenic, splenocolic, pancreaticosplenic, phrenocolic, and pancreaticocolic ligaments.
The spleen is the largest of the body’s lymphatic structures and the second largest organ of the reticuloendothelial system. A combination of red pulp (75%) and white pulp (25%) constitute the splenic parenchyma,1 which is surrounded by a relatively tough capsule. The red pulp is composed of the splenic cords and vascular sinuses and contains a large number of erythrocytes, whereas the white pulp is composed largely of lymphocytes and macrophages. The unique anatomy of the spleen is closely linked to its function and lends itself to some normal variations seen on computed tomography (CT) and magnetic resonance imaging (MRI). The primary function of the embryonic spleen is erythropoiesis, which is maximal in the middle of the second trimester and subsequently diminishes. The spleen is later responsible for filtering red blood cells that are aged or lack contractility, as well as antigen-coated cells, bacteria, and foreign particles. The spleen also acts as a platelet reservoir, releasing platelets in response to epinephrine or consuming platelets in case of splenomegaly.1 These functional aspects of the pediatric spleen can be evaluated scintigraphically.
Imaging
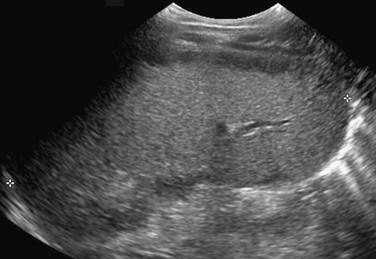
The spleen is easily identified on abdominal ultrasonography. It has a homogeneous sonographic texture, is slightly more echogenic than are the kidneys, and is isoechoic to slightly hyperechoic to the liver. The splenic hilar vessels usually are well visualized (Fig. 95-2), but intrasplenic vessels typically require color Doppler imaging for identification.
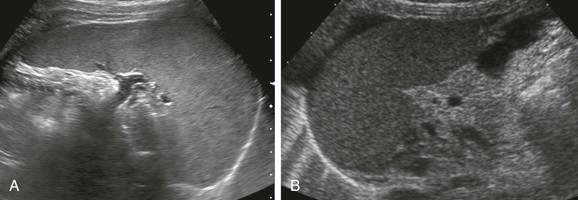
Figure 95-2 Normal spleen.
A, A normal spleen in a 15-year-old girl. A transverse ultrasound image shows normal homogeneous parenchymal echotexture and hilar vessels. B, A normal spleen in a 3-month-old infant with ascites.
On CT, the normal spleen has a higher attenuation than the liver. Transient heterogeneous splenic enhancement patterns often are encountered during the first minute of contrast-enhanced CT, particularly with the rapid bolus technique (e-Fig. 95-3). This normal phenomenon is thought to be a result of variations in blood flow through the red and white pulp of the spleen; it is more pronounced with contrast injection rates of 1 mL/sec or greater and in children older than 1 year. Common patterns of heterogeneity have been described as: (1) archiform, consisting of ring-like or zebra-stripe bands of alternating density; (2) focal areas of low density; and (3) diffuse, mottled areas of inhomogeneity.2 More uniform enhancement is seen approximately 70 seconds after initiation of the contrast injection.
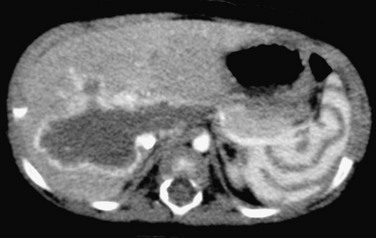
e-Figure 95-3 Contrast bolus artifact on computed tomography (CT).
An arcuate or “archiform” contrast enhancement pattern is seen in the spleen, with ringlike or zebra-stripe bands of alternating density. A CT scan with rapid bolus technique was performed to evaluate the hepatic hemangioma.
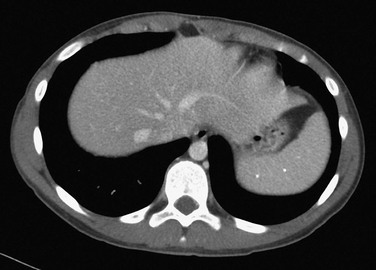
On MRI, the spleen signal intensity varies with age (Table 95-1; Fig. 95-4). In the neonate, the spleen is T1 and T2 isointense to hypointense with respect to the liver. The T2 hypointensity is because of immaturity of the white pulp. After age 8 months, the spleen is T2 hyperintense relative to the liver because of white pulp maturation, and it maintains this appearance through adulthood.3
Table 95-1
Magnetic Resonance Signal Intensity of Spleen Relative to Liver by Age
| Age | T1 | T2 |
| Neonate | Isointense/hypointense | Isointense/hypointense |
| Postneonate infant | Hypointense | Minimally hyperintense |
| >8 mo | Hypointense | Hyperintense |
| >1 yr | Hypointense | Hyperintense |
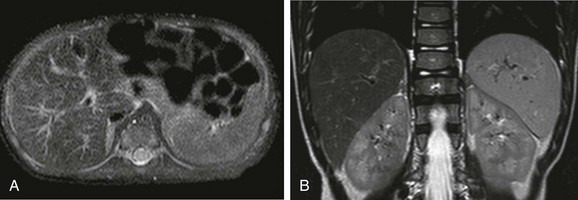
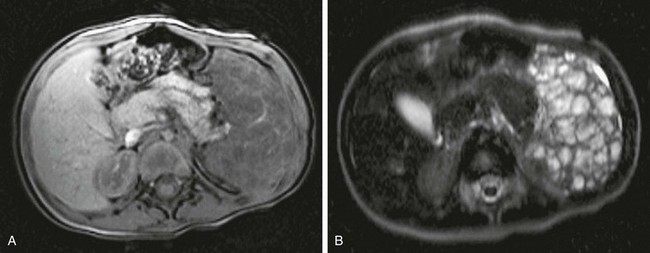
Figure 95-4 Change in spleen T2 signal with age.
A, An axial T2-weighted fat-suppressed image of the upper abdomen in a 2-month-old child shows that the spleen is nearly isointense to liver. B, An axial T2-weighted fat-suppressed image of the upper abdomen in a 4-year-old child shows hyperintensity of the spleen compared with the liver.
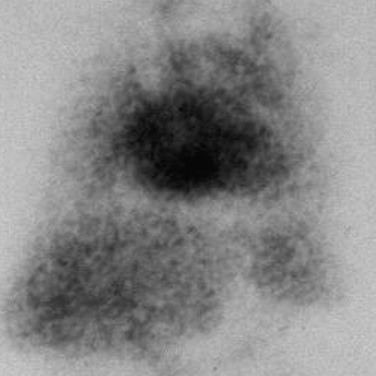
Scintigraphic splenic imaging with technetium-99m (99mTc)–labeled sulfur colloid, which is removed from the blood by the reticuloendothelial system, is useful for the identification of splenic ectopia, as well as several entities discussed later in this chapter. It is not useful in cases of heterotaxy because splenic and hepatic tissue cannot be distinguished when neither location nor shape is an identifying criterion. Similarly, selective spleen scans can be misleading when the spleen is absent (e-Fig. 95-5).
Accessory Spleens
Overview: The most common congenital anomaly of the spleen is the presence of one or more accessory spleens, or splenuli. These accessory spleens are present in 20% to 35% of postmortem examinations of the normal population4 and usually are found incidentally at autopsy or on imaging studies. They number six or fewer and are located most commonly in the splenic hilum, in association with the splenic vessels, or in the gastrosplenic ligament. However, accessory spleens can be found virtually anywhere in the abdomen. They rarely exceed 2 cm in diameter and can be confused with splenic hilar or parapancreatic lymph nodes.
Etiology: Normally, the spleen forms from the coalescence of multiple small splenic masses. Accessory spleens therefore are not uncommon.
Clinical Presentation: The presentation is incidental, when accessory spleens are found during imaging for unrelated reasons.
Wandering Spleen
Overview: A wandering spleen is a congenital anomaly that results from maldevelopment of the splenic suspensory ligaments, including the gastrosplenic, splenorenal, and phrenicocolic ligaments. Acquired cases also have been described and may be a consequence of splenomegaly, traumatic injury, or ligamentous laxity.
Etiology: Normally, during embryonic life, the residuum of the dorsal mesogastrium fuses with the posterior peritoneum, helping to support the spleen in its normal position. When this fusion does not take place, the dorsal mesogastrium may persist as a long mesentery, allowing the spleen to migrate, yielding the so-called “wandering spleen.” The most common location for the ectopic spleen is the left lower quadrant.
Clinical Presentation: The clinical presentation is variable; patients may be asymptomatic or present with a mobile mass on physical examination. More typically the presentation is an acute abdomen because of torsion of the vascular pedicle, with subsequent ischemia, impaired venous return, acute enlargement, and painful capsular tension.5
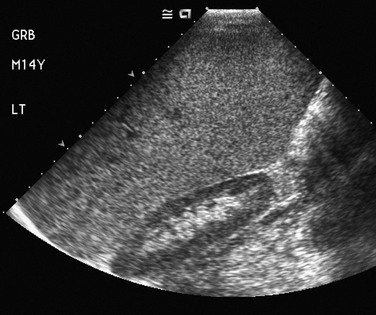
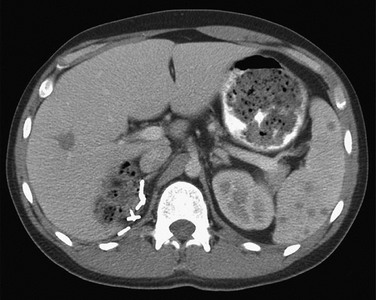
Imaging: The abnormal position and orientation of the spleen can be identified by ultrasound, CT, or radionuclide imaging. It is important to pay close attention to the abnormal orientation and location of the spleen. Typically, no splenic tissue can be identified in the left upper quadrant, although a small accessory spleen may remain in the normal anatomic location. If the spleen undergoes torsion, a “whorled” appearance of the splenic artery in the splenic pedicle has been described as a characteristic CT sign of torsion6 (Fig. 95-6, A and B). The twisted spleen has little uptake on radionuclide scintigraphy7 and no contrast enhancement on CT (Fig 95-6, C and D). Color Doppler sonography shows lack of flow in the splenic hilar vessels (Fig. 95-6, E) and also may demonstrate the whorled appearance at the splenic hilum. Because of the defective ligamentous support, gastric volvulus has been associated with a wandering spleen8 (Fig. 95-6, F).
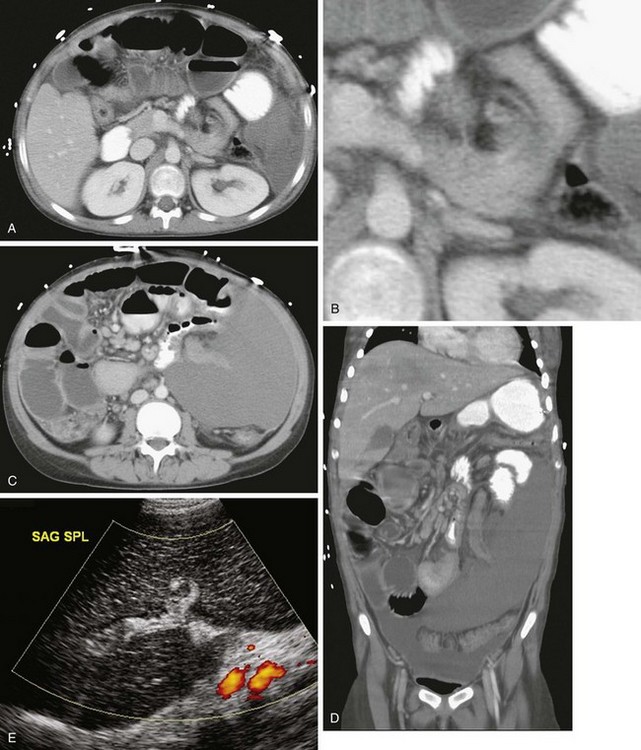
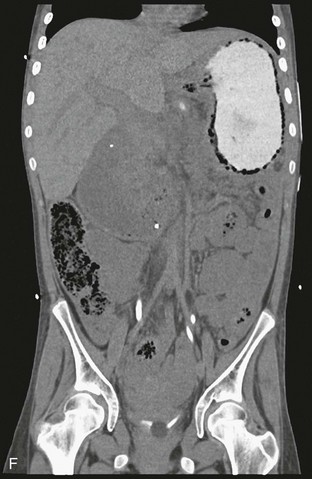
Figure 95-6 A wandering spleen in a 14-year-old girl with Niemann-Pick disease and the acute onset of abdominal pain.
A, A contrast-enhanced computed tomography (CT) image of the abdomen shows a “whorled” appearance of the splenic vessels and pancreatic tail at the expected location of the splenic hilum. The spleen shows low attenuation without contrast enhancement as a result of absent perfusion. B, A close-up view of “whorled” hilar vessels and the pancreatic tail from A. C, Below the level of A, the caudal location of the splenic mass is shown. D, Coronal reformatting underscores the displacement and abnormal orientation of the spleen and again shows lack of contrast enhancement. E, A color Doppler ultrasound image shows no vascular flow into the spleen. Also note the abnormal echotexture of the spleen. SAG SPL, Sagittal spleen. F, One year after undergoing a splenectomy, the child presented with hypotension and abdominal distention. Coronal reconstruction of abdominal CT scan performed with oral contrast reveals reversal of the usual relationship of the gastric fundus and gastric outlet, consistent with gastric volvulus. Note the gastric pneumatosis. (Courtesy Jeanne G. Hill, MD, MUSC.)
Splenogonadal Syndrome
Overview: Splenogonadal syndrome is a rare anomaly in which a portion of the spleen is conjoined with left gonadal tissue. Although this congenital anomaly is uncommon, identifying it is important because 30% to 50% of cases result in unnecessary orchiectomy because of concern that a extratesticular neoplasm may be present.10
Etiology: Splenogonadal fusion results when a portion of the splenic anlage fuses with primitive left gonadal tissue between the fifth and eighth weeks of gestation. Despite the fused splenic tissue, a normal spleen is present in the left upper quadrant. The splenogonadal fusion shows a splenic cord continuous with the ectopic, fused splenic tissue in approximately 55% of cases; it is discontinuous in approximately 45% of cases.10 Splenogonadal fusion has been reported in association with transverse testicular ectopia.11
Clinical Presentation: Splenogonadal fusion is much more common in males, with a male to female ratio of 16 : 1. The condition may be asymptomatic and discovered incidentally or at autopsy. It may be associated with left cryptorchidism, inguinal hernia, or testicular torsion, particularly when it is continuous. Multiple other anomalies may be present, particularly in the continuous type. In females, fusion of splenic tissue with the left ovary or mesovarium occurs; this connection does not result in ovarian ectopia.
Imaging: Sonography can reliably demonstrate the extratesticular location of a palpable scrotal mass in these cases. The mass is typically oval or round and of similar echotexture to the adjacent normal testis, but often it has a slightly different size or configuration (e-Fig. 95-7, A). Color Doppler sonography shows abundant vascularity in the splenic tissue (e-Fig. 95-7, B). Radionuclide imaging with 99mTc sulfur colloid adds specificity to the diagnosis by revealing radiopharmaceutical uptake in the ectopic splenic tissue either in the left hemiscrotum or in the left inguinal canal when associated with cryptorchidism. A linear pattern extending from the left upper quadrant of the abdomen to the pelvis or scrotum may be detected in the continuous type (e-Fig. 95-7, C).
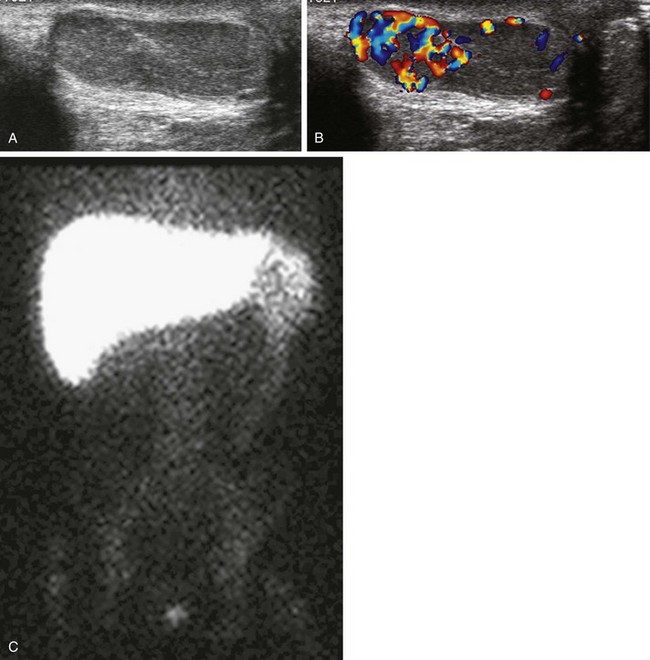
e-Figure 95-7 Splenogonadal fusion in a boy with a painless left scrotal mass.
A, A longitudinal ultrasound image of the left hemiscrotum reveals round-shaped splenic tissue cephalad to the testicle, similar in echotexture and fused to the more oval-shaped testis below. B, A color Doppler image shows increased vascularity of the splenic tissue compared with that of the testicle. C, A technetium-99m sulfur colloid liver-spleen scan shows radiopharmaceutical uptake in the spleen in the left upper quadrant and in the left hemiscrotum; note continuous radiopharmaceutical uptake within the persistent cord of tissue connecting the spleen with the left testis. (Courtesy A. Schlesinger, MD, Houston, TX.)
Although it is not the imaging modality of choice, contrast-enhanced CT may reveal a rounded, enhancing, well-circumscribed soft tissue mass in the left hemiscrotum or left hemipelvis that may or may not continue cephalad toward the spleen.12 MRI is useful to obtain further detail.11
Splenorenal Fusion
Overview: Splenorenal fusion is a rare developmental anomaly in which congenital fusion of splenic and renal tissue is present. Fusion usually involves the left kidney and rarely the right kidney.13,14 Unlike posttraumatic splenosis, patients with congenital splenorenal fusion demonstrate an intact spleen with a separate blood supply. Recognition of this anomaly is important to prevent an unnecessary nephrectomy for a presumed malignancy.
Etiology: One theory to explain the origin of this anomaly is that fusion of the mesogastrium and left posterior peritoneum brings the splenic anlage and the left mesonephric ridge in close proximity during the eighth week of gestation, allowing the two organs to fuse as they migrate toward the pelvis.15 Alternatively, it is postulated that splenic cells could migrate caudally to reach the metanephros and retroperitoneum, where there is no barrier to crossing the midline; this theory would explain reported right-sided fusion anomalies.13 Splenorenal fusion also may be acquired from posttraumatic or postsplenectomy splenosis, where splenic tissue implants on the kidney and regrowth occurs.14,15
Clinical Presentation: The condition may present incidentally on imaging, or it may cause symptoms as a result of the effect of the mass or hypersplenism, manifesting as anemia and thrombocytopenia.
Imaging: Conventional imaging with ultrasound, CT, or MR typically will not reliably distinguish this entity from a renal or retroperitoneal malignancy. When suspected, the diagnosis can be made reliably with 99mTc sulfur colloid imaging, or, in the case of hypersplenism, with 99mTc-labeled, heat-damaged red blood cell imaging.
Abnormal Visceroatrial Situs
Overview: Abnormal visceroatrial situs is a spectrum of abnormalities related to isomerisms of the atrial appendages, which typically involve abnormalities of the spleen. The normal visceroatrial anatomy is known as “situs solitus,” which means “usual position.” “Situs inversus” refers to mirror-image visceroatrial anatomy. Patients with situs inversus frequently are asymptomatic, although they have a slightly higher incidence of congenital heart disease than do patients with situs solitus. “Situs ambiguous,” also called “visceroatrial heterotaxia,” refers to deranged visceroatrial asymmetry. Patients with this abnormality are divided into two major groups: those with a tendency toward right-sided symmetry and those with a tendency toward left-sided symmetry. Therefore each patient, within broad categories, has a unique constellation of anatomic findings that must be evaluated and described individually.16,17 Recognition of the spectrum of situs anomalies and the altered anatomy is important because of the increased risk in these children for anomalies such as congenital heart disease, malrotation with potential for development of midgut volvulus, and immunodeficiency in patients with asplenia.16,18–20
Etiology: Although the external human features are largely symmetric, asymmetry is characteristic of viscerovascular anatomy. In patients with heterotaxy, although it is not yet not fully understood, derangement of embryonic left-right recognition at the molecular level is present, which relates to abnormalities in ciliary movement, planar cell polarity, asymmetric gene cascades, and genes that generate a barrier for specific gene products to cross the embryonic midline. Underlying causative mechanisms include teratogenic exposures and genetic factors.21–27
Clinical Presentation: Patients with right-sided atrial isomerism typically have asplenia, which is associated with immune deficiency and overwhelming sepsis, particularly as a result of Streptococcus pneumoniae.28 The ambiguous atrium resembles the right atrium, and severe congenital cardiac lesions typically are present, usually with diminished pulmonary blood flow and often with associated total anomalous pulmonary venous return with or without obstruction. Patients thus will present with cyanosis and/or pulmonary edema.16,17 Despite modern palliative procedures, mortality remains high, with 5-year survival reported at 20%, regardless of whether the diagnosis is made before or after birth.27,29 Intestinal malrotation is common.
Patients with left-sided atrial isomerism typically have multiple splenules, known as polysplenia. Congenital heart disease often is present, although some patients with polysplenia are asymptomatic, and the diagnosis may be made incidentally.30 In a study of a large series of people with left atrial isomerism, approximately 14% of patients had a normal heart and presented with extracardiac abnormalities. This condition is associated with biliary atresia in as many as 10% of patients.31 Intestinal malrotation is common.
Imaging: In patients with situs ambiguus, plain radiographs may denote abnormal situs, with discordance of heart, stomach, and liver position. On chest radiographs, patients with right-sided atrial isomerism may demonstrate bilateral right lungs with identification of the minor fissure and eparterial bronchi. Patients with left-sided isomerism, on the other hand, may demonstrate bilateral left-sided hila with hyparterial bronchi. However, hilar anatomy often is not clear because of overlying thymus. The plain film appearance may be indistinguishable from normal and falsely suggest situs solitus in some patients.32
Ultrasound, CT, and MRI confirm absence of the spleen in the vast majority of patients with right-atrial isomerism and may identify other anomalies such as horseshoe adrenals fused in the midline (e-Fig. 95-8).33,34 Subdiaphragmatic total anomalous venous connections are easily identified, because the anomalous vessel courses anterior to the esophagus into the abdomen.16 The inferior vena cava (IVC) is nearly invariably present and may lie to the right or left of the aorta, crossing the midline anterior to the aorta to enter the atrium, if necessary.16,32
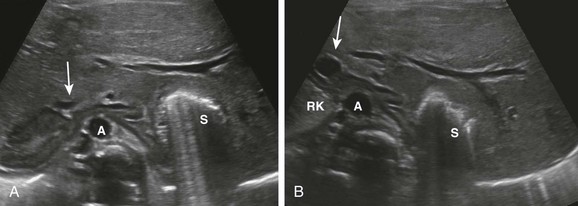
e-Figure 95-8 Horseshoe adrenal in asplenia.
Initial ultrasound evaluation of 1-day-old infant with congenital heart disease and asplenia. A, A transverse image through the upper abdomen shows the adrenals fused across the midline anterior to the aorta (A), which is located just to the right of the midline. Gas from the left-sided stomach (S) obscures a portion of the left adrenal gland. Note the right-sided inferior vena cava (IVC) anterior to the right adrenal gland (arrow). B, At a slightly lower level, adrenal fusion is again seen. The adrenal on the right is seen between the upper pole of the right kidney (RK) and the IVC (arrow), anterior to the aorta (A). Note the extension of the liver into the left upper quadrant around the stomach (S). (Courtesy Marta Hernanz-Schulman, MD, Nashville, TN.)
In patients with left-sided atrial isomerism, because splenic tissue develops in the dorsal mesogastrium,25 ultrasound, CT, and MRI will identify the splenules dorsal to the stomach along the greater curvature, whether the stomach lies on the left or the right.16 The appearance of the splenules is variable and ranges from a conglomerate of multiple splenules to a sometimes septated, largely single splenic mass (Fig. 95-9 and e-Fig. 95-10). Interruption of the intrahepatic IVC is seen at least 50% of patients, with either right- or left-sided azygous continuation.16 When the IVC is present, it may lie to the right or left of the aorta. A preduodenal portal vein may be seen. In patients presenting with biliary atresia, it is important to evaluate the continuity of the IVC and the course of the portal vein, because these vascular derangements are important in patients who are later referred for liver transplantation.
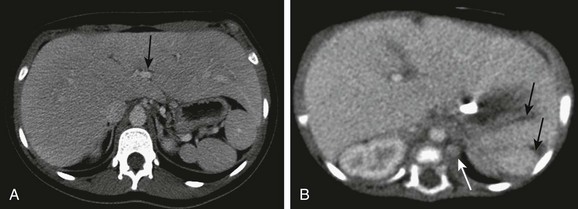
Figure 95-9 Polysplenia.
A, Multiple splenules are present in the left upper quadrant, behind the stomach. Note the midline liver. The inferior vena cava (IVC) is intact, located to the right of the aorta. Note the midline liver, centrally located portal vein (arrow), which was noted to be preduodenal on lower sections. B, A 2-month-old infant with complex congenital heart disease and single ventricle anatomy. Note two splenules (arrows) in the left upper quadrant behind the stomach, and the left-sided azygous continuation of the interrupted IVC. The left azygous vein drained into the left-sided superior vena cava. (A, Courtesy Marta Hernanz-Schulman, MD, Nashville, TN.)
Treatment: Treatment is individualized on the basis of the associated anomalies. Patients with asplenia are at risk for sepsis and need to be treated for immunodeficiency. Patients with congenital heart disease or gastrointestinal anomalies of midgut malrotation and biliary atresia typically require surgical correction.
Splenomegaly
Overview: Splenomegaly refers to enlargement of the spleen, usually as a result of excessive destruction of abnormal blood cells, excessive antigenic stimulation, storage or infiltrative disorders, or portal venous congestion. Hypersplenism, in contrast, refers to the syndrome of sequestration by the enlarged spleen of blood cell lines, particularly platelets.
Etiology: The spleen may become enlarged in several inherited conditions (Box 95-1). The hemolytic anemias frequently cause splenomegaly, with hereditary spherocytosis, hereditary elliptocytosis, and thalassemia being the most common. Sickle cell anemia initially leads to splenomegaly, followed by splenic atrophy as a result of multiple infarcts; the pathophysiology is sequestration of impaired red blood cells by the spleen, leading to splenomegaly, anemia, and thrombocytopenia.
Splenomegaly is observed in neonates who have undergone extracorporeal membrane oxygenation cannulation. The proposed mechanism is sequestration of damaged blood cells in the extracorporeal membrane oxygenation circuit.35
Clinical Presentation: Patients with splenomegaly present with the signs and symptoms of the underlying condition. Acute splenic sequestration crisis is manifested clinically by sudden enlargement of the spleen and a rapid decrease in the hematocrit level. This condition typically occurs in young children, with 76% of episodes occurring before 2 years of age. Clinically the episode can manifest emergently, with hypovolemic shock potentially progressing to death within a few hours.36 The condition is rare beyond age 8 years as a result of the development of splenic fibrosis. Once a child has a sequestration crisis, a higher risk of recurrence exists.
Imaging: Plain radiographs of the abdomen may reveal an enlarged spleen in the left upper quadrant, displacing the stomach medially and the colon inferiorly.
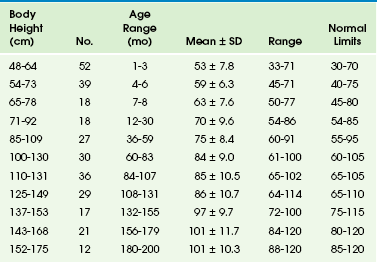
Ultrasound allows ready detection of splenomegaly. Splenic measurements are readily determined using the coronal imaging plane with the splenic hilum in view. The upper limit of normal at age 15 years and older is 12.0 cm for girls and 13.0 cm for boys.37 More recently, several other authors have investigated normal spleen size with sonography in larger cohorts of pediatric patients, with similar results.38–41 These authors all found a strong correlation between spleen length and body height (Tables 95-2 and 95-3). In a study of 712 children aged 7 to 15 years, investigators correlated splenic measurements with age, sex, body weight, height, body surface area, and body mass index.42 The authors found the strongest correlation with body weight and determined a predicted spleen length according to the following formula: 69.875 + BODY WEIGHT [kg] × 0.371. Another group determined that a normal splenic measurement should not exceed 1.25 times the length of the left kidney.41 As a general rule, the tip of the spleen should not extend below the inferior pole of the left kidney (e-Fig. 95-11).
Table 95-2
Spleen Length in Children and Adolescents*
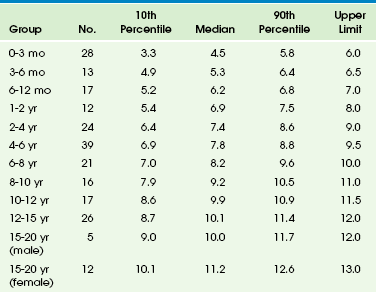
*All measurements are in centimeters. Upper limits are the next highest whole integer over the 90th percentile.
From Rosenberg HK, Markowitz RI, Kolberg H, et al. Normal splenic size in infants and children: sonographic measurements. AJR Am J Roentgenol. 1991;157:119-121.
Table 95-3
Length of Spleen in Children vs. Body Height and Age*
*All measurements are in centimeters.
From Konus OL, Ozdemir A, Akkaya A, et al. Normal splenic size in infants and children: sonographic measurements. AJR Am J Roentgenol. 1998;171:1693-1698.
e-Figure 95-11 Splenomegaly in a 14-year-old boy with anemia.
A coronal ultrasound image shows that the spleen extends below (caudad to) the lower pole of the left kidney.
CT and MRI also readily reveal an enlarged spleen and may allow for more standardized and reproducible measurement. Spleen volume can be readily measured with CT or MRI. CT measurements of normal pediatric spleen volume correlate with body weight in a linear relationship.43
The imaging findings are nonspecific as to cause unless evidence exists of extramedullary hematopoiesis or infarcts or ancillary findings are identified, such as varices in patients with congestive splenomegaly (Fig. 95-12). Extramedullary hematopoiesis may demonstrate focal areas of increased echogenicity on sonography, whereas infarcts may appear as hypoechoic areas. The storage diseases generally cause nonspecific splenomegaly,44 but Gaucher disease may lead to focal hypoechoic foci, reflecting collections of Gaucher cells.45 The focal collections occasionally may be hyperechoic as a result of fibrosis.
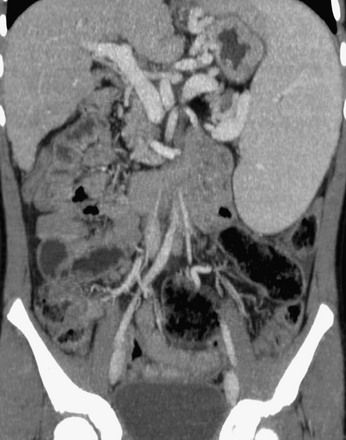
Figure 95-12 Splenomegaly as a result of portal hypertension in an 11-year-old girl with liver disease.
Coronal reconstruction of a contrast-enhanced computed tomography scan of the abdomen shows splenic extension to the left lower quadrant. Multiple variceal collaterals are depicted clearly.
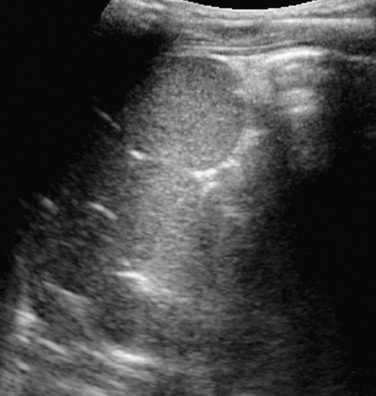
In patients with sickle cell anemia who are experiencing an acute sequestration crisis, hypoechoic splenic lesions can be seen peripherally on sonography (Fig. 95-13) as a result of hemorrhage or infarction. Low attenuation lesions are demonstrated on contrast-enhanced CT; they typically are peripheral in location, with intervening areas of hemorrhage. T2-weighted MR sequences reveal that these lesions are markedly hyperintense.46
Treatment: Treatment of splenomegaly is directed at the underlying cause. Splenectomy is used sparingly in children. A partial splenectomy can be performed laparoscopically or via interventional radiology selective transarterial embolization.
The long-term management of sequestration syndrome in patients consists of increased awareness of symptoms (primarily worsening anemia) and signs (an enlarging spleen) and, in some cases, short-term chronic transfusion; a splenectomy may be required.36 In most patients with sickle cell disease, splenic function is diminished because of splenic infarcts, and autosplenectomy is frequent by age 5 to 6 years. Transfusion has been shown to transiently reverse hyposplenia, and hypertransfusion programs have documented splenic regrowth and reversal of functional hyposplenia.47–49 Bone marrow transplantation has demonstrated recovery of splenic function in children with sickle cell disease.50
Infectious Diseases
Overview: Splenic abscesses are uncommon lesions that are rare in the pediatric population.51 Involvement of the spleen in systemic infectious disease is most common in immunocompromised patients, with increasing incidence as a result of the increased use of steroids and chemotherapeutic agents.52 Bacterial, fungal, and granulomatous agents frequently are involved. Splenic involvement also can occur in immune-competent hosts with cat scratch disease, granulomatous diseases such as histoplasmosis, parasitic diseases such as echinococcus, and viral infections. Viral infections, including infectious mononucleosis, are more likely to cause nonspecific splenomegaly as a result of reactive hyperplasia of the spleen’s reticuloendothelial tissue.
Etiology: Bacterial splenic abscesses can develop via several routes, which include hematogenous spread, such as in subacute bacterial endocarditis or cat scratch disease; spread from a contiguous infection, such as pancreatitis or perinephric abscess; and seeding in a spleen compromised by infarction or trauma.
Clinical Presentation: Symptoms can be nonspecific and may be related to the systemic illness or splenomegaly. Patients may present with fever, lethargy, and weight loss. Abdominal distension, tenderness, and leucocytosis often are found.51 Cat scratch disease, a relatively common infection in children, is caused by Bartonella henselae and typically presents with fever and tender lymphadenopathy.
Imaging: Imaging has an important role in diagnosis, because signs and symptoms can be nonspecific. Early diagnosis and prompt treatment are critical to decrease mortality and morbidity.
Splenic abscesses can be solitary, multiple, or multilocular, depending on the source of infection. Microabscesses are seen most commonly, especially with a fungal infection such as candidiasis. If they are large enough, the microabscesses may be seen on sonograms,53 contrast-enhanced CT, or MRI (Fig. 95-14); CT may be more sensitive than ultrasound in detecting candidal infection.54 Larger, solitary abscesses also may occur with candidiasis. They may be seen as hypoechoic areas on ultrasound, as low-attenuation areas on CT, and as T2-hyperintense lesions without peripheral enhancement.55 In rare instances, calcification may be seen on CT.
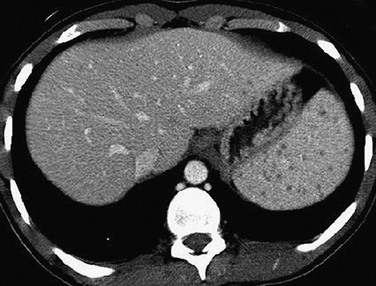
Figure 95-14 Candidiasis in an immune-suppressed child.
A contrast-enhanced computed tomography scan of the abdomen shows multiple tiny, low-attenuation lesions diffusely distributed in the spleen. Two additional lesions are seen medially in the liver.
MRI can be used for the evaluation of microabscesses, which eliminates ionizing radiation exposure but may require patient sedation. MRI demonstrates a high diagnostic accuracy for hepatosplenic fungal disease detection56 and likely surpasses CT in its ability to detect small fungal lesions.55
In persons with cat scratch disease, ultrasound may show hypoechoic lesions ranging from well-defined and homogeneous to indistinct and heterogeneous, whereas contrast-enhanced CT may show hypoattenuating lesions, isoattenuating lesions, or lesions with marginal enhancement (Fig. 95-15). On MRI, lesions demonstrate low signal intensity on T1-weighted sequences and high signal intensity on T2-weighted sequences.57–59
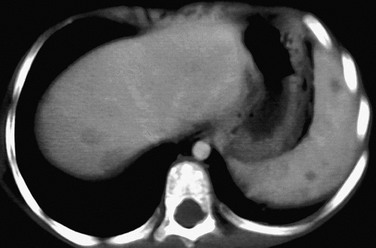
Figure 95-15 Cat scratch fever in a child with fever and abdominal pain.
A contrast-enhanced computed tomography scan reveals several well-circumscribed, round and oval, low-attenuation lesions in the spleen. Similar larger foci are seen in the liver. (Courtesy Sharon M. Stein, Nashville, TN.)
Hydatid cysts may demonstrate calcifications, which can be visible on plain films. The cysts generally are anechoic, although the presence of daughter cysts and membranes may manifest with septations and internal echoes. CT shows a focal lesion of lower attenuation than the surrounding splenic tissue, and it is the best modality to show rim calcification.60
Tuberculosis, histoplasmosis, and coccidioidomycosis may produce multiple splenic granulomas, which almost always are associated with diffuse organ involvement as a result of hematogenous spread (e-Fig. 95-16). Splenic granulomas also may be detected in patients with chronic granulomatous disease of childhood.
Treatment: When results of imaging studies are normal and candidiasis is suspected, laparoscopy is recommended to obtain a histopathologic diagnosis. Laparoscopy is justified by the risk of failure to diagnose and start appropriate therapy and by the potential adverse effects of empiric amphotericin B therapy. A needle biopsy may result in false-negative results because the fungal elements are difficult to isolate.53 Cat scratch disease is usually self-limited and typically does not require antibiotic therapy.
Benign Cysts and Neoplasms
Several classification schemes have been proposed to reflect the etiology, histology, and gross anatomic appearance of splenic cysts.61,62 These classifications typically differentiate between parasitic and nonparasitic splenic cysts but further differentiate nonparasitic splenic cysts into two categories: (1) “true” (primary) and (2) “pseudocysts” (secondary), based on the presence or absence of epithelium. In these schemes, pseudocysts largely are ascribed to antecedent trauma. A more recent classification63 modified for the pediatric population64 proposes that nonparasitic splenic cysts with mesothelial, transitional, or epidermoid epithelial linings are congenital in origin, with antecedent history of trauma only incidental. These authors posit that many cysts labeled posttraumatic pseudocysts are actually congenital and have lost their epithelial lining or become desquamated after intracystic hemorrhage as a result of repeated trauma, infarct, or intrasplenic hemorrhage.65 This phenomenon results in a “shaggy, hemorrhagic interior, which is totally different from the glistening, shiny white interior of a typical nonparasitic splenic cyst.”63,64 Both gross and microscopic features should be evaluated to discriminate between a posttraumatic pseudocyst and a hemorrhagic congenital cyst.
Overview: Epidermoid cysts are the most common noninfectious focal space-occupying lesions of the spleen, accounting for approximately 10% of all nonparasitic splenic cysts worldwide. Familial occurrence of epidermoid cysts has been reported.66,67
Etiology: These cysts are thought to be either congenital or posttraumatic, as previously discussed.
Clinical Presentation: Splenic cysts frequently are discovered incidentally on physical examination or during imaging after abdominal trauma. However, sufficiently large cysts can present as splenomegaly, renal compression with hypertension, varicocele, or complications such as peritonitis, intracystic hemorrhage, or rupture. Some patients may present with pain in the abdomen or left shoulder.63
Imaging: Epidermoid cysts frequently are large enough to visibly enlarge the spleen on plain radiographs; they are seen as a left upper quadrant mass displacing the stomach and colon (Fig. 95-17, A). A rim of calcification may be seen. On ultrasound, the cysts are characteristically anechoic and sharply demarcated from the surrounding normal splenic tissue. However, hemorrhage, inflammatory debris, or internal fat droplets may cause the cyst to contain internal echoes, at times resembling a hypoechoic solid mass (Fig. 95-17, B). Real-time scanning may show movement of the internal material, and Doppler interrogation reveals no internal blood flow. Liver-spleen scintigraphy demonstrates a focal photopenic defect. On CT and MRI, an uncomplicated epidermoid cyst appears as a rounded, sharply demarcated, nonenhancing mass with cystic imaging characteristics (Fig. 95-17, C and D). If it is complicated by hemorrhage, the internal signal intensity of the lesion on MRI reflects the chemical state of the hemoglobin within it. Calcifications are best identified on CT. Posttraumatic cysts may be difficult to distinguish radiologically from other cysts, but they may have irregular walls and internal echoes from debris.
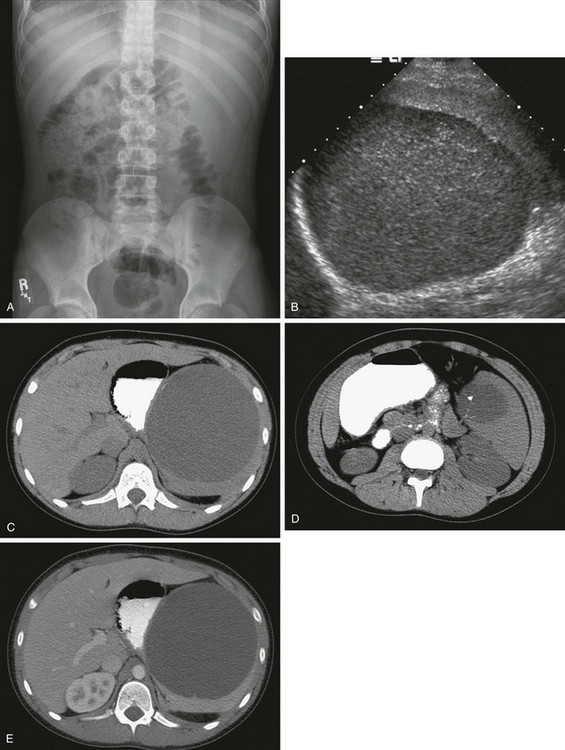
Figure 95-17 A 12-year-old boy with an epidermoid cyst.
A, A left upper quadrant mass was discovered incidentally on a plain film obtained during the workup of hematuria. B, A sagittal ultrasound image of the spleen shows a large, well-circumscribed lesion with internal echoes. C and D, Computed tomography (CT) images without intravenous contrast show the intrasplenic cyst with focal, punctate calcification. E, A CT scan after intravenous administration of contrast material shows a well-circumscribed, nonenhancing mass of fluid attenuation enlarging and distorting the spleen and displacing the stomach medially. (Courtesy Henrique Lederman, MD, Sao Paulo, Brazil.)
Hemangiomas
Overview: Splenic hemangiomas are the most common primary neoplasm of the spleen when all ages are considered.69–72 Hamartomas are considered to be slightly more common in children.73
Etiology: Splenic hemangiomas, which arise from the sinusoidal epithelium, are likely congenital in origin. Histologically they contain a proliferation of vascular channels lined with a single layer of epithelium.69 They may be single, multiple, or may occur as part of a generalized angiomatosis.72
Clinical Presentation: Most splenic hemangiomas in children are asymptomatic, although larger lesions have the possibility of rupture or the development of hypersplenism.73,74
Imaging: The lesions are predominantly solid but may show cystic components. On ultrasound, the solid lesions are typically well marginated with variable echogenicity and internal vascular flow. Calcifications may be seen.69 On noncontrast CT, hemangiomas are well-defined hypoattenuating or isoattenuating masses with contrast enhancement.69,70,72 On MRI, splenic hemangiomas are hypointense to isointense on T1-weighted images and hyperintense on T2-weighted images. Variable enhancement patterns can be seen after administration of contrast material.72
Hamartomas
Overview: Hamartomas, also known as splenomas or nodular hyperplasia of the spleen, are rare, nonneoplastic malformations of the spleen, with an incidence of 3 in 200,000 splenectomies.75
Etiology: It is proposed that splenic hamartomas result from “remote ischemic or infectious/inflammatory and reparative injury to the spleen.”76 Gross pathologic inspection reveals that they are bulging, spherical masses of dark red tissue resembling adjacent spleen parenchyma, with no surrounding capsule. Histologically, splenic hamartomas are composed of splenic sinusoidal tissue with no lymphoid follicles (red pulp) and display variable chronic inflammation with macrophages, lymphocytes, plasma cells, extramedullary hematopoietic cells, fibrosis, hemosiderosis, and calcification.69,76
Clinical Presentation: Most patients are asymptomatic, and the lesion is found incidentally; if it is large, the potential exists for rupture and hemoperitoneum. Many patients have associated hematologic abnormalities, including anemia, thrombocytopenia, or pancytopenia.76 Hamartomas may occur in association with tuberous sclerosis and hamartomas elsewhere, as well as with hematologic conditions, including refractory microcytic anemia, sickle cell anemia, hereditary spherocytosis, and dyserythropoietic hemolytic anemia.76
Imaging: Because they are composed of splenic tissue, hamartomas may not be detected with ultrasound unless they alter the contour of the spleen, producing a focal bulge. Hamartomas that are identified by ultrasound are most commonly well-circumscribed, solid and homogeneous, or partly cystic and heterogeneous. They have variable echogenicity.69,77–79 The variety of described morphologic patterns is likely derived from the preponderant growth of one or another of several histologic components. Hamartomas typically reveal increased blood flow on Doppler interrogation.69
On CT, splenic hamartomas show similar or decreased attenuation relative to spleen on precontrast images, and they show dense and prolonged enhancement after administration of intravenous contrast material.75 Hamartomas are isointense to normal splenic parenchyma on T1-weighted MRI, heterogeneously hyperintense on T2-weighted images, and demonstrate diffuse heterogeneous enhancement on postcontrast imaging, with more uniform enhancement on delayed images.52,72 On 99mTc sulfur colloid scintigraphy, they may have radiopharmaceutical uptake greater than that in the surrounding normal spleen.77
Lymphatic Malformations
Overview: Lymphatic malformations are rare, benign tumors that are diagnosed in children more commonly than in adults. They may be single or multiple and may cause splenic enlargement. Splenic lymphangiomatosis usually is associated with lymphangiomas found elsewhere; thus it has been recommended that if splenic lymphangiomas are identified, the diagnostic search should be extended beyond the spleen.69
Etiology: It is believed that splenic lymphatic malformation may represent a hamartomatous versus neoplastic lesion or a congenital developmental defect as part of the spectrum of cystic hydroma.69
Clinical Presentation: Clinical manifestations range from an asymptomatic incidental finding to a large, symptomatic mass that may cause symptoms from compression of adjacent structures. Specific symptoms include left upper quadrant pain, nausea, and abdominal distension.69 Larger lesions may cause bleeding, consumptive coagulopathy, hypersplenism, and portal hypertension.69 Diagnostic evaluation should include extrasplenic organs; multiple-organ involvement indicates lymphangiomatosis, with possible involvement of the liver, pericardium, mediastinum, lung, and bone.
Imaging: On ultrasound, CT, and MRI, lymphatic malformations are most commonly septated, nonenhancing cystic lesions. Although typically anechoic on ultrasound, they occasionally may demonstrate internal echoes as a result of hemorrhage or infection. On CT they appear as single or multiple thin-walled, low-density masses with sharp margins in the subcapsular regions, and they demonstrate no significant contrast enhancement. Curvilinear mural calcifications may be present. The cysts generally have low signal intensity on T1-weighted images and high signal intensity on T2-weighted images (e-Fig. 95-18); however, they may have high signal intensity on T1-weighted images as a result of internal hemorrhage or proteinaceous fluid. Lymphatic malformations often involve the capsule and trabeculae of the spleen, where lymphatics are concentrated. In cases of lymphangiomatosis, the spleen may be diffusely replaced by expanding lesions.
e-Figure 95-18 Splenic lymphangiomas in an 18-month-old girl with massive splenomegaly and multiple lymphangiomas.
A, A T1-weighted magnetic resonance (MR) image shows numerous lesions of low signal intensity diffusely involving the splenic parenchyma. B, On a T2-weighted MR image, the lesions have high signal intensity. (Courtesy Jeanne G. Hill, MD, MUSC.)
Peliosis
Overview: Peliosis is an uncommon entity that is characterized by multiple blood-filled spaces without an endothelial lining; it typically is associated with peliosis hepatis.69
Etiology: Peliosis consists of multiple blood-filled spaces within the spleen and is associated with hematologic disorders, use of anabolic steroids, and cachexia.
Clinical Presentation: Many cases of peliosis are asymptomatic and discovered incidentally; however, if peliosis occurs along the periphery of the spleen, the potential exists for rupture and hemoperitoneum.80,81 Cases of life-threatening intraperitoneal hemorrhage have been reported.82
Imaging: On ultrasound, splenic peliosis may reveal an echogenic mass with poorly defined foci of varying echogenicity.69 The condition also may demonstrate multiple well-defined hypoechoic lesions of varying size and occasionally fluid-fluid levels within the nodules. On CT, splenic peliosis appears as multiple lesions of low attenuation without calcification.83
Malignant Neoplasms
Acute Leukemia
Overview: Leukemia is the most common form of childhood malignancy. It results from an accumulation of abnormal white blood cells in the bone marrow, liver, spleen, skin, or central nervous system. Acute lymphocytic leukemia (ALL) is significantly more common than acute myelogenous leukemia and accounts for approximately 75% of all childhood leukemias. Chronic myeloid leukemia constitutes the remaining childhood leukemias.84,85
Etiology: The etiology of childhood leukemia is unclear. Epidemiologic studies have evaluated various risk factors for the development of childhood leukemias, including environmental, genetic, and infectious risk factors. Ionizing radiation is the only environmental risk factor that has been significantly linked to ALL or acute myelogenous leukemia.86
Clinical Presentation: The clinical diagnosis of acute leukemia typically is made by physical examination, where lymph node, liver, or spleen enlargement may be detected, as well as evaluation of the blood count and peripheral smear. ALL and other childhood leukemias usually are accompanied by splenomegaly as a result of diffuse infiltration of the spleen. Chronic myelogenous leukemia is rare in children but frequently is accompanied by massive splenomegaly.
Imaging: Imaging studies of the spleen are rarely performed in children with leukemia because the diagnosis is made by other means, and the results of splenic imaging have no impact on staging or prognosis. Moreover, organ function is usually preserved, even with massive leukemic infiltration. However, the spleen often is involved during the hematologically active stages of acute pediatric leukemia, and it frequently serves as a sanctuary site during hematologic remission. Ultrasound may be useful in detecting occult visceral involvement and relapse, monitoring tumor response to chemotherapy, and assessing the complications of chemotherapy. In one retrospective study, sonograms were reviewed and correlated with clinical, hematologic, and autopsy studies. Patterns of organ involvement included hepatosplenomegaly (41%), isolated splenomegaly (20%), and panorganomegaly (16%). Altered internal splenic architecture was demonstrated in all cases.87
Lymphoma
Overview: Accurate imaging of splenic lesions is critically important in children with lymphoma because it can alter staging, treatment protocols, and overall prognosis. Additionally, other nonmalignant conditions may mimic tumor involvement and lead to an erroneous diagnosis.
Etiology: Pediatric lymphoma is a heterogeneous group of malignancies that are derived from the immune system and characterized by enlargement and proliferation of lymph nodes and secondary lymphoid tissues. The spleen is affected in 20% of patients with non-Hodgkin lymphoma (NHL), whereas the spleen is involved in 30% to 40% of persons with Hodgkin disease (HD) at presentation.88 Organ size should not be used to assess splenic involvement, because the spleen can be normal in size with tumor infiltration, and it may be enlarged without neoplastic involvement.
Clinical Presentation: Clinical presentation varies according to the underlying lymphoma, with splenic involvement diagnosed during physical examination or at subsequent imaging.
Imaging: NHL often has a similar appearance to leukemic infiltration but also may have focal lesions large enough to be seen on ultrasound as ill-defined hypoechoic areas, especially in patients with a high-grade malignancy at histologic examination. On CT, the low-attenuation lesions do not show appreciable contrast enhancement compared with adjacent parenchyma. HD also can cause diffuse splenic infiltration that may or may not be detectable as focal splenic masses. If the only subdiaphragmatic site of involvement is the spleen, detection in the spleen is important for purposes of staging and prognosis.52 However, ultrasound, CT, and MRI can result in false-negative examinations because these modalities depend on morphologic changes of enlargement or discrete nodules to detect lymphomatous involvement, whereas the imaging tissue characteristics of splenic lesions in persons with HD lesions may be similar to those of normal spleen when it is diffusely infiltrated.52,89
Metabolic imaging with fluorine-18 (18F) fluorodeoxyglucose (FDG) positron emission tomography (PET) is superior to ultrasound, CT, and MRI in identifying splenic involvement with lymphoma and detecting active disease (Fig. 95-19). 18F-FDG PET/CT detects lymphomatous involvement of the spleen by identifying elevated glucose metabolism in tumor cells, regardless of whether gross morphologic changes have occurred. A meta-analysis reported sensitivity and specificity of 18F-FDG PET for the initial staging and restaging of NHL and HD as 90.3% and 91.1%, respectively.90 18F-FDG PET/CT is superior to separate CT and 18F-FDG PET in the staging and restaging of lymphoma, and it is the study of choice for staging and follow-up of HD and aggressive NHL.89,91
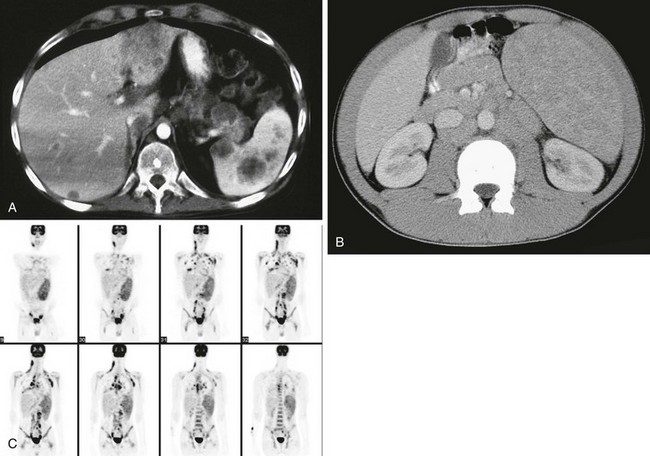
Figure 95-19 A, A contrast-enhanced abdominal computed tomography (CT) scan in a 19-year-old with multiple episodes of relapsing disease and new left upper quadrant pain.
The examination reveals multiple large, round, hypodense, nonenhancing masses in the spleen. Note additional foci of disease in the liver. B, Contrast-enhanced CT performed as part of a staging evaluation in a 14-year-old boy with Hodgkin disease shows splenomegaly with numerous low-attenuation lesions throughout the spleen. C, Coronal images from 1a fluorine-18 fluorodeoxyglucose (FDG) positron emission tomography examination of a 15-year-old reveal marked enlargement of the spleen with moderate to marked increased FDG uptake. Note also nodal disease in the neck, supraclavicular regions, mediastinum, lungs, porta hepatis, retroperitoneum, iliac and inguinal regions, and the bone marrow.
Littoral Cell Angioma
Overview: A littoral cell angioma is an uncommon tumor characterized by anastomosing vascular channels that may anastomose with normal splenic sinuses at the interface with normal parenchyma; some cases have demonstrated malignant features.92 The lesion can occur at any age, but it is more common in adults than in children.69,93
Clinical Presentation: Patients may present with splenomegaly, thrombocytopenia, and systemic symptoms. This entity presents as multiple lesions within an enlarged, heterogeneous spleen. The diagnosis should be considered in cases of multiple splenic lesions and hypersplenism.
Imaging: Littoral cell angiomas are heterogeneously hypoechoic on ultrasound and initially are of low attenuation on CT but typically become progressively isodense on delayed images after contrast enhancement.69,93 On MRI, the lesions are well circumscribed and are predominantly T1 hypointense. On T2-weighted images, they may appear hyperintense or they may remain hypointense against the normal bright spleen parenchyma, presumably because of hemosiderin within the lesions.69 The lesions show progressive contrast enhancement after administration of gadolinium.92
Treatment: Treatment includes supportive therapy for the coagulopathy and endovascular embolization of the spleen to increase platelet count; when these approaches fail, a splenectomy may be indicated. Ertan and colleagues93 have published a thorough review of the pathogenesis, clinical course, imaging appearance, and treatment of this very rare pediatric tumor.
Hemangiopericytoma
Overview: A hemangiopericytoma is a rare vascular tumor that most commonly originates in the soft tissues of the extremities; it is even less common as a primary tumor of the spleen, and most often occurs in young adult patients.69
Etiology: Hemangiopericytomas originate from the pericytes of the capillary networks. Cytogenetic analysis of some tumors show evidence of break points and translocations, and some investigators have suggested that the karyotype of hemangiopericytomas arising in soft tissues may differ from that of the spleen.94
Clinical Presentation: The tumor has variable biologic behavior and high potential for malignancy.69 When it occurs in the spleen, patients may be asymptomatic or they may present with splenomegaly. Reported presentations have included massive hemorrhage and splenic abscess, presumably as a result of superinfection.94
Imaging: In the spleen, hemangiopericytomas may appear as a single large mass with smaller lesions within the parenchyma. Multiple hypoechoic lesions may be seen on ultrasound. Calcifications may be seen in the lesions on CT, along with contrast enhancement of the solid portions and septations. The lesions demonstrate hypointensity on T1-weighted MR sequences and hyperintensity on T2-weighted sequences.
Angiosarcoma
Overview: Angiosarcomas are rare, highly malignant neoplasms that can occur at any age but are less common in children than in adults. They have no gender predilection and are considered the most common malignant tumor of the spleen outside of hematologic or lymphatic malignancies.69
Etiology: Some of these tumors are believed to occur in preexistent lesions, such as after chemotherapy for lymphoma, or arise from otherwise benign lesions, such as splenic hemangiomas.95
Clinical Presentation: The presentation may include left upper quadrant pain, fever, fatigue, weight loss, anemia, and thrombocytopenia. Splenomegaly is common.95 In older patients, angiosarcomas of the spleen are associated with previous chemotherapy for lymphoma and radiation therapy for breast cancer.69
Imaging: Ultrasound images most commonly reveal a complex heterogeneous mass with hypoechoic cystic areas, likely reflecting areas of hemorrhage and necrosis. Solid echogenic regions display increased flow on color Doppler imaging. On CT the lesions are ill-defined, with lower attenuation than the surrounding spleen, and they demonstrate heterogeneous contrast enhancement and areas of necrosis.69 Metastases are most common in the liver, lungs, bone, and lymph nodes.
Splenic Metastases
Splenic metastases from solid primary tumors are less common with childhood tumors than with adult tumors. The most common primary tumors are lung, melanoma, breast, and testicular germ cell tumors, particularly choriocarcinoma. Metastases may be single or multiple and frequently do not cause splenomegaly (e-Fig. 95-20). Splenic metastases portend a poor prognosis.
e-Figure 95-20 Splenic metastases in a 24-year-old man with a Wilms tumor.
A computed tomography scan shows multiple hypodense lesions in the spleen that were pathologically proved to be metastases. An additional lesion is seen in the liver. (Courtesy Jeanne G. Hill, MD, MUSC.)
 What the Clinician Needs to Know
Abbott, RM, Levy, AD, Aguilera, NS, et al. From the archives of the AFIP: primary vascular neoplasms of the spleen: radiologic-pathologic correlation. Radiographics. 2004;24:1137.
Applegate, KE, Goske, MJ, Pierce, G, et al. Situs revisited: imaging of the heterotaxy syndrome. Radiographics. 1999;19:837.
Elsayes, KM, Vamsidhar, RN, Mukundan, G, et al. MR imaging of the spleen: spectrum of abnormalities. Radiographics. 2005;25:967–982.
Hilmes, MA, Strouse, PJ. The pediatric spleen. Semin Ultrasound CT MRI. 2007;28:3–11.
Paterson, A, Frush, DP, Donnelly, LF, et al. A pattern-oriented approach to splenic imaging in infants and children. Radiographics. 1999;19:1465.
References
1. Chadburn, A. The spleen: anatomy and anatomical function. Semin Hematol. 2000;37(1 suppl 1):13–21.
2. Donnelly, LF, et al. Heterogeneous splenic enhancement patterns on spiral CT images in children: minimizing misinterpretation. Radiology. 1999;210(2):493–497.
3. Donnelly, LF, et al. Normal changes in the MR appearance of the spleen during early childhood. AJR Am J Roentgenol. 1996;166(3):635–639.
4. Kumar, V, et al. Robbins and Cotran pathologic basis of disease, ed 8. Philadelphia: Saunders; 2010.
5. Lien, CH, et al. Acute torsion of wandering spleen: report of one case. Pediatr Neonatol. 2009;50(4):177–180.
6. Swischuk, LE, Williams, JB, John, SD. Torsion of wandering spleen: the whorled appearance of the splenic pedicle on CT. Pediatr Radiol. 1993;23(6):476–477.
7. Groshar, D, et al. The value of scintigraphy in the evaluation of a wandering spleen. Clin Nucl Med. 1986;11(1):42–43.
8. Liu, HT, Lau, KK. Wandering spleen: an unusual association with gastric volvulus. AJR Am J Roentgenol. 2007;188(4):W328–W330.
9. Fiquet-Francois, C, et al. Wandering spleen in children: multicenter retrospective study. J Pediatr Surg. 2010;45(7):1519–1524.
10. Karaman, MI, Gonzales, ET, Jr. Splenogonadal fusion: report of 2 cases and review of the literature. J Urol. 1996;155(1):309–311.
11. Hasegawa, Y, Kanemitsu, I, Ueoka, K. Transverse testicular ectopia with splenogonadal fusion: a case report. Int J Urol. 2011;18(6):466–468.
12. Varma, DR, et al. Sonographic and CT features of splenogonadal fusion. Pediatr Radiol. 2007;37(9):916–919.
13. Obley, DL, Slasky, BS, Bron, KM. Right-sided splenorenal fusion with arteriographic, ultrasonic, and computerized tomographic correlation. Urol Radiol. 1982;4(4):221–225.
14. Rosenthal, JT, et al. Right splenorenal fusion with associated hypersplenism. J Urol. 1981;126(6):812–814.
15. Al Ahmad, A, Jourabian, M, Pipelzadeh, M. Splenorenal fusion in a 26-month-old girl. Pediatr Radiol. 2009;39(7):735–738.
16. Hernanz-Schulman, M, et al. Current evaluation of the patient with abnormal visceroatrial situs. AJR Am J Roentgenol. 1990;154(4):797–802.
17. Applegate, KE, et al. Situs revisited: imaging of the heterotaxy syndrome. Radiographics. 1999;19(4):837–852. [discussion 853-854].
18. Chang, J, Brueckner, M, Touloukian, RJ. Intestinal rotation and fixation abnormalities in heterotaxia: early detection and management. J Pediatr Surg. 1993;28(10):1281–1284. [discussion 1285].
19. Tashjian, DB, et al. Outcomes after a Ladd procedure for intestinal malrotation with heterotaxia. J Pediatr Surg. 2007;42(3):528–531.
20. Ghosh, S, et al. Anomalies of visceroatrial situs. AJR Am J Roentgenol. 2009;193(4):1107–1117.
21. Aw, S, Levin, M. What’s left in asymmetry? Dev Dyn. 2008;237(12):3453–3463.
22. Aw, S, Levin, M. Is left-right asymmetry a form of planar cell polarity? Development. 2009;136(3):355–366.
23. Aylsworth, AS. Clinical aspects of defects in the determination of laterality. Am J Med Genet. 2001;101(4):345–355.
24. Layton, WM, Jr. Random determination of a developmental process: reversal of normal visceral asymmetry in the mouse. J Hered. 1976;67(6):336–338.
25. Patterson, KD, Drysdale, TA, Krieg, PA. Embryonic origins of spleen asymmetry. Development. 2000;127(1):167–175.
26. Opitz, J. Editorial comment on the paper by de la Monte and Hutchins on familial polyasplenia. Am J Med Genet. 1985;21:175–176.
27. Freedom, RM, et al. Hearts with isomerism of the right atrial appendages—one of the worst forms of disease in 2005. Cardiol Young. 2005;15(6):554–567.
28. Schutze, GE, et al. Invasive pneumococcal infections in children with asplenia. Pediatr Infect Dis J. 2002;21(4):278–282.
29. Lim, JS, et al. Clinical features, management, and outcome of children with fetal and postnatal diagnoses of isomerism syndromes. Circulation. 2005;112(16):2454–2461.
30. Gayer, G, et al. Congenital anomalies of the spleen. Semin Ultrasound CT MR. 2006;27(5):358–369.
31. Gilljam, T, et al. Outcomes of left atrial isomerism over a 28-year period at a single institution. J Am Coll Cardiol. 2000;36(3):908–916.
32. Freedom, RM, Fellows, KE, Jr. Radiographic visceral patterns in the asplenia syndrome. Radiology. 1973;107(2):387–391.
33. Rose, V, Izukawa, T, Moes, CA. Syndromes of asplenia and polysplenia. A review of cardiac and non-cardiac malformations in 60 cases with special reference to diagnosis and prognosis. Br Heart J. 1975;37(8):840–852.
34. Shafaie, FF, Katz, ME, Hannaway, CD. A horseshoe adrenal gland in an infant with asplenia. Pediatr Radiol. 1997;27(7):591–593.
35. Klippenstein, DL, et al. Splenic enlargement in neonates during ECMO. Radiology. 1994;190(2):411–412.
36. Rezende, PV, et al. Acute splenic sequestration in a cohort of children with sickle cell anemia. J Pediatr (Rio J). 2009;85(2):163–169.
37. Rosenberg, HK, et al. Normal splenic size in infants and children: sonographic measurements. AJR Am J Roentgenol. 1991;157(1):119–121.
38. Dhingra, B, et al. Normal values of liver and spleen size by ultrasonography in Indian children. Indian Pediatr. 2010;47(6):487–492.
39. Megremis, SD, Vlachonikolis, IG, Tsilimigaki, AM. Spleen length in childhood with US: normal values based on age, sex, and somatometric parameters. Radiology. 2004;231(1):129–134.
40. Konus, OL, et al. Normal liver, spleen, and kidney dimensions in neonates, infants, and children: evaluation with sonography. AJR Am J Roentgenol. 1998;171(6):1693–1698.
41. Loftus, WK, Metreweli, C. Ultrasound assessment of mild splenomegaly: spleen/kidney ratio. Pediatr Radiol. 1998;28(2):98–100.
42. Safak, AA, Simsek, E, Bahcebasi, T. Sonographic assessment of the normal limits and percentile curves of liver, spleen, and kidney dimensions in healthy school-aged children. J Ultrasound Med. 2005;24(10):1359–1364.
43. Schlesinger, AE, Edgar, KA, Boxer, LA. Volume of the spleen in children as measured on CT scans: normal standards as a function of body weight. AJR Am J Roentgenol. 1993;160(5):1107–1109.
44. Green, BA, et al. Imaging findings in pediatric type 1 Gaucher disease: what the clinician needs to know. J Pediatr Hematol Oncol. 2011;33(4):301–305.
45. Hill, SC, et al. Gaucher disease: sonographic appearance of the spleen. Radiology. 1986;160(3):631–634.
46. Roshkow, JE, Sanders, LM. Acute splenic sequestration crisis in two adults with sickle cell disease: US, CT, and MR imaging findings. Radiology. 1990;177(3):723–725.
47. Campbell, PJ, et al. Splenic regrowth in sickle cell anaemia following hypertransfusion. Br J Haematol. 1997;96(1):77–79.
48. Barrios, NJ, et al. Reversible splenic hypofunction in hypertransfused children with homozygous sickle cell disease. J Natl Med Assoc. 1993;85(9):677–680.
49. Buchanan, GR, et al. Splenic phagocytic function in children with sickle cell anemia receiving long-term hypertransfusion therapy. J Pediatr. 1989;115(4):568–572.
50. Ferster, A, et al. Bone marrow transplantation corrects the splenic reticuloendothelial dysfunction in sickle cell anemia. Blood. 1993;81(4):1102–1105.
51. Rattan, KN, et al. Splenic abscess in children: a report of three patients. Afr J Paediatr Surg. 2009;6(2):106–109.
52. Elsayes, KM, et al. MR imaging of the spleen: spectrum of abnormalities. Radiographics. 2005;25(4):967–982.
53. Pastakia, B, et al. Hepatosplenic candidiasis: wheels within wheels. Radiology. 1988;166(2):417–421.
54. Yen, TY, et al. Clinical characteristics of hepatosplenic fungal infection in pediatric patients. J Microbiol Immunol Infect. 2011;44(4):296–302.
55. Luna, A, et al. MRI of focal splenic lesions without and with dynamic gadolinium enhancement. AJR Am J Roentgenol. 2006;186(6):1533–1547.
56. Semelka, RC, et al. Hepatosplenic fungal disease: diagnostic accuracy and spectrum of appearances on MR imaging. AJR Am J Roentgenol. 1997;169(5):1311–1316.
57. Cox, F, Perlman, S, Sathyanarayana. Splenic abscesses in cat scratch disease: sonographic diagnosis and follow-up. J Clin Ultrasound. 1989;17(7):511–514.
58. Larsen, CE, Patrick, LE. Abdominal (liver, spleen) and bone manifestations of cat scratch disease. Pediatr Radiol. 1992;22(5):353–355.
59. Weinspach, S, et al. Cat scratch disease—heterogeneous in clinical presentation: five unusual cases of an infection caused by Bartonella henselae. Klin Padiatr. 2010;222(2):73–78.
60. Kalinova, K, Stefanova, P, Bosheva, M. Surgery in children with hydatid disease of the spleen. J Pediatr Surg. 2006;41(7):1264–1266.
61. Fowler, RH. Nonparasitic benign cystic tumors of the spleen. Int Abstr Surg. 1953;96(3):209–227.
62. Martin, JW. Congenital splenic cysts. Am J Surg. 1958;96(2):302–308.
63. Morgenstern, L. Nonparasitic splenic cysts: pathogenesis, classification, and treatment. J Am Coll Surg. 2002;194(3):306–314.
64. Sinha, CK, Agrawal, M. Nonparasitic splenic cysts in children: current status. Surgeon. 2011;9(1):49–53.
65. Czauderna, P, et al. Nonparasitic splenic cysts in children: a multicentric study. Eur J Pediatr Surg. 2006;16(6):415–419.
66. Ragozzino, MW, Singletary, H, Patrick, R. Familial splenic epidermoid cyst. AJR Am J Roentgenol. 1990;155(6):1233–1234.
67. Welten, CA, Sijbrandij, ES. Familial nonparasitic splenic cysts. Neth J Med. 1992;40(5-6):236–239.
68. Kimber, C, et al. Hemisplenectomy for giant splenic cysts in children. Pediatr Surg Int. 1998;14(1-2):116–118.
69. Abbott, RM, et al. From the archives of the AFIP: primary vascular neoplasms of the spleen: radiologic-pathologic correlation. Radiographics. 2004;24(4):1137–1163.
70. Ferrozzi, F, et al. CT findings in primary vascular tumors of the spleen. AJR Am J Roentgenol. 1996;166(5):1097–1101.
71. Panuel, M, et al. Splenic hemangioma—report of three pediatric cases with pathologic correlation. Pediatr Radiol. 1992;22(3):213–216.
72. Ramani, M, et al. Splenic hemangiomas and hamartomas: MR imaging characteristics of 28 lesions. Radiology. 1997;202(1):166–172.
73. Hilmes, MA, Strouse, PJ. The pediatric spleen. Semin Ultrasound CT MR. 2007;28(1):3–11.
74. Islam, S, et al. Antiangiogenic therapy for a large splenic hemangioma. Pediatr Surg Int. 2005;21(12):1007–1010.
75. Namikawa, T, et al. Laparoscopic splenectomy for splenic hamartoma: case management and clinical consequences. World J Gastrointest Surg. 2010;2(4):147–152.
76. Abramowsky, C, et al. “Hamartoma” of the spleen (splenoma) in children. Pediatr Dev Pathol. 2004;7(3):231–236.
77. Okada, J, et al. Increased activity on radiocolloid scintigraphy in splenic hamartoma. Clin Nucl Med. 1990;15(2):112–115.
78. Brinkley, AA, Lee, JK. Cystic hamartoma of the spleen: CT and sonographic findings. J Clin Ultrasound. 1981;9(3):136–138.
79. Yamaguchi, K, Maeda, S, Kitamura, K. Splenic hamartoma: report of a case and review of the literature. Jpn J Surg. 1989;19(3):381–386.
80. Lashbrook, DJ, et al. Splenic peliosis with spontaneous splenic rupture: report of two cases. BMC Surg. 2006;6:9.
81. Kohr, RM, Haendiges, M, Taube, RR. Peliosis of the spleen: a rare cause of spontaneous splenic rupture with surgical implications. Am Surg. 1993;59(3):197–199.
82. Benjamin, DR, Shunk, B. A fatal case of peliosis of the liver and spleen. Am J Dis Child. 1978;132(2):207–208.
83. Stojanovic, V, et al. Splenic peliosis in the course of IgA nephropathy. Pediatr Nephrol. 2007;22(12):2137–2140.
84. Gurney, JG, et al. Incidence of cancer in children in the United States. Sex-, race-, and 1-year age-specific rates by histologic type. Cancer. 1995;75(8):2186–2195.
85. Pui, CH. Acute lymphoblastic leukemia. Pediatr Clin North Am. 1997;44(4):831–846.
86. Belson, M, Kingsley, B, Holmes, A. Risk factors for acute leukemia in children: a review. Environ Health Perspect. 2007;115(1):138–145.
87. Gore, RM, Shkolnik, A. Abdominal manifestations of pediatric leukemias: sonographic assessment. Radiology. 1982;143(1):207–210.
88. Paes, FM, et al. FDG PET/CT of extranodal involvement in non-Hodgkin lymphoma and Hodgkin disease. Radiographics. 2010;30(1):269–291.
89. Saboo, SS, et al. Spleen in haematological malignancies: spectrum of imaging findings. Br J Radiol. 2012;85(1009):81–92.
90. Isasi, CR, Lu, P, Blaufox, MD. A metaanalysis of 18F-2-deoxy-2-fluoro-D-glucose positron emission tomography in the staging and restaging of patients with lymphoma. Cancer. 2005;104(5):1066–1074.
91. Schaefer, NG, et al. Non-Hodgkin lymphoma and Hodgkin disease: coregistered FDG PET and CT at staging and restaging—do we need contrast-enhanced CT? Radiology. 2004;232(3):823–829.
92. Johnson, C, et al. Littoral cell angioma. Clin Imaging. 2007;31(1):27–31.
93. Ertan, G, et al. Pediatric littoral cell angioma of the spleen: multimodality imaging including diffusion-weighted imaging. Pediatr Radiol. 2009;39(10):1105–1109.
94. Kumar, M, et al. Hemangiopericytoma of the spleen: unusual presentation as multiple abscess. World J Surg Oncol. 2005;3:77.
95. Hsu, JT, et al. Primary angiosarcoma of the spleen. J Surg Oncol. 2005;92(4):312–316.
[/level-membership-for-pediatrics-category][not-level-membership-for-pediatrics-category]Chapter 95
The Spleen
The spleen is maintained in its normal position by ligaments formed by peritoneal folds. The two major ligaments are the gastrosplenic ligament and the splenorenal ligament (Fig. 95-1). Other ligaments that help support the spleen are the phrenicosplenic, splenocolic, pancreaticosplenic, phrenocolic, and pancreaticocolic ligaments.
The spleen is the largest of the body’s lymphatic structures and the second largest organ of the reticuloendothelial system. A combination of red pulp (75%) and white pulp (25%) constitute the splenic parenchyma,1 which is surrounded by a relatively tough capsule. The red pulp is composed of the splenic cords and vascular sinuses and contains a large number of erythrocytes, whereas the white pulp is composed largely of lymphocytes and macrophages. The unique anatomy of the spleen is closely linked to its function and lends itself to some normal variations seen on computed tomography (CT) and magnetic resonance imaging (MRI). The primary function of the embryonic spleen is erythropoiesis, which is maximal in the middle of the second trimester and subsequently diminishes. The spleen is later responsible for filtering red blood cells that are aged or lack contractility, as well as antigen-coated cells, bacteria, and foreign particles. The spleen also acts as a platelet reservoir, releasing platelets in response to epinephrine or consuming platelets in case of splenomegaly.1 These functional aspects of the pediatric spleen can be evaluated scintigraphically.
Imaging
The spleen is easily identified on abdominal ultrasonography. It has a homogeneous sonographic texture, is slightly more echogenic than are the kidneys, and is isoechoic to slightly hyperechoic to the liver. The splenic hilar vessels usually are well visualized (Fig. 95-2), but intrasplenic vessels typically require color Doppler imaging for identification.
Figure 95-2 Normal spleen.
A, A normal spleen in a 15-year-old girl. A transverse ultrasound image shows normal homogeneous parenchymal echotexture and hilar vessels. B, A normal spleen in a 3-month-old infant with ascites.
On CT, the normal spleen has a higher attenuation than the liver. Transient heterogeneous splenic enhancement patterns often are encountered during the first minute of contrast-enhanced CT, particularly with the rapid bolus technique (e-Fig. 95-3). This normal phenomenon is thought to be a result of variations in blood flow through the red and white pulp of the spleen; it is more pronounced with contrast injection rates of 1 mL/sec or greater and in children older than 1 year. Common patterns of heterogeneity have been described as: (1) archiform, consisting of ring-like or zebra-stripe bands of alternating density; (2) focal areas of low density; and (3) diffuse, mottled areas of inhomogeneity.2 More uniform enhancement is seen approximately 70 seconds after initiation of the contrast injection.
e-Figure 95-3 Contrast bolus artifact on computed tomography (CT).
An arcuate or “archiform” contrast enhancement pattern is seen in the spleen, with ringlike or zebra-stripe bands of alternating density. A CT scan with rapid bolus technique was performed to evaluate the hepatic hemangioma.
On MRI, the spleen signal intensity varies with age (Table 95-1; Fig. 95-4). In the neonate, the spleen is T1 and T2 isointense to hypointense with respect to the liver. The T2 hypointensity is because of immaturity of the white pulp. After age 8 months, the spleen is T2 hyperintense relative to the liver because of white pulp maturation, and it maintains this appearance through adulthood.3
Table 95-1
Magnetic Resonance Signal Intensity of Spleen Relative to Liver by Age
| Age | T1 | T2 |
| Neonate | Isointense/hypointense | Isointense/hypointense |
| Postneonate infant | Hypointense | Minimally hyperintense |
| >8 mo | Hypointense | Hyperintense |
| >1 yr | Hypointense | Hyperintense |
Figure 95-4 Change in spleen T2 signal with age.
A, An axial T2-weighted fat-suppressed image of the upper abdomen in a 2-month-old child shows that the spleen is nearly isointense to liver. B, An axial T2-weighted fat-suppressed image of the upper abdomen in a 4-year-old child shows hyperintensity of the spleen compared with the liver.
Scintigraphic splenic imaging with technetium-99m (99mTc)–labeled sulfur colloid, which is removed from the blood by the reticuloendothelial system, is useful for the identification of splenic ectopia, as well as several entities discussed later in this chapter. It is not useful in cases of heterotaxy because splenic and hepatic tissue cannot be distinguished when neither location nor shape is an identifying criterion. Similarly, selective spleen scans can be misleading when the spleen is absent (e-Fig. 95-5).
Accessory Spleens
Overview: The most common congenital anomaly of the spleen is the presence of one or more accessory spleens, or splenuli. These accessory spleens are present in 20% to 35% of postmortem examinations of the normal population4 and usually are found incidentally at autopsy or on imaging studies. They number six or fewer and are located most commonly in the splenic hilum, in association with the splenic vessels, or in the gastrosplenic ligament. However, accessory spleens can be found virtually anywhere in the abdomen. They rarely exceed 2 cm in diameter and can be confused with splenic hilar or parapancreatic lymph nodes.
Etiology: Normally, the spleen forms from the coalescence of multiple small splenic masses. Accessory spleens therefore are not uncommon.
Clinical Presentation: The presentation is incidental, when accessory spleens are found during imaging for unrelated reasons.
Wandering Spleen
Overview: A wandering spleen is a congenital anomaly that results from maldevelopment of the splenic suspensory ligaments, including the gastrosplenic, splenorenal, and phrenicocolic ligaments. Acquired cases also have been described and may be a consequence of splenomegaly, traumatic injury, or ligamentous laxity.
Etiology: Normally, during embryonic life, the residuum of the dorsal mesogastrium fuses with the posterior peritoneum, helping to support the spleen in its normal position. When this fusion does not take place, the dorsal mesogastrium may persist as a long mesentery, allowing the spleen to migrate, yielding the so-called “wandering spleen.” The most common location for the ectopic spleen is the left lower quadrant.
Clinical Presentation: The clinical presentation is variable; patients may be asymptomatic or present with a mobile mass on physical examination. More typically the presentation is an acute abdomen because of torsion of the vascular pedicle, with subsequent ischemia, impaired venous return, acute enlargement, and painful capsular tension.5
Imaging: The abnormal position and orientation of the spleen can be identified by ultrasound, CT, or radionuclide imaging. It is important to pay close attention to the abnormal orientation and location of the spleen. Typically, no splenic tissue can be identified in the left upper quadrant, although a small accessory spleen may remain in the normal anatomic location. If the spleen undergoes torsion, a “whorled” appearance of the splenic artery in the splenic pedicle has been described as a characteristic CT sign of torsion6 (Fig. 95-6, A and B). The twisted spleen has little uptake on radionuclide scintigraphy7 and no contrast enhancement on CT (Fig 95-6, C and D). Color Doppler sonography shows lack of flow in the splenic hilar vessels (Fig. 95-6, E) and also may demonstrate the whorled appearance at the splenic hilum. Because of the defective ligamentous support, gastric volvulus has been associated with a wandering spleen8 (Fig. 95-6, F).
Figure 95-6 A wandering spleen in a 14-year-old girl with Niemann-Pick disease and the acute onset of abdominal pain.
A, A contrast-enhanced computed tomography (CT) image of the abdomen shows a “whorled” appearance of the splenic vessels and pancreatic tail at the expected location of the splenic hilum. The spleen shows low attenuation without contrast enhancement as a result of absent perfusion. B, A close-up view of “whorled” hilar vessels and the pancreatic tail from A. C, Below the level of A, the caudal location of the splenic mass is shown. D, Coronal reformatting underscores the displacement and abnormal orientation of the spleen and again shows lack of contrast enhancement. E, A color Doppler ultrasound image shows no vascular flow into the spleen. Also note the abnormal echotexture of the spleen. SAG SPL, Sagittal spleen. F, One year after undergoing a splenectomy, the child presented with hypotension and abdominal distention. Coronal reconstruction of abdominal CT scan performed with oral contrast reveals reversal of the usual relationship of the gastric fundus and gastric outlet, consistent with gastric volvulus. Note the gastric pneumatosis. (Courtesy Jeanne G. Hill, MD, MUSC.)
Splenogonadal Syndrome
Overview: Splenogonadal syndrome is a rare anomaly in which a portion of the spleen is conjoined with left gonadal tissue. Although this congenital anomaly is uncommon, identifying it is important because 30% to 50% of cases result in unnecessary orchiectomy because of concern that a extratesticular neoplasm may be present.10
Etiology: Splenogonadal fusion results when a portion of the splenic anlage fuses with primitive left gonadal tissue between the fifth and eighth weeks of gestation. Despite the fused splenic tissue, a normal spleen is present in the left upper quadrant. The splenogonadal fusion shows a splenic cord continuous with the ectopic, fused splenic tissue in approximately 55% of cases; it is discontinuous in approximately 45% of cases.10 Splenogonadal fusion has been reported in association with transverse testicular ectopia.11
Clinical Presentation: Splenogonadal fusion is much more common in males, with a male to female ratio of 16 : 1. The condition may be asymptomatic and discovered incidentally or at autopsy. It may be associated with left cryptorchidism, inguinal hernia, or testicular torsion, particularly when it is continuous. Multiple other anomalies may be present, particularly in the continuous type. In females, fusion of splenic tissue with the left ovary or mesovarium occurs; this connection does not result in ovarian ectopia.
Imaging: Sonography can reliably demonstrate the extratesticular location of a palpable scrotal mass in these cases. The mass is typically oval or round and of similar echotexture to the adjacent normal testis, but often it has a slightly different size or configuration (e-Fig. 95-7, A). Color Doppler sonography shows abundant vascularity in the splenic tissue (e-Fig. 95-7, B). Radionuclide imaging with 99mTc sulfur colloid adds specificity to the diagnosis by revealing radiopharmaceutical uptake in the ectopic splenic tissue either in the left hemiscrotum or in the left inguinal canal when associated with cryptorchidism. A linear pattern extending from the left upper quadrant of the abdomen to the pelvis or scrotum may be detected in the continuous type (e-Fig. 95-7, C).
e-Figure 95-7 Splenogonadal fusion in a boy with a painless left scrotal mass.
A, A longitudinal ultrasound image of the left hemiscrotum reveals round-shaped splenic tissue cephalad to the testicle, similar in echotexture and fused to the more oval-shaped testis below. B, A color Doppler image shows increased vascularity of the splenic tissue compared with that of the testicle. C, A technetium-99m sulfur colloid liver-spleen scan shows radiopharmaceutical uptake in the spleen in the left upper quadrant and in the left hemiscrotum; note continuous radiopharmaceutical uptake within the persistent cord of tissue connecting the spleen with the left testis. (Courtesy A. Schlesinger, MD, Houston, TX.)
Although it is not the imaging modality of choice, contrast-enhanced CT may reveal a rounded, enhancing, well-circumscribed soft tissue mass in the left hemiscrotum or left hemipelvis that may or may not continue cephalad toward the spleen.12 MRI is useful to obtain further detail.11
Splenorenal Fusion
Overview: Splenorenal fusion is a rare developmental anomaly in which congenital fusion of splenic and renal tissue is present. Fusion usually involves the left kidney and rarely the right kidney.13,14 Unlike posttraumatic splenosis, patients with congenital splenorenal fusion demonstrate an intact spleen with a separate blood supply. Recognition of this anomaly is important to prevent an unnecessary nephrectomy for a presumed malignancy.
Etiology: One theory to explain the origin of this anomaly is that fusion of the mesogastrium and left posterior peritoneum brings the splenic anlage and the left mesonephric ridge in close proximity during the eighth week of gestation, allowing the two organs to fuse as they migrate toward the pelvis.15 Alternatively, it is postulated that splenic cells could migrate caudally to reach the metanephros and retroperitoneum, where there is no barrier to crossing the midline; this theory would explain reported right-sided fusion anomalies.13 Splenorenal fusion also may be acquired from posttraumatic or postsplenectomy splenosis, where splenic tissue implants on the kidney and regrowth occurs.14,15
Clinical Presentation: The condition may present incidentally on imaging, or it may cause symptoms as a result of the effect of the mass or hypersplenism, manifesting as anemia and thrombocytopenia.
Imaging: Conventional imaging with ultrasound, CT, or MR typically will not reliably distinguish this entity from a renal or retroperitoneal malignancy. When suspected, the diagnosis can be made reliably with 99mTc sulfur colloid imaging, or, in the case of hypersplenism, with 99mTc-labeled, heat-damaged red blood cell imaging.
Abnormal Visceroatrial Situs
Overview: Abnormal visceroatrial situs is a spectrum of abnormalities related to isomerisms of the atrial appendages, which typically involve abnormalities of the spleen. The normal visceroatrial anatomy is known as “situs solitus,” which means “usual position.” “Situs inversus” refers to mirror-image visceroatrial anatomy. Patients with situs inversus frequently are asymptomatic, although they have a slightly higher incidence of congenital heart disease than do patients with situs solitus. “Situs ambiguous,” also called “visceroatrial heterotaxia,” refers to deranged visceroatrial asymmetry. Patients with this abnormality are divided into two major groups: those with a tendency toward right-sided symmetry and those with a tendency toward left-sided symmetry. Therefore each patient, within broad categories, has a unique constellation of anatomic findings that must be evaluated and described individually.16,17 Recognition of the spectrum of situs anomalies and the altered anatomy is important because of the increased risk in these children for anomalies such as congenital heart disease, malrotation with potential for development of midgut volvulus, and immunodeficiency in patients with asplenia.16,18–20
Etiology: Although the external human features are largely symmetric, asymmetry is characteristic of viscerovascular anatomy. In patients with heterotaxy, although it is not yet not fully understood, derangement of embryonic left-right recognition at the molecular level is present, which relates to abnormalities in ciliary movement, planar cell polarity, asymmetric gene cascades, and genes that generate a barrier for specific gene products to cross the embryonic midline. Underlying causative mechanisms include teratogenic exposures and genetic factors.21–27
Clinical Presentation: Patients with right-sided atrial isomerism typically have asplenia, which is associated with immune deficiency and overwhelming sepsis, particularly as a result of Streptococcus pneumoniae.28 The ambiguous atrium resembles the right atrium, and severe congenital cardiac lesions typically are present, usually with diminished pulmonary blood flow and often with associated total anomalous pulmonary venous return with or without obstruction. Patients thus will present with cyanosis and/or pulmonary edema.16,17 Despite modern palliative procedures, mortality remains high, with 5-year survival reported at 20%, regardless of whether the diagnosis is made before or after birth.27,29 Intestinal malrotation is common.
Patients with left-sided atrial isomerism typically have multiple splenules, known as polysplenia. Congenital heart disease often is present, although some patients with polysplenia are asymptomatic, and the diagnosis may be made incidentally.30 In a study of a large series of people with left atrial isomerism, approximately 14% of patients had a normal heart and presented with extracardiac abnormalities. This condition is associated with biliary atresia in as many as 10% of patients.31 Intestinal malrotation is common.
Imaging: In patients with situs ambiguus, plain radiographs may denote abnormal situs, with discordance of heart, stomach, and liver position. On chest radiographs, patients with right-sided atrial isomerism may demonstrate bilateral right lungs with identification of the minor fissure and eparterial bronchi. Patients with left-sided isomerism, on the other hand, may demonstrate bilateral left-sided hila with hyparterial bronchi. However, hilar anatomy often is not clear because of overlying thymus. The plain film appearance may be indistinguishable from normal and falsely suggest situs solitus in some patients.32
Ultrasound, CT, and MRI confirm absence of the spleen in the vast majority of patients with right-atrial isomerism and may identify other anomalies such as horseshoe adrenals fused in the midline (e-Fig. 95-8).33,34 Subdiaphragmatic total anomalous venous connections are easily identified, because the anomalous vessel courses anterior to the esophagus into the abdomen.16 The inferior vena cava (IVC) is nearly invariably present and may lie to the right or left of the aorta, crossing the midline anterior to the aorta to enter the atrium, if necessary.16,32
e-Figure 95-8 Horseshoe adrenal in asplenia.
Initial ultrasound evaluation of 1-day-old infant with congenital heart disease and asplenia. A, A transverse image through the upper abdomen shows the adrenals fused across the midline anterior to the aorta (A), which is located just to the right of the midline. Gas from the left-sided stomach (S) obscures a portion of the left adrenal gland. Note the right-sided inferior vena cava (IVC) anterior to the right adrenal gland (arrow). B, At a slightly lower level, adrenal fusion is again seen. The adrenal on the right is seen between the upper pole of the right kidney (RK) and the IVC (arrow), anterior to the aorta (A). Note the extension of the liver into the left upper quadrant around the stomach (S). (Courtesy Marta Hernanz-Schulman, MD, Nashville, TN.)
In patients with left-sided atrial isomerism, because splenic tissue develops in the dorsal mesogastrium,25 ultrasound, CT, and MRI will identify the splenules dorsal to the stomach along the greater curvature, whether the stomach lies on the left or the right.16 The appearance of the splenules is variable and ranges from a conglomerate of multiple splenules to a sometimes septated, largely single splenic mass (Fig. 95-9 and e-Fig. 95-10). Interruption of the intrahepatic IVC is seen at least 50% of patients, with either right- or left-sided azygous continuation.16 When the IVC is present, it may lie to the right or left of the aorta. A preduodenal portal vein may be seen. In patients presenting with biliary atresia, it is important to evaluate the continuity of the IVC and the course of the portal vein, because these vascular derangements are important in patients who are later referred for liver transplantation.
Figure 95-9 Polysplenia.
A, Multiple splenules are present in the left upper quadrant, behind the stomach. Note the midline liver. The inferior vena cava (IVC) is intact, located to the right of the aorta. Note the midline liver, centrally located portal vein (arrow), which was noted to be preduodenal on lower sections. B, A 2-month-old infant with complex congenital heart disease and single ventricle anatomy. Note two splenules (arrows) in the left upper quadrant behind the stomach, and the left-sided azygous continuation of the interrupted IVC. The left azygous vein drained into the left-sided superior vena cava. (A, Courtesy Marta Hernanz-Schulman, MD, Nashville, TN.)
Treatment: Treatment is individualized on the basis of the associated anomalies. Patients with asplenia are at risk for sepsis and need to be treated for immunodeficiency. Patients with congenital heart disease or gastrointestinal anomalies of midgut malrotation and biliary atresia typically require surgical correction.
Splenomegaly
Overview: Splenomegaly refers to enlargement of the spleen, usually as a result of excessive destruction of abnormal blood cells, excessive antigenic stimulation, storage or infiltrative disorders, or portal venous congestion. Hypersplenism, in contrast, refers to the syndrome of sequestration by the enlarged spleen of blood cell lines, particularly platelets.
Etiology: The spleen may become enlarged in several inherited conditions (Box 95-1). The hemolytic anemias frequently cause splenomegaly, with hereditary spherocytosis, hereditary elliptocytosis, and thalassemia being the most common. Sickle cell anemia initially leads to splenomegaly, followed by splenic atrophy as a result of multiple infarcts; the pathophysiology is sequestration of impaired red blood cells by the spleen, leading to splenomegaly, anemia, and thrombocytopenia.
