[level-membership-for-critical-care-medicine-category]
12 The respiratory system
Acidemia: Lower-than-normal blood pH (increased hydrogen ion concentration).
Acidosis: The process that leads to an increase in hydrogen ion concentration in the blood.
Adventitious Sounds: Abnormal noises that may be heard superimposed on a patient’s breath sounds.
Alkalemia: Higher-than-normal blood pH (decreased hydrogen ion concentration).
Alkalosis: The process that leads to a decrease in hydrogen ion concentration in the blood.
Apnea: The absence of breathing.
Apneustic Breathing: Prolonged inspiratory efforts interrupted by occasional expirations.
Atelectasis: Collapse of the alveoli.
Bradypnea: Respiratory rate, in the adult, that is less than 8 breaths/min.
Bronchiectasis: Dilatation of the bronchi.
Bronchospasm: Constriction of the bronchial airways caused by an increase in smooth muscle tone in the airways.
Central Sleep Apnea: A cessation of breathing during sleep as a result of transient abolishment of the drive to the respiratory muscles.
Cheyne-Stokes Respirations: Periods of apnea alternating with rhythmic, shallow, and progressively deeper and then shallower respirations that are associated with brain damage, heart or kidney failure, or drug overdose.
Compliance (Lung): A measure of distensibility of the lungs; the amount of change in volume per change in pressure across the lung.
Cyanosis: A sign of poor oxygen transport, characterized by a bluish discoloration of the skin, produced when more than 5 g of hemoglobin per deciliter of arterial blood is in the deoxygenated, or reduced, state.
Dyspnea: A patient’s perception of shortness of breath.
Epistaxis: Hemorrhage from the nose.
Hypercapnia: Increased tension of carbon dioxide (PaCO2) in the blood.
Hyperoxemia: Increased tension of oxygen (PaO2) in the blood.
Hyperpnea: Increased rate of respirations.
Hyperventilation: Overventilation of the alveoli in relation to the amount of carbon dioxide produced by the body.
Hypocapnia: Decreased PaCO2 in the blood.
Hypoventilation: Underventilation of the alveoli in relation to the amount of carbon dioxide produced by the body.
Hypoxemia: Decreased PaO2 in the blood.
Hypoxia: Inadequate tissue oxygen levels.
Kussmaul Respirations: Rapid, deep respirations associated with diabetic ketoacidosis.
Methemoglobin: Hemoglobin that has the iron atom in the ferric state.
Minute Ventilation (V˙E): The volume of air expired during a period of 1 minute.
Orthopnea: Severe dyspnea that is relieved when the patient elevates the head and chest.
Oxyhemoglobin: Hemoglobin that is fully oxygenated.
Paroxysmal Nocturnal Dyspnea: A sudden onset of severe dyspnea when the patient is lying down.
Partial Pressure: The pressure exerted by each individual gas when mixed in a container with other gases.
Periodic Breathing: A regular waxing and waning of ventilation as a result of fluctuations in central respiratory drive.
Polycythemia: Increased number of red blood cells in the blood.
Rales: Short discontinuous explosive adventitious sounds, usually called crackles.
Reduced Hemoglobin: Hemoglobin in the deoxy state (not fully saturated with oxygen).
Respiration: The process by which oxygen and carbon dioxide are exchanged between the outside atmosphere and the cells in the body.
Rhonchi: Continuous musical adventitious sounds.
Sleep Apnea: Repeated absence of breathing during sleep, sometimes hundreds of times during the night and often for 1 minute or longer.
Torr: Units of the Torricelli scale, the classic mercury scale, which is used to express the same value as millimeters of mercury.
Ventilation: The mechanical movement of air in and out of the lungs.
Wheeze: A high-pitched sibilant rhonchus usually produced on expiration.
Respiratory system anatomy
The nose
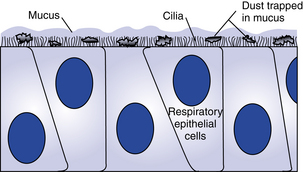
The nose, the first area in which inhaled air is filtered (Fig. 12-1), is lined with ciliated epithelium. Cilia move mucus and particles of foreign matter to the pharynx to be expectorated or swallowed (Fig. 12-2). Other functions of the nose include humidification and warming of the inhaled air and the olfactory function of smell.1
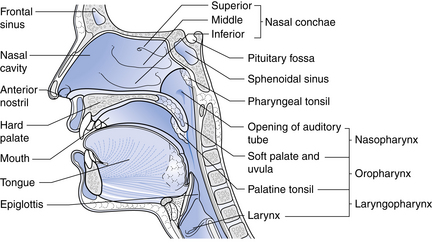
FIG. 12-1 Sagittal section through the nose.
(From Watson R: Anatomy and physiology for nurses, ed 13, Edinburgh, 2011, Baillière Tindall.)
Dry gases are often administered during anesthesia. These gases dry the mucous membranes and slow the action of the cilia. The administration of moist gases in the PACU with various humidification and mist therapy devices keeps this physiologic filter system viable. A tracheostomy precludes the functions of the nose, and proper tracheostomy care, including the administration of humidified oxygen, must be instituted.2
The blood supply to the nose is provided by the internal and external maxillary arteries, which are derived from the external carotid artery, and by branches of the internal carotid arteries. The venous plexus of the nasal mucosa is drained into the common facial vein, the anterior facial vein, the exterior jugular vein, or the ophthalmic vein. A highly vascular plexus of vessels is located in the mucosa of the anterior nasal septum. This plexus is called the Kiesselbach plexus or the Little area. In most instances, this area is the source of epistaxis.3
Epistaxis can occur in the PACU after trauma to the nasal veins from nasotracheal tubes or to nasal airways during anesthesia. If epistaxis occurs, prompt action should be taken to prevent aspiration of blood into the lungs. The patient should be positioned with the head up and flexed forward toward the chest. Cold compresses applied to the bridge of the nose and neck may be effective in slowing or stopping the bleeding. If the bleeding is profuse, the oral cavity should be suctioned carefully and the attending physician should be notified. A nasal pack or cautery with silver nitrate or electric current may be necessary to stop the bleeding.4
The pharynx
The pharynx originates at the posterior aspect of the nasal cavities and is called the nasopharynx until it reaches the soft palate, where it becomes the oropharynx. The oropharynx extends to the level of the hyoid bone, where it becomes the laryngeal pharynx, which extends caudally to below the hyoid bone.1
The larynx
The larynx, or voice box (Fig. 12-3), is situated anterior to the third, fourth, and fifth cervical vertebrae in the adult male. It is situated higher in women and children. Nine cartilages held together with ligaments and intertwined with many small muscles constitute the larynx. The thyroid cartilage, the largest, is V-shaped; its protruding prominence is commonly referred to as the Adam’s apple. The thyroid cartilage is attached to the hyoid bone by the hyothyroid membrane and to the cricoid cartilage. The cricoid cartilage is situated below the thyroid cartilage and anteriorly forms a signet-shaped ring. The signet lies posteriorly as a quadrilateral lamina joined in front by a thin arch. The inner surface of the cricoid cartilage is lined with a mucus membrane. In children younger than 12 years, the cricoid cartilage is the smallest opening to the bronchi of the lungs.
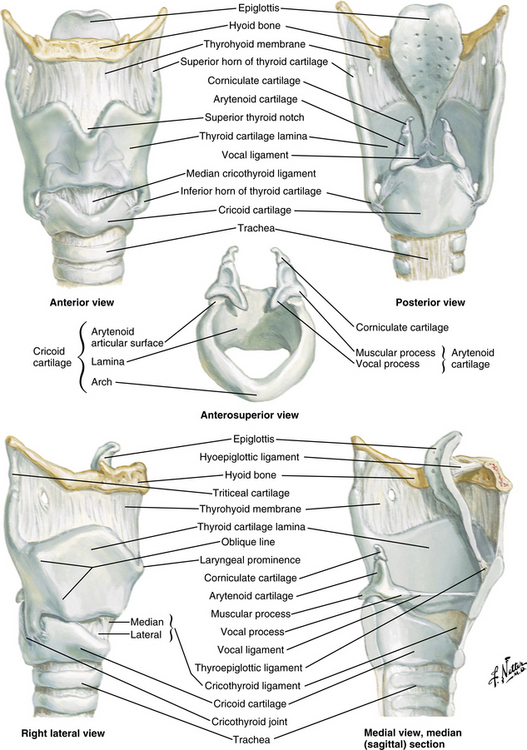
FIG. 12-3 The larynx.
(Netter illustration from www.netterimages.com. © Elsevier Inc. All rights reserved.)
The epiglottis, a cartilage of the larynx, is an important landmark for tracheal intubation that serves to deflect foreign objects away from the trachea. This cartilage is leaf shaped and projects outward above the thyroid cartilage over the entrance to the trachea. The lower portion is attached to the thyroid lamina, and the anterior surface is attached to the hyoid bone and thereby to the base of the tongue. The valleys on either side of the glossoepiglottic fold are termed the valleculae.5
The fissure between the vocal folds, or true cords, is termed the rima glottidis or glottis. In the adult, this opening between the vocal cords is the narrowest part of the laryngeal cavity. Any obstruction in this area leads to death via suffocation if not relieved promptly. The rima glottidis divides the laryngeal cavity into two main compartments: (1) the upper portion is the vestibule, which extends from the laryngeal outlet to the vocal cords and includes the laryngeal sinus, sometimes called the middle compartment; and (2) the lower compartment, which extends from the vocal cords to the lower border of the cricoid cartilage and thereafter, is contiguous with the trachea.6
The muscles of the larynx are also either intrinsic or extrinsic. The intrinsic muscles control the movements of the laryngeal framework. They open the cords on inspiration, close the cords and the laryngeal inlet during swallowing, and alter the tension of the cords during speech. The extrinsic muscles are involved in the movements of the larynx as a whole, such as in swallowing.4
The nerve supply to the larynx is from the superior and recurrent laryngeal nerves of the vagus. The superior laryngeal nerve passes deep to both the internal and the external carotid arteries and divides into a small external branch that supplies the cricothyroid muscles that tense the vocal ligaments. The larger internal branch pierces the thyrohyoid membrane to provide sensory fibers to the mucosa of both sides of the epiglottis and the larynx above the cords.1
The recurrent laryngeal nerve on the right side exits from the vagus as it crosses the right subclavian artery and ascends to the larynx in the groove between the trachea and esophagus (Fig. 12-4). When the nerve reaches the neck, it assumes the same relationships as on the right. This nerve provides the motor function to the intrinsic muscles of the larynx, with the exception of the cricothyroid, and also provides sensory function to the laryngeal mucosa below the vocal cords.
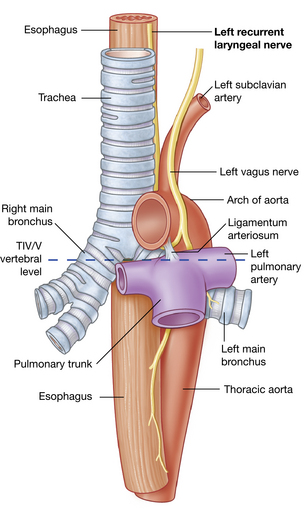
FIG. 12-4 Left recurrent laryngeal nerve passing through the superior mediastinum.
(From Drake RL, et al: Gray’s anatomy for students, ed 2, Philadelphia, 2010, Churchill Livingstone.)
When a laryngospasm occurs in the PACU, prompt emergency treatment is necessary to save the patient’s life. The perianesthesia nurse should have someone on the PACU staff summon the anesthesia provider when laryngospasm is suspected. Treatment consists of mask ventilation with sustained moderate pressure on the reservoir bag. This maneuver usually helps to overcome the partial laryngospasm. Complete laryngospasm not relieved with positive pressure within at least 1 minute necessitates more aggressive treatment. Intravenous (0.5 mg/kg) or intramuscular (1 mg/kg) succinylcholine can be administered to relax the smooth muscle of the larynx. Endotracheal intubation may be necessary.7,8 The nurse must remember that ventilation of the patient’s lungs should be continued until complete respiratory functioning has returned.
The trachea
The area at the distal end of the trachea at the point of bifurcation into the right and left main stem bronchi is called the carina (Fig. 12-5). The carina contains sensitive pressoreceptors, which on stimulation (i.e., with an endotracheal tube) cause the patient to cough and “buck.” The angle created at the point of bifurcation into the right and left main stem bronchi is clinically significant to the perianesthesia nurse. This angle varies according to the age and gender of the patient (Table 12-1). The angle at the right main stem bronchus is smaller than the angle at the left main stem bronchus. Foreign material can easily enter the right main stem bronchus at this point. Endotracheal tubes, if advanced too far, usually enter the right main stem bronchus and thereby occlude the left main stem bronchus. As a result, the left lung cannot be ventilated. Signs of this complication include decreased or absent breath sounds in the left side of the chest, tachycardia, and uneven expansion of the chest on inspiration and expiration.5,9,10
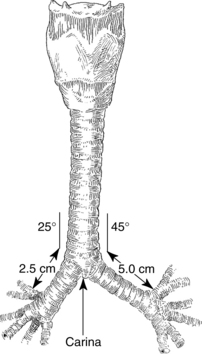
FIG. 12-5 Bifurcation of trachea into main stem bronchi.
(From Nagelhout JJ, Plaus KL: Nurse anesthesia, ed 4, St. Louis, 2010, Saunders.)
Table 12-1 Variations of Bronchial Bifurcation Angles in Adults and Children
| RIGHT BRONCHUS (DEGREES) | LEFT BRONCHUS (DEGREES) | |
|---|---|---|
| Newborn | 12-35 | 30-65 |
| Adult male | 20 | 40 |
| Adult female | 19 | 51 |
Bronchi and lungs
Each primary bronchus supplies a number of lobar bronchi (Fig. 12-6). Humans have an upper, middle, and lower lobe bronchus on the right and only an upper and lower lobe bronchus on the left. Within each pulmonary lobe, a lobar (secondary) bronchus soon divides into tertiary branches that are remarkably constant as to number and distribution within the lobe. The segment of a lobe aerated by a tertiary bronchus is usually well delineated from adjoining segments by complete planes of connective tissue. These areas of the lung are well defined; therefore pulmonary diseases may be limited to a particular segment or segments of a lobe.
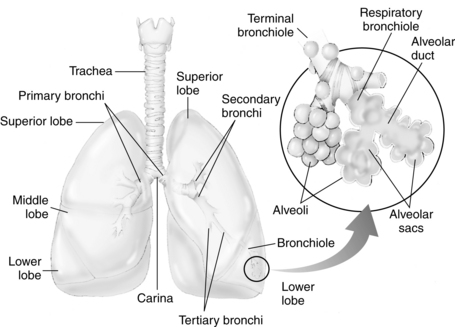
FIG. 12-6 Distribution of bronchi within lungs. Enlarged inset shows detail of alveolus.
(From National Association of Emergency Media: PHTLS prehospital trauma life support , ed 6, St. Louis, 2007, Mosby.)
The terminal bronchioles divide into the respiratory bronchioles in which actual gas exchange first occurs. The respiratory bronchioles bifurcate to form alveolar ducts, and these in turn terminate in spherical enclosures called the alveolar sac. The sacs enclose a small but variable number of terminal alveoli.3
The number of alveoli in an average adult’s lungs is estimated to be 750 million. The surface area available for gas exchange is approximately 125 m2. Alveoli are shaped like soap bubbles in a glass. The interalveolar septum has a supporting latticework composed of elastic collagenous and reticular fibers. The capillaries are incorporated into and supported by the fibrous lattice. The capillary networks in the lungs are the richest in the body.
The lungs receive unoxygenated blood from the left and right pulmonary arteries, which originate from the right ventricle of the heart. The divisions of the pulmonary artery tend to follow the bifurcations of the airway. Typically, two pulmonary veins exit from each lung, and all four veins empty separately into the left atrium. The blood that arrives in the rich pulmonary capillary network from the pulmonary arteries provides for the metabolic needs of the pulmonary parenchyma. Other portions of the lungs, such as the conducting vessels and airways, need their own private circulation. The bronchial arteries, which arise from the aorta, provide the oxygenated blood to the lung tissue. The blood of the bronchial arteries returns to the heart by way of the pulmonary veins.3
Respiratory system physiology
Lung volumes and capacities
Perianesthesia care of the patient is largely based on knowledge of the physiology and pathophysiology of the respiratory system. Dysfunction in lung volumes and capacities that occurs in the patient after surgery is the compelling reason for institution of the stir-up regimen in the PACU. Accordingly, the physiology of the lung volumes and capacities and lung mechanics are described in detail. Table 12-2 provides the definition and normal value for each lung volume and capacity. As shown in Table 12-2 and Fig. 12-7, a lung capacity comprises two or more lung volumes.
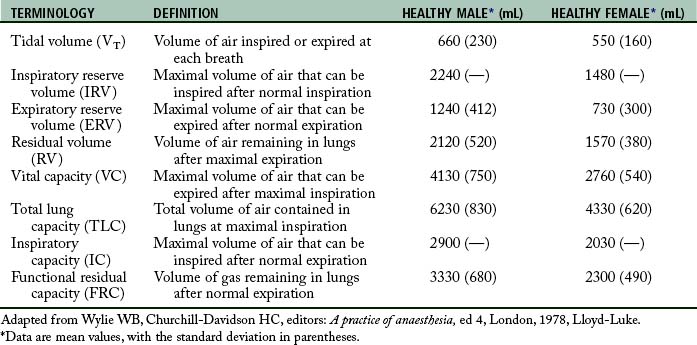
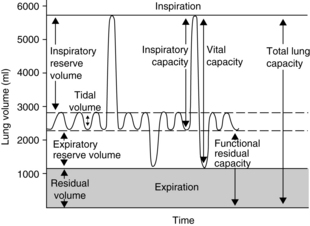
FIG. 12-7 Graphic representation of normal lung volumes and capacities.
(From Hall JE: Guyton and Hall textbook of medical physiology, ed 12, Philadelphia, 2011, Saunders.)
Lung volumes
The expiratory reserve volume (ERV) is the maximal amount of air that can be expired from the resting position after a normal spontaneous expiration. The ERV reflects muscle strength, thoracic mobility, and a balance of forces that determine the resting position of the lungs and chest wall after a normal expiration. This lung volume is usually decreased in patients who are morbidly obese (see Chapter 45). This lung volume also is decreased in the immediate postoperative period in patients who have undergone an upper abdominal or thoracic operation.5,9,10
The residual volume (RV) is the volume of air that remains in the lungs at the end of a maximal expiration. This lung volume represents the balance of forces of the lung elastic forces and thoracic muscle strength. Patients with skeletal muscle relaxant that was not adequately reversed at the end of the anesthetic period may have an elevated RV because enough muscle strength cannot be generated to force all the air out of the lungs. As the RV increases, more air remains in the lungs so that the air does not participate adequately in gas exchange and becomes dead-space air. As the dead-space volume of air increases, it can impinge on the VT and hypoxemia can ensue. The importance of the RV is that it allows for continuous gas exchange throughout the entire breathing cycle by providing air to most of the alveoli and it aerates the blood between breaths. Consequently, the RV prevents wide fluctuations in oxygen and carbon dioxide concentrations during inspiration and expiration.4
Lung capacities
Clinical measurements of the TLC, FRC, and RV are difficult because these values include a gas volume that cannot be exhaled; therefore the measurements require sophisticated pulmonary function testing equipment with gas dilution techniques or plethysmography. Measurements of lung volumes and capacities are useful in the evaluation of lung function.5
Lung mechanics
Mechanical features of the lungs
Mechanical forces of the respiratory system actually determine the lung volumes and capacities. For an understanding of how these lung volumes and capacities are determined and how they are affected by anesthesia and surgery, the perianesthesia nurse should become familiar with the balance-of-forces concept of the respiratory system (see the section on combined mechanical properties of the lungs and chest wall). The PACU stir-up regimen is designed to increase the postoperative patient’s lung volumes and capacities with enhancement of the mechanical forces of the respiratory system.
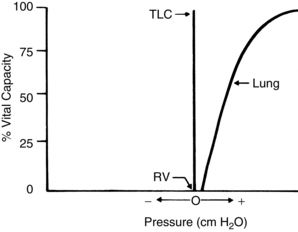
The lungs and chest wall are viscoelastic structures, one within the other. Because they are elastic, the lungs always want to collapse or recoil to a smaller position. Therefore, as can be seen in the pressure-volume (P-V) curve of the lungs alone (Fig. 12-8), at less than RV the lungs are collapsed and no pressure is transmitted across the lungs (i.e., no transpulmonary pressure). When the lungs are inflated to a volume halfway between RV and TLC, the lungs seek to recoil or collapse back to the resting position equal to or less than RV, which is reflected by an increase in transpulmonary pressure. When the lungs are fully inflated at TLC, a maximal transpulmonary pressure is also exhibited. By analogy, when a balloon is completely deflated, the pressure measured at the mouth of the balloon is zero. When the balloon is partially inflated, the pressure increases as the elastic forces of the balloon try to make the balloon recoil to its resting position. If the balloon is maximally inflated, the elastic recoil of the balloon is greater, as is the pressure measured at the mouth of the balloon.
Pulmonary hysteresis
Inflation and deflation paths of the P-V curve of the lung are not aligned on top of each other (Fig. 12-9). The path of deformation (inspiration) to TLC is different from the path followed when the force is withdrawn (expiration) from TLC to RV. This phenomenon is known as pulmonary hysteresis. The following factors contribute to pulmonary hysteresis: properties of the tissue elements (a minor factor), recruitment of lung units, and the surface tension phenomenon (surfactant).1
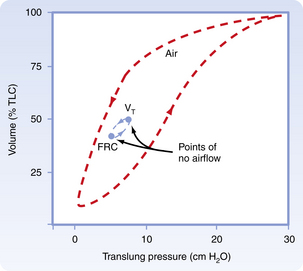
FIG. 12-9 Inflation and deflation paths of pressure-volume curve of lungs.
(From Koeppen BM, Stanton BA: Berne and Levy’s physiology, ed 6 [updated edition], St. Louis, 2010, Mosby.)
Recruitment of lung units
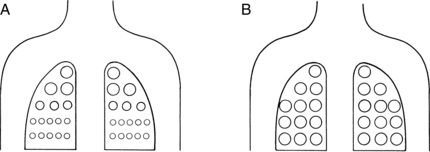
Recruitment of lung units has an important part in pulmonary hysteresis. For an understanding of recruitment of lung units, the nurse must be familiar with the concept of airway closure. An apex-to-base gradient of alveolar size exists in the lung (Fig. 12-10). This gradient occurs because of the weight of the lung, which tends to pull the lung toward its base. As a result, the pleural pressure is more negative at the apex than at the base of the lung. Ultimately, at low lung volumes, the alveoli at the apex are inflated more than the alveoli at the base. At the base of the lungs, some alveoli are closed to ventilation because the weight of the lungs in that area causes the pleural pressure to become positive. Airways open only when the critical opening pressure is achieved during inflation and the lung units peripheral to them are recruited to participate in volume exchange. This process is called radial traction or a tethering effect on airways. An analogy of a nylon stocking can aid in the explanation of this concept. When no traction is applied to the nylon stocking, the holes in the stocking are small. As traction is applied to the stocking from all sides, each nylon filament pulls on the others, which spreads apart all the other filaments; and the holes in the stocking enlarge. Similarly, as one airway opens, it produces radial traction on the next airway and pulls the next airway open; in other words, it recruits airways to open. The volume of air in the alveoli behind the closed airways is termed the closing volume (CV). The CV plus the RV is termed the closing capacity (CC). The CC normally occurs at less than the FRC.5
Surface tension phenomenon
The surface tension phenomenon relates to the action of surfactant on lung tissue. Surfactant is a phospholipid rich in lecithin that is produced by the type II alveolar cells. Surfactant lines the alveolus as a thin surface-active film. This film has a physiologic action of reducing the surface tension of the alveoli and terminal respiratory airways. If the surfactant were not present, the surface tension would be fixed and greater pressure would be needed to keep the alveolus open. As a result, small alveoli would empty into larger ones, atelectasis would regularly occur at low lung volumes, and large expanding pressures would be necessary to reopen collapsed lung units. Surfactant is also an important factor in alveolar inflation because it provides uniformity in the inflation of lung units. In these ways, surfactant helps to impart stability to alveoli in the normal lung. In addition to a major role in pulmonary hysteresis, surfactant also contributes to lung recoil and reduces the workload of breathing.8
Lung compliance

where V represents volume and P represents pressure.
Lung compliance is a measurement of the distensibility of the lungs during breathing. According to convention, CL means the slope on the static deflation portion of the P-V curve over the VT range; therefore CL can be said to be the slope of the P-V curve, and it may remain unchanged even if marked changes in lung elastic properties cause a shift of the P-V curve to the left or right. As a result, clinical measurement of lung compliance is done over the VT range, during deflation. Measurement of the CL over any other portion of the P-V curve can result in an inaccurate reading as compared with a normal value. Lung elastic recoil (PstL) is the pressure exerted by the lung (transpulmonary pressure) because of its tendency to recoil or collapse to a smaller resting state. At low lung volumes, the PstL is low; at high lung volumes, the PstL is high. This elastic retractive force (i.e., PstL) is the result of the overall structural elements of the lung combined with the lung surface tension forces. As mentioned previously, the CL represents the slope of the P-V curve, and the PstL represents the points along the P-V curve. Changes in CL and PstL have dramatic implications in the alteration of lung volumes that occurs in the immediate postoperative period (see the section on postoperative lung volumes).5
Equal pressure point
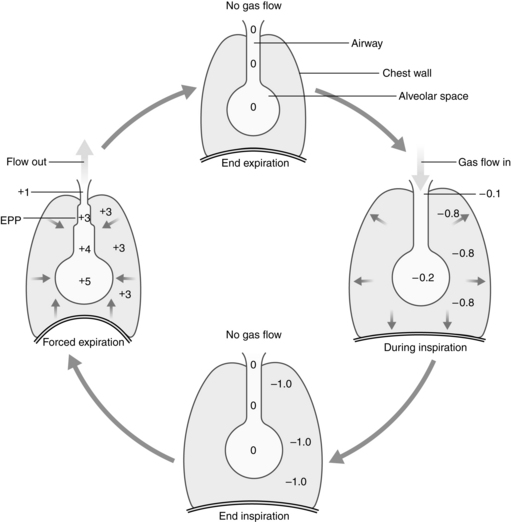
The alveoli and airways can be imagined as a balloon in a box (Fig. 12-11). Flow out of the balloon is facilitated by the recoil of the balloon, which forces the air out of the balloon through the neck and out into the atmosphere. The addition of pressure all over the box forces the air out of the balloon at a higher rate of flow. Physiologically, the balloon recoil is analogous to the alveolar recoil pressure. The pressure pushing down on the balloon and its neck corresponds to a positive pleural pressure that is generated on a forced expiratory maneuver. For the air to move out of the alveoli, the alveolar pressure must exceed the pressure at the mouth. The pressure inside the neck of the balloon corresponds to the intraluminal airway pressure. Consequently, the alveolar pressure comprises the recoil pressure of the alveoli and the plural pressure. Also, the pressure to generate air flow decreases down the airway to the mouth (see Fig. 12-11). During a forced expiratory maneuver, the plural pressure pushes down on the alveoli and the airways. If the alveolar recoil pressure is 30 and the plural pressure is 20, the alveolar pressure is 50. The pressure inside the airway (intraluminal pressure) decreases progressively downstream toward the mouth. The EPP occurs when the intraluminal pressure is equal to the plural pressure (20 = 20); from that point, the plural pressure exceeds the intraluminal pressure and dynamic compression of the airway occurs. Total collapse of the airways from the EPP and the mouth does not normally occur because of the compliance of the airways. Physiologically, the dynamic compression reduces the airways radius and thus results in an increase in flow rates in the compressed area that aids physiologic mechanisms, such as the cough maneuver, to sheer and expel secretions and mucus out of the airways.5
Pulmonary time constant
The pulmonary time constant is similar to the half-life used in assessment of the pharmacokinetic activity of drugs. A time constant represents the amount of time necessary for flow to decrease by a rate equal to half the initial flow. A time constant equals the resistance multiplied by the compliance. Therefore the time necessary to reach each time constant depends on the individual values of resistance and compliance. In normal conditions, the decrease in flow at the first time constant is approximately 37% of the initial flow, or approximately 63% of the total volume added or removed from the lungs. The first time constant represents the time necessary for removing or adding 63% of the total volume of air in the lungs. The decrease in flow rate at the second time constant is approximately 14%, and the percent volume of air added or removed from the lungs is 86%. The decrease in flow at the third time constant is 5%, with a corresponding 95% volume added or removed; therefore the higher the time constant, the more air removed or added to the lungs.4
Mechanical features of the chest wall
The action of the chest wall can be illustrated with the analogy of a wire screen attached around a balloon. The wire screen tends to spring outward so that the screen pulls the balloon open at lower balloon volumes. A measure of the pressure at the mouth of the balloon reflects a negative number. At approximately 60% of the total capacity of the balloon, the screen no longer tends to spring outward. At that point, the addition of air causes the screen to push down on the balloon—a reflection of a positive pressure at the mouth of the balloon. The screen around the balloon can be likened to the chest wall. As shown in Fig. 12-12, at lower lung volumes, the chest wall clearly is inclined to recoil outward, thus creating a negative pressure. At approximately 60% of the VC, the chest wall starts to push down on the lungs, thus creating a positive pressure. The result of the interplay between the chest wall’s strong tendency to spring outward and the lung’s strong tendency to recoil inward is the subatmospheric pleural pressure.5
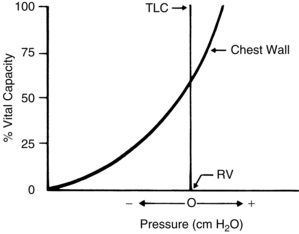
Pleural pressure can become positive during a cough or other forced expiratory maneuvers. Pneumothorax can occur when the chest wall is opened or when air is injected into the pleural cavity. With this occurrence, the lungs collapse because they naturally recoil to a smaller position; the ribs flare outward because of their natural inclination to recoil outward. Clinically, inspection of a patient with a pneumothorax may reveal protruding ribs on the affected side.
The two types of pneumothorax are open (simple) and closed (tension). Simple pneumothorax occurs when air flow into the pleural space results in a positive pleural pressure. The lungs collapse because the recoil pressure is not counterbalanced with the negative pleural pressure. Treatment for a pneumothorax can be conservative or more aggressive, depending on the type and amount of pneumothorax. Aggressive treatment consists of the insertion of chest tubes into the pleural space to recreate the negative pleural pressure. This maneuver reestablishes normal ventilatory excursions. In most instances, the air leak between the lung and the pleural space seals after the chest tubes have been removed. If air continues to flow into the intrapleural space but cannot escape, the intrapleural pressure continually increases with each succeeding inspiration. Like a one-way valve, pressure increases and a tension pneumothorax develops. In a brief period, as the intrapleural pressure increases, the affected lung is compressed and puts a great amount of pressure on the mediastinum. Hypoxemia and reduction in cardiac output result, and if treatment is not instituted immediately, the patient may die. Treatment consists of immediate evacuation of the excess air from the intrapleural space with either chest tubes or a large-bore needle. A tension pneumothorax is truly a medical emergency.2
Combined mechanical properties of the lungs and chest wall
The combined P-V characteristics of the lungs and the chest wall have many implications for the perianesthesia nurse. The combined P-V curve is the algebraic sum of the individual P-V curves of the lungs and chest wall. When no muscle forces are applied to the respiratory system, the FRC is determined by a balance of elastic forces between the lungs and the chest wall (Fig. 12-13). Any pathophysiologic or pharmacologic process that affects the elasticity of either the lungs or the chest wall affects the FRC.
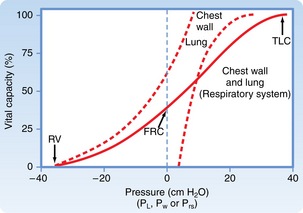
FIG. 12-13 Combined P-V curves of lungs and chest wall. Individual P-V curves of lungs and chest wall are represented with dashed lines. They are transposed from static deflation P-V curves of lungs (see Fig. 12-8) and chest wall (see Fig. 12-12). The combined P-V curve is the algebraic sum of deflation curves of the lungs and chest wall. In a combined P-V curve, FRC can be seen to be determined by balance of elastic forces of the lungs and chest wall when no respiratory muscles are applied. P-V, Pressure-volume; TLC, total lung capacity; RV, residual volume; FRC, functional residual capacity.
(From Koeppen BM, Stanton BA: Berne and Levy’s physiology, ed 6 [updated edition], St. Louis, 2010, Mosby.)
Alterations in the balance of pulmonary forces in the perianesthesia patient
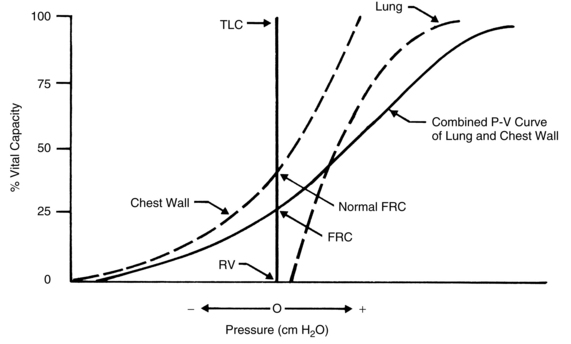
During the induction of anesthesia, the shape of the P-V curve of the chest wall is altered. This agent-independent phenomenon is probably the result of loss of chest wall elasticity. Thus the P-V curve of the chest wall of a patient with normal lung function is shifted to the right, the balance of forces occurs sooner, and the FRC decreases (Fig. 12-14). This shift to the right affects the P-V curve of the lung; it also shifts to the right, and secondary changes occur in the lung. More specifically, the changes consist of an increase in lung recoil (↑PstL) and a decrease in CL (↓CL). Ultimately, the lung becomes stiffer, and the FRC decreases and may drop into the closing capacity range. Therefore, during tidal ventilation, some airways are closed to ventilation and ventilation-perfusion mismatching occurs (↓ alveolar ventilation/perfusion [↓VA/QC]), which ultimately leads to hypoxemia. Research indicates that this phenomenon, coupled with sighless breathing patterns in the PACU, can cause patients to have hypoxemia in the recovery phase of the anesthetic (see the section on postoperative lung volumes).9
Pulmonary circulation
Gas exchange
Of the 5 L of blood that flows through the lungs every minute, only 70 to 200 mL are active in gas exchange at any one time. The time a red blood cell (RBC) takes to cross the pulmonary capillary bed is 0.75 seconds, but the RBC takes only 0.25 seconds to become saturated with oxygen—that is, until all the oxygen-bonding sites on the hemoglobin molecule are occupied. Because the transit time is 0.75 seconds and the saturation time is only 0.25 seconds, the body has a tremendous backup of 0.5 seconds for hemoglobin saturation with oxygen.5 If the RBCs move across the pulmonary capillary bed at an accelerated pace (decreased transit time), the amount of time available for oxygen to saturate the RBCs is decreased. During stress or exercise, however, the complete saturation of the hemoglobin can still be accomplished because the transit time of a RBC rarely decreases at less than 0.25 seconds.5
However, this process is not true for patients with interstitial fibrosis who have a thickened respiratory exchange membrane. These patients may have a normal PaO2 at rest, but exercise or exertion of surgery increases the cardiac output and decreases the RBC transit time; therefore the hemoglobin does not become completely saturated during its passage through the pulmonary capillary bed. This phenomenon occurs because more time is needed for oxygen to pass through the diseased membrane. For these patients, the lower limit for complete saturation may be 0.5 seconds, not 0.25 seconds. As a result, patients with disorders of the respiratory exchange membrane can have a lower oxygen saturation (SaO2) on the pulse oximeter with any exertion that could decrease RBC transit time. Clinically, this phenomenon is sometimes called desaturation on exercise. Patients in the PACU who are suspected of having this problem should be given low-flow oxygen and be closely monitored for desaturation via a pulse oximeter. Because of the possibility of desaturation, the low-flow oxygen administration should not be discontinued until the patient’s condition stabilizes, which could indicate continued administration after the patient is discharged from the PACU. Measures should be started to reduce the extrinsic factors, such as stress, elevated body temperature, and anxiety, which increase the cardiac output.
The pulmonary and systemic circulations have the same pump—the heart. The pulmonary system receives the same cardiac output as the systemic circulation, approximately 5 L/min. The pulmonary circulation, in comparison with the systemic circulation, is a low-pressure system with low resistance to flow, distensible vessels with extremely thin walls, and a small amount of smooth muscle. Many stimuli affect pulmonary vascular resistance. Probably the most potent vasoconstrictor of the lung is alveolar hypoxia. Research indicates that neuroendothelial bodies, which respond to a low PaO2, may exist close to the pulmonary vascular bed. In addition, the neuroendothelial bodies can liberate prostaglandins or histamine, or both, when alveolar hypoxia is present. Pulmonary vascular resistance does not seem to be affected by the volatile anesthetics such as enflurane and isoflurane. However, nitrous oxide can increase pulmonary vascular resistance, especially in patients with preexisting pulmonary hypertension. Neonates who may or may not have preexisting pulmonary hypertension are prone to developing increased pulmonary vascular resistance when nitrous oxide is administered. If a patient in the PACU is prone to developing increased pulmonary vascular resistance, the effect of nitrous oxide on pulmonary vascular resistance is almost dissipated as a result of the rapid excretion from the lungs of nitrous oxide because of its low blood-gas coefficient.8
Nutrition
The pulmonary circulation can be divided into the bronchial circulation and the actual pulmonary circulation. The bronchial circulation carries nutrients and oxygen down to the respiratory bronchioles in the lungs. The bronchial circulation empties its deoxygenated blood via the pulmonary veins to the left heart. The pulmonary circulation carries nutrients to the respiratory bronchioles and the alveoli.1
Protection
The role of the lungs in protection is vital for the preservation of the human organism. For example, on the surface of the pulmonary epithelium are invaginations called caveolae. Bradykinin and angiotensin I are enzymatically converted on the surface of the caveoli. Ninety percent of the bradykinin is deactivated in the caveoli during each pass through the lungs, and angiotensin I is converted to angiotensin II with angiotensin-converting enzyme in the lungs. In the presence of hypoxia, the conversion of angiotensin I to angiotensin II is inhibited. Also, in the hypoxemic state, less than 12% of the bradykinin is deactivated by the lungs, and in the hypoxemic state the liberated bradykinin then become prostaglandins. Interestingly, the inappropriate levels of prostaglandins as a result of hypoxemia in the chronic state are thought to produce the clubbing of the fingers in patients with long standing chronic hypoxemia. Finally, the pulmonary epithelium also deactivates norepinephrine and serotonin. Serotonin plays an important part in platelet aggregation. Increased levels of serotonin from decreased lung function caused by hypoxia or lung disease lead to a high risk for venous thrombus. The implications for PACU care are that patients who are immobile and hypoxemic (SaO2 < 90%) should be monitored for pulmonary and systemic thromboemboli.1
Water balance in the lung
The alveoli stay dry with a combination of pressures and lymph flow (Fig. 12-15). The forces that tend to push fluid out of the pulmonary capillaries are the capillary hydrostatic pressure (Pcap) minus the interstitial fluid hydrostatic pressure (Pis). The forces that tend to pull fluid into the pulmonary capillaries are the colloid osmotic pressure of the proteins in the plasma of the pulmonary capillaries (πpl) minus the colloid osmotic pressure of the proteins in the interstitial fluid (πis). The Starling equation describes the movement of fluid across the capillary endothelium:
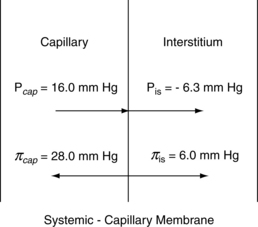
With substitution of normal values into the Starling equation:


Thus, the pressure favors flow out of the capillaries to the interstitium of the alveolar wall tracts through the interstitial space to the perivascular and peribronchial spaces to facilitate transport of the fluid to the lymph nodes. As a result, a net pressure of 7 torr pushes fluid to the interstitial space. The lymph flow draining the lungs is approximately 20 mL/h in rate of flow; therefore the lungs depend on a continuous net fluid flux to remain in a consistently “dry” state.5
Pulmonary edema is difficult to assess in the early stages. As the fluid volume increases in the interstitium that surrounds the blood vessels and airways, reflex bronchospasm may occur. A chest radiograph at this time reveals Kerley B lines, which denote fluid in the interstitium. When the lymphatics become completely overwhelmed, fluid enters the alveoli. In the beginning of this pathophysiologic process, fine crackles are heard on auscultation. As pulmonary edema progresses into the alveoli, coarse crackles are heard, especially at the base of the lungs. Because of the direct stimulation of the J receptors in the interstitium, the patient has a tachypneic ventilatory pattern. Initial arterial blood gas values show a low PaO2 and PaCO2. As the pulmonary edema progresses, the PaCO2 increases because hyperventilation (tachypnea) is not able to counterbalance the rise in the carbon dioxide in the blood. Finally, when the pulmonary edema becomes fulminant, the sputum becomes frothy and blood tinged.9,11
Blood gas transport
in which PTOTAL is total atmospheric pressure, PN2 is partial pressure of nitrogen, and PO2 is partial pressure of oxygen. If the actual numeric quantities then are substituted into the formula5:

As expressed in percentages, 100% (total atmospheric pressure) is equal to 79.07% (nitrogen) plus 20.93% (oxygen); therefore nitrogen is 601 torr (0.7907 × 760), and oxygen is 159 torr (0.2093 × 760). In the lower airways, water vapor exerts a pressure that can be accounted for with Dalton’s law. At the body temperature of 37° C, the water vapor pressure in the lower airways is 47 torr. Because the water vapor pressure affects the partial pressures of both nitrogen and oxygen, it is subtracted from the atmospheric pressure of 760 torr, which results in a pressure of 713 torr (760 torr – 47 torr = 713 torr). For determination of the PO2 in the lower airways, the percent oxygen (20.93) is multiplied by 713 torr, with a resulting PO2 of 149.2 torr. The respiratory exchange ratio can be used to understand how the alveolar partial pressure of oxygen is determined. This ratio represents carbon dioxide production divided by oxygen consumption. The normal respiratory exchange ratio is 0.8. Theoretically, then, for every 12 torr of carbon dioxide that is added to the alveolus, 12 torr of oxygen is displaced. Therefore, with no respiratory pathophysiology present, if the PaCO2 is 40 torr, 48 torr of oxygen is removed from the alveolus, in which: 4 × 10 = 40 torr (carbon dioxide) and thus 4 × 12 = 48 torr (oxygen).
The result is a PaO2 of 101 torr (149 torr – 48 torr = 101 torr), which is called the 12-10 concept and is helpful in assessment of arterial blood gas determinations in the PACU (see the section on causes of hypoxemia).
As oxygen diffuses across the pulmonary membrane, the PO2 is further decreased to 95 torr by a venous admixture. This effect occurs because of vascular shunts that normally redirect 1% or 2% of the total cardiac output either to nonaerated areas in the lungs themselves or directly through the heart, bypassing the lungs.3
Oxygen transport
Normally, the oxygen content of the arterial blood is 19.8 mL/dL of blood. This total oxygen content in the arterial blood (CaO2) is equal to the oxygen-carrying capacity of hemoglobin, which is 1.34 times the number of grams of hemoglobin.3 That number divided by 100 is the oxygen content carried by the hemoglobin. To determine the total amount of oxygen in the blood, the oxygen content that is dissolved in the plasma must be added to the oxygen content of the hemoglobin. The amount of oxygen dissolved in the plasma is determined with multiplication of the PaO2 by the solubility coefficient for oxygen in plasma, which is 0.003.
Therefore the equation for the total oxygen content in the blood is:

The oxygen-hemoglobin dissociation curve relates the percentage of oxygen saturation of hemoglobin to the PaO2 value. Note in Fig. 12-16 that the curve is sigmoid in shape with a steep portion between the 10- and 50-torr PaO2 range, with a leveling off above 70 torr. The flat portion of the curve indicates the capacity to oxygenate most of the hemoglobin despite wide variations in the PO2 (70 to 98 torr). This flat portion of the curve can be called the association portion of the curve, and it corresponds to the external respiration that is taking place in the lungs. The steep portion of the curve indicates the capacity to unload large amounts of oxygen in response to small tissue PO2 changes. This part of the curve is called the dissociation portion of the oxygen-hemoglobin dissociation curve.
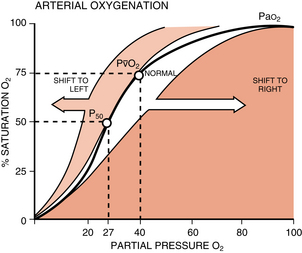
FIG. 12-16 Oxyhemoglobin dissociation curve.
(From Frownfelter D, Dean E: Cardiovascular and pulmonary physical therapy, ed 4, St. Louis, 2006, Mosby.)
in which PvO2 is pressure of oxygen in the mixed venous blood.
Therefore, in this example, the net delivery of oxygen to the tissues is 4.6 mL of oxygen per deciliter of blood (19.8 – 15.2 = 4.6).3
Factors that affect oxygen transport
At the dissociation portion of the oxygen-hemoglobin dissociation curve, the same is true. This portion is not a fixed line because it also changes position in response to physiologic processes. At the tissue level, metabolically active tissues produce more carbon dioxide and more acid (↓ pH) and have an elevated temperature. These products of metabolism shift the curve to the right. The curve shifts far more in response to physiologic processes in the dissociation portion than in the association part. Metabolically active tissues produce more carbon dioxide and need more oxygen. The effect of carbon dioxide on the curve is closely related to the fact that deoxyhemoglobin binds hydrogen ions more actively than does oxyhemoglobin. As a result, at the tissue level, increased carbon dioxide decreases the affinity of hemoglobin for oxygen. The dissociation portion of the curve is shifted to the right and more oxygen is given to the tissue. This effect of carbon dioxide on oxygen transport is called the Bohr effect.
2,3-Diphosphoglycerate (2,3-DPG) regulates the release of oxygen to the tissue; it is a glycolytic intermediary metabolite that is more concentrated in the RBCs than anywhere else in the body. High concentrations of 2,3-DPG shift the oxyhemoglobin dissociation curve to the right, which makes oxygen more available to the tissues. Lower concentrations of 2,3-DPG cause a shift of the curve to the left, which ultimately leads to the release of less oxygen to the tissues. The clinical implications of these observations involve the administration of outdated whole blood. Whole blood stored longer than 21 days has low levels of 2,3-DPG. As a result, if outdated blood is administered to a patient, the tissues do not receive an appropriate amount of oxygen because of the shift to the left of the oxygen-hemoglobin dissociation curve.3
Pulse oximetry and the oxygen dissociation curve
Oxygen delivered to the tissues is determined by the cardiac output and the CaO2. Most of the oxygen is bound to the hemoglobin, and the percentage of the oxygen bound to the hemoglobin is expressed as the SaO2. The amount of oxygen that is dissolved in simple solution in the arterial blood is the PaO2. A gradient is set from the lung to the tissues in regard to oxygen delivery and is represented by the oxygen dissociation curve. A normal curve, without any shifts left or right, is determined by the PaCO2, pH, body temperature, and hemoglobin and 2,3-DPG levels. A normal curve is therefore set at values of PaCO2 of 40 torr, pH of 7.4, temperature of 37° C, and hemoglobin of 15 g/dL. With the oxygen dissociation curve (see Fig. 12-16), the PaO2 can be determined with the SaO2 reading on the pulse oximeter. For example, an SaO2 of 90% corresponds to a PaO2 of 60 torr. With the curve, at an SaO2 less than 90%, the PaO2 drops rapidly (the dissociation portion of the curve). Clinically, an SaO2 of 90% can be considered hypoxemia, and severe hypoxemia occurs when the PaO2 is less than 40 torr or the SaO2 is 75%.10
Carbon dioxide transport
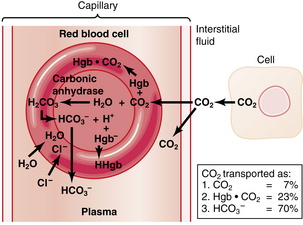
The transport of carbon dioxide begins within each cell in the body. Carbon dioxide is a main byproduct of the energy-supplying mechanisms of the cell. Approximately 200 mL/min of carbon dioxide is produced within the body at rest. Carbon dioxide is 20-fold more soluble in water than oxygen; therefore it traverses the fluid compartments of the body rapidly. The intracellular partial pressure of carbon dioxide is 46 torr. A 1-torr gradient exists between the cell and the interstitial fluid. Carbon dioxide diffuses out of the cell to the interstitial fluid and has a new partial pressure of 45 torr. When the tissue capillary blood enters the venules, the partial pressure of the carbon dioxide is 45 torr.10 Carbon dioxide is transported in the blood in three forms: (1) physically dissolved in solution; (2) as carbaminohemoglobin; and (3) as bicarbonate ions.
Carbaminohemoglobin
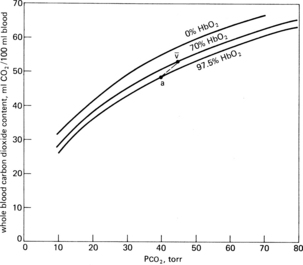
Approximately 30% of carbon dioxide is transported as carbaminohemoglobin, a chemical combination of carbon dioxide, and hemoglobin that is reversible because the binding point on the hemoglobin is on the amino groups and is a loose bond. This chemical bonding of carbon dioxide with hemoglobin can be graphically described with the use of the carbon dioxide dissociation curve. Two differences are found between the carbon dioxide dissociation curve (Fig. 12-17) and the oxygen-hemoglobin dissociation curve. First, over the normal operating range of blood the partial pressure of carbon dioxide (PCO2) from 47 torr (venous or PvCO2) to 40 torr (arterial or PaCO2), the slope of the carbon dioxide dissociation curve is nearly linear and not sigmoid like the oxygen-hemoglobin dissociation curve. Second, the total carbon dioxide content is approximately twofold the total oxygen content. Oxygen has a definite effect on carbon dioxide transport. On the upper curve, or venous portion of the carbon dioxide curve, note that the point for the PvCO2 is 47 and the PvO2 is 40. On the lower curve, or arterial carbon dioxide curve, observe the points for the PaCO2 of 40 torr and the PaO2 of 100 torr. Notice how the venous carbon dioxide curve is shifted to the left and is above the arterial curve. This description is the effect of oxygen on carbon dioxide transport, or the Haldane effect. In terms of physiologic significance, the Haldane effect plays a more important role in gas transport than does the Bohr effect. Specifically in the lungs, the binding of oxygen with hemoglobin tends to displace carbon dioxide from the hemoglobin (oxyhemoglobin is more acidic than deoxyhemoglobin). At the tissue level, oxygen is removed from the hemoglobin (as the result of a pressure gradient), which reduces the acidity of the hemoglobin and enables it to bind more carbon dioxide. In fact, because the hemoglobin is in the reduced state (deoxygenated), the hemoglobin can carry 6 volumes percent more carbon dioxide than the amount of carbon dioxide that could be carried by oxyhemoglobin.4
Bicarbonate
This reaction occurs mostly within the RBCs because carbonic anhydrase accelerates the hydration of carbon dioxide to carbonic acid 220 to 300 times faster than if carbon dioxide and water were joined without this enzymatic catalyst.4
When the bicarbonate produced in this reaction in the RBCs exceeds the bicarbonate ion level in the plasma, it diffuses out of the cell. The positively charged hydrogen ion tends to remain within the RBC and is buffered by hemoglobin. Chloride, a negatively charged ion that is abundant in the plasma, diffuses into the RBC to maintain electric balance because of ionic imbalance. This movement is called the chloride shift. Because of the increase in osmotically active particles within the cell, water from the plasma diffuses into the RBCs. This process explains why the RBCs in the venous side of the circulation are slightly larger than the arterial RBCs (Fig. 12-18).
Acid-base relationships
A buffer is a substance that causes a lesser change in hydrogen ion concentration to occur in a solution on addition of an acid or base than would have occurred had the buffer not been present. The buffers can respond in seconds to fluctuations in carbon dioxide tension. Buffers include the carbonic acid–bicarbonate system, the proteinate-protein system, and the hemoglobinate-hemoglobin system.3
The normal bicarbonate level in the extracellular fluid is 24 mEq. Base excess is used to describe alkalosis or acidosis. If a positive base excess number is noted, more base in the extracellular fluid is indicated. If a negative number is reported, the base is being used to neutralize the acid to a point of encroaching on the amount of available base, which is shown with a negative value for the base excess (acidosis).3
Respiratory acid-base imbalances
Respiratory acidosis is characterized by a PaCO2 above the normal range of 36 to 44 torr. All other primary processes that tend to cause acidosis are metabolic. Some common causes of carbon dioxide retention and respiratory acidosis are summarized in Box 12-1.
BOX 12-1 Common Causes of Carbon Dioxide Retention and Respiratory Acidosis (Hypoventilation)
Respiratory alkalosis is characterized by a reduced PaCO2. Hyperventilation frequently causes this disorder. Common causes of excessive carbon dioxide elimination and respiratory alkalosis are summarized in Box 12-2.
BOX 12-2 Common Causes of Excessive Carbon Dioxide Elimination and Respiratory Alkalosis (Hyperventilation)
• In acute respiratory acidosis, bicarbonate concentration is approximately 1 mEq/L for each 12-torr change in PaCO2.
• In chronic respiratory acidosis, the change in actual bicarbonate concentration is approximately 2 mEq/L for each 12-torr change in PaCO2.
• The change in actual bicarbonate concentration with a chronic change in PaCO2 above the range of 40 torr change is approximately 4 mEq/L for each 12-torr change in PaCO2. This rule holds true for 1 or 2 days after the onset of the disorder because of the slow renal buffer system.
Another rule for determining whether the acid-base disorder is entirely respiratory in origin is that an acute increase in PaCO2 by 12 torr produces a corresponding decrease in pH by 0.07 pH units. In chronic hypercapnia, each increase in PaCO2 by 12 torr results in a corresponding decrease in pH by 0.03 pH units. PaCO2 and pH changes that deviate significantly from these standards suggest that the acid-base disorder is not completely respiratory in origin. For example, if a patient who is recovering from a spinal anesthetic in the PACU has blood gases (room air) of PaO2 of 92 torr, PaCO2 of 30 torr, and pH of 7.47 compared with preoperative arterial blood gas values (room air) of PaO2 of 80 torr, PaCO2 of 40 torr, and pH of 7.40, then the rule can be applied. Because the PaCO2 decreased by 12 torr and the pH increased by 0.07 pH units, the patient clearly has respiratory alkalosis and not a metabolic disorder. Moreover, by applying the 12-12 concept, it is likely that this patient probably has acute hyperventilation because the PaCO2 decreased by 12 and thus the PaO2 should increase by 12, or from 80 to 92 torr.
Metabolic acid–base imbalances
Metabolic acidosis usually results with an increase in nonvolatile acids or a loss of bases from the body. The usual result is a deficit in buffer, base excess, and bicarbonate. Because acidosis stimulates respiration, the PaCO2 usually decreases. The magnitude of the ventilatory response usually differentiates between acute and chronic metabolic acidosis. Some of the common causes of metabolic acidosis are summarized in Box 12-3.
BOX 12-3 Common Causes of Metabolic Acidosis
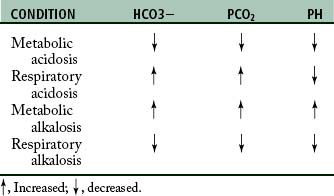
Metabolic alkalosis is produced by an excessive elimination of nonvolatile acids (such as in vomiting, gastric aspiration, and hypokalemic alkalosis) or by an increase in bases (such as in alkali administration or hypochloremic alkalosis caused by some diuretics). A summary of blood gas discrepancies in each condition is provided in Table 12-3.
Matching of ventilation to perfusion
Distribution of ventilation
A gravity dependent gradient of pleural pressure in the upright lung exists at resting lung volumes. The weight of the lung tends to pull the lung tissue toward the base of the lung. As a result, the intrapleural pressure is more negative at the apex of the lung in comparison with the intrapleural pressure at the base and over the VT range (the alveoli at the apex being more fully inflated compared with the alveoli at the base). Consequently, the alveoli at the base have a greater capacity for volume change during inspiration, whereas the alveoli at the apex are already “stretched,” or distended. In a healthy subject who breathes out to RV and then inspires in small steps, the initial inspired air (a small portion) goes to the apex and the base remains completely underventilated. After a certain lung volume is attained, the base of the lung receives almost all the air because of the capacity of the alveoli at the base of the lung for volume change. Therefore, because of the mechanical properties of the lung, the greatest volume change during inspiration from RV to TLC occurs near the base of the lungs.5
Matching
If blood and gas were matched equally throughout the lung, the V. A/Q. C would be 1. However, in the healthy lung, the matching of ventilation to perfusion is not proportional, which results in varying V. A/Q. C throughout the lung. More specifically, ventilation at the apex is high as opposed to perfusion, and perfusion is higher than ventilation at the base of the lung. Finally, if all the V. A/Q. C relationships were added together, the mean ratio would be 0.8.5
Causes of hypoxemia
Hypoventilation
The PaO2 and PaCO2 are determined with the balance between the addition of oxygen and the removal of carbon dioxide by the alveolar ventilation and the removal of oxygen and the addition of carbon dioxide by the pulmonary capillary blood flow. If the alveolar ventilation is decreased (with no other lung pathologic changes present), the PaO2 decreases and the PaCO2 increases. In fact, the PaO2 decreases almost proportionally to the increase in the PaCO2. Recall the calculations made in the 12-12 concept. At any specific inspired oxygen tension, a 12-torr increase in the PaCO2 causes an approximate 12-torr decrease in the arterial oxygen tension. For example, if the normal PaCO2 is equal to 40 torr and the PaO2 is equal to 95 torr and the patient’s alveolar ventilation decreases because of opioids given in the PACU, the PaCO2 increases to 60 torr. The new PaO2 should be 71 torr (change of 20 torr in the PaCO2, so 12 + 12 = 24 – 95 = 71). Therefore, with assessment of blood gas data and with the 12-10 relationship determined to be present, hypoventilation should be suspected. Note that the 12-10 relationship does not have to be exact, but if the numbers are close to the 12-10 relationship, hypoventilation is the probable cause. An increased FiO2 value affects the 12-10 relationship. However, most patients in the PACU undergo low-flow oxygen therapy; therefore the FiO2 is usually between 25% and 50%. Consequently, if the values seem to change proportionally, hypoventilation can still be suspected. Hypoventilation is the most common cause of hypoxemia in the PACU. Nursing interventions should include administration of a higher FiO2 via low-flow oxygen therapy, stimulation of the patient, use of an aggressive stir-up regimen, and possible pharmacologic reversal of opioids or muscle relaxants.9
Ventilation or perfusion mismatching
If the 12-10 relationship is not present during the analysis of the arterial blood gases, V. A/Q. C mismatching is probably the cause. However, it is difficult to determine whether the mismatching problem is the result of increased or decreased V. A/Q. C. As seen in Fig. 12-19 normal V. A/Q. C exists when appropriate matching of ventilation to perfusion occurs. Decreased V. A/Q. C occurs when the matching ventilation is reduced in comparison with perfusion of the alveoli, and increased V. A/Q. C is caused by increased ventilation as compared with perfusion.
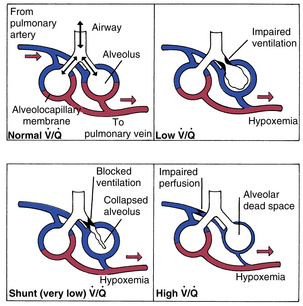
Decreased ventilation to perfusion
At this point, a clarification of terms used to describe decreased V. A/Q. C and shunt is in order. Basically, intrapulmonary shunts result in the mixing of venous blood that has not been properly oxygenated into the arterial blood (pulmonary vein). Anatomic shunts, which occur normally, are attributed to the 2% or 3% of the cardiac output that bypasses the lungs. The shunted unoxygenated venous blood comes mainly from the bronchial circulation, which empties into the pulmonary veins, and from the thebesian vessels that drain the myocardium into the left heart. Intrapulmonary shunts occur when mixed venous blood does not become oxygenated when it passes by underventilated, unventilated, or collapsed alveoli. Absolute intrapulmonary shunts, sometimes called true shunts, are associated with totally unventilated or collapsed alveoli. Shuntlike intrapulmonary shunts are the areas of low V. A/Q. C in which blood draining the partially obstructed alveoli has a lower arterial oxygen content than the alveolar capillary units that are well matched. As a result, the presence of anatomic shunts is normal. Abnormal shunts can be classified as physiologic shunts. Physiologic shunts are composed of the anatomic shunts plus intrapulmonary shunts (absolute and shuntlike intrapulmonary shunts).
Increased ventilation to perfusion
According to Fig. 12-20, compromise of the circulation to the individual alveolocapillary unit creates an excess of ventilation in comparison with perfusion. If the flow of blood in the pulmonary capillary is partially obstructed, increased V. A/Q. C results. If the flow of blood is completely obstructed, such as with a pulmonary embolus, only ventilation continues and produces wasted or dead space. Wasted ventilation is the total amount of inspired gas that does not contribute to carbon dioxide removal; it is also known as physiologic dead space (VDphysio). VDphysio is that volume of each breath that is inhaled but does not reach functioning terminal respiratory units. VDphysio has two components: alveolar and anatomic dead space. Alveolar dead space (VDalv), as depicted in Fig. 12-20, is that volume of air contributed by all those terminal respiratory units that are overventilated relative to their perfusion. Anatomic dead space (VDanat) consists of the volume of air in the conducting airways that does not participate in gas exchange. This category includes all air down to the respiratory bronchioles. The following formula depicts VDphysio:
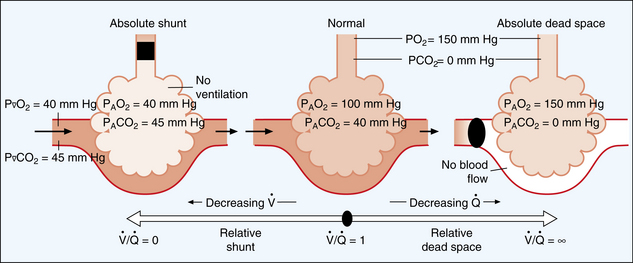
FIG. 12-20 The shunt-dead-space continuum.
(From Beachey W: Respiratory care anatomy and physiology, ed 2, St. Louis, 2007, Mosby.)

in which the PaCO2 is the arterial carbon dioxide partial pressure and the PECO2 is the partial pressure of the expired carbon dioxide.
Implications for perianesthesia care
Capnography, however, is a graphic display of instantaneous CO2 concentration (FCO2) versus time or expired volume during a respiratory cycle. It provides information about CO2 production, pulmonary perfusion, alveolar ventilation, and respiratory patterns and is effective in the early detection of adverse respiratory events such as hypoventilation and apnea.12 Capnography is often used in the PACU on intubated and complex patients, but may also be used with nonintubated complex patients or patients who require sedation.
Regulation of breathing
In the past, medullary control of breathing was thought to be a function of reciprocal inhibition between the inspiratory and expiratory centers. Research now indicates a more discrete regulatory process that occurs at two levels: the sensors and the controllers.5 Patients with altered regulation and control of breathing present a significant challenge to the perianesthesia nurse. In addition, anesthesia, surgery, and medications administered in the PACU can have a profound effect on the patient’s regulatory processes of breathing.
The sensors
Peripheral chemoreceptors
The carotid and aortic bodies mainly respond to a low PaO2. This response is commonly called the hypoxic or secondary drive. The impulse activity in these chemoreceptors begins at a PaO2 of approximately 500 torr. A rapid increase in impulses occurs at a PaO2 lower than 100 torr. The impulses are greatly increased as the PaO2 falls to a value less than 60 torr. At less than 30 torr, the impulse activity from the chemoreceptors decreases because of the direct oxygen deficit in the glomus cells. In addition, these peripheral arterial chemoreceptors are stimulated by low arterial blood pressure and increased sympathetic activity.5
Central chemoreceptors
The central chemoreceptors lie near the ventral surface of the medulla. Specifically, these chemosensitive areas are near the choroid plexus (venous blood) and next to the cerebrospinal fluid (CSF). The central chemoreceptors respond indirectly to carbon dioxide because the blood-brain barrier allows lipid-soluble substances (e.g., carbon dioxide, oxygen, water) to cross the barrier, whereas water-soluble substances (e.g., sodium, potassium, hydrogen ion, bicarbonate) pass through the membrane at extremely slow rates. Bicarbonate requires active transport to cross the barrier; therefore carbon dioxide enters the CSF and is hydrated to form carbonic acid. The carbonic acid rapidly dissociates to form hydrogen ion and bicarbonate. The hydrogen ion concentration in the CSF parallels the arterial PCO2. Actually, the hydrogen ion concentration stimulates ventilation via hydrogen receptors located in the central chemoreceptor area. In summary, carbon dioxide has little direct effect on the stimulation of the receptors in the central chemoreceptor area, but does have a potent indirect effect. This indirect effect is the result of the inability of hydrogen ions to easily cross the blood-brain barrier. For this reason, changes in hydrogen ion concentration in the blood have considerably less effect in stimulating the chemoreceptor area than do changes in carbon dioxide. Consequently, the central chemoreceptor area precisely controls ventilation and therefore the PaCO2. For that reason, the index to the adequacy of ventilation is the PaCO2.
Bicarbonate is the only major buffer in the CSF. The pH of the CSF is a result of the ratio between bicarbonate and carbon dioxide in the CSF. Carbon dioxide is freely diffusible in and out of the CSF via the blood-brain barrier. However, bicarbonate is not freely diffusible and requires active or passive transport to enter or leave the CSF. When an acute increase in the PaCO2 occurs, carbon dioxide enters the CSF and is hydrated, and hydrogen ions and bicarbonate are formed. The hydrogen ion stimulates the chemoreceptors, and the bicarbonate decreases the pH of the CSF. The resultant hyperpnea lowers the blood PaCO2 and thus creates a gradient that favors the diffusion of carbon dioxide out of the CSF. The blood PaCO2 and pH are corrected immediately, but the pH in the CSF requires some time to reestablish a normal carbon dioxide–bicarbonate level because bicarbonate is poorly diffusible. This process is usually not a problem with normal respiratory function. However, for the patient with chronic carbon dioxide retention (chronic hypercapnia) who has hyperventilation to a normal PaCO2 of 40 torr, serious deleterious effects can occur. Patients with a chronically elevated PaCO2 have a higher amount of carbon dioxide and bicarbonate in the CSF, but the ratio is maintained in a chronic situation. In this instance, the patient is breathing at a higher set point. That is, instead of maintenance at 40 torr, the normal PaCO2 for this patient might be maintained at 46 torr and near-normal sensitivity to changes in the PaCO2 may be present. If this patient underwent aggressive ventilation in the PACU with the goal of lowering the PaCO2 to 40 torr, significant negative repercussions could occur. With a lower PaCO2, the carbon dioxide in the CSF diffuses out and the bicarbonate remains because of its inability to diffuse out of the CSF. Thus, an excess of bicarbonate compared with carbon dioxide (↑ bicarbonate pool) exists in the CSF and causes the primary stimulus to ventilation to cease. Because the patient’s condition is hyperventilation, the PaCO2 decreases and the PAO2 increases (because of the 12-10 concept). Therefore the secondary (hypoxic) drive may also become extinguished, and this patient may have no effective drive for ventilation. If patients with chronic hypercapnia are acutely hyperventilated, they must be monitored for apnea once the accelerated ventilation is discontinued. A more appropriate technique is the maintenance of the PaCO2 at the level that is normal for that patient to avoid an apneic situation.4 Thus, for the patient with chronic carbon dioxide retention who is emerging from anesthesia, an overaggressive stir-up regimen (hyperventilation) should be avoided. The patient should perform the SMI at normal intervals, and the arterial blood gas values should be closely monitored.
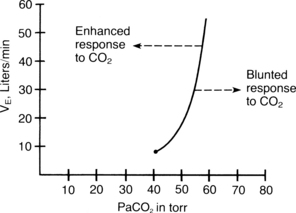
Response to carbon dioxide
Carbon dioxide is the primary stimulus to ventilation. The carbon dioxide response test is used for assessment of the ventilatory response to carbon dioxide. In this test, the subject inhales carbon dioxide mixtures (with the PaO2 held constant) so that the inspired PaCO2 gradually increases. Normally the VE increases linearly as the PaCO2 increases (Fig. 12-21). Some disease states and drugs cause the carbon dioxide response curve to shift to the left or the right. If the curve shifts to the left, the subject is more responsive to carbon dioxide. Factors such as thyroid toxicosis, aggressive personality, salicylates, and ketosis shift the curve to the left. A decreased ventilatory response to carbon dioxide occurs when the curve is shifted to the right and is called a blunted response. Patients who have a blunted response to carbon dioxide need intensive perianesthesia nursing care. The ventilatory response to an increased concentration of inspired carbon dioxide is blunted by hypothyroidism, mental depression, aging, general anesthetics, barbiturates, and narcotics. Many patients in the PACU either have these conditions or have received these drugs during surgery. This blunted response to carbon dioxide is one of the main justifications for supplemental oxygen administration to all patients who are emerging from anesthesia in the PACU. This response is also the rationale behind the need for critical perianesthesia nursing care that includes frequent assessment and interventions such as the stir-up regimen for prevention of respiratory depression.1
Lung receptors
Pulmonary stretch receptors (PSRs) lie within the smooth muscle of the small airways. These receptors are activated by marked distention or deflation (atelectasis) of the lungs. On marked inflation of the lungs, the activation of the PSR leads to a slowing of inspiratory frequency because of an increase in expiratory time. Bronchodilatation and tachycardia also can result from activation of these receptors. The PSRs are thought to be part of the Hering-Breuer reflex. The low threshold for the PSR is present for approximately the first 3 months of life; afterward, the threshold is high throughout adulthood. For the adult, the Hering-Breuer reflex is not important in the control of ventilation except in the anesthetized state. When an adult is administered general anesthesia and ventilation with prolonged maximal lung inflations, a prolonged expiratory time can result because of activation of the PSR.3
The J-receptors, or juxtapulmonary capillary–receptors, are located in the wall of the pulmonary capillaries. Like the irritant receptors, the afferent impulses of J-receptors are transmitted to the central nervous system by the vagus nerve. Normal stimuli of the J-receptors include pneumonia, pulmonary congestion, and increased interstitial fluid pressure. Stimulation of these receptors by interstitial or pulmonary edema results in tachypnea, bradycardia, and hypotension.9 Therefore the nurse should always evaluate the rate of ventilation in the assessment of patients who are at risk for development of pulmonary edema. With the knowledge that interstitial edema usually precedes pulmonary edema and that increased interstitial congestion stimulates the J-receptors, the nurse should consider a rapid shallow breathing pattern to be a danger signal and report it to the attending physician.
The controllers
The controllers of breathing are located in the central nervous system and comprise two functionally and anatomically separate components. Voluntary breathing is controlled in the cortex of the brain. Automatic breathing is controlled by structures within the brainstem. The spinal cord functions to integrate the output of the brainstem and the cortex. The cortex can override the other controllers of breathing if voluntary control is desired. Examples of voluntary control include voluntary hyperventilation and breath holding.1,3,5,6
Sleep apnea
The regulation of breathing has been described in detail, and obviously, multiple effects stimulate many levels of receptors to facilitate breathing. Yet, sleep apnea has become a major health issue and certainly a major concern in the perianesthesia setting. More than 12 million Americans are estimated to have some form of sleep apnea.13
Sleep apnea has three forms: obstructive, central, and mixed. Obstructive sleep apnea is caused by an obstruction or blockage of the airway. This obstruction usually occurs in the posterior pharynx, with soft tissue collapse leading to obstruction of the airway. Central sleep apnea is not a single disease entity but includes several disorders in which the definitive event is the withdrawal of effective central drive to the respiratory muscles. The mixed type of sleep apnea is a combination of obstructive and central components. Consequently, sleep apnea can be the result of a variety of pathophysiologic disorders, such as underlying defects in the respiratory controller or neuromuscular systems to include soft tissue collapse.14,15
The clinical manifestations of sleep apnea are variable because of the different mechanisms that can produce the syndrome. Fig. 12-22 schematically shows the physiologic responses and clinical features that result from sleep apnea. The risk factors for the development of sleep apnea are presented in Box 12-4, and the presenting symptoms that can be evaluated before surgery at the preoperative interview are presented in Box 12-5.
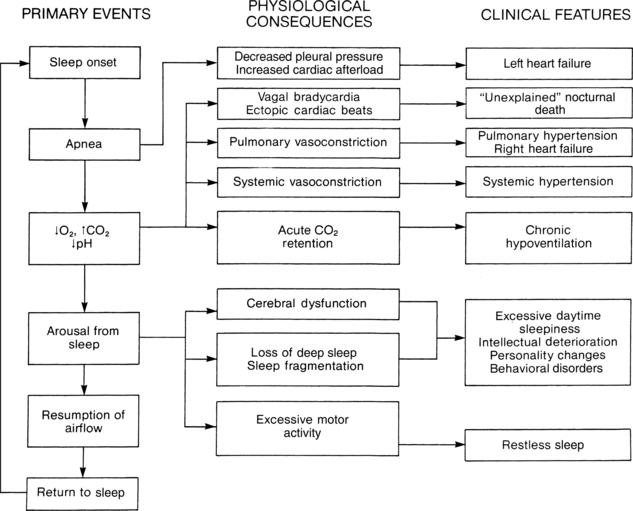
FIG. 12-22 Schematic of physiologic responses and clinical features that result from sleep apnea.
(From Mason RJ, et al: Murry and Nadel’s textbook of respiratory medicine, ed 4, Philadelphia, 2005, Saunders.)
BOX 12-4 Risk Factors Associated with Sleep Apnea
From American Sleep Apnea Association: Sleep apnea, available at www.sleepapnea.org/learn/sleep-apnea.html. Accessed December 7, 2011.
BOX 12-5 Signs and Symptoms Associated with Sleep Apnea
From American Sleep Apnea Association: Sleep apnea, available at www.sleepapnea.org/learn/sleep-apnea.html. Accessed December 7, 2011.
If obstructive sleep apnea occurs in a patient in the PACU, basic airway care should be given. Certainly sedation is not in the best interest of the patient, as a difficult airway is often present in the PACU. Many times, these patients come to the PACU after a tracheostomy is performed during surgery. Pediatric patients many times have a tonsillectomy and adenoidectomy for treatment of sleep apnea. Airway management should include: avoidance of the supine position, especially in adults; repositioning of the airway; supplemental oxygen; provision for a patent airway; and then application of continuous positive airway pressure via a nose mask, in that order of level of nursing interventions (see Chapter 30). Continuous positive airway pressure has been shown to be effective in patients with central sleep apnea associated with congestive heart failure, and it facilitates a more appropriate emergence from anesthesia or sedation.15
Postoperative lung volumes
Patients with abnormal pulmonary function
Preexisting pulmonary disease
Patients with preexisting pulmonary disease can have clinical or subclinical manifestations of the disease state. Consequently, preoperative pulmonary function tests are valuable when assessing the presence or absence of pulmonary pathophysiology and determining operative risk. Obstructive lung disease (i.e., asthma, emphysema, and chronic bronchitis), the most common category of lung disease, can be assessed with flow-volume measurements. Most pulmonary researchers suggest that a maximal voluntary ventilation that is less than 50% of what is predicted, a maximal expiratory flow rate less than 220 L/min, or a forced expiratory volume in 1 second less than 1.5 L indicates an increased operative risk for pulmonary complications. These flow-volume measurements are valuable predictors of the patient’s ability to generate an adequate cough, which is a pulmonary defense mechanism rendered ineffective in the immediate postoperative period by anesthesia and surgery.9 Consequently, these patients need vigorous informed nursing care in the immediate postoperative period. Priorities of nursing care should include frequent use of the stir-up regimen of turn, cascade cough, and SMI, along with the use of appropriate nursing interventions designed to enhance secretion clearance, which ensures airway patency.
Patients with restrictive lung disease (i.e., pulmonary fibrosis and morbid obesity) represent a significant risk for postoperative pulmonary complications when pulmonary function test results reveal a VC or a diffusion capacity of less than 50% of predicted values or exercise arterial blood gas values that show slight hypoxemia on exertion. In the PACU, these patients need a vigorous stir-up regimen with attention to tissue oxygenation via monitoring for hypoxemia. This regimen is needed because, during the surgical experience and in the PACU, physiologic stress can occur. One of the major products of physiologic stress is an increase in cardiovascular parameters, which reduces the transit time of the RBCs across the respiratory gas exchange membrane. Because of the pathologic changes in the respiratory membrane, patients with restrictive lung disease can have desaturation on exertion, such as in the stress reaction.11
Cigarette smoking
Chronic cigarette smoking has been shown to increase the incidence rate of postoperative pulmonary complications. Patients who smoke only 12 cigarettes per day have a sixfold increase in pulmonary morbidity rates in the postoperative period. The incidence rate of pulmonary embolism is higher in the smoker because of increased coagulability produced by chronic cigarette smoking. The ciliated epithelium of the lungs is damaged by chronic cigarette smoking. This damage can cause some blockage of the mucociliary transport system, which finally results in bronchiolar obstruction, infection, and atelectasis. Patients who smoke should be encouraged to stop smoking for at least 2 weeks before surgery to allow the mucociliary transport system to return to a nearly normal level of function. The focus of nursing care for the active chronic cigarette smoker should be similar to the interventions discussed for the patient with obstructive lung disease as the major clinical issue is a thickened pulmonary membrane that inhibits the transport of oxygen to the blood and carbon dioxide crossing over from the blood to the air. This also plays a part in the emergence from anesthesia because patients who are chronic cigarette smokers will have a slow emergence, especially when the anesthesia time exceeds 2 hours.4
Obesity
The patient who is markedly overweight has a significant chance of developing postoperative pulmonary complications caused by the altered lung volumes and capacities from the excess adipose tissue. Expansion of the lungs is hindered by an enlarged abdomen, which elevates the diaphragm and adds weight on the chest wall, thereby hindering the outward recoil of the chest wall. This hindrance leads to decreased thoracic wall compliance and ultimately to a reduced FRC. Finally, these complications result in hypoxemia from increased airway closure and V. A/Q. C abnormalities (see Chapter 45). The goal of nursing interventions in the PACU is the prevention of further airway closure; therefore a vigorous stir-up regimen, including early ambulation, should help prevention of further reduction in the FRC. That measure reduces the amount of airway closure, alleviates the hypoxemia, and ultimately improves the outcome of the patient.3,15
Advanced age
Patients of advanced age (older than 70 years) have a slightly higher risk of developing postoperative pulmonary complications. A greater decrease in the FRC after surgery in patients of advanced age has been shown. Because the closing volume increases with age, significant airway closure can occur after surgery during tidal ventilation. Although advanced age is not associated with the same degree of risk as the factors previously discussed, it can increase the danger of the other risk factors. However, patients of advanced age should receive a vigorous stir-up regimen in the PACU, if only because of the alterations in lung mechanics.9
Physiology of perianesthesia pulmonary nursing care
Because of the change in the mechanical properties of the lungs and chest wall, patients emerging from anesthesia have decreased lung volumes and capacities (Fig. 12-23). This decrease is especially true of the patient who has undergone a thoracic or upper abdominal surgical procedure. In the PACU, a further reduction in lung volumes and capacities may be seen. The major factor that contributes to this reduction in lung volumes in the patient after surgery is a shallow, monotonous, sighless breathing pattern that is caused by general inhalation anesthesia, pain, and opioids. Sighless ventilation can result in an uneven distribution of surfactant and a loss of stability of the small airways and alveoli, which can then lead to alveolar collapse and ultimately to atelectasis. Normally, adults breathe regularly and rhythmically, spontaneously performing a maximal inspiration that is held for approximately 3 seconds at the peak of inspiration. This physiologic process, or SMI, is commonly called a sigh or a yawn.
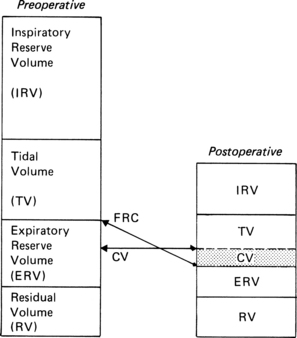
In normal lungs, the closing volume is less than the resting lung volume (i.e., the FRC), and airways remain open during tidal breathing. In the immediate postoperative period, patients who have a sighless, monotonous, low-VT ventilatory pattern usually have a reduced FRC. When the FRC plus VT is within the closing volume range, the airways that lead to dependent lung zones can be closed effectively throughout tidal breathing (see Fig. 12-23). Inspired gas then is distributed mainly to the upper or nondependent lung zones. Perfusion continues to follow the normal gradient, with higher flows to the dependent areas of the lung.
Various investigators have shown a decrease in lung volumes in the postoperative period. Patients who have undergone an upper abdominal surgical procedure have an immediate postoperative decrease in the FRC from hour 1 to hour 2 (Fig. 12-24).4 The FRC then seems to return to near the baseline value by approximately the fourth postoperative hour. A second subsequent decrease in the FRC is then seen after hour 4, and baseline values are not restored until 5 days after surgery. A possible explanation of the “peaks and valleys” in the FRC during the postoperative period may be that the first reduction in the FRC is associated with anesthesia and the latter reduction may be from pain. General inhalation anesthesia and pain can dampen the physiologic sigh mechanism. Consequently, all patients who have undergone a surgical procedure, especially those who have incision sites near the thorax or diaphragm, should be strongly encouraged to perform the SMI maneuver both in the PACU and on the surgical unit. The incentive spirometer, a device designed to use positive feedback to encourage the patient to perform the SMI maneuver, can be used by the patient on the surgical unit.
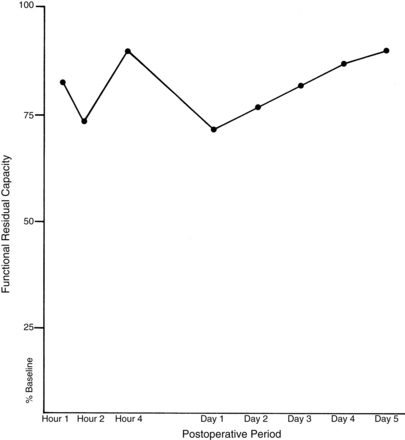
Oxygen administration in the postanesthesia care unit
Administration of oxygen to the patient in the PACU is an important facet in the emergence phase of anesthesia. Oxygen is given to the patient in the PACU primarily because of the blunted or depressed response to carbon dioxide and low lung volumes. Administration of supplemental oxygen during the recovery phase of anesthesia is especially important for the patient who has received a general or spinal anesthetic. The methods of oxygen administration are summarized in Chapter 27.
Perianesthesia nursing care
A patent airway must be maintained throughout the administration of oxygen. The patient should be encouraged to cascade cough, perform the SMI, and change positions according to the stir-up regimen discussed in this chapter and in Chapter 27. If a nasal catheter is used, the catheter should be removed every 6 hours for cleansing and reinsertion into the other nostril. In addition, the nasal mucosa should be inspected periodically for dryness when a nasal catheter or prongs are used. Oxygen given in the dry gas form can cause drying and irritation of the mucosa, impair the ciliary action, and thicken secretions; therefore oxygen should always be administered with humidity.
Oxygen toxicity
Eyes
Premature infants who have a high PaO2 for longer than 24 hours are at risk for development of retrolental fibroplasia, which is caused by vasoconstriction of the blood vessels of the retina as a result of high oxygen concentrations in the blood. Retrolental fibroplasia presents in an acute form as vascular retinopathy at the developing edge of blood vessels in the premature infant’s eye. This presentation is followed by perivascular exudation, tissue hyperplasia, and scar tissue that exerts traction on the retina and leads to retinal detachment and destruction of the infant’s vision. Research indicates that the incidence rate of acute retrolental fibroplasia is inversely proportional to birth weight. Most of the clinical research indicates that, to minimize the risk of development of retrolental fibroplasia, the infant’s PaO2 should be maintained between 60 and 90 torr. Perianesthesia nurses should use their best-informed judgment when caring for these infants. As with the adult, the infant who needs a high-inspired oxygen concentration to provide adequate oxygenation should not be denied oxygen because of fear of complications.6
Lungs
Concentrations of oxygen greater than 60% damage the lungs within 3 or 4 days. A 120% oxygen concentration administered for 24 to 48 hours also causes pulmonary damage, the signs of which are manifested by type II cell dysfunction in the lung. The type II cells secrete surfactant, and the lack of surfactant in the alveoli leads to alveolar collapse. The hyperoxic environment also stops the ciliary action in the lungs. The early symptoms of this disorder include cough, nasal congestion, sore throat, reduced VC, tracheobronchitis, and substernal discomfort. The early signs of airway irritation may appear when a patient has received 80% to 120% oxygen continuously for 8 hours or longer. The lung appears to indefinitely tolerate oxygen concentrations lower than 40%.1
1. Barrett K, et al. Ganong’s review of medical physiology, ed 23. New York: McGraw-Hill Medical; 2009.
2. Aitkenhead A, et al. Textbook of anesthesia, ed 5. Philadelphia: Churchill Livingstone; 2007.
3. Hall J. Guyton and Hall textbook of medical physiology, ed 12. Philadelphia: Saunders; 2010.
4. Nagelhout J, Plaus K. Nurse anesthesia, ed 4. St. Louis: Saunders; 2010.
5. Mason R. Murray and Nadel’s textbook of respiratory medicine, ed 5. Philadelphia: Saunders; 2011.
6. Miller R, et al. Anesthesia, ed 7. Philadelphia: Churchill Livingstone; 2009.
7. Brunton L, et al. Goodman and Gilman’s the pharmacological basis of therapeutics, ed 12. New York: McGraw-Hill Professional; 2010.
8. Stoelting R. Pharmacology and physiology in anesthetic practice, ed 4. Philadelphia: Lippincott Williams & Wilkins; 2005.
9. Atlee J. Complications in anesthesia, ed 2. Philadelphia: Saunders; 2007.
10. Barash P, et al. Clinical anesthesia, ed 6. Philadelphia: Lippincott Williams & Wilkins; 2009.
11. Fisher L. Anesthesia and uncommon diseases, ed 5. Philadelphia: Saunders; 2007.
12. Kodali BS. Why capnography. available at www.capnography.com/new/index.php?option=com_content&view=article&id=48&Itemid=57, September 23, 2011. Accessed
13. American Sleep Apnea Association. available at www. sleepapnea.org, September 14, 2011. Accessed on
14. Moos D, Cuddeford D. Implications of obstructive sleep apnea syndrome for the perianesthesia nurse. J Perianesth Nurs. 2006;21(2):103–118.
15. Passannante A, et al. Anesthestic management of patients with obesity and sleep apnea. Anesthesiol Clin North Am. 2005;23:479–490.
AACN. Core curriculum for progressive care nursing,. Philadelphia: Saunders; 2010.
Alspach J. Core curriculum for critical care nursing, ed 6. Philadelphia: Saunders; 2005.
Bready L, et al. Decision making in anesthesiology, ed 4. St. Louis: Mosby; 2007.
Conlay L, et al. Case files anesthesiology. New York: McGraw-Hill Medical; 2011.
Drake R, et al. Gray’s anatomy for students, ed 2. Philadelphia: Churchill Livingstone; 2009.
Deutschman C, Netigan P. Evidence-based practice of critical care. Philadelphia: Saunders; 2010.
Dorsch J, Dorsch S. Understanding anesthesia equipment, ed 5. Philadelphia: Lippincott Williams & Wilkins; 2007.
Gallager C, Issenberg B. Simulation in anesthesia. Philadelphia: Saunders; 2007.
Kaplan J, et al. Cardiac anesthesia. New York: Churchill Livingstone; 2011.
Longnecker D, et al. Anesthesiology. New York: McGraw-Hill Medical; 2007.
Miller R, Pardo M. Basics of anesthesia, ed 6. Philadelphia: Saunders; 2011.
Pasero C, McCaffery M. Perianesthesia nursing core curriculum: preprocedure, phase I and phase II PACU nursing. St. Louis: Mosby; 2011.
Schick L, Windle PE. Perianesthesia nursing core curriculum, ed 2. Philadelphia: Saunders; 2010.
Shorten G, et al. Postoperative pain management: an evidence-based guide to practice. Philadelphia: Saunders; 2006.
Sieber F. Geriatric anesthesia. New York: McGraw-Hill Medical; 2006.
Townsend C, et al. Sabiston’s textbook of surgery, ed 18. Philadelphia: Saunders; 2008.
Vincent J, et al. Textbook of critical care, ed 6. Philadelphia: Saunders; 2011.
[/level-membership-for-critical-care-medicine-category][not-level-membership-for-critical-care-medicine-category]
12 The respiratory system
Acidemia: Lower-than-normal blood pH (increased hydrogen ion concentration).
Acidosis: The process that leads to an increase in hydrogen ion concentration in the blood.
Adventitious Sounds: Abnormal noises that may be heard superimposed on a patient’s breath sounds.
Alkalemia: Higher-than-normal blood pH (decreased hydrogen ion concentration).
Alkalosis: The process that leads to a decrease in hydrogen ion concentration in the blood.
Apnea: The absence of breathing.
Apneustic Breathing: Prolonged inspiratory efforts interrupted by occasional expirations.
Atelectasis: Collapse of the alveoli.
Bradypnea: Respiratory rate, in the adult, that is less than 8 breaths/min.
Bronchiectasis: Dilatation of the bronchi.
Bronchospasm: Constriction of the bronchial airways caused by an increase in smooth muscle tone in the airways.
Central Sleep Apnea: A cessation of breathing during sleep as a result of transient abolishment of the drive to the respiratory muscles.
Cheyne-Stokes Respirations: Periods of apnea alternating with rhythmic, shallow, and progressively deeper and then shallower respirations that are associated with brain damage, heart or kidney failure, or drug overdose.
Compliance (Lung): A measure of distensibility of the lungs; the amount of change in volume per change in pressure across the lung.
Cyanosis: A sign of poor oxygen transport, characterized by a bluish discoloration of the skin, produced when more than 5 g of hemoglobin per deciliter of arterial blood is in the deoxygenated, or reduced, state.
Dyspnea: A patient’s perception of shortness of breath.
Epistaxis: Hemorrhage from the nose.
Hypercapnia: Increased tension of carbon dioxide (PaCO2) in the blood.
Hyperoxemia: Increased tension of oxygen (PaO2) in the blood.
Hyperpnea: Increased rate of respirations.
Hyperventilation: Overventilation of the alveoli in relation to the amount of carbon dioxide produced by the body.
Hypocapnia: Decreased PaCO2 in the blood.
Hypoventilation: Underventilation of the alveoli in relation to the amount of carbon dioxide produced by the body.
Hypoxemia: Decreased PaO2 in the blood.
Hypoxia: Inadequate tissue oxygen levels.
Kussmaul Respirations: Rapid, deep respirations associated with diabetic ketoacidosis.
Methemoglobin: Hemoglobin that has the iron atom in the ferric state.
Minute Ventilation (V˙E): The volume of air expired during a period of 1 minute.
Orthopnea: Severe dyspnea that is relieved when the patient elevates the head and chest.
Oxyhemoglobin: Hemoglobin that is fully oxygenated.
Paroxysmal Nocturnal Dyspnea: A sudden onset of severe dyspnea when the patient is lying down.
Partial Pressure: The pressure exerted by each individual gas when mixed in a container with other gases.
Periodic Breathing: A regular waxing and waning of ventilation as a result of fluctuations in central respiratory drive.
Polycythemia: Increased number of red blood cells in the blood.
Rales: Short discontinuous explosive adventitious sounds, usually called crackles.
Reduced Hemoglobin: Hemoglobin in the deoxy state (not fully saturated with oxygen).
Respiration: The process by which oxygen and carbon dioxide are exchanged between the outside atmosphere and the cells in the body.
Rhonchi: Continuous musical adventitious sounds.
Sleep Apnea: Repeated absence of breathing during sleep, sometimes hundreds of times during the night and often for 1 minute or longer.
Torr: Units of the Torricelli scale, the classic mercury scale, which is used to express the same value as millimeters of mercury.
Ventilation: The mechanical movement of air in and out of the lungs.
Wheeze: A high-pitched sibilant rhonchus usually produced on expiration.
Respiratory system anatomy
The nose
The nose, the first area in which inhaled air is filtered (Fig. 12-1), is lined with ciliated epithelium. Cilia move mucus and particles of foreign matter to the pharynx to be expectorated or swallowed (Fig. 12-2). Other functions of the nose include humidification and warming of the inhaled air and the olfactory function of smell.1
FIG. 12-1 Sagittal section through the nose.
(From Watson R: Anatomy and physiology for nurses, ed 13, Edinburgh, 2011, Baillière Tindall.)
Dry gases are often administered during anesthesia. These gases dry the mucous membranes and slow the action of the cilia. The administration of moist gases in the PACU with various humidification and mist therapy devices keeps this physiologic filter system viable. A tracheostomy precludes the functions of the nose, and proper tracheostomy care, including the administration of humidified oxygen, must be instituted.2
The blood supply to the nose is provided by the internal and external maxillary arteries, which are derived from the external carotid artery, and by branches of the internal carotid arteries. The venous plexus of the nasal mucosa is drained into the common facial vein, the anterior facial vein, the exterior jugular vein, or the ophthalmic vein. A highly vascular plexus of vessels is located in the mucosa of the anterior nasal septum. This plexus is called the Kiesselbach plexus or the Little area. In most instances, this area is the source of epistaxis.3
Epistaxis can occur in the PACU after trauma to the nasal veins from nasotracheal tubes or to nasal airways during anesthesia. If epistaxis occurs, prompt action should be taken to prevent aspiration of blood into the lungs. The patient should be positioned with the head up and flexed forward toward the chest. Cold compresses applied to the bridge of the nose and neck may be effective in slowing or stopping the bleeding. If the bleeding is profuse, the oral cavity should be suctioned carefully and the attending physician should be notified. A nasal pack or cautery with silver nitrate or electric current may be necessary to stop the bleeding.4
The pharynx
The pharynx originates at the posterior aspect of the nasal cavities and is called the nasopharynx until it reaches the soft palate, where it becomes the oropharynx. The oropharynx extends to the level of the hyoid bone, where it becomes the laryngeal pharynx, which extends caudally to below the hyoid bone.1
The larynx
The larynx, or voice box (Fig. 12-3), is situated anterior to the third, fourth, and fifth cervical vertebrae in the adult male. It is situated higher in women and children. Nine cartilages held together with ligaments and intertwined with many small muscles constitute the larynx. The thyroid cartilage, the largest, is V-shaped; its protruding prominence is commonly referred to as the Adam’s apple. The thyroid cartilage is attached to the hyoid bone by the hyothyroid membrane and to the cricoid cartilage. The cricoid cartilage is situated below the thyroid cartilage and anteriorly forms a signet-shaped ring. The signet lies posteriorly as a quadrilateral lamina joined in front by a thin arch. The inner surface of the cricoid cartilage is lined with a mucus membrane. In children younger than 12 years, the cricoid cartilage is the smallest opening to the bronchi of the lungs.
FIG. 12-3 The larynx.
(Netter illustration from www.netterimages.com. © Elsevier Inc. All rights reserved.)
The epiglottis, a cartilage of the larynx, is an important landmark for tracheal intubation that serves to deflect foreign objects away from the trachea. This cartilage is leaf shaped and projects outward above the thyroid cartilage over the entrance to the trachea. The lower portion is attached to the thyroid lamina, and the anterior surface is attached to the hyoid bone and thereby to the base of the tongue. The valleys on either side of the glossoepiglottic fold are termed the valleculae.5
The fissure between the vocal folds, or true cords, is termed the rima glottidis or glottis. In the adult, this opening between the vocal cords is the narrowest part of the laryngeal cavity. Any obstruction in this area leads to death via suffocation if not relieved promptly. The rima glottidis divides the laryngeal cavity into two main compartments: (1) the upper portion is the vestibule, which extends from the laryngeal outlet to the vocal cords and includes the laryngeal sinus, sometimes called the middle compartment; and (2) the lower compartment, which extends from the vocal cords to the lower border of the cricoid cartilage and thereafter, is contiguous with the trachea.6
The muscles of the larynx are also either intrinsic or extrinsic. The intrinsic muscles control the movements of the laryngeal framework. They open the cords on inspiration, close the cords and the laryngeal inlet during swallowing, and alter the tension of the cords during speech. The extrinsic muscles are involved in the movements of the larynx as a whole, such as in swallowing.4
The nerve supply to the larynx is from the superior and recurrent laryngeal nerves of the vagus. The superior laryngeal nerve passes deep to both the internal and the external carotid arteries and divides into a small external branch that supplies the cricothyroid muscles that tense the vocal ligaments. The larger internal branch pierces the thyrohyoid membrane to provide sensory fibers to the mucosa of both sides of the epiglottis and the larynx above the cords.1
The recurrent laryngeal nerve on the right side exits from the vagus as it crosses the right subclavian artery and ascends to the larynx in the groove between the trachea and esophagus (Fig. 12-4). When the nerve reaches the neck, it assumes the same relationships as on the right. This nerve provides the motor function to the intrinsic muscles of the larynx, with the exception of the cricothyroid, and also provides sensory function to the laryngeal mucosa below the vocal cords.
FIG. 12-4 Left recurrent laryngeal nerve passing through the superior mediastinum.
(From Drake RL, et al: Gray’s anatomy for students, ed 2, Philadelphia, 2010, Churchill Livingstone.)
When a laryngospasm occurs in the PACU, prompt emergency treatment is necessary to save the patient’s life. The perianesthesia nurse should have someone on the PACU staff summon the anesthesia provider when laryngospasm is suspected. Treatment consists of mask ventilation with sustained moderate pressure on the reservoir bag. This maneuver usually helps to overcome the partial laryngospasm. Complete laryngospasm not relieved with positive pressure within at least 1 minute necessitates more aggressive treatment. Intravenous (0.5 mg/kg) or intramuscular (1 mg/kg) succinylcholine can be administered to relax the smooth muscle of the larynx. Endotracheal intubation may be necessary.7,8 The nurse must remember that ventilation of the patient’s lungs should be continued until complete respiratory functioning has returned.
The trachea
The area at the distal end of the trachea at the point of bifurcation into the right and left main stem bronchi is called the carina (Fig. 12-5). The carina contains sensitive pressoreceptors, which on stimulation (i.e., with an endotracheal tube) cause the patient to cough and “buck.” The angle created at the point of bifurcation into the right and left main stem bronchi is clinically significant to the perianesthesia nurse. This angle varies according to the age and gender of the patient (Table 12-1). The angle at the right main stem bronchus is smaller than the angle at the left main stem bronchus. Foreign material can easily enter the right main stem bronchus at this point. Endotracheal tubes, if advanced too far, usually enter the right main stem bronchus and thereby occlude the left main stem bronchus. As a result, the left lung cannot be ventilated. Signs of this complication include decreased or absent breath sounds in the left side of the chest, tachycardia, and uneven expansion of the chest on inspiration and expiration.5,9,10
FIG. 12-5 Bifurcation of trachea into main stem bronchi.
(From Nagelhout JJ, Plaus KL: Nurse anesthesia, ed 4, St. Louis, 2010, Saunders.)
Table 12-1 Variations of Bronchial Bifurcation Angles in Adults and Children
| RIGHT BRONCHUS (DEGREES) | LEFT BRONCHUS (DEGREES) | |
|---|---|---|
| Newborn | 12-35 | 30-65 |
| Adult male | 20 | 40 |
| Adult female | 19 | 51 |
Bronchi and lungs
Each primary bronchus supplies a number of lobar bronchi (Fig. 12-6). Humans have an upper, middle, and lower lobe bronchus on the right and only an upper and lower lobe bronchus on the left. Within each pulmonary lobe, a lobar (secondary) bronchus soon divides into tertiary branches that are remarkably constant as to number and distribution within the lobe. The segment of a lobe aerated by a tertiary bronchus is usually well delineated from adjoining segments by complete planes of connective tissue. These areas of the lung are well defined; therefore pulmonary diseases may be limited to a particular segment or segments of a lobe.
FIG. 12-6 Distribution of bronchi within lungs. Enlarged inset shows detail of alveolus.
(From National Association of Emergency Media: PHTLS prehospital trauma life support , ed 6, St. Louis, 2007, Mosby.)
The terminal bronchioles divide into the respiratory bronchioles in which actual gas exchange first occurs. The respiratory bronchioles bifurcate to form alveolar ducts, and these in turn terminate in spherical enclosures called the alveolar sac. The sacs enclose a small but variable number of terminal alveoli.3
The number of alveoli in an average adult’s lungs is estimated to be 750 million. The surface area available for gas exchange is approximately 125 m2. Alveoli are shaped like soap bubbles in a glass. The interalveolar septum has a supporting latticework composed of elastic collagenous and reticular fibers. The capillaries are incorporated into and supported by the fibrous lattice. The capillary networks in the lungs are the richest in the body.
The lungs receive unoxygenated blood from the left and right pulmonary arteries, which originate from the right ventricle of the heart. The divisions of the pulmonary artery tend to follow the bifurcations of the airway. Typically, two pulmonary veins exit from each lung, and all four veins empty separately into the left atrium. The blood that arrives in the rich pulmonary capillary network from the pulmonary arteries provides for the metabolic needs of the pulmonary parenchyma. Other portions of the lungs, such as the conducting vessels and airways, need their own private circulation. The bronchial arteries, which arise from the aorta, provide the oxygenated blood to the lung tissue. The blood of the bronchial arteries returns to the heart by way of the pulmonary veins.3
Respiratory system physiology
Lung volumes and capacities
Perianesthesia care of the patient is largely based on knowledge of the physiology and pathophysiology of the respiratory system. Dysfunction in lung volumes and capacities that occurs in the patient after surgery is the compelling reason for institution of the stir-up regimen in the PACU. Accordingly, the physiology of the lung volumes and capacities and lung mechanics are described in detail. Table 12-2 provides the definition and normal value for each lung volume and capacity. As shown in Table 12-2 and Fig. 12-7, a lung capacity comprises two or more lung volumes.
FIG. 12-7 Graphic representation of normal lung volumes and capacities.
(From Hall JE: Guyton and Hall textbook of medical physiology, ed 12, Philadelphia, 2011, Saunders.)
Lung volumes
The expiratory reserve volume (ERV) is the maximal amount of air that can be expired from the resting position after a normal spontaneous expiration. The ERV reflects muscle strength, thoracic mobility, and a balance of forces that determine the resting position of the lungs and chest wall after a normal expiration. This lung volume is usually decreased in patients who are morbidly obese (see Chapter 45). This lung volume also is decreased in the immediate postoperative period in patients who have undergone an upper abdominal or thoracic operation.5,9,10
The residual volume (RV) is the volume of air that remains in the lungs at the end of a maximal expiration. This lung volume represents the balance of forces of the lung elastic forces and thoracic muscle strength. Patients with skeletal muscle relaxant that was not adequately reversed at the end of the anesthetic period may have an elevated RV because enough muscle strength cannot be generated to force all the air out of the lungs. As the RV increases, more air remains in the lungs so that the air does not participate adequately in gas exchange and becomes dead-space air. As the dead-space volume of air increases, it can impinge on the VT and hypoxemia can ensue. The importance of the RV is that it allows for continuous gas exchange throughout the entire breathing cycle by providing air to most of the alveoli and it aerates the blood between breaths. Consequently, the RV prevents wide fluctuations in oxygen and carbon dioxide concentrations during inspiration and expiration.4
Lung capacities
Clinical measurements of the TLC, FRC, and RV are difficult because these values include a gas volume that cannot be exhaled; therefore the measurements require sophisticated pulmonary function testing equipment with gas dilution techniques or plethysmography. Measurements of lung volumes and capacities are useful in the evaluation of lung function.5
Lung mechanics
Mechanical features of the lungs
Mechanical forces of the respiratory system actually determine the lung volumes and capacities. For an understanding of how these lung volumes and capacities are determined and how they are affected by anesthesia and surgery, the perianesthesia nurse should become familiar with the balance-of-forces concept of the respiratory system (see the section on combined mechanical properties of the lungs and chest wall). The PACU stir-up regimen is designed to increase the postoperative patient’s lung volumes and capacities with enhancement of the mechanical forces of the respiratory system.
The lungs and chest wall are viscoelastic structures, one within the other. Because they are elastic, the lungs always want to collapse or recoil to a smaller position. Therefore, as can be seen in the pressure-volume (P-V) curve of the lungs alone (Fig. 12-8), at less than RV the lungs are collapsed and no pressure is transmitted across the lungs (i.e., no transpulmonary pressure). When the lungs are inflated to a volume halfway between RV and TLC, the lungs seek to recoil or collapse back to the resting position equal to or less than RV, which is reflected by an increase in transpulmonary pressure. When the lungs are fully inflated at TLC, a maximal transpulmonary pressure is also exhibited. By analogy, when a balloon is completely deflated, the pressure measured at the mouth of the balloon is zero. When the balloon is partially inflated, the pressure increases as the elastic forces of the balloon try to make the balloon recoil to its resting position. If the balloon is maximally inflated, the elastic recoil of the balloon is greater, as is the pressure measured at the mouth of the balloon.
Pulmonary hysteresis
Inflation and deflation paths of the P-V curve of the lung are not aligned on top of each other (Fig. 12-9). The path of deformation (inspiration) to TLC is different from the path followed when the force is withdrawn (expiration) from TLC to RV. This phenomenon is known as pulmonary hysteresis. The following factors contribute to pulmonary hysteresis: properties of the tissue elements (a minor factor), recruitment of lung units, and the surface tension phenomenon (surfactant).1
FIG. 12-9 Inflation and deflation paths of pressure-volume curve of lungs.
(From Koeppen BM, Stanton BA: Berne and Levy’s physiology, ed 6 [updated edition], St. Louis, 2010, Mosby.)
Recruitment of lung units
Recruitment of lung units has an important part in pulmonary hysteresis. For an understanding of recruitment of lung units, the nurse must be familiar with the concept of airway closure. An apex-to-base gradient of alveolar size exists in the lung (Fig. 12-10). This gradient occurs because of the weight of the lung, which tends to pull the lung toward its base. As a result, the pleural pressure is more negative at the apex than at the base of the lung. Ultimately, at low lung volumes, the alveoli at the apex are inflated more than the alveoli at the base. At the base of the lungs, some alveoli are closed to ventilation because the weight of the lungs in that area causes the pleural pressure to become positive. Airways open only when the critical opening pressure is achieved during inflation and the lung units peripheral to them are recruited to participate in volume exchange. This process is called radial traction or a tethering effect on airways. An analogy of a nylon stocking can aid in the explanation of this concept. When no traction is applied to the nylon stocking, the holes in the stocking are small. As traction is applied to the stocking from all sides, each nylon filament pulls on the others, which spreads apart all the other filaments; and the holes in the stocking enlarge. Similarly, as one airway opens, it produces radial traction on the next airway and pulls the next airway open; in other words, it recruits airways to open. The volume of air in the alveoli behind the closed airways is termed the closing volume (CV). The CV plus the RV is termed the closing capacity (CC). The CC normally occurs at less than the FRC.5
Surface tension phenomenon
The surface tension phenomenon relates to the action of surfactant on lung tissue. Surfactant is a phospholipid rich in lecithin that is produced by the type II alveolar cells. Surfactant lines the alveolus as a thin surface-active film. This film has a physiologic action of reducing the surface tension of the alveoli and terminal respiratory airways. If the surfactant were not present, the surface tension would be fixed and greater pressure would be needed to keep the alveolus open. As a result, small alveoli would empty into larger ones, atelectasis would regularly occur at low lung volumes, and large expanding pressures would be necessary to reopen collapsed lung units. Surfactant is also an important factor in alveolar inflation because it provides uniformity in the inflation of lung units. In these ways, surfactant helps to impart stability to alveoli in the normal lung. In addition to a major role in pulmonary hysteresis, surfactant also contributes to lung recoil and reduces the workload of breathing.8
Lung compliance
where V represents volume and P represents pressure.
Lung compliance is a measurement of the distensibility of the lungs during breathing. According to convention, CL means the slope on the static deflation portion of the P-V curve over the VT range; therefore CL can be said to be the slope of the P-V curve, and it may remain unchanged even if marked changes in lung elastic properties cause a shift of the P-V curve to the left or right. As a result, clinical measurement of lung compliance is done over the VT range, during deflation. Measurement of the CL over any other portion of the P-V curve can result in an inaccurate reading as compared with a normal value. Lung elastic recoil (PstL) is the pressure exerted by the lung (transpulmonary pressure) because of its tendency to recoil or collapse to a smaller resting state. At low lung volumes, the PstL is low; at high lung volumes, the PstL is high. This elastic retractive force (i.e., PstL) is the result of the overall structural elements of the lung combined with the lung surface tension forces. As mentioned previously, the CL represents the slope of the P-V curve, and the PstL represents the points along the P-V curve. Changes in CL and PstL have dramatic implications in the alteration of lung volumes that occurs in the immediate postoperative period (see the section on postoperative lung volumes).5
Equal pressure point
The alveoli and airways can be imagined as a balloon in a box (Fig. 12-11). Flow out of the balloon is facilitated by the recoil of the balloon, which forces the air out of the balloon through the neck and out into the atmosphere. The addition of pressure all over the box forces the air out of the balloon at a higher rate of flow. Physiologically, the balloon recoil is analogous to the alveolar recoil pressure. The pressure pushing down on the balloon and its neck corresponds to a positive pleural pressure that is generated on a forced expiratory maneuver. For the air to move out of the alveoli, the alveolar pressure must exceed the pressure at the mouth. The pressure inside the neck of the balloon corresponds to the intraluminal airway pressure. Consequently, the alveolar pressure comprises the recoil pressure of the alveoli and the plural pressure. Also, the pressure to generate air flow decreases down the airway to the mouth (see Fig. 12-11). During a forced expiratory maneuver, the plural pressure pushes down on the alveoli and the airways. If the alveolar recoil pressure is 30 and the plural pressure is 20, the alveolar pressure is 50. The pressure inside the airway (intraluminal pressure) decreases progressively downstream toward the mouth. The EPP occurs when the intraluminal pressure is equal to the plural pressure (20 = 20); from that point, the plural pressure exceeds the intraluminal pressure and dynamic compression of the airway occurs. Total collapse of the airways from the EPP and the mouth does not normally occur because of the compliance of the airways. Physiologically, the dynamic compression reduces the airways radius and thus results in an increase in flow rates in the compressed area that aids physiologic mechanisms, such as the cough maneuver, to sheer and expel secretions and mucus out of the airways.5
Pulmonary time constant
The pulmonary time constant is similar to the half-life used in assessment of the pharmacokinetic activity of drugs. A time constant represents the amount of time necessary for flow to decrease by a rate equal to half the initial flow. A time constant equals the resistance multiplied by the compliance. Therefore the time necessary to reach each time constant depends on the individual values of resistance and compliance. In normal conditions, the decrease in flow at the first time constant is approximately 37% of the initial flow, or approximately 63% of the total volume added or removed from the lungs. The first time constant represents the time necessary for removing or adding 63% of the total volume of air in the lungs. The decrease in flow rate at the second time constant is approximately 14%, and the percent volume of air added or removed from the lungs is 86%. The decrease in flow at the third time constant is 5%, with a corresponding 95% volume added or removed; therefore the higher the time constant, the more air removed or added to the lungs.4
Mechanical features of the chest wall
The action of the chest wall can be illustrated with the analogy of a wire screen attached around a balloon. The wire screen tends to spring outward so that the screen pulls the balloon open at lower balloon volumes. A measure of the pressure at the mouth of the balloon reflects a negative number. At approximately 60% of the total capacity of the balloon, the screen no longer tends to spring outward. At that point, the addition of air causes the screen to push down on the balloon—a reflection of a positive pressure at the mouth of the balloon. The screen around the balloon can be likened to the chest wall. As shown in Fig. 12-12, at lower lung volumes, the chest wall clearly is inclined to recoil outward, thus creating a negative pressure. At approximately 60% of the VC, the chest wall starts to push down on the lungs, thus creating a positive pressure. The result of the interplay between the chest wall’s strong tendency to spring outward and the lung’s strong tendency to recoil inward is the subatmospheric pleural pressure.5
Pleural pressure can become positive during a cough or other forced expiratory maneuvers. Pneumothorax can occur when the chest wall is opened or when air is injected into the pleural cavity. With this occurrence, the lungs collapse because they naturally recoil to a smaller position; the ribs flare outward because of their natural inclination to recoil outward. Clinically, inspection of a patient with a pneumothorax may reveal protruding ribs on the affected side.
The two types of pneumothorax are open (simple) and closed (tension). Simple pneumothorax occurs when air flow into the pleural space results in a positive pleural pressure. The lungs collapse because the recoil pressure is not counterbalanced with the negative pleural pressure. Treatment for a pneumothorax can be conservative or more aggressive, depending on the type and amount of pneumothorax. Aggressive treatment consists of the insertion of chest tubes into the pleural space to recreate the negative pleural pressure. This maneuver reestablishes normal ventilatory excursions. In most instances, the air leak between the lung and the pleural space seals after the chest tubes have been removed. If air continues to flow into the intrapleural space but cannot escape, the intrapleural pressure continually increases with each succeeding inspiration. Like a one-way valve, pressure increases and a tension pneumothorax develops. In a brief period, as the intrapleural pressure increases, the affected lung is compressed and puts a great amount of pressure on the mediastinum. Hypoxemia and reduction in cardiac output result, and if treatment is not instituted immediately, the patient may die. Treatment consists of immediate evacuation of the excess air from the intrapleural space with either chest tubes or a large-bore needle. A tension pneumothorax is truly a medical emergency.2
Combined mechanical properties of the lungs and chest wall
The combined P-V characteristics of the lungs and the chest wall have many implications for the perianesthesia nurse. The combined P-V curve is the algebraic sum of the individual P-V curves of the lungs and chest wall. When no muscle forces are applied to the respiratory system, the FRC is determined by a balance of elastic forces between the lungs and the chest wall (Fig. 12-13
[/not-level-membership-for-critical-care-medicine-category]
