The Pulmonary System
SYSTEMWIDE ELEMENTS
a. The pulmonary system exists for the purpose of gas exchange. Oxygen (O2) and carbon dioxide (CO2) are exchanged between the atmosphere and the alveoli, between the alveoli and pulmonary capillary blood, and between the systemic capillary blood and all body cells.
b. Atmospheric O2 is consumed by the body through cellular aerobic metabolism, which supplies the energy for life
c. CO2, a by-product of aerobic metabolism, is eliminated primarily through lung ventilation
d. The respiratory circuit includes all structures and processes involved in the transfer of O2 between room air and the individual cell, and the transfer of CO2 between the cell and room air
e. Cellular respiration cannot be directly measured but is estimated by the amount of CO2 produced ( co2) and the amount of O2 consumed (
 o2). Ratio of these two values is called the respiratory quotient. Respiratory quotient is normally about 0.8 but changes according to the nutritional substrate being burned (i.e., protein, fats, or carbohydrates). Patients fully maintained on intravenous (IV) glucose alone will have a respiratory quotient approaching 1.0 as a result of the metabolic end product, CO2.
f. Exchange of O2 and CO2 at the alveolar-capillary level (external respiration) is called the respiratory exchange ratio (R). This is the ratio of the CO2 produced to the O2 taken up per minute. In homeostasis, the respiratory exchange ratio is the same as the respiratory quotient, 0.8.
g. Proper functioning of the respiratory circuit requires efficient interaction of the respiratory, circulatory, and neuromuscular systems
h. In addition to its primary function of O2 and CO2 exchange, the lung also carries out metabolic and endocrine functions as a source of hormones and a site of hormone metabolism. In addition, the lung is a target of hormonal actions by other endocrine organs.
2. Steps in the gas exchange process
a. Step 1—Ventilation: Volume change, or the process of moving air between the atmosphere and the alveoli and distributing air within the lungs to maintain appropriate concentrations of O2 and CO2 in the alveoli
i. Structural components involved in ventilation
(1) Anatomic divisions: Right lung (three lobes—upper, middle, lower); left lung (two lobes—upper, lower). Lobes are divided into bronchopulmonary segments (ten right, nine left). Bronchopulmonary segments are subdivided into secondary lobules.
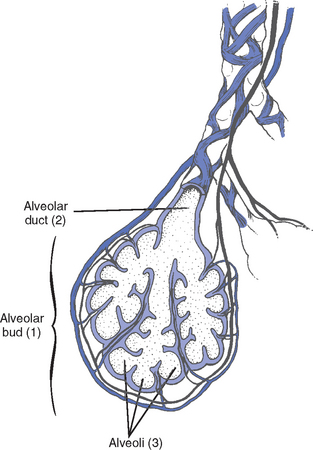
(2) Lobule: Smallest gross anatomic units of lung tissue; contain the primary functional units of the lung (terminal bronchioles, alveolar ducts and sacs, pulmonary circulation). Lymphatics surround the lobule, keep the lung free of excess fluid, and remove inhaled particles from distal areas of the lung.
(3) Bronchial artery circulation: Systemic source of circulation for the tracheobronchial tree and lung tissue down to the level of the terminal bronchiole. Alveoli receive their blood supply from the pulmonary circulation.
(b) Conducting airways: Entire area from the nose to the terminal bronchioles where gas flows, but is not exchanged, is called anatomic dead space (Vdanat). Amount is approximately 150 ml but varies with patient size and position. Airways are a series of rapidly branching tubes of ever-diminishing diameter that eventually terminate in the alveoli.
a) Serves as a passageway for air movement into the lungs
b) Preconditions air by the action of the cilia, mucosal cells, and turbinate bones
(2) Pharynx: Posterior to nasal cavities and mouth
a) Separation of food from air is controlled by local nerve reflexes
(3) Larynx: Complex structure consisting of incomplete rings of cartilage and numerous muscles and ligaments
a) Vocal cords: Speech function
1) Narrowest part of the conducting airways in adults
2) Contraction of muscles of the larynx causes the vocal cords to change shape
3) Vibration of the vocal cords produces sound. Speech is a joint function of the vocal cords, lips, tongue, soft palate, and respiration, with control by temporal and parietal lobes of the cerebral cortex.
b) Valve action by the epiglottis helps to prevent aspiration
c) Cough reflex: Cords close and intrathoracic pressure increases to permit coughing or Valsalva maneuver
(4) Trachea: Tubular structure consisting of 16 to 20 incomplete, or C-shaped, cartilaginous rings that stabilize the airway and prevent complete collapse with coughing
a) Begins the conducting system, or tracheobronchial tree
c) Mucosal cells trap foreign material
d) Cilia propel mucus upward through the airway
e) Cough reflex present, especially at the point of tracheal bifurcation (carina)
f) Smooth muscle innervated by the parasympathetic branch of the autonomic nervous system
(5) Major bronchi and bronchioles
a) Smooth muscle walls (no cartilage); bronchospasm may narrow the lumen and increase airway resistance
b) Ciliated mucosal cells become flattened, with progressive loss of cilia toward the alveoli
c) Sensitive to CO2 levels: Increased levels induce bronchiolar dilation, decreased levels induce constriction
(c) Gas exchange airways: Semipermeable membrane permits the movement of gases according to pressure gradients. These airways are not major contributors to airflow resistance but do contribute to the distensibility of the lung. The acinus (terminal respiratory unit) is composed of the respiratory bronchiole and its subdivisions (Figure 2-1).
(1) Respiratory bronchioles and alveolar ducts
a) Most important structures in gas exchange
b) Alveolar surface area is large and depends on body size. Total surface area is about 70 m2 in a normal adult. Thickness of the respiratory membrane is about 0.6 μm. This fulfills the need to distribute a large quantity of perfused blood into a very thin film to ensure near equalization of O2 and CO2.
1) Type I: Squamous epithelium, adapted for gas exchange, sensitive to injury by inhaled agents, structured to prevent fluid transudation into the alveoli
2) Type II: Large secretory, highly active metabolically; origin of surfactant synthesis and type I cell genesis
1) Phospholipid monolayer at the alveolar air-liquid interface; able to vary surface tension with alveolar volume
2) Enables surface tension to decrease as alveolar volume decreases during expiration, which prevents alveolar collapse
3) Decreases the work of breathing, permits the alveoli to remain inflated at low distending pressures, reduces net forces causing tissue fluid accumulation
4) Reduction of surfactant makes lung expansion more difficult; the greater the surface tension, the greater the pressure needed to overcome it
5) Surfactant also detoxifies inhaled gases and traps inhaled and deposited particles
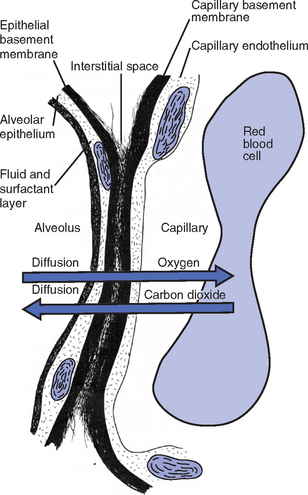
e) Alveolar-capillary membrane (alveolar epithelium, interstitial space, capillary endothelium)
1) Bathed by interstitial fluid; lines the respiratory bronchioles, alveolar ducts, and alveolar sacs; forms the walls of the alveoli
2) About 1 μm or less thick (less than one red blood cell); permits rapid diffusion of gases; any increase in thickness diminishes gas diffusion
3) Total surface area of about 70 m2 in an adult is in contact with about 60 to 140 ml of pulmonary capillary blood at any one time
f) Gas exchange pathway (Figure 2-2): Alveolar epithelium → alveolar basement membrane → interstitial space → capillary basement membrane → capillary endothelium → plasma → erythrocyte membrane → erythrocyte cytoplasm
ii. Alveolar ventilation ( A): That part of total ventilation taking part in gas exchange and, therefore, the only part useful to the body
(a) Alveolar ventilation is one component of minute ventilation
(1) Minute ventilation ( E): Amount of air exchanged in 1 minute. Equal to exhaled tidal volume (VT) multiplied by respiratory rate (RR or f). Normal resting minute ventilation in an adult is about 6 L/min:
VT × RR =  E (500 ml × 12 = 6000 ml)
Tidal volume is easily measured at the bedside by hand-held devices or a mechanical ventilator. Exhaled minute ventilation is a routinely measured parameter for patients on ventilators.
(2) Minute ventilation is composed of both alveolar ventilation ( A) and physiologic dead space ventilation (
 D):
D):
 E =
E =  D +
D +  A
Awhere  = volume of gas per unit of time
 danat) and alveolar dead space ventilation (
 dA).
dA).(3) Ratio of dead space to tidal volume (VD/VT) is measured to determine how much of each breath is wasted (i.e., does not contribute to gas exchange). Normal values for spontaneously breathing patients range from 0.2 to 0.4 (20% to 40%).
(b) Alveolar ventilation cannot be measured directly; it is inversely related to arterial CO2 pressure (Paco2) in a steady state by the following formula:
(c) Since  co2 remains the same in a steady state, measurement of the patient’s Paco2 reveals the status of the alveolar ventilation
(d) Paco2 is the only adequate indicator of effective matching of alveolar ventilation to metabolic demand. To assess ventilation, Paco2 must be measured.
(e) If Paco2 is low, alveolar ventilation is high; hyperventilation is present
 A
A(f) If Paco2 is within normal limits, alveolar ventilation is adequate
 A
A(g) If Paco2 is high, alveolar ventilation is low and hypoventilation is present
 A
Aiii. Defense mechanisms of the lung
(a) Although an internal organ, the lung is unique in that it has continuous contact with particulate and gaseous materials inhaled from the external environment. In the healthy lung, defense mechanisms successfully defend against these natural materials by the following means:
(1) Structural architecture of the upper respiratory tract, which reduces deposited and inhaled materials
(2) Processing system, including respiratory tract fluid alteration and phagocytic activity
(3) Transport system, which removes material from the lung
(4) Humoral and cell-mediated immune responses, which may be the most important bronchopulmonary defense mechanisms
(b) Loss of normal defense mechanisms may be precipitated by disease, injury, surgery, insertion of an endotracheal tube, or smoking
(c) Upper respiratory tract warms and humidifies inspired air, absorbs selected inhaled gases, and filters out particulate matter. Soluble gases and particles larger than 10 μm are aerodynamically filtered out. Normally, no bacteria are present below the larynx.
(d) Inhaled and deposited particles reaching the alveoli are coated by surface fluids (surfactant and other lipoproteins) and are rapidly phagocytized by pulmonary alveolar macrophages
(e) Macrophages and particles are transported in mucus by bronchial cilia, which beat toward the glottis and move materials in a mucus-fluid layer, eventually to be expectorated or swallowed. This process is referred to as the mucociliary escalator. Pulmonary lymphatics also drain and transport some cells and particles from the lung.
(f) Antigens activate the humoral and cell-mediated immune systems, which add immunoglobulins to the surface fluid of the alveoli and activate alveolar macrophages
(g) Disruption of or injury to these defense mechanisms predisposes to acute or chronic pulmonary disease
(a) Muscles of respiration: Act of breathing is accomplished through muscular actions that alter intrapleural and pulmonary pressures and thus change intrapulmonary volumes
(1) Muscles of inspiration: During inspiration, the chest cavity enlarges. This enlargement is an active process brought about by the contraction of the following:
a) Diaphragm: Major inspiratory muscle
1) Normal quiet breathing is accomplished almost entirely by this dome-shaped muscle, which divides the chest from the abdomen
2) Divided into two “leaves”—the right and left hemidiaphragms
3) Downward contraction increases the superior-inferior diameter of the chest and elevates the lower ribs
4) Innervation is from the C3 to C5 level through the phrenic nerve
5) Normally, accounts for 75% of tidal volume during quiet inspiration
6) Facilitates vomiting, coughing and sneezing, defecation, and parturition
b) External intercostal muscles
1) Increase the anterior-posterior (A-P) diameter of the thorax by elevating the ribs
2) A-P diameter is about 20% greater during inspiration than during expiration
c) Accessory muscles in the neck: Scalene and sternocleidomastoid
(2) Muscles of expiration: During expiration, the chest cavity decreases in size. This is a passive act unless forced, and the driving force is derived from lung recoil. Muscles used when increased levels of ventilation are needed are the following:
(b) Pressures within the chest: Movement of air into the lungs requires a pressure difference between the airway opening and alveoli sufficient to overcome the resistance to airflow of the tracheobronchial tree (Table 2-1)
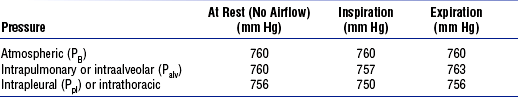
(1) Air flows into the lungs when intrapulmonary air pressure falls below atmospheric pressure
(2) Air flows out of the lungs when intrapulmonary air pressure exceeds atmospheric pressure
(3) Intrapleural pressure is normally negative with respect to atmospheric pressure as a result of the elastic recoil of the lungs, which tend to pull away from the chest wall. This “negative” pressure prevents the collapse of the lungs.
(4) Increased effort (forced inspiration or expiration) may produce much greater changes in intrapulmonary and intrapleural pressures during inspiration and expiration
(c) Structural components of the thorax
(1) For protection: Sternum, spine, ribs
a) Visceral layer next to the lungs; parietal layer next to the chest wall
b) Pleural fluid between layers: Allows smooth movement of the visceral layer over the parietal layer
c) Adherence: Pleural space is normally a potential space (vacuum); because of a constant negative pressure (less than atmospheric pressure by 4 to 8 mm Hg), any change in the volume of the thoracic cage is reflected by a similar change in the volume of the lungs
d) Nerve supply: Parietal pleura has fibers for pain transmission, but visceral pleura does not
(1) Elastic resistance (static properties)
a) Lung, if removed from the chest, collapses to a smaller volume because of lung elastic recoil. This tendency of the lungs to collapse is normally counteracted by the chest wall tendency to expand. Volume of air in the lungs depends on the equal and opposite balance of these forces.
b) Compliance (CL) is an expression of the elastic properties of the lung and is the change in volume (ΔV) accomplished by a change in pressure (ΔP):

If compliance is high, the lung is more easily distended; if compliance is low, the lung is stiff and more difficult to distend
(2) Flow resistance (dynamic properties)
a) Airway resistance must be overcome to generate flow through the airways
b) Changes in airway caliber affect airway resistance. Examples are changes caused by bronchospasm or secretions.
c) Flow through the airway depends on pressure differences between the two ends of the tube as well as resistance. Driving pressure for flow in airways is the difference between atmospheric and alveolar pressures.
v. Control of ventilation: Although the process of breathing is a normal rhythmic activity that occurs without conscious effort, it involves an intricate controlling mechanism within the central nervous system (CNS). Basic organization of the respiratory control system is outlined in Figure 2-3.
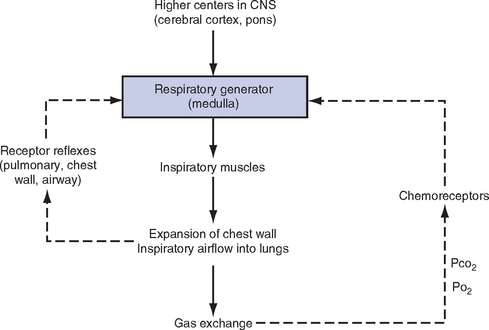
(a) Respiratory generator: Located in the medulla and composed of two groups of neurons
(1) One group initiates respiration and regulates its rate
(2) One group controls the “switching off” of inspiration and thus the onset of expiration
(b) Input from other regions of the CNS
(1) Pons: Input is necessary for normal, coordinated breathing
(2) Cerebral cortex: Exerts a conscious or voluntary control over ventilation
(c) Chemoreceptors: Contribute to a feedback loop that adjusts respiratory center output if blood gas levels are not maintained within the normal range
(1) Central chemoreceptors: Located near the ventrolateral surface of the medulla (but are separate from the medullary respiratory center)
a) Respond not directly to blood partial pressure of carbon dioxide (Pco2) but, rather, to the pH of the extracellular fluid (ECF) surrounding the chemoreceptor
b) Feedback loop for CO2 can be summarized as follows: Increased arterial Pco2 → increased brain ECF Pco2 → decreased brain ECF pH → decreased pH at chemoreceptor → stimulation of central chemoreceptor → stimulation of medullary respiratory center → increased ventilation → decreased arterial Pco2
(2) Peripheral chemoreceptors: Located in the carotid body and aortic body
(1) Stretch receptors in the bronchial wall respond to changes in lung inflation (Hering-Breuer reflex)
(2) Irritant receptors in the lining of the airways respond to noxious stimuli, such as irritating dust and chemicals
(3) “J” (juxtacapillary) receptors in the alveolar interstitial space
a) Cause rapid shallow breathing in response to deformation from increased interstitial volume due to high pulmonary capillary pressures (such as in heart failure or inflammation)
b) Stimulation can also cause bradycardia, hypotension, and expiratory constriction of the glottis
(4) Receptors in the chest wall (in the intercostal muscles)
b. Step 2—Diffusion: Process by which alveolar air gases are moved across the alveolar-capillary membrane to the pulmonary capillary bed and vice versa. Diffusion occurs down a concentration gradient from a higher to a lower concentration. No active metabolic work is required for the diffusion of gases to occur. Work of breathing is accomplished by the respiratory muscles and the heart, which produce a gradient across the alveolar-capillary membrane.
i. Ability of the lung to transfer gases is called the diffusing capacity of the lung (DL). Diffusing capacity measures the amount of gas (O2, CO2, carbon monoxide) diffusing between the alveoli and pulmonary capillary blood per minute per millimeter Hg mean gas pressure difference.
ii. CO2 is 20 times more diffusible across the alveolar-capillary membrane than O2. If the membrane is damaged, its decreased capacity for transporting O2 into the blood is usually more of a problem than its decreased capacity for transporting CO2 out of the body. Thus, the diffusing capacity of the lungs for O2 is of primary importance.
iii. Diffusion is determined by several variables:
(a) Surface area available for gas exchange
(b) Integrity of the alveolar-capillary membrane
(c) Amount of hemoglobin (Hb) in the blood
(d) Diffusion coefficient of gas as well as contact time
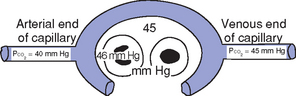
(e) Driving pressure: Difference between alveolar gas tensions and pulmonary capillary gas tensions (Table 2-2). This is the force that causes gases to diffuse across membranes.
TABLE 2-2
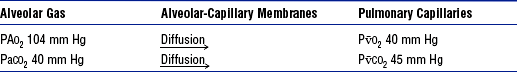
 CO2, mixed venous partial pressure of carbon dioxide; P
 O2, mixed venous partial pressure of oxygen.
(1) During the breathing of 100% O2, the alveolar O2 tension (PAo2) becomes so large that the difference between PAo2 and P o2 (mixed venous O2 tension) significantly increases, proportionately increasing the driving pressure
(2) Therefore, hypoxemia due solely to diffusion defects is usually improved by breathing 100% O2
iv. A–a gradient (PAo2 − Pao2) is the alveolar to arterial O2 pressure difference (i.e., the difference in the partial pressure of O2 in the alveolar gas spaces [PAo2] and the pressure in the systemic arterial blood [Pao2]). This gradient is always a positive number.
(a) Normal gradient in young adults is less than 10 mm Hg (on room air) but increases with age and may be as high as 20 mm Hg in people over age 60 years
(b) A–a gradient provides an index of how efficient the lung is in equilibrating pulmonary capillary O2 with alveolar O2. It indicates whether gas transfer is normal.
(c) Large A–a gradient generally indicates that the lung is the site of dysfunction (except with cardiac right-to-left shunting)
(d) Formula for calculation (on room air)
where
47 = vapor pressure of water at 37° C (in mm Hg)
PIo2 = pressure of inspired O2
0.8 = assumed respiratory quotient (ratio of CO2 produced to O2 consumed per unit time)
Therefore,
FIo2 (Pb − 47) − (Paco2 ÷ 0.8) − Pao2 = A–a gradient
Example of calculation:
0.21 (760 − 47) − (40 ÷ 0.8) − 90 = 10
(e) Normally, A–a gradient increases with age and increased FIo2
(f) Pathologic conditions that increase the A–a gradient (difference) include the following:
 ) to perfusion (
 ) (
) ( /
/ abnormalities)
c. Step 3—Transport of gases in the circulation
i. Approximately 97% of O2 is transported in chemical combination with Hb in the erythrocyte and 3% is carried dissolved in the plasma. Pao2 is a measurement of the O2 tension in the plasma and is a reflection of the driving pressure that causes O2 to dissolve in the plasma and combine with Hb. Thus, O2 content is related to Pao2.
ii. Oxyhemoglobin dissociation curve (Figure 2-4)
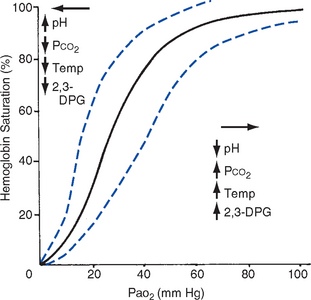
(a) Relationship between O2 saturation (and content) and Pao2 is expressed in an S-shaped curve that has great physiologic significance. It describes the ability of Hb to bind O2 at normal Pao2 levels and release it at lower Po2 levels.
(b) Relationship between the content and pressure of O2 in the blood is not linear
(1) Upper flat portion of the curve is the arterial association portion. Dissociation relationship in this range protects the body by enabling Hb to retain high saturation with O2 despite large decreases (down to 60 mm Hg) in Pao2.
(2) Lower steep portion of the curve is the venous dissociation portion. Dissociation relationship in this range protects the body by enabling the tissues to withdraw large amounts of O2 with small decreases in Pao2.
(c) Hb O2 binding is sensitive to O2 tension. The binding is reversible; the affinity of Hb for O2 changes as Po2 changes.
(1) When Po2 is increased (as in pulmonary capillaries), O2 binds readily with Hb
(2) When Po2 is decreased (as in tissues), O2 unloads from Hb
(d) Increase in the rate of O2 utilization by tissues causes an automatic increase in the rate of O2 release from Hb
(e) Shifts of the oxyhemoglobin curve
(1) Shifts to the right: More O2 is unloaded for a given Po2, which thus increases O2 delivery to the tissues. These shifts are caused by the following:
(2) Shifts to the left: O2 is not dissociated from Hb until tissue and capillary O2 are very low, which thus decreases O2 delivery to the tissues. These shifts are caused by the following:
(3) 2,3-DPG is an intermediate metabolite of glucose that facilitates the dissociation of O2 from Hb at the tissues. Decreased levels of 2,3-DPG impair O2 release to the tissues. This may occur with massive transfusions of 2,3-DPG–depleted blood and anything that decreases phosphate levels.
iii. Ability of Hb to release O2 to the tissues is commonly assessed by evaluating the P50
(a) P50 = the partial pressure of O2 at which the Hb is 50% saturated, standardized to a pH of 7.40
(b) Normal P50 is about 26.6 mm Hg; varies with the disease process
iv. Each gram of normal Hb can maximally combine with 1.34 ml of O2 when fully saturated (values of 1.36 or 1.39 are sometimes used)
v. Amount of O2 transported per minute in the circulation is a factor of both the arterial O2 concentration (Cao2) and cardiac output. This amount reflects how much O2 is delivered to tissues per minute and is dependent on the interaction of the circulatory system (delivery of arterial blood), erythropoietic system (Hb in red blood cells), and respiratory system (gas exchange) according to the following equations:
(a) O2 content (Cao2) is calculated from O2 saturation, O2 capacity, and dissolved O2
(1) O2 capacity is the maximal amount of O2 the blood can carry. It is expressed in milliliters of O2 per deciliter (100 ml) of blood (ml/dl) and is calculated by multiplying Hb in grams by 1.34.
(2) O2 saturation is the percentage of Hb actually saturated with O2 (Sao2 or S o2) and is usually measured directly. It is equal to the O2 content divided by the O2 capacity multiplied by 100.
(3) O2 content is the actual amount of O2 the blood is carrying (oxyhemoglobin plus dissolved O2)
O2 content = (O2 capacity × O2 saturation) + (0.0031 × Pao2)
ml/min = arterial O2 content (ml/dl) × cardiac output (L/min) × 10 (conversion factor)
vi. Focusing only on the O2 tension of the blood is unwise because an underestimation of the severity of hypoxemia may result. O2 content and transport are more reliable parameters because they take into account the Hb concentration and cardiac output.
vii. Arterial–mixed venous differences in O2 content (Cao2 − C o2) is the difference between arterial O2 content (Cao2) and mixed venous O2 content (C
 o2) and reflects the actual amount of O2 extracted from the blood during its passage through the tissues
(a) Of the 1000 to 1200 ml of O2 delivered per minute to tissues, cells typically use only about 250 to 300 ml ( o2 or O2 consumption). If
  o2 remains constant, changes in cardiac output can be related to changes in the Cao2 − C
 o2 gradient or difference. Mixed venous O2 values are measured from the distal tip of pulmonary artery catheters.
(b) Normal Cao2 − C o2 is 4.5 to 6 ml/dl
(Hb × 1.34) (Sao2 − S o2) + (Pao2 − P
 o2) (0.0031)
(c) Fall in C o2 resulting in a rise in the Cao2 − C
 o2 gradient signifies decreased cardiac output and inadequate tissue perfusion if
  o2 is constant
(d) These are average values; actual O2 utilization is different for different tissues. The heart uses almost all the O2 it receives.
viii. CO2 transport: CO2 is carried in the blood in three forms, as follows:
(a) Physically dissolved (Paco2), which accounts for 7% to 10% of CO2 transported in the blood
(b) Chemically combined with Hb as carbaminohemoglobin. This reaction occurs rapidly, and reduced Hb can bind more CO2 than oxyhemoglobin. Thus, unloading of O2 facilitates loading of CO2 (Haldane effect) and accounts for about 30% of CO2 transport.
(c) As bicarbonate (HCO3−) through a conversion reaction:

where CA = carbonic anhydrase
(1) Reaction accounts for 60% to 70% of CO2 in the body
(2) Reaction is slow in plasma and fast in red blood cell owing to the CA enzyme
(3) When the concentration of these ions increases in red blood cells, HCO3− diffuses but H+ remains
(4) To maintain electrical neutrality, chloride diffuses from the plasma (the “chloride shift”)
ix. Pulmonary circulation (pulmonary artery, arterioles, capillary network, venules, and veins)
(a) Pulmonary vessels are peculiarly suited to maintaining a delicate balance of flow and pressure distribution that optimizes gas exchange. They are richly innervated by the sympathetic branch of the autonomic nervous system.
(b) In contrast to the systemic circulation, the pulmonary circulation is a low-resistance system. Pulmonary arteries have far thinner walls than systemic arteries do, and vessels distend to allow for increases in volume from systemic circulation. Intrapulmonary blood volume increases or decreases of approximately 50% occur with changes in the relationship between intrathoracic and extrathoracic pressure.
(c) Pulmonary arteries accompany the bronchi within the lung and give rise to a rich capillary network within the alveolar walls. Pulmonary veins are not contiguous with the bronchial tree.
(d) Primary function of the pulmonary circulation is to act as a transport system
(1) Transport of blood through the lung
a) Flow resistance through vessels (R) is defined by Ohm’s law:

where
ΔP = the pressure difference between the two ends of the vessel (upstream and downstream pressures)
Driving pressure for flow in the pulmonary circulation is the difference between the inflow pressure in the pulmonary artery and the outflow pressure in the left atrium
b) In the lung, measurement of flow resistance is pulmonary vascular resistance (PVR)
c) About 12% of the total blood volume of the body is in the pulmonary circulation at any given time
d) Normal pressures in the pulmonary vasculature
1) Mean pulmonary artery pressure: 10 to 15 mm Hg
2) Mean pulmonary venous pressure: 4 to 12 mm Hg
3) Mean pressure gradient: Approximately 10 mm Hg (considerably less than the systemic gradient)
4) Pressures are higher at the base of the lung than at the apex
e) Unique characteristic of the pulmonary arterial bed is that it constricts in response to hypoxia. Diffuse alveolar hypoxia causes generalized vasoconstriction, which results in pulmonary hypertension. Localized hypoxia causes localized vasoconstriction that does not increase pulmonary hypertension. This localized vasoconstriction directs blood away from poorly ventilated alveoli and thus improves overall gas exchange.
f) Chronic pulmonary hypertension (increased PVR) can result in right ventricular hypertrophy (cor pulmonale)
1) Transvascular transport of fluids and solutes
a) Transvascular fluid filtration in the lung (and all other organs) is described by the Starling equation. This means that fluid and solutes move due to increases or decreases in hydrostatic or osmotic filtration pressures or due to changes in the permeability of vessel walls to fluids or proteins.
b) Thus, excess fluid in the lung (pulmonary edema) can result from either a net increase in hydrostatic pressure forces (favoring filtration) or a decreased resistance to filtration
a) All cardiac output passes through the lung before reaching systemic circulation. Therefore, pulmonary circulation can influence the composition of the blood supplying all organs.
b) Several humoral substances are added, extracted, or metabolized in the lung. Examples are inactivation of vasoactive prostaglandins, conversion of angiotensin I to angiotensin II, and inactivation of bradykinin.
d. Step 4—Diffusion between the systemic capillary bed and body tissue cells
i. Pressure gradients allow for the diffusion of O2 and CO2 among systemic capillaries, interstitial fluid, and cells (Figures 2-5 and 2-6)
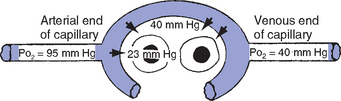
ii. Within the mitochondria of each individual cell, O2 is consumed through aerobic metabolism. This process produces the energy bonds of adenosine triphosphate and the waste products of CO2 and water.
3. Hypoxemia: Hypoxemia is a state in which the O2 pressure or saturation of O2 in arterial blood, or both, is lower than normal. Hypoxemia is generally defined as Pao2 less than 55 mm Hg or Sao2 below 88% at sea level in an adult breathing room air. Disorders that lead to hypoxemia do so through one or more of the following processes.
i. Reduced ambient pressure (Pb) or reduced O2 concentration of inspired air (FIo2)
ii. If the lungs are normal, the A–a gradient will be normal
iii. Rarely a clinically important cause of arterial hypoxemia. Reduced PB occurs at high altitudes in healthy humans and in enclosed spaces such as mine cave-ins where fresh air is not replenished; FIo2 remains normal, however.
b. Alveolar hypoventilation (increased Paco2)
i. Decrease in alveolar ventilation from disorders of the respiratory center, peripheral nerves that supply the muscles of respiration, the respiratory muscles of the chest wall, or the lungs; medications that diminish ventilation
ii. This causes an increase in Paco2, which results in a fall in PAo2 according to the alveolar air equation
iii. If the lungs are normal, the A–a gradient will be normal. Hypoxemia will improve with ventilation.
 /
/ mismatch
i. Most common cause of hypoxemia; A–a gradient increased
ii. Ideally, ventilation of each alveolus is accompanied by a comparable amount of perfusion, which yields a  /
/ ratio of 1.00. Usually, however, there is relatively more perfusion than ventilation, which yields a normal
  /
/ ratio of 0.8. Normal amount of blood perfusing the alveoli (
 ) is 5 L/min, and normal amount of air ventilating the alveoli (
 ) is 4 L/min. Figure 2-7 presents in simplified form the possible relationships between ventilation and perfusion in the lung.
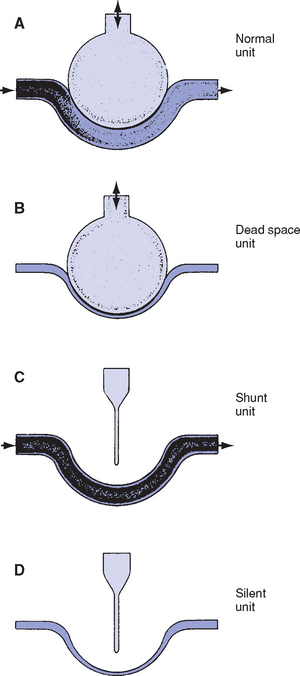
iii. When  /
/ is decreased (<0.8), a decrease of ventilation in relation to perfusion has occurred. This is similar to a right-to-left shunt because more deoxygenated blood is returning to the left side of the heart. Low
  /
/ ratios and hypoxemia occur together, because good areas of the lung cannot be overventilated to compensate for the underventilated areas. (Hb cannot be saturated to more than 100%.) Atelectasis, pneumonia, and pulmonary edema are clinical examples of intrapulmonary shunt.
iv. When  /
/ is increased (>0.8), a decreased perfusion relative to ventilation exists, the equivalent of dead space or wasted ventilation. Examples of cases in which this occurs are pulmonary emboli and cardiogenic shock.
v. Hypoxemia that is thought to be due to  /
/ mismatch can be corrected by giving the patient a simple incremental FIo2 test. For example, if the Pao2 increases significantly in response to an FIo2 change from 0.30 to 0.60, the primary problem is low
  /
/ . If the Pao2 does not increase significantly, a right-to-left shunt exists.
i. Shunting occurs when a portion of venous blood does not participate in gas exchange. An anatomic shunt may occur (a portion of right ventricular blood does not pass through the pulmonary capillaries) or a portion of pulmonary capillary blood may pass by airless alveoli.
ii. Normal physiologic shunting amounts to 2% to 5% of cardiac output (this is bronchial and thebesian vein blood)
iii. Shunting occurs in arteriovenous malformations, adult respiratory distress syndrome (ARDS), atelectasis, pneumonia, pulmonary edema, pulmonary embolus, vascular lung tumors, and intracardiac right-to-left shunts
iv. Breathing at an increased FIo2 level does not correct shunting because not all blood comes into contact with open alveoli and shunted blood passes directly from pulmonary veins to arterial blood (venous admixture). Lack of improvement of hypoxemia with O2 therapy is a hallmark of shunting.
v. Usually, shunting does not result in elevated Paco2, even though shunted blood is rich in CO2. Brain chemoreceptors sense elevated Paco2 and respond by increasing ventilation.
vi. Shunting is measured by comparing mixed venous O2 (from the pulmonary artery catheter) to arterial O2 (Cao2 − C o2). Amount of true shunt can be estimated by having the patient breathe 100% O2 for 15 minutes, which eliminates the effects of abnormal
  /
/ and diffusion defects. Normal shunt is 5 vol% (5 ml/dl).
i. Seen in patients with a thickened alveolar-capillary membrane, as in pulmonary fibrosis, which enlarges the distance between alveolar gas and the pulmonary capillaries
ii. May be overcome by diffusion because the rate of diffusion always depends on the pressure gradient
iii. Is rarely a cause of hypoxemia by itself at rest but may contribute to hypoxemia in patients with  /
/ mismatch and/or shunting caused by a disease state or in certain patients during exercise
4. Acid-base physiology and blood gases
i. Acid: Donor of hydrogen ions (H+); substance with a pH below 7.0
ii. Acidemia: Condition in which the blood pH is below 7.35
iii. Acidosis: Process (metabolic or respiratory) that causes acidemia
iv. Base: Acceptor of H+ ions; any substance with a pH above 7.0
v. Alkalemia: Condition in which the blood pH is above 7.45
vi. Alkalosis: Process (metabolic or respiratory) that causes alkalemia
b. Buffering: Normal body mechanism that occurs rapidly in response to acid-base disturbances to prevent changes in [H+]
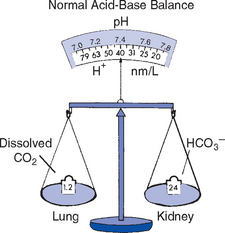
i. Bicarbonate (HCO3−) buffer system
[H+] + HCO3− ←→ H2CO3 ←→ CO2 + H2O
This system is very important because HCO3− can be regulated by the kidneys and CO2 can be regulated by the lungs
c. Henderson-Hasselbalch equation: Defines the relationship between pH, Pco2, and bicarbonate. Arterial pH is determined by the logarithm of the ratio of bicarbonate concentration to arterial Pco2. Bicarbonate is regulated primarily by the kidney and Pco2 is regulated by alveolar ventilation:
where pK = a constant (6.1)
i. As long as the ratio of HCO3− to CO2 is about 20:1, the pH of the blood will be normal. It is this ratio, rather than the absolute values of each, that determines blood pH.
ii. pH must be maintained within a narrow range of normal because the functioning of most enzymatic systems in the body depends on the H+ concentration (Figure 2-8)
d. Normal adult blood gas values (at sea level): See Table 2-3. Note: Knowledge of blood gas values neither supersedes nor replaces sound clinical judgment.
TABLE 2-3
Normal Adult Blood Gas Values (at Sea Level)
| Arterial | Mixed Venous | |
| pH | 7.40 (7.35-7.45) | 7.36 (7.31-7.41) |
| PO2 | 80-100 mm Hg | 35-40 mm Hg |
| SaO2 | ≥95% | 70%-75% |
| PCO2 | 35-45 mm Hg | 41-51 mm Hg |
| HCO3− | 22-26 mEq/L | 22-26 mEq/L |
| Base excess | − 2 to +2 | − 2 to +2 |
e. Effect of altitude on blood gas values
i. Pao2 and Sao2 are lower at high altitudes because of a lower ambient O2 tension
ii. Normal for 5280 feet (Denver) = Pao2 of 65 to 75 mm Hg, Sao2 of 94% to 95%
f. Respiratory parameter (Paco2): If the primary disturbance is in the Paco2, the patient is said to have a respiratory disturbance
i. Paco2 is a reflection of alveolar ventilation
(a) If increased, hypoventilation is present
(b) If decreased, hyperventilation is present
(c) If normal, adequate ventilation is present
(d) To assess relationships, measurements of both Paco2 and minute ventilation are needed
ii. Respiratory acidosis (elevated Paco2), caused by hypoventilation of any etiology (may be acute or chronic). Treatment generally consists of improving alveolar ventilation.
(a) Obstructive lung disease, sleep apnea, and other lung diseases resulting in inadequate excretion of CO2
(b) Oversedation, head trauma, anesthesia, and drug overdose
(c) Neuromuscular disorders: Guillain-Barré syndrome
(d) Pneumothorax, flail chest, or other types of chest wall trauma that interfere with breathing mechanics
iii. Respiratory alkalosis (low Paco2) caused by hyperventilation of any etiology. Treatment consists of correcting the underlying cause.
(b) Hypoxemia, interstitial lung disease
(c) Excessive ventilation with mechanical ventilator, as a response to metabolic acidosis (diabetic ketoacidosis) or from respiratory stimulant drugs, such as salicylates, theophylline, catecholamines
(e) Pulmonary embolus, pulmonary edema
(f) Bacteremia (sepsis), liver disease, or fever
(g) CNS disturbances, such as brainstem tumors and infections
g. Nonrespiratory (renal) parameters (HCO3−): If the primary disturbance is in the bicarbonate level, the patient has a metabolic disturbance
i. Concentration influenced by metabolic processes
ii. Causes of metabolic alkalosis (elevated HCO3−)
(a) Chloride depletion (vomiting, prolonged nasogastric suctioning, diuretic therapy)
(b) Cushing’s syndrome, hyperaldosteronism, potassium deficiency, renal artery stenosis, licorice ingestion
(c) Exogenous administration of alkali (massive blood transfusions containing citrate, bicarbonate administration, ingestion of antacids)
iii. Causes of metabolic acidosis (decreased HCO3−)
(a) Increase in unmeasurable anions (acids that accumulate in certain diseases and poisonings); high anion gap
(1) Diabetic ketoacidosis, starvation
(2) Drugs: Salicylates, ethylene glycol, methanol alcohol, paraldehyde
(3) Lactic acidosis resulting from tissue hypoperfusion and subsequent anaerobic metabolism (shock, sepsis)
(5) Easy mnemonic is MULEPAK—methanol, uremia, lactic acidosis, ethylene glycol, paraldehyde, aspirin (salicylates), and ketoacidosis
h. Compensation for acid-base abnormalities: Physiologic response to minimize pH changes by maintaining a normal bicarbonate to Pco2 ratio
i. pH returned to near normal by changing component that is not primarily affected
ii. Respiratory disturbances result in kidney compensation, which may take several days to become maximal
iii. Metabolic disturbances result in pulmonary compensation, which begins rapidly but takes a variable amount of time to reach maximal levels
iv. Body does not overcompensate. Therefore, the acidity or alkalinity of the pH identifies the primary abnormality if there is only one. Abnormalities may be multiple; each is not a discrete entity. Mixed acid-base disturbances often occur.
i. Correction of acid-base abnormalities: Caused by a physiologic or therapeutic response
i. pH returned to normal by altering the component primarily affected; blood gas values are returned to normal
ii. Correction for respiratory acidosis: Increased ventilation, treatment of cause
iii. Correction for respiratory alkalosis: Decreased ventilation, treatment of cause
iv. Correction for metabolic acidosis
(a) Treatment of underlying cause
(b) Administration of bicarbonate intravenously or orally (given only under specific circumstances)
v. Correction for metabolic alkalosis
(a) Treatment of underlying cause
(b) Direct reduction by isotonic hydrochloric acid solution (cautious IV administration required) via a central line at a rate no higher than 0.2 mEq/kg/hr)
(c) Arginine monohydrochloride or ammonium chloride used rarely; acetazolamide (carbonic anhydrase inhibitor–diuretic) used in certain situations
j. Arterial blood gas (ABG) analysis
(a) Shows end result of what occurs in the lung
(b) Confirms the presence of respiratory failure and indicates acid-base status
(c) Absolutely necessary in monitoring patients in acute respiratory failure (ARF) and patients on ventilators
ii. Main components: Pao2, Paco2, pH, base excess, HCO3−, Sao2, O2 content, Hb. Both FIo2 and body temperature must be measured for proper interpretation. It is also essential to know whether HCO3− and SaO2 are directly measured or are calculated.
k. Guidelines for interpretation of ABG levels and acid-base balance
i. Examine pH first (Table 2-4)
TABLE 2-4
Analysis of the Acid-Base Balance of an Arterial Blood Gas

© K. Ellstrom, 1998. Used by permission.
pH and PaCO2 go in opposite directions; pH and HCO3− go in the same direction.
HCO3−, Bicarbonate; PaCO2, arterial partial pressure of carbon dioxide.
(a) If pH is reduced (<7.35), the patient is acidemic
(1) If Paco2 is elevated, the patient has respiratory acidosis
(2) If HCO3− is reduced, the patient has metabolic acidosis
(3) If Paco2 is elevated and HCO3− is reduced, the patient has combined respiratory and metabolic acidosis
(b) If pH is elevated (>7.45), the patient is alkalemic
(1) If Paco2 is decreased, the patient has respiratory alkalosis
(2) If HCO3− is elevated, the patient has metabolic alkalosis
(3) If Paco2 is decreased and HCO3− is elevated, the patient has combined metabolic and respiratory alkalosis
(c) Expected change in pH for changes in Paco2: Commonly used rule is that the pH rises or falls 0.08 (or 0.1) in the appropriate direction for each change of 10 mm in the Paco2
(d) If the pH is normal (7.35 to 7.45), alkalosis or acidosis may still be present as a mixed disorder (Box 2-1)
ii. Assess the hypoxemic state and tissue oxygenation state (Box 2-2)
(a) Arterial oxygenation is considered compromised when Hb saturation is less than 88% (Pao2 is <60 mm Hg). If the Pao2 is below 55 mm Hg, hypoxemia is present.
(b) If the patient is receiving supplemental O2 therapy, Pao2 values must be interpreted in relation to the FIo2 delivered. One way involves examination of the two as a ratio (Pao2/FIo2). Normal Pao2/FIo2 ratio is 286 to 350, although levels as low as 200 may be clinically acceptable. Another way to assess oxygenation is to use the following formula to calculate the A–a arterial Po2 gradient (PAo2 − Pao2):
PAo2 = [FIo2 (Pb − 47) − Paco2]/R
where
47 = vapor pressure of water at 37° C (in mm Hg)
R = respiratory quotient, the ratio of CO2 production to O2 consumption ( co2/
co2/ o2); assumed to be 0.8
Normal PAo2 − Pao2 difference is less than 10 to 15 mm Hg. Although it provides an estimate of oxygenation, the gradient does not take into account the normal increasing gradient as a function of increasing FIo2 levels. The higher the FIo2, the larger the increase in the A–a gradient can be without changing the level of intrapulmonary shunt or oxygenation. (Note: Primarily used for patients on a ventilator when the FIo2 is known. FIO2 is unknown [and its value therefore unreliable] with other O2 delivery methods, but it can be estimated.)
(c) Excessively high Pao2 (>100 mm Hg) is generally not necessary and in such cases FIo2 should be reduced
(d) Assessment of cardiac output and O2 transport determines tissue oxygenation. P o2 and S
 o2 may be useful guides in evaluating the adequacy of overall tissue oxygenation.
(e) Effectiveness of O2 transport may be judged clinically by examining the patient carefully for mental status, skin color, urine output, and heart rate. Tests that measure end-organ function are also important clinical assessment tools.
Patient Assessment
1. Nursing history: Nursing history follows the sequence and length of the standard history-taking process and is modified as needed for acutely ill patients
a. Patient health history: Patient’s interpretation of his or her signs and symptoms and the emotional response to them play a significant role in the development or exacerbation of symptoms, especially as related to dyspnea
(a) Dyspnea: Subjective feeling of shortness of breath or breathlessness; considered the sixth vital sign in pulmonary patients, in whom it may be more significant than pain
(1) Difficult to quantify objectively
a) Count the average number of words the patient is able to speak between breaths, or whether the patient can speak in full sentences
b) Ask the patient to rate breathing comfort on a visual analogue or dyspnea scale from 1 to 10
(2) Emotional problems may cause an increased awareness of respirations and complaints of inability to get enough air, despite normal blood gas values
(3) Dyspnea caused by increased work of breathing accompanies both obstructive and restrictive lung diseases as well as the dysfunction of nerves, respiratory muscles, or thoracic cage
(4) Question the patient regarding exercise tolerance; some dyspnea is normal with exercise but is abnormal if exercise tolerance is decreased
(5) Assess whether the patient’s dyspnea is acute or chronic, and whether it has recently increased or decreased
(6) Determine all circumstances under which dyspnea occurs (walking, stair climbing, eating) and how long the patient has experienced dyspnea with those activities
(7) Assess orthopnea or dyspnea when the patient is lying flat; ask how many pillows the patient generally uses for sleep and whether for comfort or shortness of breath
(8) Assess for paroxysmal nocturnal dyspnea by asking whether dyspnea ever awakens the patient from sleep
(9) Determine whether dyspnea is accompanied by other symptoms, such as cough, wheezing, or chest pain
(10) In some patients, it is difficult to differentiate cardiac from pulmonary dyspnea
(b) Cough: Normal when it occurs as a lung defense mechanism
(1) Determine whether cough is acute and self-limiting or chronic (lasting more than 6 weeks) and persistent
(2) Note any change in character and frequency
(3) Determine what the timing is (both daily and seasonal) and whether the cough is accompanied by sputum production, hemoptysis, wheezing, chest pain, blackouts or falls, or dyspnea
(1) Quantify amount by asking how many teaspoons, cups, or shot glasses of sputum are coughed up daily
(2) Determine aggravating and alleviating factors
(3) Assess the character of the sputum (color, odor, consistency)
(4) Determine whether current sputum characteristics (quantity and quality) are changed from usual
(d) Hemoptysis: Expectoration of blood from the lungs or airways
(1) Determine whether the material coughed up is grossly bloody, blood streaked, or blood tinged (pinkish)
(2) Try to differentiate from hematemesis. Product of hemoptysis is often frothy, alkaline, and accompanied by sputum; product of hematemesis is nonfrothy, acidic, and dark red or brown, with food particles.
(3) Determine the approximate amount of blood produced in hemoptysis using a reasonable measurement guideline, such as the number of teaspoons or shot glasses per day. Assess whether all expectorated specimens contain blood or whether this is an isolated event.
(4) Blood may originate from the nasopharynx, airways, or lung parenchyma; blood from these sites remains red because of the contact with atmospheric O2
(5) Etiologic mechanisms of hemoptysis fall into three categories by location: Airways, pulmonary parenchyma, and vasculature
a) Airways disease: Most common; bronchitis, bronchiectasis, and bronchogenic carcinoma
b) Parenchymal causes: Often infectious—tuberculosis (TB), lung abscess, pneumonia
c) Cardiovascular disease: Mitral stenosis, pulmonary embolism, pulmonary edema
d) Autoimmune disorders: Wegener’s granulomatosis, Goodpasture’s syndrome
(6) Suspect neoplasm if hemoptysis occurs in a patient without prior respiratory symptoms
(e) Chest pain: As a reflection of the respiratory system, does not originate in the lung, because the lung is free of sensory nerve fibers
(1) Chest wall pain: Arises from the parietal pleura, intercostal muscles, ribs, or overlying skin
(2) Diaphragm pain: Often caused by an inflammatory process; pain often referred to the ipsilateral shoulder
(3) Mediastinal pain: Caused by a mass or air under the mediastinum (pneumomediastinum); pain is substernal and dull
ii. Miscellaneous symptoms of respiratory disease: Postnasal drip, sinus pain, epistaxis, hoarseness, general fatigue, weight loss, fever, sleep disturbances, night sweats, anxiety, nervousness, anorexia
(a) Question the patient regarding the presence of any allergy to either medications (herbal, over the counter) or food. Obtain a description of the type and severity of the reaction.
(b) Determine past instances of the present illness, with treatment and outcome. Assess for previous episodes of TB, exposure to TB, or positive TB skin test result. Assess for childhood lung diseases or infections such as asthma, pneumonia, and whooping cough. Record the treatment given (if any) and the length of time the patient followed the medication regimen.
(c) Identify past surgeries or hospitalizations: Dates, diagnosis, and complications; previous use of O2 or mechanical ventilation
(d) Question about previous chest radiographs: Dates, reasons, findings
(e) Determine whether any pulmonary function tests were performed previously and the results if known
b. Family history (extremely important)
i. Assess for similar illness or signs and symptoms in the patient’s parents, siblings, and grandparents
ii. Determine the current state of health or cause of death for parents, siblings, and grandparents
iii. Find out if there is a family history of diseases such as asthma, cystic fibrosis, bronchiectasis, and α1-antitrypsin deficiency (emphysema)
iv. Determine whether a family member ever had TB with consequent exposure of the patient
i. Personal status: Assess education, socioeconomic class, marital status, general life satisfaction, interests
(1) Determine whether the patient is a current or past smoker of cigarettes, cigars, or pipe
a) Calculate pack-year history:
No. of packs/day × No. of years smoked = pack-years
b) Determine whether the patient has tried to quit and, if so, what methods were used and whether the effort was successful. If the patient is a former smoker, determine the time since the last cigarette; otherwise, determine the desire for information on smoking cessation resources and readiness to quit.
(2) Ascertain whether the patient has smoked marijuana or another inhaled recreational drug (e.g., crack cocaine). If so, attempt to quantify the amount and frequency of drug use.
(3) Determine whether the patient chews tobacco. If so, quantify the type chewed and the amount per day.
(b) Drinking habits: Determine the frequency and amount consumed, and the type of alcoholic and caffeine-containing beverages
(c) Eating habits: Assess the quality of meals (adequacy or excess) and determine whether any respiratory symptoms occur with eating (i.e., meal-induced dyspnea or cough)
(d) Sexual history: Question about sexual activity and orientation
iii. Home conditions: Assess economic conditions, housing quality, presence of any pets and their health, presence of allergens
iv. Occupational history: Assess past and present work conditions
d. Medication history (prescription and over-the-counter medications or home remedies)
i. Determine current and recent medications, dosage, and the reason for prescribing
ii. Assess whether the patient is using any inhaled medications
(a) Identify the device used: Metered-dose inhaler (MDI), nebulizer, or other delivery device (e.g., Spinhaler, HandiHaler)
(b) Assess the frequency of use—on an as-needed basis or on a regular schedule
(c) If possible, have the patient demonstrate the technique for inhaling medication. Many patients use an incorrect technique when inhaling their medications, which results in reduced deposition of the drug in the lung and reduced efficacy. Patients should exhale completely, inhale the drug slowly and deeply, and then hold the breath for 10 seconds if possible.
(d) Preferred delivery methods: Powder delivery devices (nonaerosol), MDI with spacer, nebulizer, MDI with open mouth, MDI with closed mouth (least amount of medication delivered)
2. Nursing examination of patient
(a) Ensure that the patient is stripped to the waist and, if possible, seated
(1) Warm room and good lighting should be available
(2) Nurse must have a thorough knowledge of anatomic landmarks and lines (Figure 2-9)
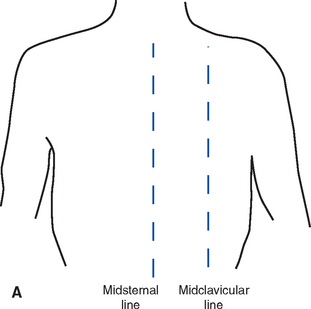
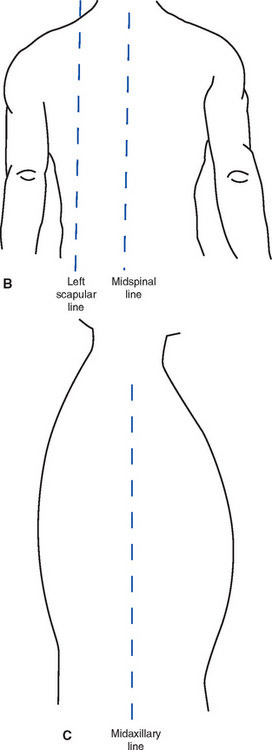
a) Manubrium, body, and xiphoid process of the sternum, right and left sternal borders
b) Angle of Louis, point of maximal impulse, suprasternal notch
c) Interspaces, ribs, costal margins, costal angle, and spinous processes
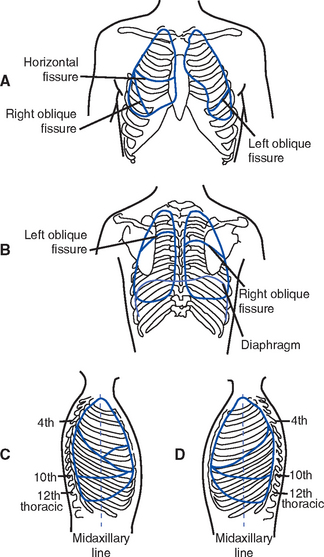
d) Pulmonary lobes and areas of contact with the chest wall (Figure 2-10)
e) Lines: Midclavicular, midsternal, anterior-axillary, midaxillary, posterior-axillary, vertebral, and midscapular
(b) Observe general condition and musculoskeletal development
(1) State of nutrition, debilitation, evidence of chronic disease
(2) Pectus carinatum: Sternum protrudes instead of being lower than the adjacent hemithoraces
(3) Pectus excavatum: Sternum is abnormally depressed between the anterior hemithoraces
(4) Kyphosis: Exaggerated A-P curvature of the spine
(5) Scoliosis: Lateral curvature of the spine, causing widened intercostal spaces on the convex side and crowding of the ribs on the concave side; when accompanied by kyphosis, it is called kyphoscoliosis. If severe, it can result in restrictive lung disease.
(c) Observe the A-P diameter of the thorax; normal A-P diameter is approximately one third the transverse diameter. In patients with obstructive lung disease, the A-P diameter may be as great as or greater than the transverse diameter (“barrel chest”).
(d) Observe the general slope of the ribs
(1) Ribs are normally at a 45-degree angle in relation to the spine
(2) In patients with emphysema, the ribs may be nearly horizontal
(1) One side may be larger because of tension pneumothorax or pleural effusion
(2) One side may be smaller because of atelectasis or unilateral fibrosis
(3) If asymmetry is present, the abnormal side will move less than the normal side
(f) Look for retraction or bulging of the interspaces
(1) Retraction of the interspaces, which can be observed during inspiration, indicates more negative intrapleural pressure due to obstruction of the inflow of air or increased work of breathing
(2) Bulging of the interspaces may result from a large pleural effusion or pneumothorax, often seen during a forced expiration in patients with asthma or emphysema
(g) Observe the ventilatory pattern
(1) Assess the level of dyspnea and the work of breathing
a) Position in which the patient can breathe most comfortably. Patients with chronic obstructive pulmonary disease (COPD) often assume a forward-leaning position, resting the arms on the knees or a bedside table.
b) Use of accessory muscles of breathing
c) Use of pursed-lip breathing
d) Flaring of the ala nasi during inspiration, a common sign of air hunger, especially in ventilated patients
(2) Assess for inspiratory stridor—low-pitched or crowing inspiratory sounds that occur when the trachea or major bronchi are obstructed for one of the following reasons:
(3) Observe for expiratory stridor—low-pitched crowing sound heard on expiration. Causes include foreign body or intrathoracic, tracheal, or main-stem tumor.
(4) Observe for unusual movements with breathing; on inspiration, the chest and abdomen should expand or rise together. Paradoxical breathing occurs with respiratory muscle fatigue: On inspiration, the chest rises and the abdomen is drawn in because the fatigued diaphragm does not descend on inspiration as it should. Instead, the diaphragm is drawn upward by the negative intrathoracic pressure during inspiration.
(5) Observe and assess the ventilatory pattern
a) Eupnea: Normal, quiet respirations
b) Bradypnea: Abnormally slow rate of ventilation
c) Tachypnea: Rapid rate of ventilation
d) Hyperpnea: Increase in the depth and, perhaps, in the rate of ventilation. Overall result is increased tidal volume and minute ventilation.
e) Apnea: Complete or intermittent cessation of ventilation
f) Biot’s breathing: Two to three short breaths alternating with long, irregular periods of apnea
g) Cheyne-Stokes respiration: Periods of increasing ventilation, followed by progressively more shallow ventilations until apnea occurs; pattern typically repeats itself. Sometimes occurs in normal persons when asleep, and usually indicates CNS disease, heart failure, or sleep apnea.
(6) Splinting of respirations—act of resisting full inspiration in one or both lungs as a result of pain
(7) Flail chest—inward movement of a portion of the chest on inspiration, usually associated with trauma to the chest; from fracture of the rib cage in two or more sections
(1) General state of restlessness, pain, altered mental status, fright, or acute distress. Earliest signs of hypoxemia often include a change in mental status and restlessness.
(2) If O2 is being administered, record the amount (flow in liters per minute), type of device (liquid, compressed gas), method of delivery (nasal cannula, Oxymizer, mask)
a) Clubbing of the fingers is a late sign of a chronic pulmonary or cardiac disease
b) Cigarette stains on the fingers suggest a current smoking habit
c) Lower-extremity edema indicates possible right-sided heart failure from chronic pulmonary disease and hypoxemia-induced pulmonary hypertension
a) Fundamental mechanism of cyanosis is an increase in the amount of reduced (deoxygenated) Hb in the vessels of the skin caused by one of the following:
1) Decrease in the O2 saturation of the capillary blood
2) Increase in the amount of venous blood in the skin as a result of the dilation of venules and capillaries
b) Visible cyanosis requires the presence of at least 5 g of reduced Hb per deciliter of blood
1) This is an absolute, not a relative, value. It is not the percentage of deoxygenated Hb that causes cyanosis but the amount of deoxygenated Hb without regard to the amount of oxyhemoglobin. Presence or absence of cyanosis may be an unreliable clinical sign.
2) In anemia, cyanosis may be difficult to detect because the absolute amount of Hb is too low. Conversely, patients with polycythemia may be cyanotic at higher levels of arterial O2 saturation than those with normal Hb levels.
c) Discoloration suggestive of cyanosis may occur in patients with abnormal blood or skin pigments (methemoglobinemia, sulfhemoglobin, argyria)
d) Factors influencing cyanosis include the rate of blood flow, perfusion, skin thickness and color, the amount of Hb, cardiac output, and the perception of the examiner
e) Central versus peripheral cyanosis
1) Central cyanosis implies arterial O2 desaturation or an abnormal Hb derivative. Both mucous membranes and skin are affected.
2) Peripheral cyanosis without central cyanosis may result from the slowing of perfusion to the tissues (cold exposure, shock, decreased cardiac output). O2 saturation may be normal.
f) In carbon monoxide poisoning, O2 saturation may be dangerously low without obvious cyanosis because carboxyhemoglobin causes the skin to turn a cherry red
(i) Assess for neck vein distention, neck masses, and enlarged nodes
(j) Look for superior vena caval syndrome: Distention of the neck veins and edema of the neck, eyelids, and hands; often seen with lung cancer
(k) In elderly patients, examination shows flattening of the ribs and diaphragm, decreased chest expansion, use of accessory muscles, marked bony prominences, loss of subcutaneous tissue, pronounced dorsal curve of the thoracic spine, increased A-P diameter relative to lateral diameter, dyspnea on exertion, dry mucous membranes, decreased ability to clear mucus, and hyperresonance from increased distensibility of the lung
(a) Palpate the thoracic muscles and skeleton, feeling for any of the following: Pulsations, palpable fremitus, tenderness, bulges, or depressions in the chest wall
(b) Expansion of the chest wall
(1) Examiner’s hands should be placed over the lower lateral aspect of the chest, with the thumbs along the costal margin anteriorly or meeting posteriorly in the midline
(2) Movement of the hands is noted on inspiration and expiration. Asymmetry of movement is always abnormal. Reduced chest wall movement is often seen in patients with barrel chest and emphysema.
(c) Position and mobility of the trachea
(1) Deviations of the trachea toward the defect are seen in atelectasis, unilateral pulmonary fibrosis, pneumonectomy, hemidiaphragm paralysis, and the inspiratory phase of flail chest
(2) Deviation of the trachea to the side opposite the lesion is seen with neck tumors, thyroid enlargement, tension pneumothorax, pleural effusion, mediastinal mass, and the expiratory phase of flail chest
(d) Point of maximal impulse: Deviates with mediastinal shift
(e) Palpation of ribs and chest for tenderness, pain, or air in subcutaneous tissue (crepitus)
(f) Vocal fremitus, palpable vibration of the chest wall, produced by phonation
(1) Patient should be instructed to say the word ninety-nine loud enough so that the fremitus can be felt with uniform intensity. Some soft-spoken women may need to falsely lower their voice so that the fremitus can be felt. Examiner should place the hands on the patient’s chest wall.
(2) Diminished fremitus is seen in any condition that interferes with the transference of vibrations through the chest
(3) Increased fremitus results from any condition that increases the transmission of vibrations through the chest, such as the following:
(1) Occurs when inflamed pleural surfaces rub together during ventilation, producing a “grating” sensation that coincides with the respiratory excursion
(2) May be palpable during both phases of ventilation but sometimes is felt only during inspiration
(1) Produced by the passage of air through thick exudate, secretions, or an area of stenosis in the trachea or major bronchi
(2) Unlike friction fremitus, rhonchal fremitus can be relieved by coughing, suctioning, or clearing the secretions from the tracheobronchial tree
(i) Subcutaneous emphysema: Indicates a leak of air under the skin due to a communication with the airway, mediastinum, or pneumothorax
iii. Percussion: Tapping or thumping of parts of the body to produce sound. Nature of the sound produced depends on the density of the structures immediately under the area percussed.
(a) Sound vibrations produced by percussion probably do not penetrate more than about 4 to 5 cm below the surface; therefore, solid masses deep in the chest cannot be outlined with percussion. In addition, because a lesion must be several centimeters in diameter to be detectable by percussion, only large abnormalities can be located.
(b) Procedure: Accomplished by striking the dorsal distal third finger of one hand, which is held against the thorax, with the distal tip of the flexed middle finger of the other hand
(1) Striking finger must strike only the stationary finger instantaneously and then be immediately withdrawn
(2) All movement is executed at the wrist
(3) Examiner must be sensitive to the sounds that are received from the chest wall
(4) One side of the chest is compared with the other side
(5) Percussion of the posterior chest: Patient inclines the head forward and rests the forearms on the thighs to move the scapulae laterally
(6) Percussion begins at the apices and continues downward to the bases, alternating side to side
(c) Percussion sounds over the lung
(1) Resonance: Sound heard normally over the lungs
(2) Hyperresonance: Sound heard over the lungs in normal children, in the apices of the lungs relative to the base in an upright adult, and throughout the lung fields in adults with emphysema or pneumothorax
(3) Tympany: Produced by air in an enclosed chamber; does not occur in the normal chest except below the dome of the left hemidiaphragm, where it is produced by air in the underlying stomach or bowel
b) Usually higher-pitched than normal resonance; the higher the tension within the viscus, the higher the pitch
(4) Dullness: Sound that is heard with lung consolidation, atelectasis, masses, pleural effusion, or hemothorax
(d) Percussion for diaphragmatic excursion: Range of motion of the diaphragm may be estimated with percussion
(1) Instruct the patient to take a deep breath and hold it
(2) Determine the lower level of resonance-to-dullness change (the level of the diaphragm) by percussing downward until a definite change is heard in the percussion note. Mark the spot with a felt-tipped marker.
(3) After instructing the patient to exhale and hold the breath, repeat the procedure
(4) Distance between the levels at which the tone change occurs is the diaphragmatic excursion
a) Normal diaphragmatic excursion is about 3 to 4 cm; partial descent or hemidescent of the diaphragm may be due to paralysis of the diaphragm or hemidiaphragm. Suspect nerve injury in postoperative patients with these signs following thoracic surgery.
b) Diaphragm is normally higher on the right than the left
c) Diaphragm is elevated in conditions that increase intraabdominal pressure (pregnancy, ascites) and conditions that decrease thoracic volume (atelectasis)
d) Diaphragm is fixed and lower than normal in emphysema
e) It is difficult to differentiate between an elevated diaphragm and a thoracic disease that causes dullness to percussion (e.g., pleural effusion). Paralysis of one or both hemidiaphragms may be present.
iv. Auscultation: Listening to sounds produced within the body
(1) Examiner should always compare one lung to the other by moving the stethoscope back and forth across the chest starting at the top of the thorax and moving downward
(2) Listening to the anterior chest will cover the upper and middle lobes; listening to the back covers the bases (see Figure 2-10)
(3) Patient should be asked to breathe through the mouth a little more deeply than usual. This minimizes turbulent flow sounds produced in the nose and throat.
(4) Diaphragm of the stethoscope is more sensitive to higher-pitched tones and is thus best for hearing most lung sounds
(5) Stethoscope earpieces should fit snugly to exclude extraneous sounds but should not be so tight that they are uncomfortable
(6) Stethoscope tubing should be no longer than 20 inches. Optimal length is 12 to 14 inches.
(7) Place the stethoscope firmly on the chest to exclude extraneous sounds and eliminate sounds that result from light contact with the skin or air. Confusing sounds may be produced by moving the stethoscope on the skin or hair, breathing on the tubing, sliding the fingers on the tubing or chest piece, or listening through clothing.
(b) Normal breath sounds vary according to the site of auscultation
(2) Bronchial (may be normal or abnormal, depending on the location of the sounds)
a) Heard normally over the trachea
b) High-pitched, harsh sound with long and loud expirations
c) When heard over the lung fields, the sound is abnormal and suggests consolidation
(3) Bronchovesicular (normal or abnormal, depending on the location)
(c) Abnormalities of breath sounds
(1) Absent or diminished sounds caused by decreased airflow (airway obstruction, COPD, muscle weakness, splinting) or increased insulation blocking the transmission of sounds to the stethoscope (obesity, pleural disease or fluid, pneumothorax)
(2) Bronchial sounds heard over the lung fields suggest consolidation or increased density of lung tissue (e.g., atelectasis, pulmonary infarction, pneumonia, large tumors with no airway obstruction)
(d) Adventitious sounds: Abnormal sounds that are superimposed on underlying breath sounds
(1) Evaluate whether position and coughing affect the sounds
a) Crackles (rales): Signify the opening of collapsed alveoli and small airways
1) Described as fine or coarse
2) Heard as small pops or crackles; the sound of fine crackles can be mimicked by rubbing together a few pieces of hair near one’s ear. Sound of coarse crackles can be mimicked by pulling open Velcro material.
3) Fine crackles occurring late in inspiration imply conditions that cause restrictive ventilatory defect
4) Fine crackles heard early in inspiration are often atelectatic, due to small airway closure
5) Coarse early inspiratory crackles are associated with bronchitis or pneumonia
b) Wheeze: Indicates an obstruction to airflow or air passing through narrowed airways
1) Continuous high-pitched sound with musical quality; also called “sibilant” wheeze
2) Commonly heard during expiration but may be heard during inspiration
3) Causes: Asthma, bronchitis, foreign body, tumor, pulmonary edema, pulmonary emboli, poorly mobilized secretions
c) Gurgles (rhonchi): Result from the passage of air through secretions in the large airways
1) Low-pitched, continuous sounds
2) May have a snoring quality when very large airways are involved (“sonorous” wheezes)
d) Pleural friction rub: Indicates inflammation and loss of pleural fluid
1) Grating, harsh sound in inspiration and expiration; disappears with breath holding. Sound can be mimicked by cupping a hand over one’s ear and rubbing the fingers of the other hand over the cupped hand.
2) Heard with pleural infections, infarction, pulmonary emboli, fractured ribs. Located in the area of most intense chest wall pain.
e) Mediastinal crunch: Indicates air in the pericardium, mediastinum, or both. Heard synchronously with systole; often associated with pericardial friction rubs.
(e) Voice sounds: Spoken words are modified by disease in a manner similar to breath sounds, which results in the increased or decreased conduction of sound
(1) Increased conduction occurs when normal lung tissue is replaced with denser, more solid tissue; it is associated with bronchial breathing
a) Bronchophony: Spoken word (e.g., ninety-nine) is heard distinctly but normal sound is muffled
b) Egophony: E sound changes to A; sound has the quality of sheep bleating
c) Whispered pectoriloquy: Whispered sounds are heard with clarity, as if the patient were speaking into the diaphragm of the stethoscope, but normal sound is muffled
(2) Decreased conduction of sound occurs in the presence of obstructed bronchi, pneumothorax, or large collections of fluid or tissue between the lung and the chest wall
(a) Noninvasive estimate of arterial O2 saturation (Spo2) using an infrared light source placed at the finger or other acceptable extremity, forehead, or earlobe
(b) Uses two principles for measurement
(1) Spectrophotometry measures the infrared light absorption of Hb (to distinguish saturated from reduced Hb)
(2) Photoplethysmography uses light to measure the arterial pressure waveforms generated by the pulse (pulse rate and strength) in the capillaries of the tissue at the measurement site
(c) Pulse oximeters are generally accurate in the Spo2 range of 70% to 100% but are inaccurate in states of low blood flow (decreased perfusion due to hypovolemia, hypotension, or vasoconstriction)
(d) Spo2 reading is adversely affected by the following:
(1) Motion of the extremity (false pulse rate and waveform artifact)
(2) Light dilution (interferes with the probe’s ability to detect the correct light wavelength)
(3) Abnormal Hb (device cannot distinguish between oxyhemoglobin and carboxyhemoglobin and thus overestimates saturation); methemoglobin may interfere with light absorption
(4) IV dyes, some fingernail polish colors (e.g., metallic, dark colors such as black), or abnormal skin pigmentation (interfere with light absorption)
(5) Anemia (Hb level below 5 g/dl may result in insufficient signal to process readings)
(e) Useful for identifying the trend of changes in Pao2 or acute desaturation episodes, especially when weaning from a ventilator
(f) Extreme caution must be exercised not to overrely on a normal Spo2 level to indicate normal oxygenation in all cases. Numerous clinical situations (e.g., COPD) may cause erroneous readings. If in doubt, get an ABG.

(a) Mixed venous oxygen saturation (S o2) is monitored in the pulmonary artery, at the distal end of a flow-directed thermodilution pulmonary artery catheter
(b) Catheter holds an optical module that contains a light-emitting source, a photodetector, and a microprocessor to analyze reflected light
(c) Reflectance spectrophotometry is used to differentiate oxygenated blood from deoxygenated blood through light wavelengths in the red and infrared spectra
(d) Continuous S o2 monitoring allows for assessment of global oxygenation. It can detect cardiopulmonary instability and changes prior to changes in other hemodynamic parameters (Table 2-5). Some specific indications include the following:
TABLE 2-5
Factors Associated with Fluctuations in Mixed Venous Oxygen Saturation (S o2
o2
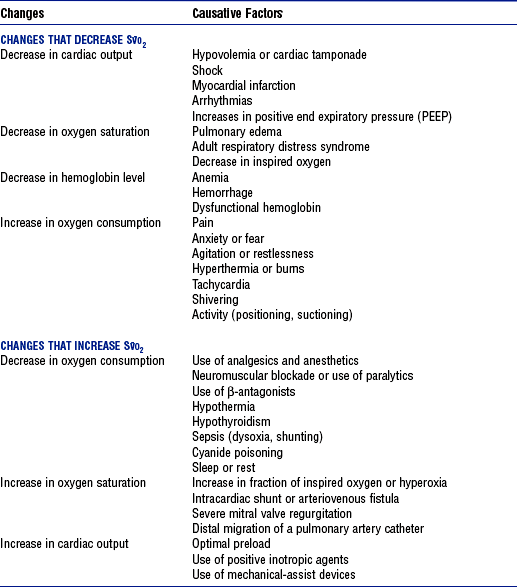
From Jesurum J: S O2 monitoring. In Chulay M, Gawlinski A, editors: Hemodynamic monitoring protocols for practice, Aliso Viejo, Calif, 1998, American Association of Critical-Care Nurses. Used with permission.
(1) High-risk cardiovascular surgery, end-stage heart failure, acute myocardial infarction
(2) Acute hypoxemic respiratory failure (e.g., ARDS, pulmonary embolus)
(e) S o2 reflects the delicate balance between O2 delivery and O2 utilization. Identifying the trend in measurements allows for real-time assessment and intervention. Because of this, the measure can be used for the following:
(1) Evaluate the adequacy of tissue oxygenation
(2) Detect adverse changes in O2 delivery and O2 consumption or impaired tissue oxygenation
(3) Evaluate the effectiveness of interventions to improve the balance between O2 delivery and consumption, including administration of fluids or drugs and the use of mechanical assistance (e.g., intraaortic balloon pump [IABP], positive end-expiratory pressure [PEEP])
(4) Evaluate the effects of routine medical and nursing procedures on tissue oxygenation (Figures 2-11 and 2-12)
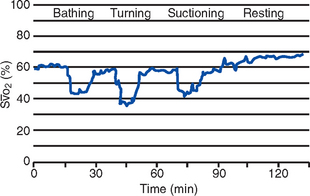


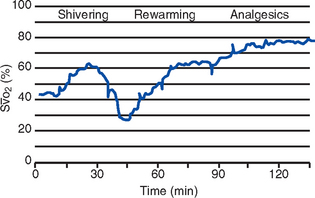


(5) Diagnose intracardiac shunting, cardiac tamponade
(6) Assist in the differential diagnosis of pathologic conditions

(1) Values lower than 60% may indicate either inadequate delivery of O2 or increased O2 consumption (e.g., decreased Hb level, decreased Sao2, decreased cardiac output, increased tissue metabolic demands)
(2) Values higher than 80% may indicate either increased O2 delivery or decreased O2 demand (e.g., increased cardiac output, decreased metabolic demand, reduced ability of the cells to utilize oxygen)
(g) Accuracy of S o2 monitoring may be affected by the following:
iii. End-tidal CO2 monitoring (Petco2)
(a) Noninvasive sampling and measurement of exhaled CO2 tension at the patient-ventilator interface
(b) Devices (capnographs) typically employ infrared analysis of respired gas using different light wavelengths to measure the absorption of CO2 molecules
(1) Requires either a simple transducer or a tubing connection to the ventilator circuitry, which is then tied into a standard hemodynamic pressure monitoring module or, by ventilator electronic interface, directly into a physiologic monitoring system
(2) Displayed airway pressure tracings can be helpful in identification of patient-ventilator dyssynchrony, assessment of the inspiratory work of breathing, and detection of auto-PEEP
(c) Graphic display of exhaled CO2 generated during the ventilatory cycle (Figure 2-13)
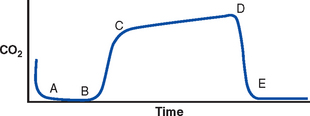
(From St. John RE: End-tidal carbon dioxide monitoring, Crit Care Nurse 23:83-88, 2003.)
(d) Provides both numerical and graphic display of CO2 waveform on a breath-by-breath basis or at a slower speed for identification of trends (Figure 2-14)
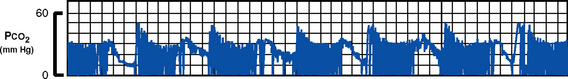
(e) Paco2 to Petco2 gradient is 1 to 4 mm Hg (normal  /
/ matching is assumed in the lungs); in critically ill patients, the gradient may exceed 20 mm Hg
(f) Application is limited for reliably predicting changes in alveolar ventilation except in patients with normal pulmonary perfusion and  /
/ ratios
(g) Measurement of Petco2 depends on adequate blood flow to the lungs to eliminate CO2
(h) Gradual narrowing of the gradient over time represents improved ventilation-perfusion matching, decreased CO2 production, or decreased pulmonary perfusion
(i) Increased gradient may indicate hypoventilation, increased production of CO2 (e.g., in fever, seizures), or absorption of CO2 from an outside source. Rapid rise in the gradient may indicate malignant hyperthermia.
(j) Sudden drop to a low level indicates incomplete sampling, possibly due to a system leak or partial air obstruction; a zero value indicates a disconnect in the system
(k) Pulse oximetry assesses oxygenation only; Petco2 measurement should be considered for monitoring ventilation in patients undergoing deep sedation and may be useful to detect changes over time in other patients, even those not on ventilators
v. Respiratory (ventilator) waveform analysis (Figure 2-15)
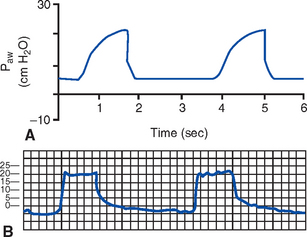
(a) Provides real-time information to assess changes in lung mechanics over time. Less useful in high-frequency or oscillation ventilation modes.
(b) Visual representation of respiratory waveforms is available with most newer ventilators
(1) Used to assess the following:
(2) Positive pressure or upward stroke is the ventilator breath
(3) Negative deflection is from the patient’s spontaneous breathing (or attempts)
(4) Volume breath waveform starts at zero or the preset PEEP, builds gradually, looks like a shark fin (see Figure 2-15, A)
(5) Pressure waveform shows a constant pressure, a characteristic “square wave” (see Figure 2-15, B)
(6) Modes of ventilation can be identified through the waveform signature (Figure 2-16)
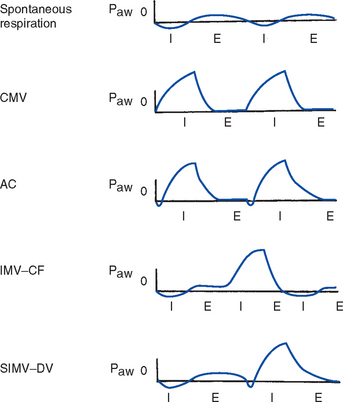
(7) Patient-ventilator synchrony
a) Normal ratio of inspiration to expiration is 1:2 or 1:3
b) Flow rate can be adjusted faster or slower to match the patient’s need
c) Inadequate flow rate is identified by a “scooped-out” appearance on the inspiratory waveform
(8) Auto-PEEP occurs when expiration is not long enough to empty the lungs. If auto-PEEP is present, the baseline pressure will rise when an end-expiratory hold maneuver is performed.
(d) Flow-time waveforms (Figure 2-17)
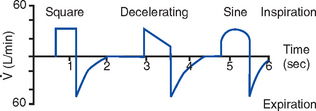
(1) Used to assess auto-PEEP and patient response to therapy
(2) Volume breath: Flow of gas is constant throughout the breath; referred to as a square-flow waveform
(3) Pressure breath: Flow is higher at the beginning and slower at the end; referred to as a decelerating flow pattern
(4) Spontaneous breaths: Decelerating but more rounded; referred to as sinusoidal
(5) Auto-PEEP is identified when the expiratory waveform does not reach baseline
(6) Bronchospasm reduces expiratory flow. If therapy is effective, expiratory flow will be faster and reach baseline more quickly.
(e) Pressure-volume and flow-volume loops
(1) Pressure-volume loops: Pressure and volume are plotted on different axes; result looks like a loop (Figure 2-18)
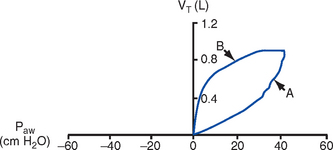
a) Spontaneous breaths show negative movement (to left of graph) on inspiration, positive movement (to right) on expiration
b) Ventilator breaths (volume and pressure) have loops that go counterclockwise on the right (positive) side of the graph; the lower portion shows inspiration, the higher portion shows expiration
(2) Flow-volume loops plot flow and volume on different axes. Expiratory portion of the loop helps assess the effectiveness of bronchodilator therapy.
(f) Continuous airway pressure monitoring (CAPM)
(1) Allows continuous monitoring of waveforms integrated with hemodynamic monitoring
(2) Useful as a backup to monitor system disconnects
(3) Zeroing should occur with initial setup and any disconnection
(4) Damping of the waveform occurs with fluid in the tubing or leaks; check for disconnects and leaks, clear the tubing by flushing with an air-filled syringe
3. Appraisal of patient characteristics: Patients with acute, life-threatening pulmonary problems may present in critical care units with an array of clinical findings that represent the highest priority of patient needs. Their clinical course may resolve quickly, slowly, or not at all. Important clinical features that the nurse needs to assess when providing care for these patients include the following:
i. Level 1—Minimally resilient: A malnourished 82-year-old man, disabled by a series of strokes, is admitted with smoke inhalation and partial thickness burns
ii. Level 3—Moderately resilient: A 45-year-old tourist has a near-drowning episode when he falls overboard from a cruise ship after heavy alcohol intake and celebratory dancing
iii. Level 5—Highly resilient: An adolescent female who received plastic surgery as a high school graduation present is now febrile, with rapid, shallow respirations and a rising white blood cell (WBC) count, and continues to refuse to cough, deep breathe, or ambulate postoperatively
i. Level 1—Highly vulnerable: A 62-year-old engineer with lung cancer remains intubated following thoracotomy for evacuation of a large pleural effusion. Radiation therapy has not been successful.
ii. Level 3—Moderately vulnerable: A 32-year-old day care provider, who is 5 ft 2 inches tall and weighs 394 lb, is being admitted for possible aspiration during extubation following appendectomy
iii. Level 5—Minimally vulnerable: An otherwise healthy 47-year-old woman who suffered steering wheel contusion 72 hours earlier when she rear-ended another car has no fractures or cardiac contusion
i. Level 1—Minimally stable: A 28-year-old roofer who suffered severe blunt chest trauma, multiple rib fractures with flail chest, hemothorax, and severe blood loss is admitted with an intermittently audible systolic pressure of 62 mm Hg measured via Doppler ultrasonography
ii. Level 3—Moderately stable: A 67-year-old patient with type 1 diabetes mellitus and hypertension hospitalized with viral pneumonia shows slowly improving ABG levels following extubation
iii. Level 5—Highly stable: A 42-year-old patient whose deep venous thrombosis has now resolved continues to complain of dyspnea
i. Level 1—Highly complex: An 18-year-old member of a street gang received multiple thoracic and abdominal stab wounds before he was dropped into a dumpster, where he remained overnight
ii. Level 3—Moderately complex: A 60-year-old diabetic woman with severe rheumatoid arthritis complains of moderate chest pain and dyspnea shortly after arriving on a flight from Hong Kong
iii. Level 5—Minimally complex: A patient newly diagnosed with asthma became acutely dyspneic when he toured a recently painted and carpeted apartment and could not get his inhaler to work
i. Level 1—Few resources: A 58-year-old Vietnam veteran with chronic bronchiectasis is admitted following two episodes of hemoptysis. He does not qualify for Veterans Administration benefits, is estranged from his only sibling, and subsists on meals at the local shelter.
ii. Level 3—Moderate resources: A 49-year-old cab driver recovering from ARDS after a motor vehicle crash will need continued pulmonary therapy after discharge. His son, a respiratory therapist, will visit his father twice daily to provide that care.
iii. Level 5—Many resources: The wife of a 67-year-old architect who developed ARF when influenza was superimposed on his COPD has contacted a home care coordinator to make any necessary care arrangements
i. Level 1—No participation: A 43-year-old woman in a persistent vegetative state requires ventilatory support
ii. Level 3—Moderate level of participation: A nursing home resident recovering from community-acquired pneumonia is eager to ambulate and use the incentive spirometer but requires assistance with the former and repeated instruction in the latter
iii. Level 5—Full participation: A 37-year-old science teacher who suffered toxic inhalation injury when a student inadvertently “blew up the lab” plans to develop lessons that demonstrate what happened to him and how his treatments facilitate his recovery
g. Participation in decision making
i. Level 1—No participation: A patient is in fulminant ARDS after falling from scaffolding five stories high 16 days earlier
ii. Level 3—Moderate level of participation: A patient who underwent lung transplantation 48 hours earlier is making a concerted yet not fully effective effort postoperatively to perform the self-care she demonstrated preoperatively
iii. Level 5—Full participation: A generation X software sales representative whose pulmonary embolism was recognized and treated in time requests the intranet programs related to the prevention of deep venous thrombosis
i. Level 1—Not predictable: A 66-year-old passenger involved in a train derailment shows blunt head trauma, crushing chest injuries, fractured pelvis, and no discernible inspiratory effort
ii. Level 3—Moderately predictable: A high school football player requires open reduction of a compound fracture of the left clavicle as well as rib fractures with pneumothorax
iii. Level 5—Highly predictable: A 74-year-old former smoker develops pneumonia whenever a new strain of influenza appears
(a) Obtain a specimen through voluntary coughing and expectoration, induction of sputum by inhalation of an aerosol, nasotracheal or endotracheal suctioning, transtracheal aspiration, or bronchoscopy
(b) Assess characteristics: Compare to the patient’s normal state
(a) Diagnostic thoracentesis or pleural biopsy is performed to obtain a specimen
(b) Determination of whether the fluid is a transudate or an exudate is based on the protein and lactate dehydrogenase (LDH) levels in the pleural fluid and blood
(c) Specimen is examined for cell counts, protein and LDH levels, glucose level, amylase level, and pH; Gram staining for bacteria is performed; cytologic analysis for malignant cells and microorganisms is conducted
(a) Type I hypersensitivity (mediated by immunoglobulin E): To pollens, molds, grass
(b) Type II hypersensitivity (mediated by T lymphocytes): Purified protein derivative testing for TB
iv. Serologic tests are used to determine the causative pathogen in bacterial, viral, mycotic, and parasitic diseases
i. Chest radiographic examination precedes all other studies
(a) Posteroanterior and lateral views most common
(b) Portable anteroposterior views are obtained in the intensive care unit (ICU) when the patient cannot be moved. These radiographs are generally of lesser quality than an erect posteroanterior film for the following reasons:
(1) Difficulty in positioning the patient
(2) Short film distance from the chest; variable distances in serial films
(3) Less powerful x-ray generator; interference from attached tubes, lines, equipment
(c) Lateral decubitus views are used if fluid levels need to be identified (as with pleural effusions and abscesses)
(d) Oblique views may be used to localize lesions and infiltrates
(e) Lordotic views are used to evaluate the apical portion of the lung and the middle lobe or lingula and can help determine whether a lesion is anterior or posterior
(f) Expiratory films are used for visualizing pneumothorax or air trapping
(a) Shows the movement of pulmonary and cardiac structures and the diaphragm, localizes pulmonary lesions
(b) Used to monitor during special procedures—catheter or chest tube insertion, bronchoscopy, thoracentesis
(c) Exposure of the patient to radiation is greater during fluoroscopy than during a standard radiographic examination
iii. Tomography: Provides views at different planes through the lungs
(a) Gives better definition of small or questionable lesions; particularly useful for determining whether a lesion has calcification. Plain tomography is rarely used.
(b) Computed tomography (CT) scan: All chest CTs are spiral CTs now
iv. Magnetic resonance imaging (MRI)
(a) Can distinguish tumors from other structures, such as blood vessels, spinal cord, and bronchial walls
(b) Can differentiate pleural thickening, pleural fluid, and chest wall tumors from each other
v. Pulmonary angiography: Visualizes the pulmonary arterial tree through the injection of radiopaque dye
(a) Useful to investigate thromboembolic disease of the lung, congenital circulatory abnormalities, masses
(b) Some risks; dangerous to perform in pulmonary hypertension; O2 desaturation has occurred in some patients with the injection of contrast medium. Hemodynamic parameters should be measured before the procedure.
vi. Ventilation-perfusion lung scanning
(a) Involves injection or inhalation of radioisotopes; performed to obtain information on pulmonary blood flow and ventilation
(b) Can detect pulmonary emboli and assess regional lung function preoperatively
(a) Useful in evaluating pleural disease
(b) Can detect small amounts of pleural fluid and loculations within the pleural space
(c) Can distinguish fluid from pleural thickening
(d) Can localize the diaphragm and detect disease immediately below it, such as a subphrenic abscess
(e) Not useful for defining structures or lesions within the pulmonary parenchyma (the ultrasonic beam penetrates air poorly)
c. Pulmonary function studies: See Box 2-3 and Figure 2-19
BOX 2-3 PULMONARY FUNCTION STUDIES


 Measured with the patient in the upright position; values obtained are compared with predicted values (see Figure 2-19)
 Volumes: There are four discrete and nonoverlapping lung volumes
1. Tidal volume (VT): Volume of gas inspired and expired during each respiratory cycle
2. Inspiratory reserve volume (IRV): Maximal volume of gas that can be inspired after a tidal breath is taken
3. Expiratory reserve volume (ERV): Maximal volume of gas that can be expired from the end-expiratory position
4. Residual volume (RV): Volume of gas remaining in the lungs at end of a maximal expiration
 Capacities: There are four capacities, each of which includes two or more of the primary volumes
1. Total lung capacity (TLC): Volume of gas contained in the lung at the end of a maximal inspiration
2. Vital capacity (VC): Maximal volume of gas that can be expelled from the lungs following a maximal inspiration
3. Inspiratory capacity (IC): Maximal volume of gas that can be inspired from the resting expiratory level
4. Functional residual capacity (FRC): Volume of gas remaining in the lungs at resting end expiration
 Provide information about dynamic lung function. Subjects perform forced breathing maneuvers.

FVC: Forced vital capacity; reduced in restrictive disease or in obstructive disease if there is air trapping
FEVt: Forced expiratory volume in t (seconds); usually measured at 0.5, 1, and 3 seconds. Reduced in obstructive disease. Most useful measurements are FEV1 and FEV6.
FEV1/VC%: Forced expiratory volume at 1 second as a percentage of vital capacity. Evaluates obstruction to flow. FEV1/VC: Normally >75% in adults.
FEF: Forced expiratory flows (FEF25%-75%, FEF75%-85%). These tests assess flows over a range of lung volumes.
Values for timed flow studies are decreased out of proportion to vital capacity in obstructive disease


