[level-membership-for-radiology-category]Chapter 4
 The Peripheral Arteries
Atheroma occurs to different degrees in different parts of an individual’s cardiovascular system and the lower limb arteries are particularly prone to the development of atherosclerosis. Approximately 2% of adults in late middle age in Western countries have intermittent claudication1 and each year in England and Wales around 50 000 patients are admitted to hospital with a diagnosis of peripheral arterial disease; 15 000 of these will require amputation.2 There are many factors which may influence the development of disease and, in general terms, the prevalence of peripheral vascular disease detected by non-invasive procedures is about three times greater than the prevalence of intermittent claudication.3 This chapter concentrates on the use of ultrasound in the assessment of disease in the lower limb arteries, as this is the area where most work is generated, but the value of ultrasound in the investigation of a variety of upper limb arterial disorders is also discussed.
Indications
Peripheral vascular disease
The main indications for performing Doppler ultrasound of the arteries of the upper and lower limbs are given in Box 4-1. The most common indication is the assessment of patients with ischaemic symptoms of the lower limb in order to determine if they are likely to benefit from angioplasty or a bypass graft. The ultrasound findings provide information on the extent and severity of disease; even in patients with limb-threatening ischaemia ultrasound is a useful first-line investigation that can provide the surgeon with all the information that is required for patient management. In many cases ultrasound will provide sufficient information for management decisions to be reached. In other cases, if further information is required, the subsequent magnetic resonance angiography (MRA)/computed tomography angiography (CTA)/arteriogram can be tailored appropriately. Ultrasound provides an accurate assessment of the major arteries which allows distinction between patients with significant peripheral arterial disease and those without. At the other end of the spectrum, patients with atypical symptoms that might be due to ischaemia can be examined to exclude the presence of significant arterial disease.
Haemodialysis Fistulae
Arteriovenous fistulae created for haemodialysis can be examined using ultrasound, allowing identification of complications associated with stenosis or occlusion, as well as estimation of blood flow through the shunt, particularly if this is thought to be inadequate or excessive (see Chapter 7).
Anatomy and Scanning Technique
ANATOMY – LOWER LIMB
The arteries of the lower limb arise at the bifurcation of the abdominal aorta (Fig. 4-1), the common iliac arteries run down the posterior wall of the pelvis and divide into the internal and external iliac arteries in front of the sacroiliac joint. The internal iliac artery continues down into the pelvis and is difficult to demonstrate with transabdominal ultrasound, although transvaginal or transrectal scanning will show some of its branches. The external iliac artery continues around the side of the pelvis to the level of the inguinal ligament, it lies anteromedial to the psoas muscle and is normally superficial to the external iliac vein.

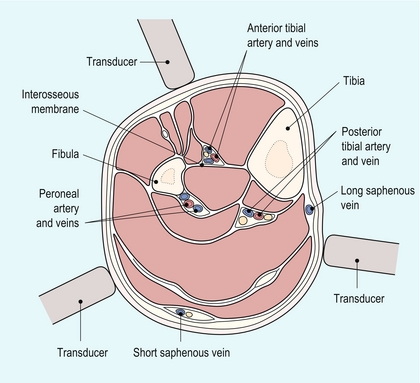
The anterior tibial artery passes forwards through the interosseous membrane between the fibula and tibia. It then descends on the anterior margin of the membrane, deep to the extensor muscles on the anterolateral aspect of the calf (Fig. 4-2). At the ankle it passes across the front of the joint to become the dorsalis pedis artery of the foot which runs from the front of the ankle joint to the proximal end of the first intertarsal space where it gives off metatarsal branches and passes through the first intertarsal space to unite with the lateral plantar artery and form the plantar arterial arch.
SCANNING TECHNIQUE – LOWER LIMB
Common Femoral, Profunda Femoris and Superficial Femoral Arteries
The examination begins with the patient lying supine on the couch. The main steps in the examination are given in Box 4-2. A linear array transducer is used; usually 5–12 MHz depending on the performance of the ultrasound system and the build of the patient, lower frequencies may be required to examine the arteries in the adductor canal or in large patients. The distal external iliac/common femoral artery is located using colour Doppler as it leaves the pelvis under the inguinal ligament lateral to the femoral vein. Even if flow appears normal on colour Doppler and there is no evidence of local disease, a spectral Doppler trace should be recorded, as changes in this may indicate the presence of significant disease proximally, necessitating a careful direct examination of the iliac vessels. The bifurcation of the common femoral artery into the profunda femoris and superficial femoral arteries is then examined using colour and spectral Doppler. The profunda femoris artery should be examined over its proximal 5 cm, especially in patients with severe superficial femoral disease, in order to assess the amount of collateral flow, or its potential value as a graft origin or insertion point.
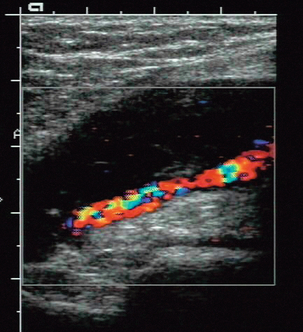
1. Colour Doppler may show the presence of collateral vessels in the muscles of the thigh (Fig. 4-3A).
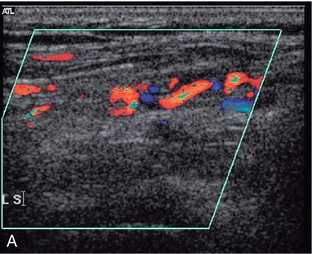
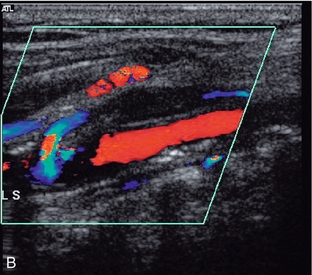
FIGURE 4-3 (A) Collateral vessels in the muscles of the thigh. (B) A larger collateral vessel joining the lower superficial femoral artery.
2. Collateral vessels may be seen leaving the main artery (Fig. 4-3B).
3. The character of the spectral waveform may show a change between two levels, indicating a segment of disease somewhere between the two points of measurement.
The Adductor Canal and Popliteal Fossa
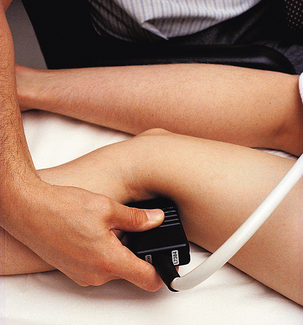
The patient is then turned into a lateral decubitus position so that the medial aspect of the leg being examined is uppermost (Fig. 4-4). This position is better than the prone position as it allows access in continuity to the lower superficial femoral artery, the adductor canal area, the popliteal region and the medial calf. The region of the adductor canal must be examined with great care as it is a site where a short-segment stenosis or occlusion may be present, and this section of the vessel can be difficult to visualise as it passes deep to the thigh muscles. In some cases the use of a lower scanning frequency may help visualisation. The superficial femoral artery is examined as far down as it can be followed on the medial aspect of the thigh; the popliteal artery is then located in the popliteal fossa and followed superiorly. In difficult cases a mark can be put on the skin of the medial thigh to show the lowest segment of vessel visualised in the supine position; the popliteal artery is then followed superiorly in the decubitus position until the transducer reaches the level of the skin mark, ensuring that the vessel has been examined in continuity. The popliteal artery is then examined and followed down to the point of division into the tibioperoneal trunk and anterior tibial artery.
Calf Arteries
The peroneal artery runs more deeply down the calf than the posterior tibial artery, lying closer to the posterior aspect of the tibia and the interosseous membrane. It can be examined from several approaches: firstly from a posteromedial approach similar to that used for the posterior tibial artery; secondly, it can often also be seen from the anterolateral approach used for the anterior tibial artery as it runs behind the interosseous membrane (Fig. 4-2); thirdly, a posterolateral approach may be of value in some cases.
The anterior tibial artery is examined from an anterolateral approach through the extensor muscles lying between the tibia and fibula. The two bones can be identified on transverse scanning and the interosseous membrane located passing between them. The anterior tibial artery lies on the membrane and can be located using colour Doppler in either the longitudinal or transverse plane. It usually lies nearer the fibula than the tibia (Fig. 4-2).
The advent of power Doppler and echo-enhancing agents has extended the role of ultrasound in the assessment of vascular disease. In the proximal lower limb and iliac vessels, the location of the vessel and confirmation of occluded segments has been made easier and, in the distal part of the leg, they make assessment of the smaller vessels of the calf and foot easier. However, more work is required to evaluate further their role.4
ANATOMY – UPPER LIMB
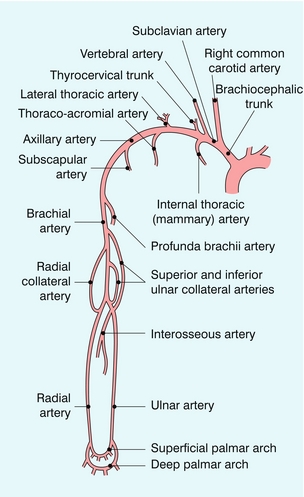
The subclavian arteries arise from the brachiocephalic trunk on the right (Fig. 4-5) and directly from the arch of the aorta on the left; however, there is considerable normal variation in the patterns of their origination. The origin of the right subclavian artery can be examined behind the right sternoclavicular joint, where the brachiocephalic trunk divides into the right common carotid artery and the subclavian artery. The origin of the left subclavian artery from the aortic arch cannot be demonstrated, although the more distal segments can be seen as on the right side. The subclavian artery on each side runs from its point of origin to the outer border of the first rib where it becomes the axillary artery; the subclavian vein lies in front of the artery. The main branches of the subclavian artery are the vertebral arteries, the thyrocervical trunk, the internal thoracic (mammary) artery and the costocervical trunk.
Assessment of Disease
Some patients will show extensive diffuse disease along much, or all, of the superficial femoral artery but do not show any specific, localised stenoses. It is important to note this appearance, as the overall haemodynamic effect may be severe enough to produce a significant pressure drop along the vessel, thereby reducing limb perfusion, although this pattern of disease is not suitable for angioplasty. Other patients may have several stenoses along the length of the vessel, each of which is not haemodynamically significant but the effects of these are additive, so that there is still a significant drop in perfusion pressure distal to the affected segment.5
In addition, the presence of serial stenoses can affect the estimation of the degree of a distal stenosis, if this is not recognised. A significant proximal stenosis or occlusion will result in a drop in perfusion pressure and velocity which makes application of the peak systolic velocity (PSV) and peak velocity ratios, the usual criteria for quantifying a stenosis, problematical.6 Power Doppler and echo-enhancing agents may allow an estimate of severity of the distal stenosis but if there is clinical doubt, other imaging should be considered.
DIRECT MEASUREMENT
Direct measurement of a stenosis is often quite difficult in the lower limb arteries as these are relatively small, and it may be difficult to see the lumen clearly in the deeper parts of the thigh, particularly if there is disease present. However, direct measurement of a stenosis may be possible in the lower external iliac, common femoral, profunda femoris and upper superficial femoral arteries. Measurement of the diameter reduction is performed after assessment of plaque distribution in both longitudinal and transverse planes, so that the most appropriate diameter is selected. When a segment of stenosis or occlusion is detected the length of the affected segment should be measured, as this will be relevant to the suitability of the lesion for angioplasty; segments of disease, particularly occlusions, longer than 10 cm will not normally be considered for percutaneous treatment.7
PEAK VELOCITY RATIOS
Direct measurement of a stenosis is often not possible in the lower limb and the severity of the stenosis must then be estimated from the change in peak systolic velocity produced by the stenosis. Normal velocities in the lower limb arteries at rest are approximately 1.2 m/s in the iliac segments, 0.9 m/s in the superficial femoral segments and 0.7 m/s in the popliteal segment.8 Various criteria have been put forward for the quantification of lower limb arterial stenosis. Those of Cossman et al.9 have produced satisfactory results in our department and have the advantage of being easy to remember (Table 4-1). These criteria are based on the PSV at the stenosis and the ratio of the PSV at the stenosis compared with the velocity 1–2 cm upstream in a non-diseased segment. Colour Doppler allows the position and direction of peak velocity flow in the stenosis to be identified and the sample volume can be placed appropriately, final adjustments of position being performed by listening to the pitch of the frequency shift as the sample volume is moved through the stenosis. A further velocity measurement is then made in a ‘normal’ segment of artery 1–2 cm upstream from the stenosis and the ratio calculated (Fig. 4-6).
TABLE 4-1
Velocity Criteria for the Assessment of Lower Limb Stenoses
| Percentage Stenosis | Peak Systolic Velocity (m/s) | Velocity Ratio |
| Normal | < 1.5 | < 1.5:1 |
| 0–49 | 1.5–2.0 | 1.5–2:1 |
| 50–75 | 2.0–4.0 | 2–4:1 |
| > 75 | > 4.0 | > 4:1 |
| Occlusion | – | – |
From Cossman et al.9
WAVEFORM CHANGES
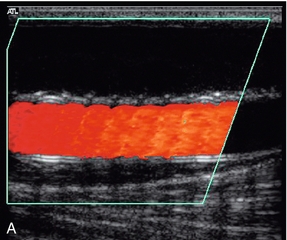
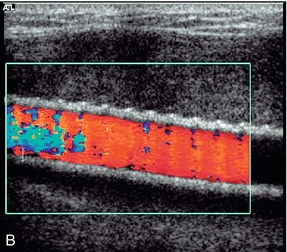
The normal waveform in the main arteries of the resting lower limb has three components; four, or occasionally five, may be seen in fit young individuals. These represent the pressure changes which occur in the resting lower limb arteries during the cardiac cycle. First there is the rise in pressure and acceleration of blood flow at the onset of systole. There is then a short period of reversed flow as the pressure wave is reflected from the constricted distal arterioles. This is followed by a further period of forward flow produced by the elastic compliance of the main arteries in diastole (Fig. 4-7A). These changes are discussed in more detail in Chapter 2.
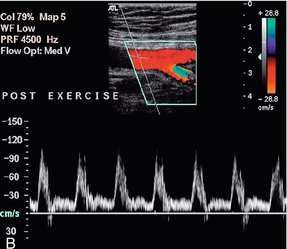
FIGURE 4-7 The normal femoral artery waveform. (A) In a limb at rest three components are visible. Aliasing in the profunda artery is due to the lower insonation angle giving a higher Doppler shift, not a focal stenosis. (B) Following exercise there is increased flow throughout diastole as a result of peripheral dilation. Note that the PRF scale has been increased in B to accommodate the higher peak systolic velocity.
Exercise modifies this pattern by reducing the peripheral resistance. This results in the reversed component being lost and increased diastolic flow throughout the cardiac cycle (Fig. 4-7B). It is for this reason that ultrasound examination of the lower limb arteries should be performed in patients who have not had significant exercise of the leg muscles for about 15 min. Conversely, examination after exercise, or reactive hyperaemia, may be used in order to ‘stress’ the lower limb circulation and reveal stenoses which are not significant at rest, when blood flow is relatively low, but which become apparent with the higher volumes flowing when the distal circulation to the muscles opens up.10
Disease in the vessel at the point of measurement, above it or below it, can affect the waveform, and if the vessel cannot be visualised in continuity then a change in the waveform between two points is indicative of disease. The two main features which may be altered are the overall shape of the waveform and the degree of spectral broadening as a result of flow disturbance;8 the major changes are shown in Box 4-3 and illustrated in Fig. 4-8. Proximal disease above the point of measurement results in loss firstly of the third and then of the second components of the waveform, as the normal passage of the pressure wave along the artery is impaired. This interference with the passage of the pulse wave along the vessel is also manifest by the slowing of the systolic acceleration time. The width of the first, systolic complex is increased and the overall height is decreased. These changes result in ‘damping’ of the waveform, which is most marked when there is a proximal occlusion. The turbulence generated beyond a stenosis shows in the spectrum as spectral broadening and its presence therefore also indicates proximal disease, although not its severity, as mild turbulence may be due to a minor stenosis close by, or a more severe stenosis further away. The spectral broadening may be seen throughout the spectrum if the stenosis is close to the point of measurement; as the distance from the stenosis increases, the spectral broadening is seen in the postsystolic deceleration phase only. The disturbance of flow created by a stenosis may take several centimetres to resolve. The spectral broadening is lost and the systolic forward flow component is regained, but the reverse component and third component are much less likely to reappear distal to disease. In addition, if the distal limb is ischaemic, this will result in dilatation of the capillaries and increased flow throughout diastole. The presence of some, or all, of these changes requires that the vessel be carefully examined proximally to identify their source.
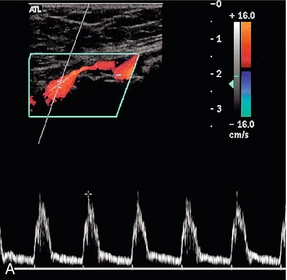
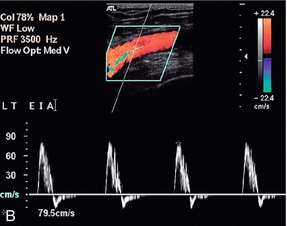
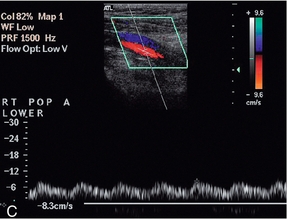
FIGURE 4-8 Abnormal lower limb artery waveforms. (A) Loss of reverse flow and diastolic flow due to distal disease producing peripheral dilatation; a large plaque impinges on the lumen. (B) Broadening of the waveform and turbulence secondary to a proximal stenosis. (C) Damped waveform in the popliteal artery secondary to a proximal occluded segment.
The presence of distal disease will also affect the waveform, resulting in increased pulsatility, with reduced diastolic flow, evident from the loss of the third component; in addition, the peak systolic velocity is reduced. This situation is most often seen at the origin of a superficial femoral artery with significant distal disease, although the precise changes are variable, depending on the degree of obstruction and the capacity of any collateral channels.11
ASSESSMENT OF AORTOILIAC DISEASE
The clinical findings, or the appearances of the waveform at the groin, may suggest the presence of significant disease in the aortoiliac segments.12 The best method for assessment of these segments is by direct visualisation with colour Doppler and measurement of velocities as for the leg vessels. Satisfactory examinations have been reported in up to 90% of cases with careful scanning and preparation.13 The main indirect indicators of significant iliac artery disease are spectral broadening, due to the turbulence set up by the stenosis, and widening of the systolic complex as a result of the stenosis slowing the systolic acceleration. As noted earlier, power Doppler and echo-enhancing agents show promise in improving visualisation and assessment using ultrasound.4
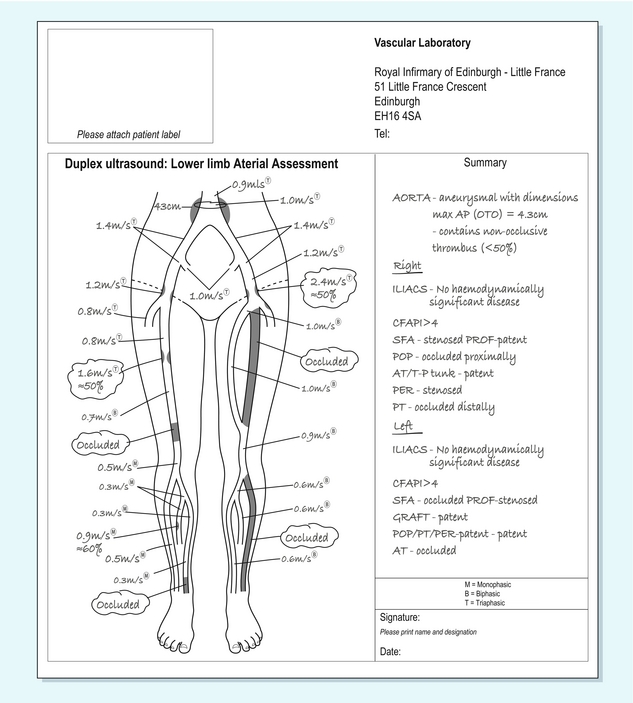
REPORTING THE EXAMINATION
The findings from a Doppler examination of the peripheral arteries are best reported on a diagram (Fig. 4-9) of the relevant arterial tree. The level and extent of any stenoses can be indicated on this, together with blood flow velocities at areas of stenosis and the standard sites of measurement. Non-visualised areas should also be indicated. For patients with bypass grafts, the location of the graft can be sketched in and relevant velocities indicated.
Arterial Bypass Grafts
A variety of bypass grafts may be employed to alleviate ischaemic symptoms (Box 4-4). Autologous vein is the preferred material and usually the long saphenous vein is used, although other veins may occasionally be employed. Synthetic materials [polytetrafluoroethylene (PTFE), Goretex, or Dacron] may be used if the long saphenous veins are unsuitable or unavailable. Infrainguinal femorodistal grafts are the commonest type of procedure; several problems may occur which result in graft failure (Table 4-2) and there has been much discussion about the possible benefits from programmes of graft surveillance in the postoperative period and whether these improve long-term patency rates, or not.14
TABLE 4-2
| Intrinsic | Extrinsic |
| Stenosis | Inflow disease progression |
| Proximal or distal anastomosis | Outflow disease progression |
| Mid-graft | Clamp injury |
| Diffuse myointimal hyperplasia | Thromboembolism |
| Aneurysm | Hypercoagulation states |
| Anastomotic | Sepsis |
| Mid-graft |
Haemodynamic failure occurs when the graft is patent but the limb remains ischaemic.
The timing of graft failure is related to the cause of the problem. Failures occurring within 6–8 weeks of surgery are usually due to technical problems arising from the surgery; 3–5% of grafts fail at this stage, approximately 25% of all graft failures. Failures developing in the period beginning 3 months and extending to 2 years after surgery are usually due to neointimal hyperplasia; 12–37% of grafts fail during this period, approximately 70–80% of all graft failures; most of these will occur in the first 12 months. Beyond 2 years after surgery the usual cause of failure is progression of atherosclerosis, either in the native vessels or in the graft itself.15 In addition to graft stenosis or occlusions, other problems may occur, including dehiscence at the origin or insertion and false aneurysm formation, arteriovenous fistulae, infected collections and compression or kinking.
The theory behind surveillance programmes is that they will identify grafts at risk before they fail and allow remedial action to be taken to maintain patency and function. The timing of the surveillance scans is based on this time scale for problems. An early scan 4–6 weeks after the operation is performed, subsequently a scan is done at 3 months and then at 3-monthly intervals until the end of the first year. It is not usually necessary to continue beyond this if no cause for concern exists, as the majority of failures will occur in the first year. However, if there are particular reasons for concern, such as mild or moderate stenosis (velocity ratio > 2), then surveillance can be extended as appropriate. Surveillance programmes have been shown by some authors to be beneficial in terms of enhanced graft patency and limb survival rates.16 However, Lane et al. in a review of 42 studies14 noted that the evidence that surveillance programmes improved amputation/limb salvage rates, or the patient’s quality of life overall was not yet available. Their recommendations were that a duplex scan 6 weeks after surgery might identify grafts at risk which would benefit from surveillance but that those grafts without signs of concern at 6 weeks could be best managed with clinical follow up, together with ankle/brachial pressure measurements, with duplex scanning being undertaken if there were clinical concerns. It is recognised that further Level 1 evidence is required to clarify the role of surveillance one way or the other.
The situation is more straightforward for synthetic grafts. Several studies have shown that synthetic grafts are more likely to fail without warning signs being demonstrated on Doppler,17,18 and Lane et al. found no evidence to support duplex surveillance of prosthetic femoro-distal grafts.14 Symptomatic grafts, however, should always be examined, as a treatable lesion may be demonstrated prior to complete graft thrombosis and failure.
TECHNIQUE OF EXAMINATION
It is of value if the request for a graft assessment gives details of the surgery and the type of graft inserted; ideally, a diagram of the course of the graft should be provided. For a femoro-distal graft the examination should begin at the groin and the graft located; transverse scanning is helpful with identification of the graft origin. Once located the graft should be followed up to its point of origin from the native artery. The majority of grafts are femoropopliteal and run from the common femoral artery, or lower external iliac artery, to the upper or lower popliteal artery; occasionally the graft may originate from deeper in the pelvis, lower down the superficial femoral artery, or from the profunda femoris artery. The native artery above the graft is assessed and the velocity of blood flow measured with spectral Doppler. The origin of the graft is then examined carefully and any increase in velocity, or disturbance of flow, noted (Fig. 4-10).
Synthetic grafts are relatively straightforward to assess, as any problems usually occur at the origin or insertion, rather than along the length of the graft. Vein grafts, however, can develop problems at any point along their length, particularly at sites of avulsed valves or tied perforating veins (Fig. 4-11). Stenoses can occur secondary to surgery, or as a result of intimal hyperplasia, which can be stimulated by the turbulence at an irregularity in the vein wall. In situ vein grafts may also have persistent arteriovenous communications if a perforating or superficial communicating vein has been overlooked during the operation. These may be quite small but their presence should be suspected if there is a rapid, unexplained drop in velocity along the graft, or if pulsatile venous flow is seen in the common or superficial femoral veins. Scanning transversely along the line of the in situ graft makes it easier to identify these communicating vessels and demonstrate their course.
FIGURE 4-11 A stenosis in an in situ vein graft. The slight dilatation of the vessel at the level of the stenosis indicates that this is the site of an avulsed valve. The velocity above the stenosis (A) is only 0.25 m/s but increases to 1.35 m/s at the stenosis (B); a velocity ratio of 5.4.
A note should also be made of any collections seen along the track of the graft. In the postoperative period these are usually small collections of serous fluid, haematomas, or small lymphoceles; normally these resorb over a few weeks (Fig. 4-12A). If infection is suspected (Fig. 4-12B) then a fine needle (20–22 G) can be used to perform a diagnostic aspiration, although care should be taken not to introduce infection into a sterile collection.
FEATURES OF A GRAFT AT RISK
The main features which suggest that a graft is at risk of failing are shown in Table 4-3. There is good correlation between these criteria and the incidence of subsequent graft failure. The finding of a fall in the ankle/brachial pressure index of more than 0.15 in addition to the presence of a stenosis of more than 70%, or low mean graft velocity, is a strong indicator of a graft at risk.19 Gibson et al.20 found that there was a significantly higher incidence of graft failure if there was a graft-related stenosis with a velocity ratio > 3.5 and a mean graft PSV of < 50 cm/s, calculated from velocities obtained at non-stenotic points along the length of the graft. However, they found that a low mean graft velocity by itself without an associated stenosis was not associated with graft failure.
TABLE 4-3
Doppler Criteria for Graft Stenosis and Grafts at Risk
| Direct measurement of stenosis | Moderate > 50% diameter stenosis Severe > 70% diameter stenosis |
| Peak systolic velocity changes | > 1.5 m/s = 50–70% diameter stenosis > 2.5 m/s > 70% diameter stenosis |
| End diastolic velocity | > 1.0 m/s > 70% diameter stenosis |
| Velocity ratio | > 2.5 > 50% diameter stenosis > 3.5 > 70% diameter stenosis |
| Peak systolic velocity | < 50 cm/s in narrowest segment |
Other abnormalities which may be seen in relation to a bypass graft are a false aneurysm at the origin or insertion due to dehiscence of the anastomosis (Fig. 4-13), or an arteriovenous fistula.
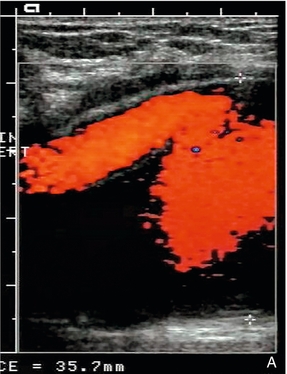
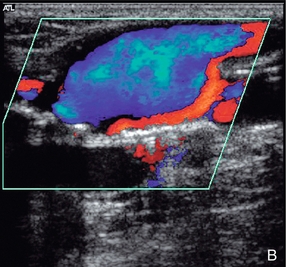
False Aneurysms
These are usually straightforward to diagnose on colour Doppler ultrasound, although occasionally there may be some difficulty if there is also a large haematoma present. The incidence of femoral false aneurysms increased as more interventional procedures were carried out through femoral puncture sites; rates of 0.2–0.5% after diagnostic arteriography and 2–8% following coronary artery angioplasty and stent placement have been reported.21Newer, improved techniques for sealing vascular puncture sites and radial/brachial access have led to some improvement in these figures. The characteristic appearance is a hypoechoic area which shows swirling blood flow on colour Doppler (Fig. 4-14A). It is important that the relationship of the aneurysm to the femoral artery is identified to ensure that any therapeutic thrombin injection is made into the aneurysm and not the artery. This may be difficult to define in the presence of a significant haematoma; in these cases identification of the artery above and below the haematoma and tracking back to the aneurysm area will allow some assessment of the relationships to be reached. Spectral Doppler of the track between the artery and the aneurysm, or at the aneurysm neck, shows a characteristic ‘to-and-fro’ flow signal as blood flows in during systole and out during diastole (Fig. 4-14B). Rarely, a false aneurysm may be associated with an arteriovenous fistula passing from the cavity to an adjacent vein. The clue to the presence of the fistula is the loss of the ‘to-and-fro’ flow in the track from the artery, with only forward flow being shown, which increases towards end-diastole. The need for intervention to treat a false aneurysm needs careful consideration: thrombin injection, surgery and possibly ultrasound-guided compression are all recognised treatments but it should be remembered that a significant proportion of pseudoaneurysms will thrombose spontaneously within 2–3 weeks; in one surgical series, 86% of 147 patients managed conservatively showed spontaneous thrombosis of their false aneurysms, or arteriovenous fistulae, within a mean period of 23 days.22
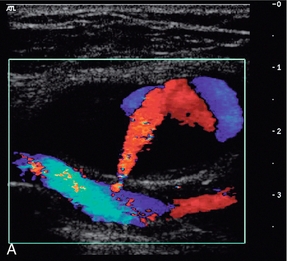
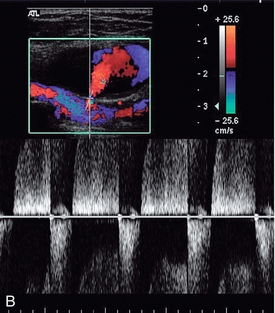
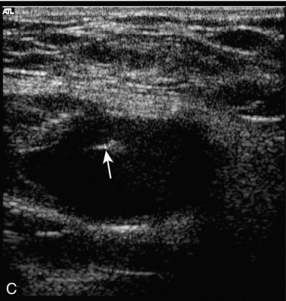
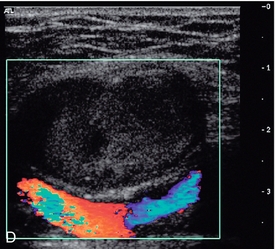
FIGURE 4-14 (A) A false aneurysm showing a patent lumen on colour Doppler; (B) the characteristic ‘to-and-fro’ flow on spectral Doppler; (C) tip of the needle for thrombin injection seen within the false aneurysm; (D) thrombosed false aneurysm following treatment with thrombin.
ULTRASOUND-GUIDED TREATMENT OF FALSE ANEURYSMS
Thrombin Injection
Bovine thrombin and, more recently, human thrombin are now available in many centres and the treatment of choice for most false aneurysms is injection of human thrombin directly into the aneurysmal sac under ultrasound control. In the great majority of cases, this will produce immediate and complete thrombosis of the false aneurysm within a few seconds. When the needle tip is positively identified within the aneurysm (Fig. 4-14C), the thrombin solution is injected into the lumen of the aneurysm through a 22–25 G needle attached to an insulin type of syringe (1 mL) to allow careful titration of the amount injected; normally 400–1000 IU of thrombin will be sufficient to produce thrombosis within 20–30 s (Fig. 4-14D). Care should be taken to keep the needle away from the neck of the false aneurysm to reduce the risk of thrombin refluxing into the artery and down the limb; similarly wide necked aneurysms have a higher risk of thrombin escaping. Following the procedure the patient should stay on bed rest for 1–3 h with regular review of the distal circulation in the affected limb and most centres undertake a check ultrasound examination at 24 h. In some cases a small residual region of continuing flow may require a second injection. One study of 101 false aneurysms showed 95% primary success rate after a single injection and 98% after a second injection in three cases; only two patients required surgical repair.21 Sheiman and Mastromatteo23 looked at the reasons for failure in a small series of false aneurysms undergoing thrombin injection; they found that arterial laceration of > 8 mm was the cause of failure in four out of five cases and local infection the most likely cause in the remaining patient.
Bovine thrombin may produce allergic responses in the patient and induce antibodies to native clotting factors; therefore, it is better to use human-derived thrombin if this is available. Contraindications to thrombin injection include ischaemic skin changes over a large aneurysm, local infection, evidence of nerve compression, or evidence of an arteriovenous fistula. Thrombin injection is reported to have worked satisfactorily after failed compression therapy in patients on full antiplatelet and anticoagulation therapy.24
There have been reports of the successful treatment of false aneurysms in other sites by thrombin injection; these include aneurysms in relation to haemodialysis access sites, an anterior tibial artery pseudoaneurysm that developed after a tibial osteotomy and a common carotid artery pseudoaneurysm that developed following an unsuccessful central venous line insertion.25
Ultrasound-Guided Compression
If suitable thrombin preparations are not available, then treatment of false aneurysms using ultrasound-guided compression might be considered. The ability of colour Doppler to demonstrate flowing blood in the aneurysm and track allows the operator to apply graded compression using pressure from the transducer, so that flow into the aneurysm is stopped, whilst allowing flow to continue down the native artery. This allows the aneurysm and track to thrombose and therefore remove the need for surgery.26 There are, however, some circumstances where it is recognised that compression is unlikely to succeed and direct referral for surgery should be considered; these are shown in Box 4-5. The most common contraindications for compression are the age of the aneurysm and warfarin therapy; if it has been present for more than 7–10 days then the track will have started to develop an endothelium and the surrounding tissues are less compliant, so that adequate compression becomes difficult.
The procedure is quite time consuming for the operator and uncomfortable for the patient, so it is better to give some analgesia to the patient prior to the commencement of prolonged compression. The aneurysm and its track are identified and compression is applied by pressing the transducer increasingly firmly down on these until flow in them has ceased but flow is still present in the native artery. This degree of pressure is then maintained for 10–15 min before being released slowly. If flow is still seen in the lumen, compression is reinstated for a further period of 10 min before again gently relaxing the pressure. These cycles of compression and relaxation are repeated until all flow in the aneurysm lumen has stopped. Usually the lumen of the aneurysm thromboses in an irregular fashion from the outside inwards, until complete obliteration is achieved. In one large series,26 the average time for successful treatment of a simple unilocular aneurysm was 43 min (SD ± 40 min) and 69 min (SD ± 54 min) for complex multiloculated lesions. Another large series showed a 72% primary success rate using compression in 297 false aneurysms, 7/12 patients who underwent a second compression episode had successful occlusion giving a secondary success rate of 74%.27 Following successful obliteration the patient is scanned after 24 h to confirm that the aneurysm remains occluded (Fig. 4-14D). A variety of mechanical compression devices have also been proposed but results with these are variable.
OTHER PULSATILE MASSES
Cystic Adventitial Disease
This is a rare condition in which fluid-filled cysts are found in the wall of the artery, usually the popliteal artery, or superficial femoral artery in the adductor canal. The aetiology of these cysts is unclear and various theories, including repeated trauma, ectopic synovial tissue, or a congenital abnormality linking the cyst to the adjacent knee joint space or to adjacent tendons, have been proposed.28 Signs and symptoms of ischaemia can be variable and confusing.29 Ultrasound is useful in diagnosis as it will show the narrowing of the lumen, together with the associated cystic lesion producing the stenosis (Fig. 4-15).
Brachial Compression Syndromes
Thoracic outlet syndrome, or compression of the subclavian artery as it crosses the first rib, may be due to congenital fibrotic bands at the insertions of the anterior and middle scalene muscles, or to compression associated with a cervical rib. The accompanying vein is also usually affected. Some degree of compression may be seen in up to 20% of normal subjects. The compression is often positional, typically occurring when the arm is elevated above the head, so various positions of the arm and shoulder may need to be assessed. Sometimes the symptoms only occur with the patient in a particular position such as standing or lying down. Usually the diagnosis is straightforward on clinical grounds, with the pulse in the affected arm disappearing when the arm is in the appropriate position. However, in some cases the diagnosis, or the cause, is less clear cut and colour Doppler can be used to image the subclavian artery as the arm is moved into various positions with the patient supine or erect. The transducer is usually placed in the supraclavicular position but scanning under the clavicle may be useful, particularly when the arm is fully elevated. Careful examination of the artery as it passes over the first rib may show changes in the waveform as the vessel is compressed (Fig. 4-16). Sometimes access to the subclavian artery in the region of the first rib can be difficult. In these cases, scanning the axillary artery whilst the arm is put in different positions will show any changes in velocity or waveform resulting from arterial compression. A rebound increase in velocity may be noted in the distal arteries on release of compression.30
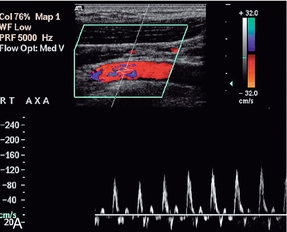
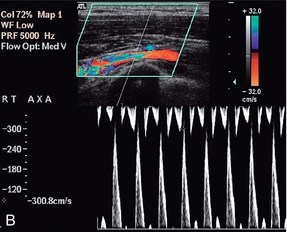
FIGURE 4-16 Compression of the subclavian artery as the arm is elevated/abducted. At rest flow in the axillary artery is approximately 1 m/min; (B) showing narrowing of the artery as it crosses the first rib as the position of the arm is changed. The velocity increases to 3 m/min.
POPLITEAL ARTERY COMPRESSION
In cases of suspected entrapment of an artery or graft in the adductor canal or popliteal fossa, direct examination of the vessel is often restricted by the limited access to the popliteal fossa with the knee flexed. However, careful examination of the lower popliteal artery or posterior tibial artery with the knee in different positions of flexion will demonstrate changes in the arterial waveform resulting from compression. Athletes may get compression of the popliteal artery between the lateral femoral condyle or upper tibia and the hypertrophied gastrocnemius, or soleus and plantaris muscles. This can be demonstrated on Doppler ultrasound by scanning with the foot in a neutral position and then in a position of active plantar flexion.31
Accuracy in Relation to Other Techniques
The gold standard for the assessment of the accuracy of Doppler ultrasound is usually arteriography but with modern computed tomographic arteriography (CTA) and magnetic resonance arteriography (MRA) techniques more widely available, diagnostic arteriograms are performed much less frequently. The reservations on the accuracy of arteriography, which are discussed in Chapter 3 on carotids, are also applicable to peripheral arterial disease. Cossman et al.9 compared colour Doppler with arteriography in 84 limbs, from the iliac to lower popliteal segments, using the criteria discussed earlier. For the detection of stenoses greater than 50%, they found an overall sensitivity of 87% (156/180 segments), specificity of 99% (444/449), accuracy of 95% (600/629), positive predictive value of 96% and negative predictive value of 95%. For the diagnosis of arterial occlusion the overall sensitivity was 81% (76/94), with specificity of 99% (463/466), accuracy of 96% (539/560), positive predictive value of 95% and negative predictive value of 96%.
Polak32 reviewed five studies performed between 1989 and 1992, including the study by Cossman et al.9 Colour Doppler was compared to arteriography and the overall sensitivity for the detection of a stenosis greater than 50% was 87.5% (316/361 segments), for an occluded segment the sensitivity was 92.6% (403/435), and the overall specificity for the identification of normal segments was 97% (1247/1282). These studies have assessed femoropopliteal disease; accurate assessment of infrapopliteal crural vessel disease with duplex is a little more difficult, although a sensitivity of 77% has been reported33 but if information on these vessels is clinically important then arteriography should be considered if there are any reservations about the duplex examination.
Similar, positive results have been obtained for duplex in upper limb disease with 79% sensitivity, 100% specificity and 99% accuracy for haemodynamically significant (50–70%) stenoses and 98% sensitivity, 99% specificity and 99% accuracy for occlusion being reported by Tola et al.34 who compared duplex ultrasound with intra-arterial digital subtraction angiography (DSA) in 578 upper limb arterial segments.
CTA and MRA have now largely replaced catheter arteriography for diagnostic examinations of the peripheral arteries. CTA now provides high-resolution images of the arteries which can be reviewed in 3D and manipulated on workstations. It can be used on individuals for whom MRI is contra-indicated, or people who are claustrophobic. The disadvantages of CTA are that vascular calcifications can interfere with accurate visualisation; anaphylactic reactions to iodine or nephrotoxicity in patients with impaired renal function; and exposure to ionising radiation.35
MRA can be carried out using several sequences and techniques. The most frequently used are time of flight and contrast-enhanced examinations. Contrast-enhanced studies (3D CE-MRA) provide the better sensitivity but there is a small risk of inducing nephrogenic systemic fibrosis (NSF) in a small number of susceptible individuals. The disadvantages of MRA are those common to all MR examinations, so the technique is not suitable for all patients.35
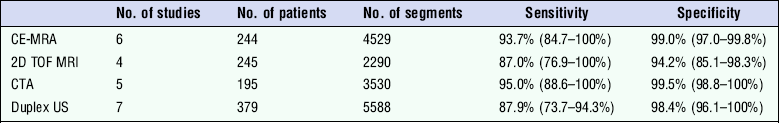
A review comparing studies on the detection of peripheral vascular disease using duplex, CTA, MRA (TOF) and CE-MRA (Table 4.4), showed that 3D CE-MRA has the highest sensitivity for detection of 50% stenosis;36 whereas CTA has a small advantage for the detection of occlusion. However, duplex ultrasound shows satisfactory performance and has advantages in availability and cost of equipment, although it has to be recognised that the results depend significantly on the skill and expertise of the operator. A more detailed review looking at economic aspects of the four imaging techniques suggests that duplex ultrasound is the most cost-effective technique for evaluation of a whole leg but, if analysis is limited to a section of the leg (above or below the knee) then TOF MRA is the most cost-effective diagnostic strategy.37
TABLE 4-4A
Sensitivity of Non-Invasive Imaging Techniques for > 50% Stenosis
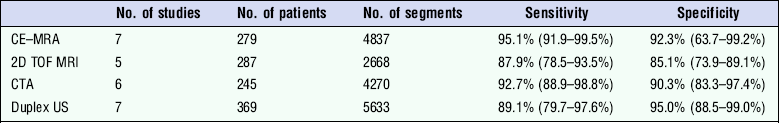
Adapted from Collins et al.36
TABLE 4-4B
Sensitivity of Non-Invasive Imaging Techniques for Occlusion
Adapted from Collins et al.36
REFERENCES
1. Fowkes, F. G. R. Epidemiology of atherosclerotic disease in the lower limbs. Eur J Vasc Surg. 1988; 2:283–291.
2. Department of Health and Social Security, Office of Population Censuses and SurveysHospital Inpatient Enquiry. London: HMSO, 1988.
3. Leng, G. C., Evans, C. J., Fowkes, F. G. R. Epidemiology of peripheral vascular diseases. Imaging. 1995; 7:85–96.
4. Eiberg, J. P., Hansen, M. A., Jensen, F., et al. Ultrasound contrast-agent improves imaging of lower limb occlusive disease. Eur J Vasc Endovasc Surg. 2003; 25:23–28.
5. Bergamini, T. M., Tatum, C. M., Marshall, C., et al. Effect of multilevel sequential stenosis on lower extremity arterial duplex scanning. Am J Surg. 1995; 169:564–566.
6. Allard, L., Cloutier, G., Guo, Z., et al. Review of the assessment of single level and multilevel arterial occlusive disease in lower limbs by duplex ultrasound. Ultrasound Med Biol. 1999; 25:495–502.
7. Whyman, M. R., Allan, P. L., Gillespie, I. N., et al. Screening patients with claudication from femoropopliteal disease before angioplasty using Doppler colour flow imaging. Br J Surg. 1992; 79:907–909.
8. Jäger, K. A., Ricketts, H. J., Strandness, D. E., Jr. Duplex scanning for evaluation of lower limb arterial disease. In: Bernstein E. F., ed. Noninvasive diagnostic techniques in vascular disease. St Louis: CV Mosby; 1985:619–631.
9. Cossman, D. V., Ellison, J. E., Wagner, W. H., et al. Comparison of contrast arteriography to arterial mapping with color-flow duplex imaging in the lower extremities. J Vasc Surg. 1989; 10:522–529.
10. van Asten, W. N., van Lier, H. J., Beijnevald, W. J., et al. Assessment of aortoiliac obstructive disease by Doppler spectrum analysis of blood flow velocities in the common femoral artery at rest and during reactive hyperaemia. Surgery. 1991; 109:633–639.
11. Zierler, R. E. Duplex and color-flow imaging of the lower extremity arterial circulation. Semin Ultrasound CT MR. 1990; 11:168–179.
12. Sensier, Y., Bell, P. R., London, N. J. The ability of qualitative assessment of the common femoral Doppler waveform to screen for significant aorto-iliac disease. Eur J Vasc Endovasc Surg. 1998; 15:357–364.
13. Rosfors, S., Eriksson, M., Hoglund, N., et al. Duplex ultrasound in patients with suspected aortoiliac occlusive disease. Eur J Vasc Surg. 1993; 7:513–517.
14. Lane, T. R. A., Metcalfe, M. J., Narayanan, S., et al. Post-operative surveillance after open peripheral arterial surgery. Eur J Vasc Endovasc Surg. 2011; 42:59–77.
15. Mills, J. L. Mechanisms of graft failure: the location, distribution and characteristics of lesions that predispose to graft failure. Semin Vasc Surg. 1993; 6:78–91.
16. Fasih, T., Rudol, G., Ashour, H., et al. Surveillance versus nonsurveillance for femoro-popliteal bypass grafts. Angiology. 2004; 55:251–256.
17. Dunlop, P., Sayers, R. D., Naylor, A. R., et al. The effect of a surveillance programme on the patency of synthetic infrainguinal bypass grafts. Eur J Vasc Endovasc Surg. 1996; 11:441–445.
18. Hoballah, J. J., Nazzal, R. M., Ryan, S. M., et al. Is color duplex surveillance of infrainguinal polytetrafluoroethylene grafts worthwhile? Am J Surg. 1997; 174:131–135.
19. Bandyk, D. F. Essentials of graft surveillance. Sem Vasc Surg. 1993; 6:78–91.
20. Gibson, K. D., Caps, M. T., Gillen, D., et al. Identification of factors predictive of lower extremity vein graft thrombosis. J Vasc Surg. 2001; 33:24–31.
21. Maleux, G., Hendrickx, S., Vaninbroukx, J., et al. Percutaneous injection of human thrombin to treat iatrogenic femoral pseudoaneurysms: short- and midterm ultrasound follow-up. Eur Radiol. 2003; 13:209–212.
22. Toursarkissian, B., Allen, B. T., Petrinec, D., et al. Spontaneous closure of selected pseudoaneurysms and arteriovenous fistulae. J Vasc Surg. 1997; 25:803–808.
23. Sheiman, R. G., Mastromatteo, M. Iatrogenic femoral pseudoaneurysms that are unresponsive to percutaneous thrombin injection: potential causes. Am J Roentgenol. 2003; 181:1301–1304.
24. Gorge, G., Kunz, T. Thrombin injection for treatment of false aneurysms after failed compression therapy in patients on full dose antiplatelet and heparin therapy. Catheter Cardiovasc Interv. 2003; 58:505–509.
25. Ghershin, E., Karram, T., Gaitini, D., et al. Percutaneous ultrasonographically guided thrombin injection of iatrogenic pseudoaneurysms in unusual sites. J Ultrasound Med. 2003; 22:809–816.
26. Coley, B. D., Roberts, A. C., Fellmeth, B. D., et al. Postangiographic femoral artery pseudoaneurysms: further experience with US-guided compression repair. Radiology. 1995; 194:307–311.
27. Eisenberg, L., Paulson, E. K., Kliewer, M. A., et al. Sonographically guided compression repair of pseudoaneurysms: further experience from a single institution. Am J Roentgenol. 1999; 173:1567–1573.
28. Flanigan, D. P., Burnham, S. J., Goodreau, J. J., et al. Summary of cases of adventitial disease of the popliteal artery. Ann Surg. 1979; 189:165–175.
29. Cassar, K., Engeset, J. Cystic adventitial disease: a trap for the unwary. Eur J Endovasc Surg. 2005; 29:93–96.
30. Wadhwani, R., Chaubal, N., Sukthankar, R., et al. Color Doppler and duplex sonography in 5 patients with thoracic outlet syndrome. J Ultrasound Med. 2001; 20:795–801.
31. Baltopoulos, P., Filippou, D. K., Sigala, F. Popliteal artery entrapment syndrome: anatomic or functional syndrome? Clin J Sports Med. 2004; 14:8–12.
32. Polak, J. F. Peripheral arterial disease. Evaluation with color flow and duplex sonography. Radiol Clin North Am. 1995; 33:71–90.
33. Karacagil, S., Lofberg, A. M., Granbo, A., et al. Value of duplex scanning in evaluation of crural and foot arteries in limbs with severe lower limb ischaemia – a prospective comparison with angiography. Eur J Vasc Endovasc Surg. 1996; 12:300–303.
34. Tola, M., Yurdakul, M., Okten, S., et al. Diagnosis of arterial occlusive disease of the upper extremities: comparison of color duplex sonography and angiography. J Clin Ultrasound. 2003; 31:407–411.
35. Cao, P., Eckstein, H. H., De Rango, P., et al. Management of critical limb ischaemia and diabetic foot. Clinical practice guidelines of the European Society for Vascular Surgery. Chapter 2: Diagnostic methods. Eur J Vac Surg. 2011; 42(Suppl. 2):S13–S32.
36. Collins, R., Burch, J., Cranny, G., et al. Duplex ultrasonography, magnetic resonance angiography and computed tomography angiography for diagnosis and assessment of symptomatic, lower limb peripheral arterial disease: a systematic review. BMJ. 2007; 334:1257–1265.
37. Collins, R., Cranny, G., Burch, J., et al. A systematic review of duplex ultrasound, magnetic resonance angiography and computed tomography angiography for the diagnosis and assessment of symptomatic, lower limb peripheral arterial disease. Health Technol Assess. 11(20), 2007.
[/level-membership-for-radiology-category][not-level-membership-for-radiology-category]Chapter 4
The Peripheral Arteries
Atheroma occurs to different degrees in different parts of an individual’s cardiovascular system and the lower limb arteries are particularly prone to the development of atherosclerosis. Approximately 2% of adults in late middle age in Western countries have intermittent claudication1 and each year in England and Wales around 50 000 patients are admitted to hospital with a diagnosis of peripheral arterial disease; 15 000 of these will require amputation.2 There are many factors which may influence the development of disease and, in general terms, the prevalence of peripheral vascular disease detected by non-invasive procedures is about three times greater than the prevalence of intermittent claudication.3 This chapter concentrates on the use of ultrasound in the assessment of disease in the lower limb arteries, as this is the area where most work is generated, but the value of ultrasound in the investigation of a variety of upper limb arterial disorders is also discussed.
Indications
Peripheral vascular disease
The main indications for performing Doppler ultrasound of the arteries of the upper and lower limbs are given in Box 4-1. The most common indication is the assessment of patients with ischaemic symptoms of the lower limb in order to determine if they are likely to benefit from angioplasty or a bypass graft. The ultrasound findings provide information on the extent and severity of disease; even in patients with limb-threatening ischaemia ultrasound is a useful first-line investigation that can provide the surgeon with all the information that is required for patient management. In many cases ultrasound will provide sufficient information for management decisions to be reached. In other cases, if further information is required, the subsequent magnetic resonance angiography (MRA)/computed tomography angiography (CTA)/arteriogram can be tailored appropriately. Ultrasound provides an accurate assessment of the major arteries which allows distinction between patients with significant peripheral arterial disease and those without. At the other end of the spectrum, patients with atypical symptoms that might be due to ischaemia can be examined to exclude the presence of significant arterial disease.
Haemodialysis Fistulae
Arteriovenous fistulae created for haemodialysis can be examined using ultrasound, allowing identification of complications associated with stenosis or occlusion, as well as estimation of blood flow through the shunt, particularly if this is thought to be inadequate or excessive (see Chapter 7).
Anatomy and Scanning Technique
ANATOMY – LOWER LIMB
The arteries of the lower limb arise at the bifurcation of the abdominal aorta (Fig. 4-1), the common iliac arteries run down the posterior wall of the pelvis and divide into the internal and external iliac arteries in front of the sacroiliac joint. The internal iliac artery continues down into the pelvis and is difficult to demonstrate with transabdominal ultrasound, although transvaginal or transrectal scanning will show some of its branches. The external iliac artery continues around the side of the pelvis to the level of the inguinal ligament, it lies anteromedial to the psoas muscle and is normally superficial to the external iliac vein.
The anterior tibial artery passes forwards through the interosseous membrane between the fibula and tibia. It then descends on the anterior margin of the membrane, deep to the extensor muscles on the anterolateral aspect of the calf (Fig. 4-2). At the ankle it passes across the front of the joint to become the dorsalis pedis artery of the foot which runs from the front of the ankle joint to the proximal end of the first intertarsal space where it gives off metatarsal branches and passes through the first intertarsal space to unite with the lateral plantar artery and form the plantar arterial arch.
SCANNING TECHNIQUE – LOWER LIMB
Common Femoral, Profunda Femoris and Superficial Femoral Arteries
The examination begins with the patient lying supine on the couch. The main steps in the examination are given in Box 4-2. A linear array transducer is used; usually 5–12 MHz depending on the performance of the ultrasound system and the build of the patient, lower frequencies may be required to examine the arteries in the adductor canal or in large patients. The distal external iliac/common femoral artery is located using colour Doppler as it leaves the pelvis under the inguinal ligament lateral to the femoral vein. Even if flow appears normal on colour Doppler and there is no evidence of local disease, a spectral Doppler trace should be recorded, as changes in this may indicate the presence of significant disease proximally, necessitating a careful direct examination of the iliac vessels. The bifurcation of the common femoral artery into the profunda femoris and superficial femoral arteries is then examined using colour and spectral Doppler. The profunda femoris artery should be examined over its proximal 5 cm, especially in patients with severe superficial femoral disease, in order to assess the amount of collateral flow, or its potential value as a graft origin or insertion point.
1. Colour Doppler may show the presence of collateral vessels in the muscles of the thigh (Fig. 4-3A).
FIGURE 4-3 (A) Collateral vessels in the muscles of the thigh. (B) A larger collateral vessel joining the lower superficial femoral artery.
2. Collateral vessels may be seen leaving the main artery (Fig. 4-3B).
3. The character of the spectral waveform may show a change between two levels, indicating a segment of disease somewhere between the two points of measurement.
The Adductor Canal and Popliteal Fossa
The patient is then turned into a lateral decubitus position so that the medial aspect of the leg being examined is uppermost (Fig. 4-4). This position is better than the prone position as it allows access in continuity to the lower superficial femoral artery, the adductor canal area, the popliteal region and the medial calf. The region of the adductor canal must be examined with great care as it is a site where a short-segment stenosis or occlusion may be present, and this section of the vessel can be difficult to visualise as it passes deep to the thigh muscles. In some cases the use of a lower scanning frequency may help visualisation. The superficial femoral artery is examined as far down as it can be followed on the medial aspect of the thigh; the popliteal artery is then located in the popliteal fossa and followed superiorly. In difficult cases a mark can be put on the skin of the medial thigh to show the lowest segment of vessel visualised in the supine position; the popliteal artery is then followed superiorly in the decubitus position until the transducer reaches the level of the skin mark, ensuring that the vessel has been examined in continuity. The popliteal artery is then examined and followed down to the point of division into the tibioperoneal trunk and anterior tibial artery.
Calf Arteries
The peroneal artery runs more deeply down the calf than the posterior tibial artery, lying closer to the posterior aspect of the tibia and the interosseous membrane. It can be examined from several approaches: firstly from a posteromedial approach similar to that used for the posterior tibial artery; secondly, it can often also be seen from the anterolateral approach used for the anterior tibial artery as it runs behind the interosseous membrane (Fig. 4-2); thirdly, a posterolateral approach may be of value in some cases.
The anterior tibial artery is examined from an anterolateral approach through the extensor muscles lying between the tibia and fibula. The two bones can be identified on transverse scanning and the interosseous membrane located passing between them. The anterior tibial artery lies on the membrane and can be located using colour Doppler in either the longitudinal or transverse plane. It usually lies nearer the fibula than the tibia (Fig. 4-2).
The advent of power Doppler and echo-enhancing agents has extended the role of ultrasound in the assessment of vascular disease. In the proximal lower limb and iliac vessels, the location of the vessel and confirmation of occluded segments has been made easier and, in the distal part of the leg, they make assessment of the smaller vessels of the calf and foot easier. However, more work is required to evaluate further their role.4
ANATOMY – UPPER LIMB
The subclavian arteries arise from the brachiocephalic trunk on the right (Fig. 4-5) and directly from the arch of the aorta on the left; however, there is considerable normal variation in the patterns of their origination. The origin of the right subclavian artery can be examined behind the right sternoclavicular joint, where the brachiocephalic trunk divides into the right common carotid artery and the subclavian artery. The origin of the left subclavian artery from the aortic arch cannot be demonstrated, although the more distal segments can be seen as on the right side. The subclavian artery on each side runs from its point of origin to the outer border of the first rib where it becomes the axillary artery; the subclavian vein lies in front of the artery. The main branches of the subclavian artery are the vertebral arteries, the thyrocervical trunk, the internal thoracic (mammary) artery and the costocervical trunk.
