[level-membership-for-opthalmology-category]
13 The Normal Retina, Retinal Imaging and the Interpretation of Pathological Changes
THE NORMAL RETINA
EMBRYOLOGY
The overall adult arrangement of retinal layers is present by 5½ months’ gestation but retinal development is not uniform. For example, although photoreceptors first differentiate at the macula, this is soon overtaken by development in other retinal areas so that at birth the macula is the only area not to be developed fully—it is not completely developed until about 3–4 months after birth, when the baby starts to fixate.
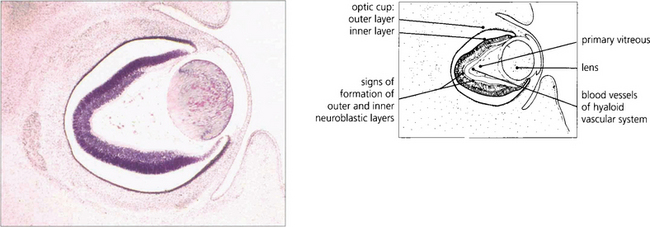
Fig. 13.1 An axial section of the eye of a 20-mm fetus (6 weeks’ gestation) shows the inner and outer layers of the optic cup; these will form the neurosensory retina and RPE respectively. The primary vitreous and hyaloid vascular system are visible, and the inner retina already shows signs of dividing into the inner and outer neuroblastic layers.
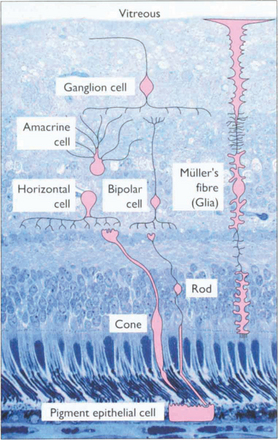
ANATOMY OF THE RETINA
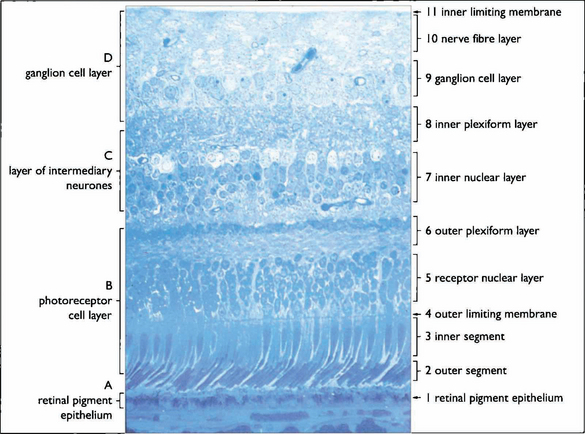
Fig. 13.3 The retinal cell layers are listed on the left and the apparent layers that these cells give rise to are shown on the right.
The retinal pigment epithelium
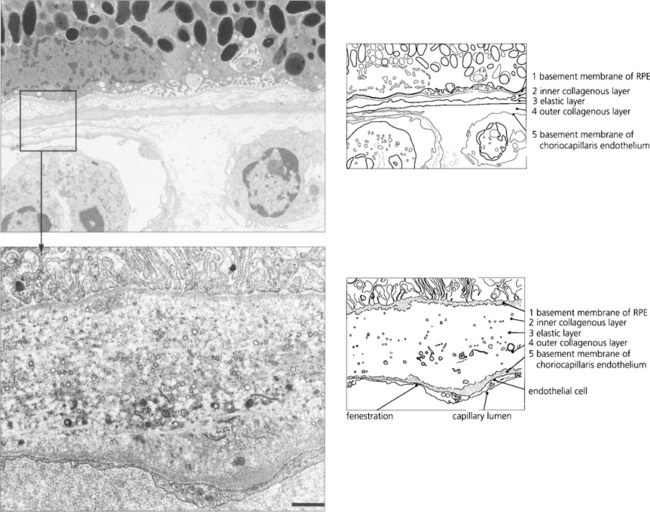
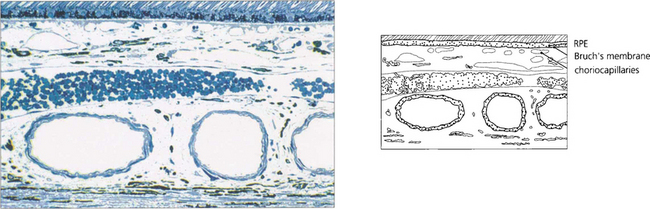
In younger eyes the border of the RPE cell adjacent to Bruch’s membrane is extremely convoluted and many mitochondria reside within this portion of the cell. These convolutions increase the surface area of the cell membrane which is covered with specific biochemical binding sites. RPE cells actively accumulate and transport metabolites diffusing through Bruch’s membrane from the underlying choriocapillaris and actively excrete waste products to the choriocapillaris (the retinal artery circulation does not contribute to the metabolic needs of the photoreceptors). Each RPE cell services up to 45 photoreceptors held in close physiological contact by membranous extensions from the surface of the RPE, termed ‘receptor sheaths’. These sheaths extend up to 50 per cent of the height of outer segments and play a major role in metabolite exchange between the cells. The extracellular space between the photoreceptors is filled with a glycosaminoglycans ground substance called the interphotoreceptor matrix. This differs in structure and chemical composition around rods and cones. There is no anatomical bond between the RPE cell and photoreceptor so that these two layers can be easily separated pathologically (e.g. by retinal detachment). However, the cone matrix sheaths are more strongly adherent to the RPE and resistant to the cone outer segment being withdrawn; this may explain the increased resistance of the macula to retinal detachment.
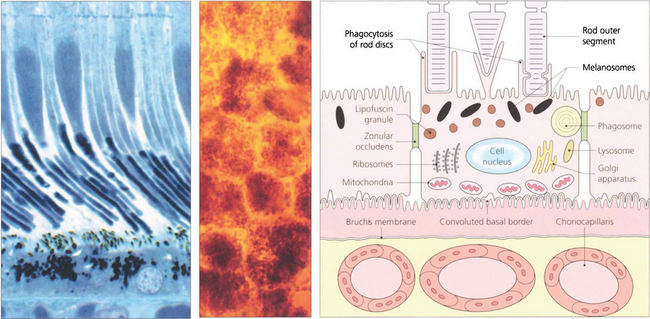
Fig. 13.5 A flat preparation shows the monolayer of hexagonal RPE cells and the natural colouration of their melanin granules. Tight junctions or zonular occludens between RPE cells prevent free diffusion from the choriocapillaris into the neural retina. These junctional complexes extend around the entire circumference of each RPE cell and bind it to its neighbours. The tight junctions and the active transport mechanisms together constitute the ‘outer blood–retinal barrier’ which ensures that photoreceptor cells are exposed only to selected molecules. The line drawing illustrates the intracellular anatomy. The complex of a pigment epithelial cell and its photoreceptors is a highly metabolically active area and specific failures in the metabolic route to and from the photoreceptor produce many of the inherited retinal dystrophies.
The photoreceptor cells
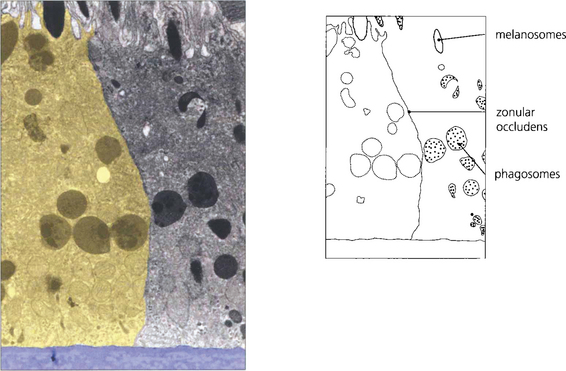
Fig. 13.6 The zonular occludens junction between RPE cells can be seen here. These surround the cell ensuring that the metabolites entering and leaving the retina from the choroid must pass intracellularly.
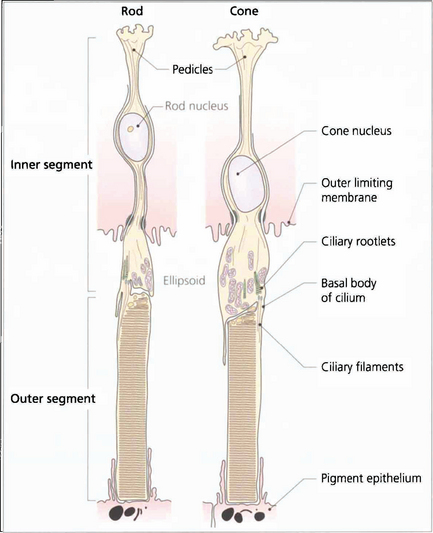
Fig. 13.7 The structure of a photoreceptor consists of:
• An outer segment, which is the light-sensitive portion of the cell and consists of a stack of hollow coin-like discs whose membranes contain the visual pigment molecules. In each rod there are about 1000 discs that are separate from all the others and the boundary membrane of the cell. Rod outer segments can be thought of as analogous to a stack of coins in a tube. If the tube is broken and the stack disturbed individual coins will be lost. In cones the outer segments differ in that all the ‘discs’ are joined to the boundary membrane with an aperture; through this hole the discs are in contact with the extracellular space and, therefore, with each other. Consequently, it is not possible to isolate a single ‘disc’ from a cone outer segment.
• A constricted region called the cilium which resembles the structure of other cilia in that it contains a number of paired microtubules.
• An inner segment which is the manufacturing portion of the cell; in each case this is divided into two, an outer ellipsoid and an inner myoid. The ellipsoid contains mitochondria and provides energy for the transduction processes in the outer segment, and the myoid contains Golgi bodies and ribosomes for manufacture of cell components and membranes.
• An outer connecting fibre that runs from the inner segment to the nucleus. In cones this tends to be short as the nuclei are situated in the outer part of the outer nuclear layer close to the outer limiting membrane. For rods the length varies with nuclear position.
• An inner connecting fibre that runs from the nucleus to the synaptic region. In cones it is this structure that becomes elongated as the fibres run out of the foveal pit to make contact with the displaced intermediary neurones and form the fibre layer of Henlé.
• A synaptic region. In rods this is sometimes called the rod spheral and in cones the cone pedicle. In both cells the synaptic region contains vesicles and mediation of transsynaptic information is by chemical transmitters. Both cells exhibit so-called invaginated connections with components from intermediary neurones deep to their synapse surface. These invaginated synapses are called ‘triads’ because they contain three processes, usually one from a bipolar cell and two from horizontal cells. Rods have a single triad whereas cones may have up to 20.
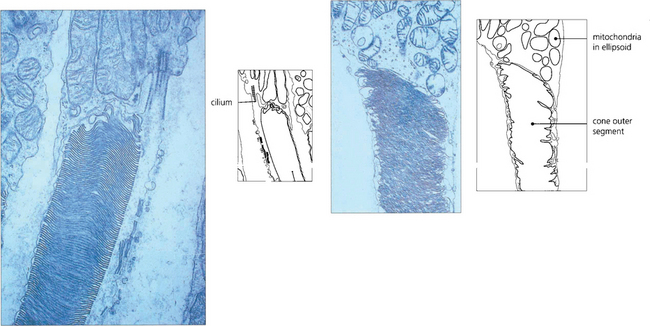
Fig. 13.8 Electron micrograph shows the junction between the inner and outer segment of a rod. Note the cilium. Photoreceptor discs are formed by invagination of the outer segment membrane. In contrast, cone outer segments remain attached to the cell membrane over a small part of their circumference.
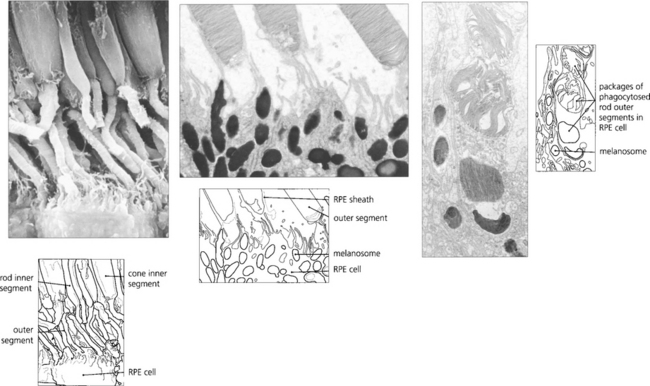
Fig. 13.9 Unlike neurones photoreceptor cells continually replace a major structural portion of themselves throughout life and again this process differs between rods and cones. In rods new discs are formed in the region of the cilium at the rate of about 1–5 an hour and as each new disc is formed older ones are progressively displaced towards the RPE. The oldest discs are shed from the tips of the outer segments in packets of about 30 at a time in a balanced process that does not radically alter rod length. Packets of rod discs are shed first thing in the morning or, if in periods of prolonged darkness, at the onset of light. The shed discs are phagocytosed by the RPE and, therefore, the rod outer segment is replaced entirely every 8–14 days. Less is known about cones although the evidence suggests that their discs are also renewed, however, the process is much slower than that for rods so that it takes about 9 months to 1 year for the outer segment to be replaced fully. This time course is supported by clinical observations on the recovery of cone function after retinal detachment surgery. In contrast to rods, cones shed their phagosomes at night. This circadian rhythm is one of many thought to be initiated by the effect of light absorption on the photopigment melanopsin which is located in some retinal ganglion cells.
Topographical variation in the retina
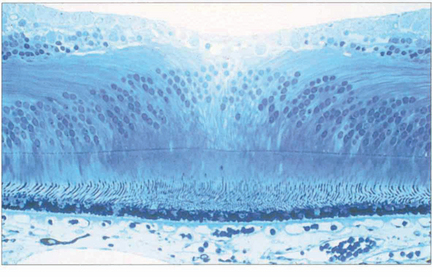
Fig. 13.11 In the foveola, the neural retina is about 170 mm thick, compared to 350 mm in the fovea. This thinning arises because the neurones of the inner retina, together with the ganglion cells, are displaced radially as the nerve fibre layer of Henlè; incident light can thus fall on the highly specialized cones without passing through a potentially light-scattering medium of neural retina and retinal capillaries.
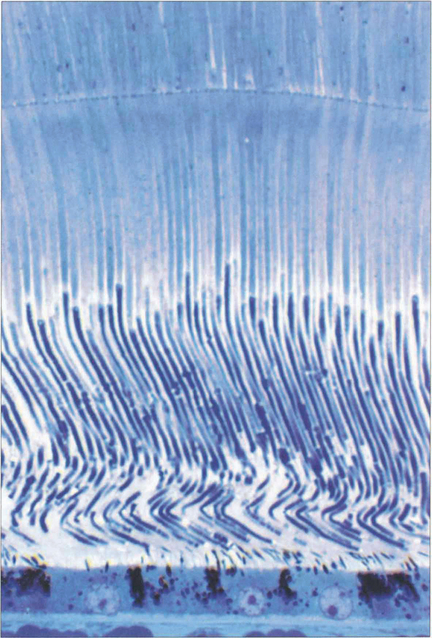
Fig. 13.12 At the fovea the cones have a tall slender shape with a diameter of 1.5μm permitting a resolving power of 20° of arc at the nodal point of the eye.
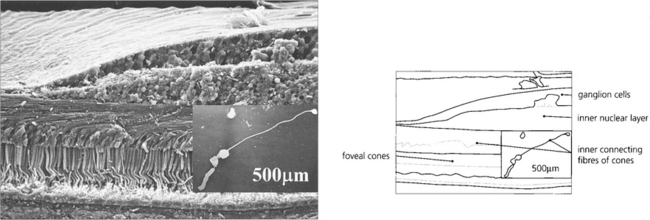
Fig. 13.13 For the foveal cones to connect with the displaced inner retinal neurones, the inner connecting fibres of the cones become very elongated and collectively form the fibre layer of Henlé. Macular xanthophil pigment is located in this layer and absorbs blue light, which is potentially harmful to the photoreceptors. Pathological oedema and exudation readily accumulate here because the inner connecting fibres are not held tightly together. This is seen clinically as the radially oriented cystoid spaces of macular oedema or as a macular star with lipid exudation.

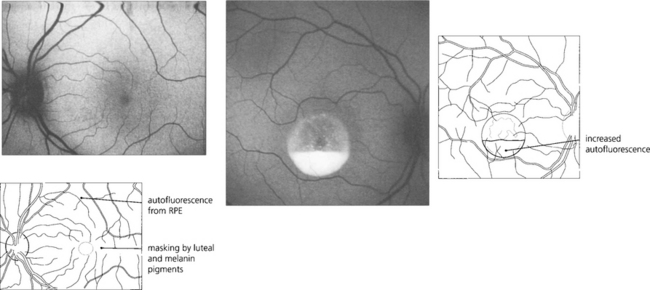
Fig. 13.14 (Left) At post-mortem examination, the macula has a yellowish colour from the xanthophil pigment (hence the name macula lutea). This pigment has a role in protecting the photoreceptors from short wavelength blue light which has the ability to produce cellular damage as a result of the generation of free radicals. (Right) Histological examination shows the pigment in Henlés layer.
Left image from Miller D (ed.) Clinical Light Damage to the Eye. New York: Springer, 1987.
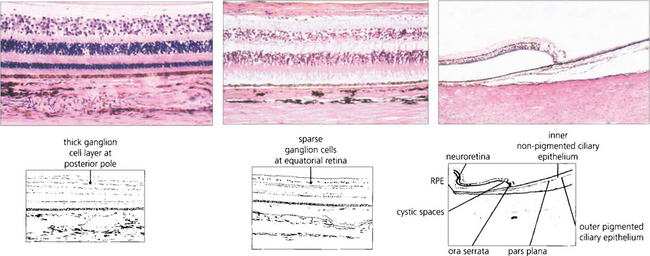
Fig. 13.15 In the posterior pole the ganglion cell layer is several cells thick. Towards the periphery the retina becomes thinner and the ganglion cell layer less dense. In the elderly the peripheral retina adjacent to the ora serrata may show cystic spaces within the attenuated neural retina. At the ora serrata the inner retinal layers are lost and the photoreceptors become shorter and fewer until finally the retina is lost to fuse with the nonpigmented monolayer of the pars plana which runs forwards over the ciliary processes (see also Ch. 9).
Retinal blood vessels
The central retinal artery supplies all the cells of the neural retina with the exception of the photoreceptors which receive their metabolic supply from the choroid by active transport through the RPE (see Ch. 9). The central retinal artery is a true artery and as such can suffer atherosclerosis which may cause, for example, a central retinal artery thrombosis. At the optic disc the central retinal artery divides into four main branches which are technically arterioles each of which is an end vessel with no anastomosis. These arterioles have a media of smooth muscle 7–8 cells thick; they can undergo arteriolar sclerosis or hypertensive changes but are not involved in atherosclerosis. The major arterial branches run in the nerve fibre layer below the internal limiting membrane and share a common adventitial sheath with veins where they cross. Cilioretinal arteries are seen in about 20 per cent of patients and may be the major blood supply to the macula in a minority of people.
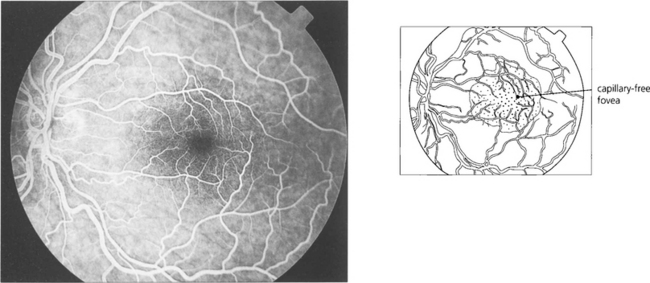
Fig. 13.16 There is a capillary-free zone around the retinal arteries of 150μm and within the foveola of about 400μm in diameter. The foveola, the centre of fovea, is therefore unencumbered by blood vessels which would otherwise degrade visual acuity; like the rest of the photoreceptors this area receives its blood supply from the choroid.
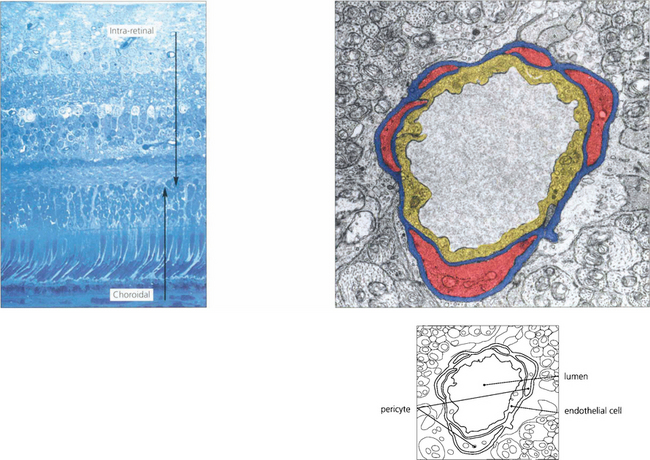
Fig. 13.17 At the posterior pole there is a superficial (nerve fibre layer) and deep (outer plexiform layer) capillary plexus which come together to form a single plexus in the inner nuclear layer as the retina thins towards the periphery. With fluorescein angiography only the inner layer is visualized. The retinal capillaries consist of endothelial cells with tight intercellular junctions, a basement membrane and mural pericytes. Tight junctions formed by the capillary endothelial cells limit extracellular diffusion and metabolites can reach the neural retina only by active transport processes. This is known as the inner blood–retinal barrier. The retina, therefore, has two protective barrier systems: the inner blood–retinal barrier created by the capillary endothelial cells and the outer blood-retinal barrier formed by the RPE.
RETINAL IMAGING
A number of retinal imaging techniques are commonly used to diagnose retinal diseases and to understand their pathogenesis. Fluorescein angiography is a standard investigation. Indocyanine green (ICG) angiography is particularly useful in situations where fluorescein is ‘masked’ by haemorrhage or when the choroidal circulation needs to be visualized. Optical coherence tomography (OCT) is useful for assessing structural changes in the macula and the vitreoretinal interface (see Chs 1 & 12) and autofluorescence imaging can be used as a research technique to study the lipofuscin load of the RPE.
FLUORESCEIN ANGIOGRAPHY
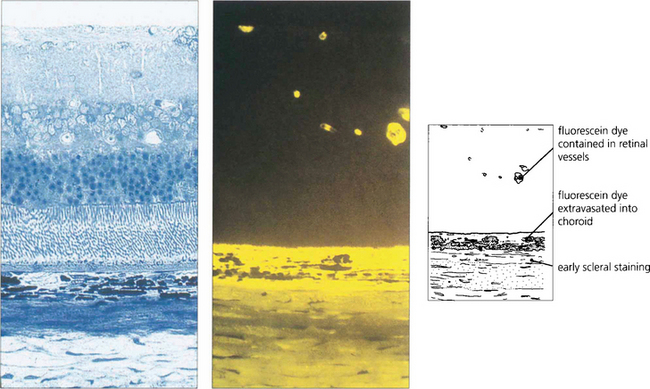
Fig. 13.19 This photograph of normal rat retina (left), together with a freeze-dried preparation taken after the injection of fluorescein (right), demonstrates that dye is kept intravascularly by the inner blood retinal barrier of the retinal circulation. Dye leaks from the choriocapillaris into the choroidal extravascular space and spreads posteriorly to stain the sclera but is prevented from entering the retina by the outer blood–retinal barrier of the RPE.
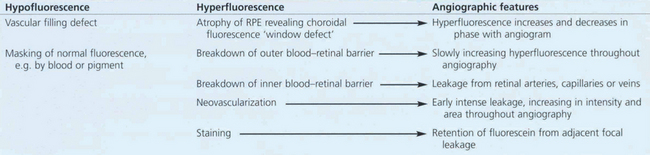
Table 13.1 indicates the changes that can be seen on fluorescein angiography. Hypofluorescence can be produced by either a vascular filling defect in the circulation or blocking (masking) of the normal retinal or choroidal fluorescent pattern by, for example, blood or pigment. Hyperfluorescence may result from leakage from retinal vessels (i.e. breakdown of the normal inner blood–retinal barrier), atrophy of the RPE allowing the choroidal fluorescence to be seen more prominently (window defect), or breakdown of the RPE cell barrier (outer blood–retinal barrier) in which case fluorescein is seen as pooling and staining in the subretinal space. Neovascular tissue is demonstrated dramatically by fluorescein angiography. All new vessels, whether derived from the retinal or choroidal circulation, lack tight capillary endothelial cell junctions and therefore leak fluorescein; they fill in the early phases of angiography and leak intensively as it progresses.
Table 13.1 Changes seen on fluorescein angiography
The normal fluorescein angiogram
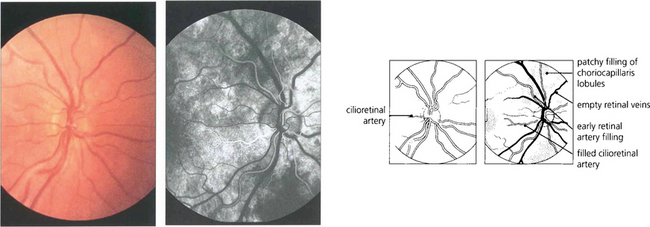
Fig. 13.20 (Left) Colour images are taken before angiography for later comparison. A small cilioretinal artery can be seen on this optic disc. (Right) In the earliest choroidal phase, there is patchy filling of the choriocapillaris due to its lobular supply and the deep optic disc capillaries. As the cilioretinal artery derives from the posterior ciliary circulation it also fills in the choroidal phase. Dye is starting to appear in the retinal arteries but the veins are empty and appear black against the background of the choroidal fluorescence.
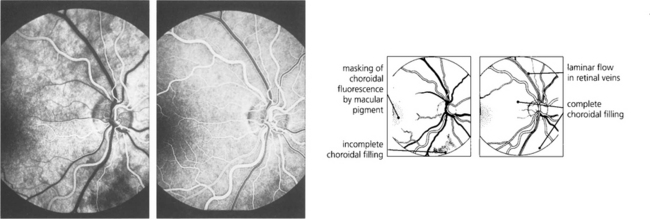
Fig. 13.21 A second or two later choroidal filling is complete so that the retinal circulation is viewed against a uniform choroidal glow, masked in the macular area by both the luteal pigment and the denser pigment in the RPE cells. Retinal arteries are well filled with dye. (Right) The early arteriovenous phase shows complete choroidal and retinal arterial filling and laminar flow in the major retinal veins. This is due to the presence of dye in the plasma adjacent to the vessel wall, the central blood stream being filled by a nonfluorescent core of red blood cells.
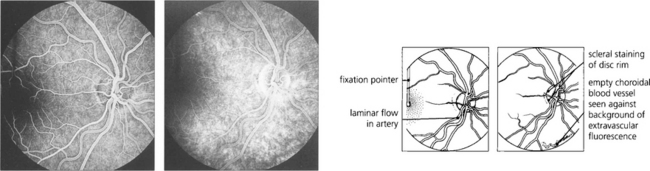
Fig. 13.22 (Left) A later image shows complete filling of the various systems; laminar flow appears in the retinal arteries as they empty. The vertical fixation pointer is easily seen against the background fluorescence and allows the fovea to be identified precisely. A late-phase image (right) shows emptying of the retinal and choroidal circulations and some peripheral hyperfluorescence around the edge of the optic disc from staining of the scleral rim. The fading choroidal fluorescence is masked in the macular area. Some of the larger choroidal vessels are seen as filling defects in the choroidal vascular bed.
INDOCYANINE GREEN (ICG) ANGIOGRAPHY
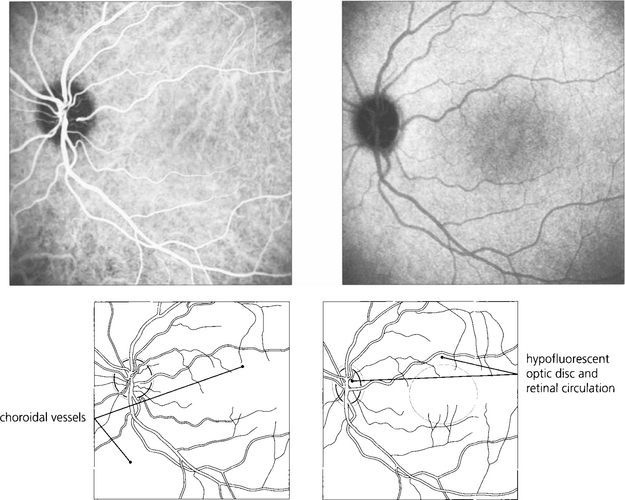
Fig. 13.23 ICG using SLO imaging of a normal eye. In the early phase (left) there is filling of the retinal and choroidal circulations with better definition of choroidal vessels compared to FFA. In the late phase (right), the empty retinal circulation is seen against the uniform background of choroidal fluorescence from extravasated dye from the choriocapillaris.
By courtesy of Mr Ethan Priel.
OPTICAL COHERENCE TOMOGRAPHY (OCT)
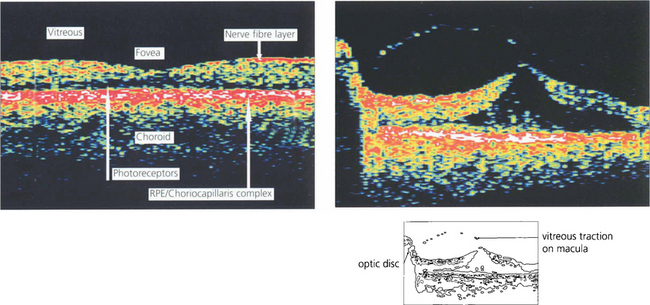
Optical coherence tomography (OCT) allows high-resolution cross-sectional imaging of the retina in a way analogous to ultrasonic B scanning (see Ch. 1) but with much higher spatial resolution. It is a noncontact and noninvasive technique that is particularly useful in imaging structural macular changes such as measuring macular thickness, oedema and assessing macular holes and vitreoretinal traction (see Ch. 12). It is less useful in identifying subretinal changes such as neovascularization. Future development may have significant uses in measuring optic disc cupping and nerve fibre layer thickness.
PHYSICAL SIGNS OF RETINAL DISEASE
COTTON-WOOL SPOTS
All neurones in the body transport intracellular organelles bidirectionally between the nucleus and the synapse; this process is known as axoplasmic transport. Pathologically, a cotton-wool spot results from the accumulation of organelles as a result of interrupted axoplasmic transport between the retinal ganglion cell and its synapse in the lateral geniculate body (orthograde transport), or vice versa (retrograde transport). Orthograde transport is the more prominent component and largely involves mitochondria. Electron microscopy and histological examination show that the axonal stumps at the edges of a microinfarct are packed with mitochondria which produce the white appearance. (Papilloedema is produced by the identical mechanism of hold-up of axoplasmic flow at the lamina cribrosa; see Ch. 17.) Cotton-wool spots are most commonly associated with diseases that cause microvascular ischaemia such as hypertension, diabetes, systemic lupus erythematosus and AIDS retinopathy.
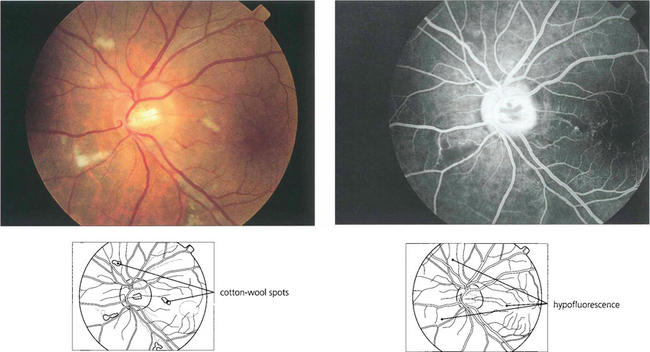
Fig. 13.26 (Left) These fresh, fluffy cotton-wool spots are seen around the optic disc in a patient with recent-onset radiation retinopathy. Their localization to the superficial retina can be seen by the way they overlay the retinal vessels. At this acute stage the nerve fibre layer appears intact. Nerve fibre loss produces grooves in the nerve fibre layer; these take about 6 weeks to appear ophthalmoscopically. (Right) The fluorescein angiogram shows that the cotton-wool spots correspond exactly to small areas of hypofluorescence in the retinal capillary network. These persist throughout the angiogram and are not associated with extravascular leakage confirming their aetiology as microvascular infarcts.
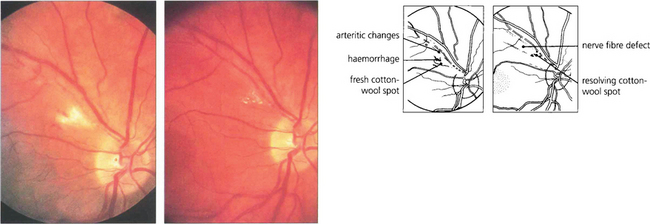
Fig. 13.27 Photographs from a patient with an inflammatory arteritis show a fluffy cotton-wool spot with some haemorrhage in the acute stage (left). Note also the arteritic changes of focal sheathing in the superior temporal artery. Six weeks’ later (right), the cotton-wool spot is absorbing and remains only as small, well circumscribed spots. The arteritic changes are less prominent and a nerve fibre defect has appeared.
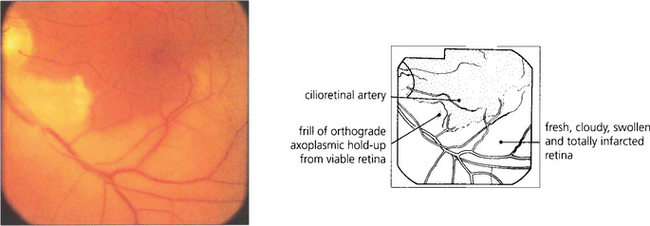
Fig. 13.28 The distinction between retinal infarction and axonal infarction is shown by this patient with a recent lower temporal branch artery occlusion. The retina supplied by the obstructed artery appears pale due to cloudy intracellular oedema of the infarcted neuroretinal layers (which are supplied by the retinal circulation to the depth of the outer plexiform layer). A patch of viable retina remains in this territory, however, supplied by a cilioretinal artery. These retinal ganglion cells are still able to generate orthograde axoplasmic flow which passes along the axon until it reaches the area of ischaemia where it becomes held up as a thin, whiter frill of axoplasm corresponding to a cotton-wool spot.
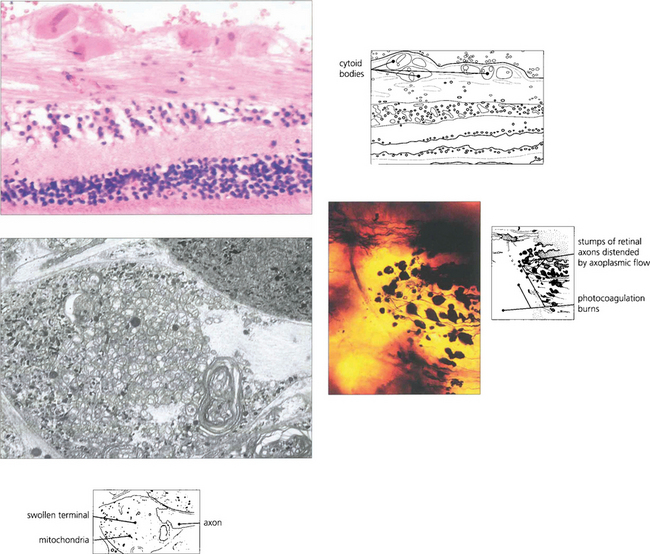
Fig. 13.29 (Top) Light microscopy of a cotton-wool spot shows the distended and disrupted axons in the nerve fibre layer. Eosinophilic inclusions are seen in the axons and resemble a cell nucleus, giving rise to the term ‘cytoid body’. The true nature of cytoid bodies as swollen axonal stumps is clearly demonstrated in silver preparations. In this case (bottom right), the axons have been damaged as they pass over an area of photocoagulated retina, and the axonal stumps swollen with axoplasm can be clearly seen. Electron microscopy (bottom left) demonstrates that these are crammed with mitochondria and degenerating membranes.
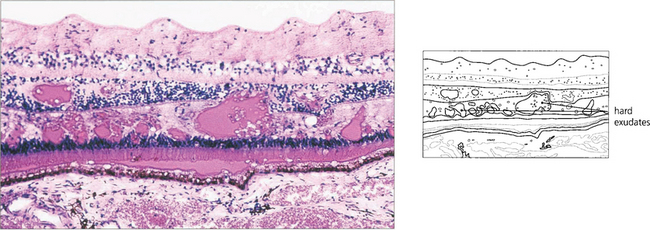
HARD EXUDATES
Choroidal neovascularization with penetration of Bruch’s membrane is frequently associated with subretinal deposition of lipid (see Ch. 16). Really gross examples of subretinal lipid deposition with serous detachment of the retina are seen with Coats’ disease and this can superficially resemble a retinoblastoma (see Ch. 15).
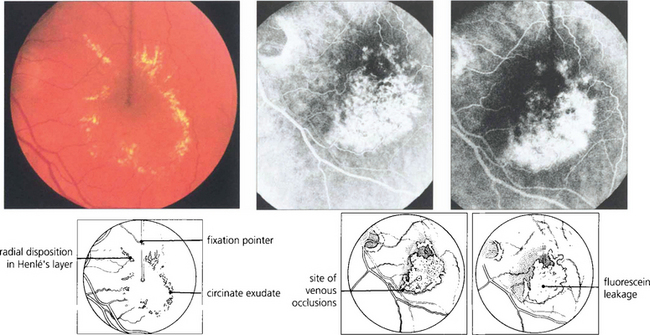
Fig. 13.30 In this patient circinate exudates are seen surrounding the macula. They have a circumscribed yellowish appearance deep to the retinal vessels. In the macular area they adopt a more linear pattern from deposition within Henlè’s layer. Fluorescein angiography demonstrates that the leakage originates from a previous macular branch vein occlusion.
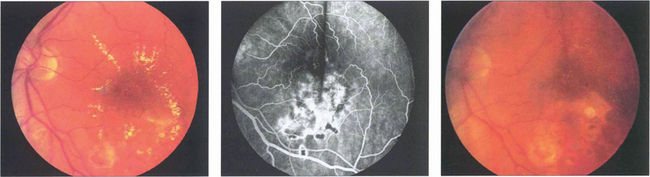
Fig. 13.31 (Left) A photograph taken 2 weeks after argon laser treatment to the leaking area of retina shows that the exudates are beginning to break up and absorb, especially inferiorly where the photocoagulation is heaviest. Occasionally following photocoagulation the amount of hard exudate may transiently increase before starting to absorb. (Middle) The angiogram demonstrates scarring of the RPE from the laser and less pronounced vascular leakage. (Right) Several months later the hard exudation has completely absorbed leaving RPE scars in the affected areas.
RETINAL HAEMORRHAGES
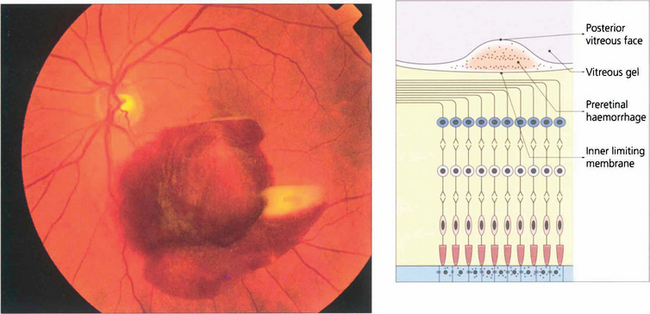
Fig. 13.34 Preretinal haemorrhages result from bleeding into the subhyaloid space between the internal limiting membrane of the retina and the posterior vitreous face. Sometimes a haemorrhage causes a localized detachment of the internal limiting membrane and then settles with gravity forming a horizontal fluid level. The preretinal location is demonstrated by masking of the retinal blood vessels. Preretinal haemorrhage is caused by bleeding from retinal tears, superficial retinal neovascularization or bleeding within the retina rupturing the internal limiting membrane. With any persistent haemorrhage the haemoglobin can absorb from the erythrocytes to leave white erythroclasts.
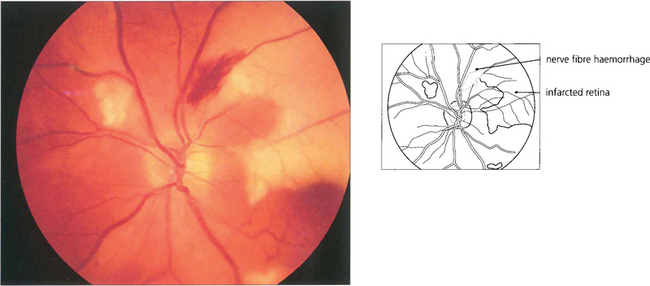
Fig. 13.36 Nerve fibre layer haemorrhages tend to be seen in the posterior pole where the nerve fibre layer is at its thickest. They have a linear, flame-shaped appearance caused by tracking along the retinal axons and usually absorb with relatively little damage. This patient also has areas of white retinal infarction from multiple emboli.
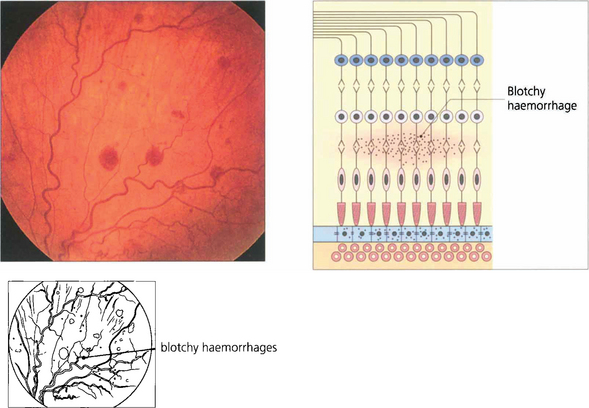
Fig. 13.37 Blotchy haemorrhages lie deeper in the retina in the plexiform or inner nuclear layers or are seen in the peripheral retina where the nerve fibres are thin. In these regions the vertical arrangement of the Müller fibres and neurones limit lateral spread.
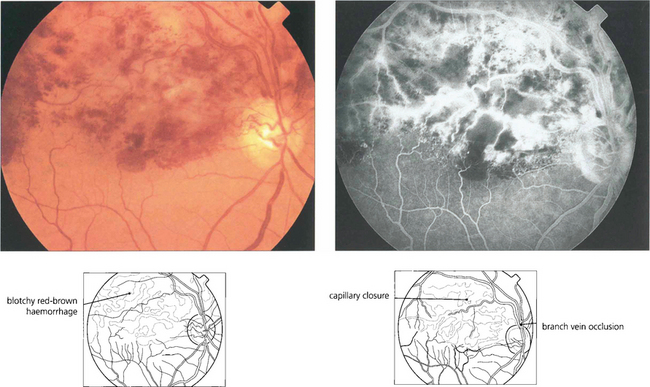
Fig. 13.38 Full-thickness retinal haemorrhage has a dark brownish, patchy appearance. This is usually a feature of venous occlusions or diabetic retinopathy and is a sign of severe retinal ischaemia with retinal capillary closure indicating a high risk of subsequent retinal neovascularization if this is extensive.
Fig. 13.39 Dark brownish patchy haemorrhages are seen with full-thickness retinal haemorrhage. This is usually a feature of venous occlusions or diabetic retinopathy and is a sign of severe retinal ischaemia with retinal capillary closure, indicating a high risk of subsequent retinal neovascularization.
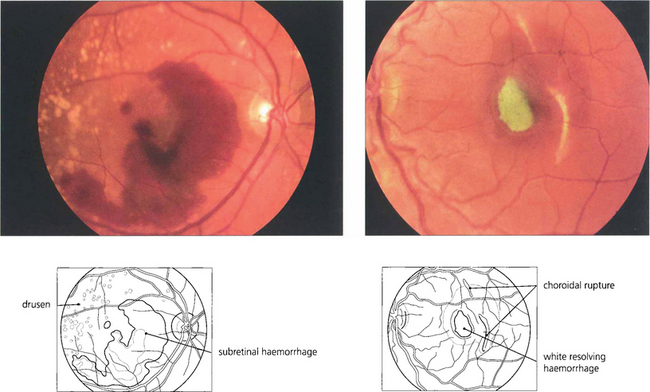
Fig. 13.40 Subretinal haemorrhage appears as a blotchy red area (left) underlying the retinal blood vessels with the retina usually elevated by the blood. In the macula these haemorrhages are frequently associated with choroidal subretinal neovascularization but, in the absence of this, can also occur with trauma or excessive Valsalva manoeuvres. The density and extent of the haemorrhage can mask an underlying neovascular membrane and, if treatment is to be considered, the patient must be observed until the haemorrhage clears sufficiently to allow visualization of angiographic subretinal fluorescence which might take 2–3 weeks or longer. (Right) A subretinal haemorrhage associated with a traumatic choroidal rupture. As the haemorrhage absorbs over a period of weeks, it can become depigmented with a whitish-yellow appearance as a result of the absorption of haemoglobin from the red blood cells leaving white erythroclasts.
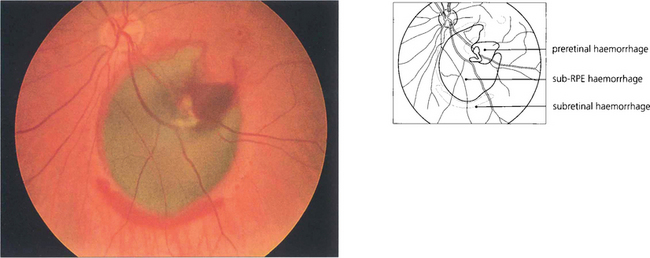
Fig. 13.41 The RPE masks the redness of subpigment epithelial haemorrhages which consequently appear dark greenish brown, as in this patient with a bleed from a macroaneurysm. The haemorrhage has burst through the RPE and retina to produce a rim of subretinal haemorrhage and some preretinal haemorrhage. Large subpigment epithelial haemorrhages can even be mistaken for a malignant melanoma.
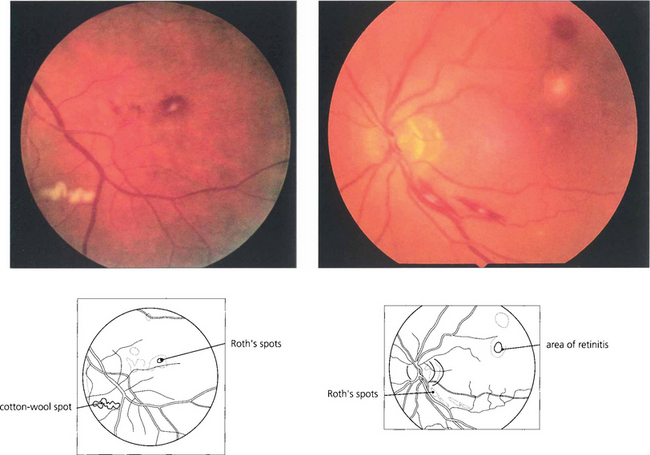
Fig. 13.42 Roth’s spots are haemorrhages with a white centre that correspond to a cotton wool spot or a collection of polymorphs. Often thought of as a manifestation of subacute bacterial endocarditis, they are a nonspecific sign tending to be seen more frequently in patients with blood dyscrasias, anaemia or metastatic endophthalmitis.
MACULAR OEDEMA
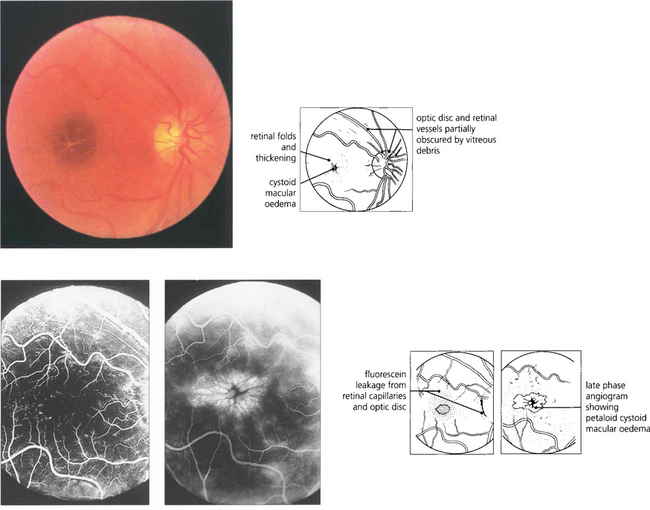
Fig. 13.43 Macular oedema is difficult to diagnose by direct ophthalmoscopy (left) and can be satisfactorily studied only with biomicroscopy and a fundus lens (see Ch. 1). It occurs either as a diffuse thickening of the retina with a dull light reflex or, in more severe cases, as cystoid oedema where cystic accumulations of fluid surround the macula in a petaloid appearance, as in this patient with posterior uveitis. Early (middle) and late (right) phases of the fluorescein angiogram demonstrate dilatation and leakage from the veins and capillaries of the retina and optic disc showing pooling of fluorescein in the extravascular tissue spaces corresponding to the cystic areas. Macular oedema is usually, but by no means always, associated with reduced visual acuity. It may persist for prolonged periods of time and with resolution can leave a relatively normal macular appearance; alternatively coalescence of the cystic spaces can form a partial thickness hole or leave central RPE atrophy.
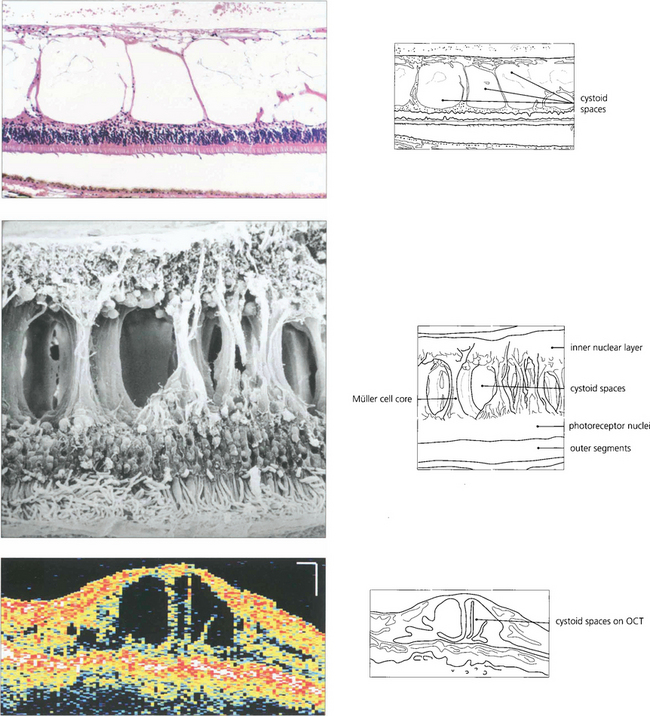
Fig. 13.44 As the neural retina has limited intercellular space, fluid can accumulate only by physical movement of cells or their components. In the outer retina oedema occurs predominantly in the nerve fibre layer of Henle but may extend between the outer limiting membrane and the outer plexiform layer. The large spaces opened up in the retina show compression of retinal elements against the fibre cores of the Müller cells; although the spaces appear to be individual cysts on angiography or histological examination they are, in fact, interconnected as a single fluid-filled space.
RETINAL PIGMENT EPITHELIAL DISTURBANCES
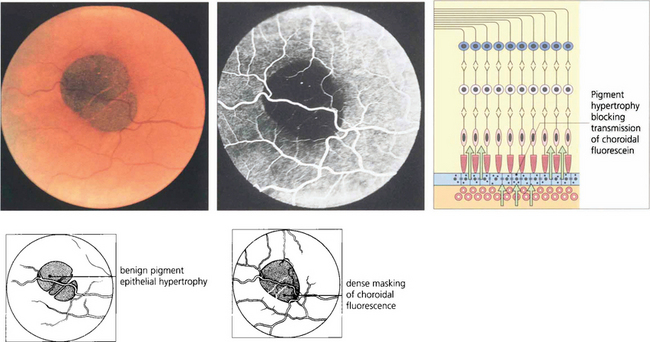
Fig. 13.45 Benign pigment epithelial hypertrophy is a common finding in Caucasian fundi and is a good example of a lesion that masks choroidal fluorescence. The flat, jet black lesion is avascular and well circumscribed. It results from hypertrophy of RPE cells which contain more and large melanosomes and is totally benign and easily distinguished from a choroidal naevus or melanoma by its flat well-circumscribed appearance. With time, the central pigmentation may atrophy leaving a depigmented centre with surrounding pigmentation.
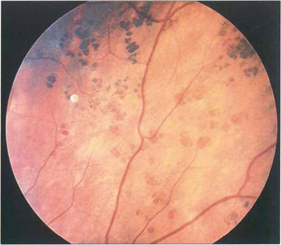
Fig. 13.46 RPE hypertrophy can take a variety of patterns collectively known as ‘grouped pigmentation’ or, more colloquially, as ‘bear tracks’ from their morphological appearance. Such patients may have Gardner’s syndrome (dominantly inherited intestinal polyposis and bony osteomas with a very high risk of adenocarcinoma of the colon).
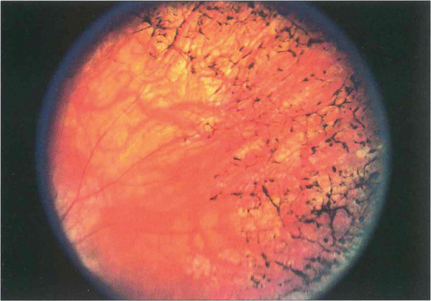
Fig. 13.47 RPE hypertrophy must be distinguished from intraretinal pigmentation, which is always pathological and is usually seen in various patterns as a sign of retinal dystrophy, degeneration or inflammation. In the late stages of retinitis pigmentosa, areas of black spidery ‘bone corpuscular’ pigmentation are characteristically seen in the retina, frequently adjacent to blood vessels. RPE cells migrate into the neural retina and colonize outside of the basement membrane of retinal capillaries. Concomitant atrophy of the RPE is always present (see Ch. 16).
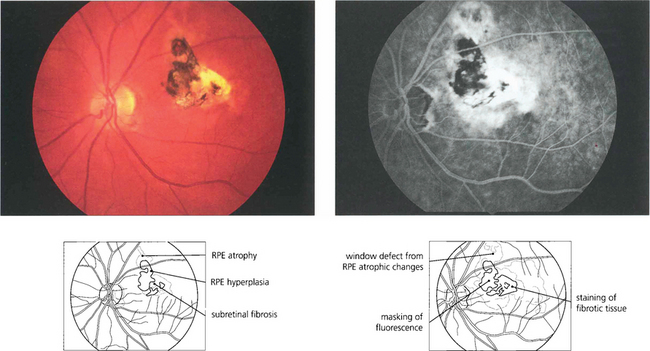
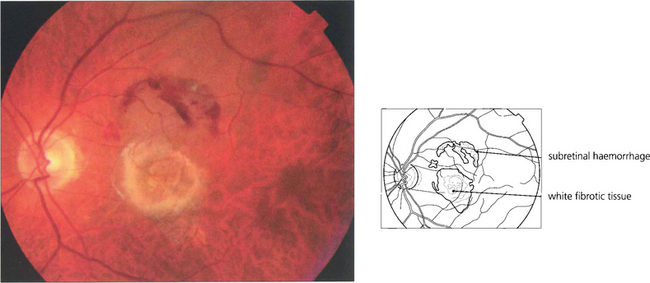
Fig. 13.48 This eye has a macular scar, probably from toxoplasmosis, with areas of retinal pigment atrophy and hyperplasia. In addition, there is white subretinal fibrosis, probably from previous subretinal neovascularization. Angiography shows the masking effect of the pigmentation and associated window defects in the atrophic area. In addition the surrounding RPE has been damaged much more widely than is apparent on ophthalmoloscopy.
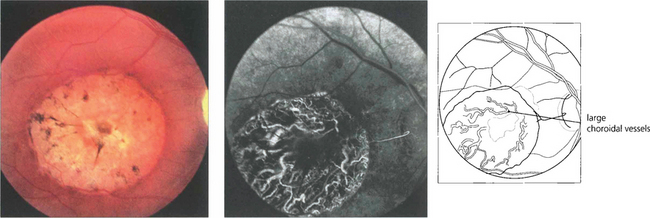
Fig. 13.49 RPE atrophy is almost invariably accompanied by loss of the choriocapillaris; extensive loss exposes the large choroidal vessels.
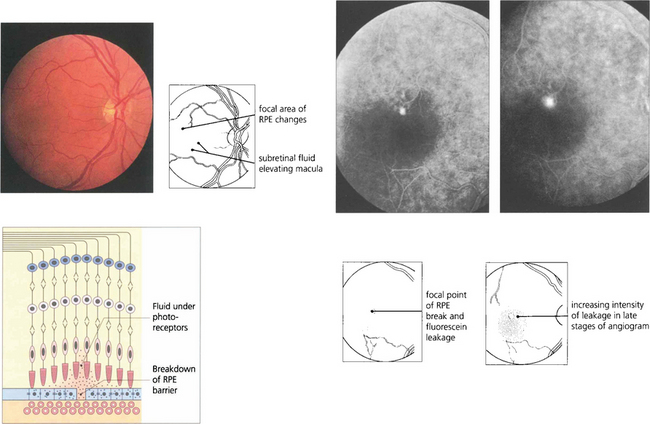
Fig. 13.50 Mechanical breakdown of the outer blood retinal barrier of the RPE is illustrated in this patient with central serous retinopathy. A blister of subretinal fluid has accumulated between the RPE and outer segments of the photoreceptors thus elevating the macula. Angiography demonstrates a focal leak in the RPE through which this fluid has been derived. Although this stains with increasing intensity as more fluorescein leaks out during angiography, it lacks the early and sharply increasing intensity of neovascular leakage.
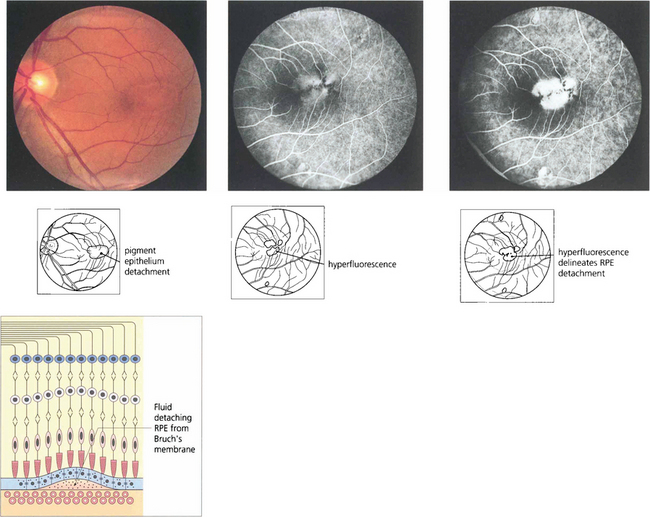
Fig. 13.51 RPE detachments are not uncommon being seen either as isolated lesions (usually in young people), as part of the spectrum of age-related macular disease (see Ch. 16) or in some types of inflammatory disease such as the Vogt–Koyanagi–Harada syndrome (see Ch. 10). They are due to the RPE separating from Bruch’s membrane. Their distinguishing angiographic feature is uniform hyperfluorescence that accumulates during dye transit to delineate the area of RPE detachment. Bright hyperfluorescence or uneveness of fluorescence suggests underlying choroidal neovascularization, which is an important diagnostic feature for prognosis and management.
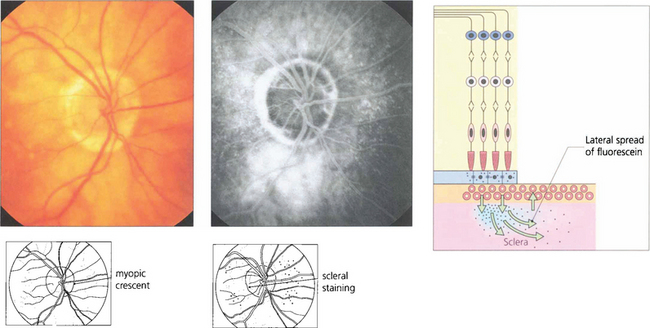
Fig. 13.52 Scleral staining is seen in the late phases of angiography around areas devoid of RPE and choriocapillaris, such as a myopic crescent, of which this patient is an example. The choriocapillaris in the healthy retina leaks fluorescein into the sclera; this slowly spreads laterally to show as a hyperfluorescent ring adjacent to the healthy retina.
THE NEOVASCULAR RESPONSE
Neovascularization is always of great importance. Initially retinal or optic disc neovascularization is usually seen as a flat area of fine superficial blood vessels. Vitreous detachment is induced at an early stage and drags the vessels forwards allowing them to proliferate on the anterior hyaloid face (forward new vessels). Within the eye all new blood vessels lack barrier properties and rapidly and intensively leak fluorescein during angiography which is a useful demonstration of their presence if their clinical recognition is in doubt. New vessels are sight-threatening because they are fragile and tend to bleed to obscure the media. They are also associated with fibrosis and membrane formation which leads to traction retinal detachment. Deposition of hard exudates does not occur with retinal or optic disc neovascularization but is a common feature of choroidal neovascularization. The management of neovascularization in retinal vein occlusions is discussed in Chapter 14, diabetes in Chapter 15 and choroidal neovascularization in Chapter 16.
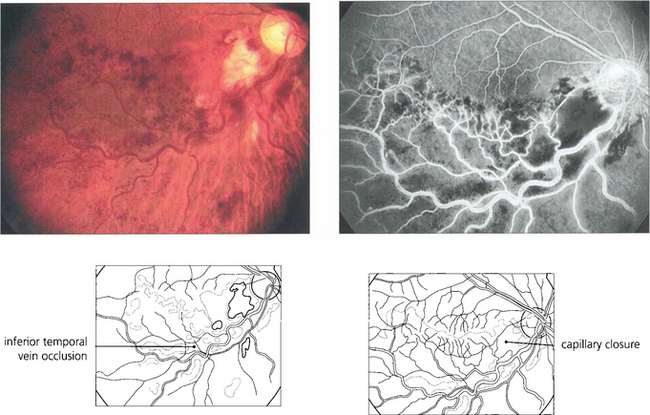
Fig. 13.53 Although iris neovascularization can occasionally occur with ocular tumours or posterior uveitis in the absence of capillary closure, retinal capillary closure is almost always seen as a precursor of retinal neovascularization no matter what the primary cause may be. In this patient with an inferior hemisphere vein occlusion, capillary closure can be inferred from the dark blotchy full-thickness retinal haemorrhages. Fluorescein angiography shows massive capillary closure in the affected area.
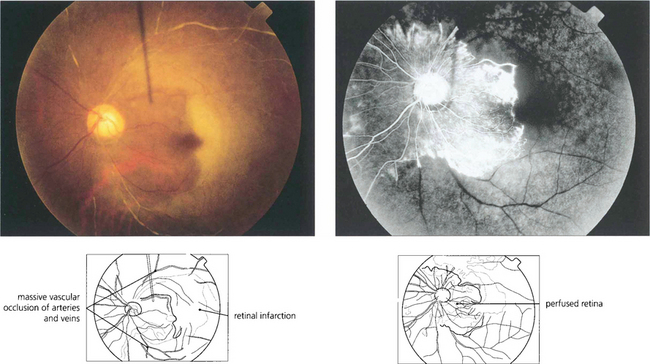
Fig. 13.54 This patient had an antiphospholipid antibody syndrome. He presented with rubeotic glaucoma in the right eye and sudden visual loss in the left. Colour photography shows arterial and venous thrombosis with retinal infarction. Angiography shows that in the left eye only a small area of peripapillary retina remains perfused. Such an eye has a grave risk of developing rapid iris as well as retinal and optic disc neovascularization.
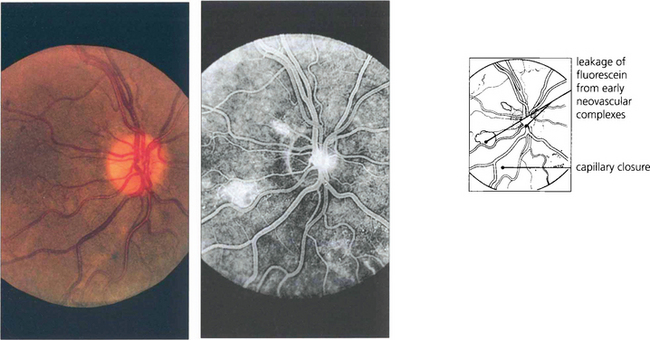
Fig. 13.55 The optic disc is particularly prone to developing neovascularization, possibly because it is itself an interface between the retinal and choroidal circulations. Neovascularization is seen as fine thready vessels that start to leak fluorescein early during angiography and stain and leak intensively as the angiogram progresses. This diabetic patient shows minute changes on the disc, recognizable only on angiography.
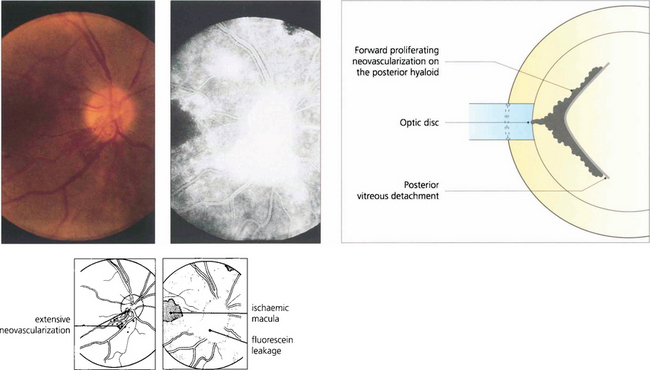
Fig. 13.56 Neovascularization on the optic disc or retina induces partial vitreous detachment. New vessels are pulled forwards and are more vulnerable to minor trauma and haemorrhaging when the gel moves and causes traction.
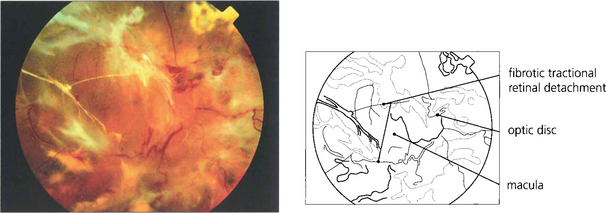
Fig. 13.57 The end-result of untreated optic disc neovascularization is visual loss from tractional retinal detachment and vitreous haemorrhage.
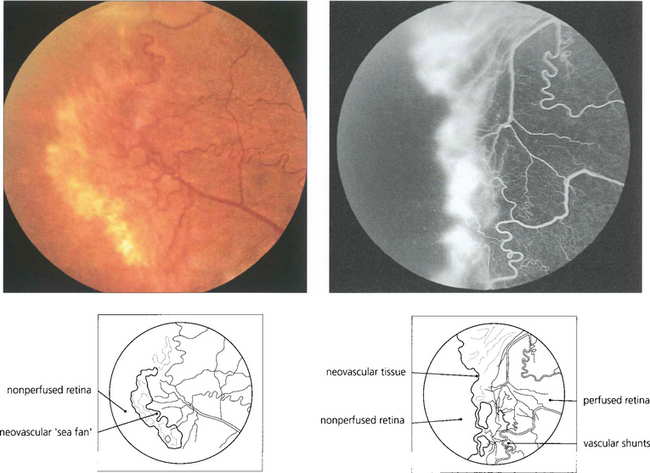
Fig. 13.58 In the retina, neovascularization is usually seen at the boundary between perfused and nonperfused retina and is well illustrated in this patient with sickle cell retinopathy. Note the vascular shunt.
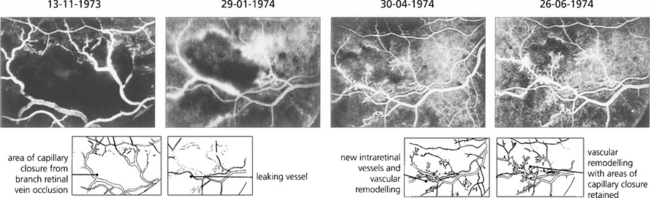
Fig. 13.59 Neovascularization can occur intraretinally, particularly in the area of venous occlusion or in areas of diabetic vascular closure. This angiographic sequence shows the development of fine, stunted, intraretinal new vessels and vascular remodelling over a period of several months following a branch retinal vein occlusion. These intraretinal new vessels, known as intraretinal microvascular anomalies (IRMAs), are a common phenomenon adjacent to areas of retinal ischaemia but they remain stunted and do not grow progressively. They do not cause any ocular morbidity or have the blinding sequelae of superficial neovascularization and can be thought of as an abortive attempt at revascularizing the ischaemic retina.
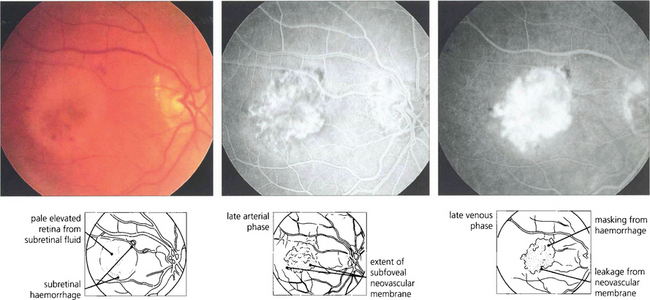
Fig. 13.60 Choroidal neovascularization is most commonly seen as part of the spectrum of age-related macular disease in which it tends to underlie the macula and destroys vision by causing haemorrhage, lipid exudation and subretinal fibrosis (see Ch. 16). Choroidal new vessels fill with the choroid during early angiography and leak over time. This leakage is much more intense and brighter than that seen, for example, with central serous retinopathy (see Fig. 13.47) or RPE detachment (see Fig. 13.48).
AGEING CHANGES IN THE RETINA
As part of the normal ageing process changes in the retina first become apparent within the RPE as a build-up of lipofuscin. This intracellular debris is thought to originate from the progressive accumulation of partially degraded membranes phagocytosed from the photoreceptor outer segments. This normal aging process extends into the spectrum of age related macula degeneration as the changes become more pronounced. Following the accumulation of lipofuscin within the pigment epithelium debris also begins to be deposited extracellularly between the basement membrane of the RPE and the inner collagenous layer of Bruch’s membrane. This material within Bruch’s membrane may be diffuse when it is described as a ‘basal laminar deposit’ or it may form localized accumulations called drusen. As drusen increase in size they project through overlying pigment epithelium towards the photoreceptor cells and further compromise the already ‘unhealthy’ photoreceptors, leading to further cell damage. In addition, Bruch’s membrane thickens with age restricting the passage of metabolites from the choroid to the photoreceptor and the voiding into the choriocapillaris of catabolites from photoreceptors degraded by the RPE. Age-related macular degeneration is a spectrum of disease in which both eyes tend to behave in a similar way, although there is considerable interocular and interpatient variation. Drusen are common in Caucasian eyes and are unusual in Blacks.
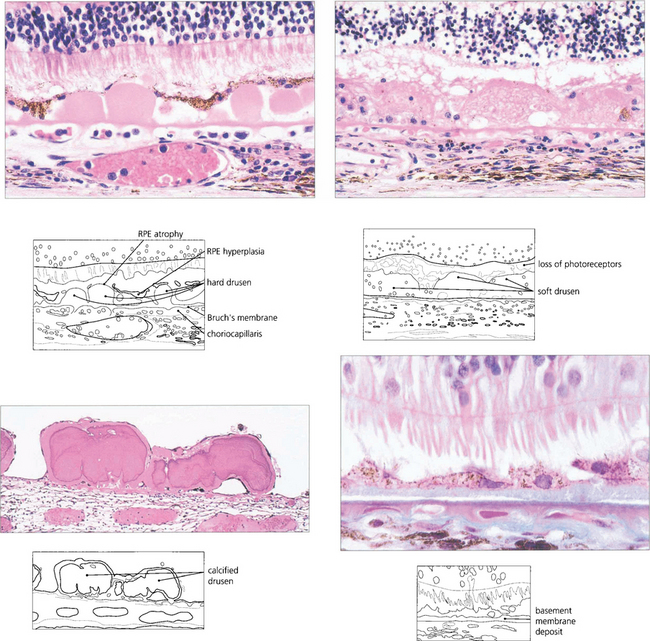
Fig. 13.62 Sub-RPE deposits. (Top left) Hard drusen lying between basement membrane of the RPE and the inner collagenous layer of Bruch’s membrane. (Top right) Soft drusen lying in a similar position; they are less homogenous and less sharply defined. (Bottom left) Calcified drusen beneath a detached retina (Bottom right) Basement membrane deposit lying between RPE cell and its basement membrane.
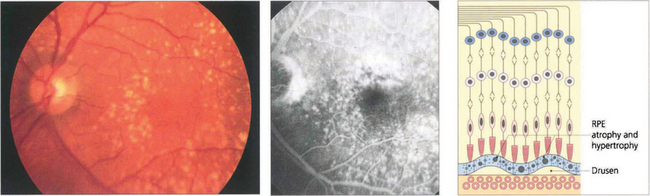
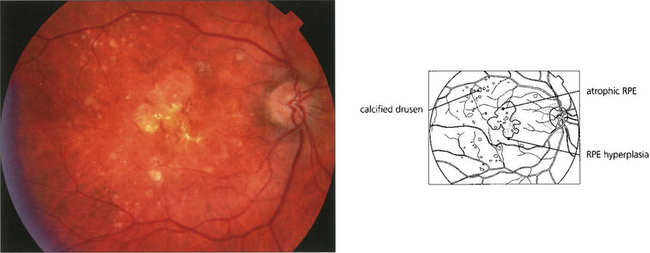
Fig. 13.63 Drusen are commonly found in the macular area, but may be found anywhere in the posterior pole. The distribution in both eyes is usually symmetrical. They are yellowish circumscribed areas of differing sizes, varying in appearance from fine granular deposits to large, juicy confluent areas or hard, glistening calcific lesions (see Ch. 16). Drusen are distinguished from hard exudates by their deeper, less defined appearance, their topographical location and bilaterality, and the absence of a concomitant retinal vascular focus of leakage. During fluorescein angiography, drusen usually take up dye, which fades towards the later phases of the angiogram. If more intense leakage occurs within a drusen, this may be a sign of early microscopic choroidal neovascularization (see Ch. 16).
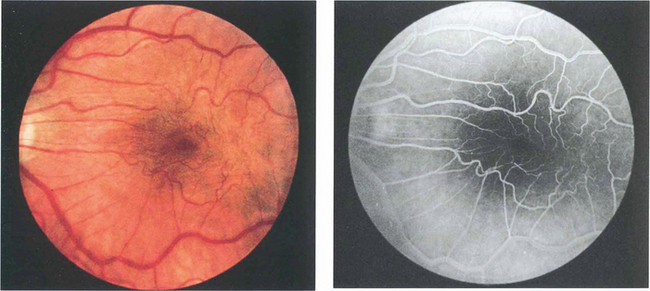
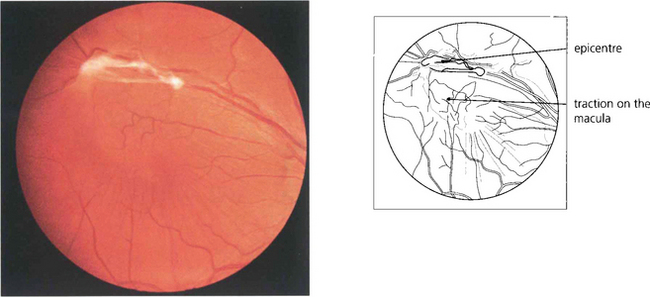
RETINAL MEMBRANES
Epiretinal membrane formation on the retinal surface at the vitreoretinal interface is associated with a wide variety of disorders such as vascular occlusive retinopathy, excessive photocoagulation or cryotherapy and posterior uveitis but many patients who present with epiretinal membranes have no other apparent ocular disease; in these cases age-related posterior vitreous detachment is the underlying cause. The common feature linking these diverse conditions is a physical disruption of the internal limiting membrane allowing glial (Müller) cells to spread from within the retina on to its surface; proliferation here leads to traction and distortion. In the idiopathic variety, patients usually present in their fifties and sixties with moderately blurred vision and metamorphopsia. Once formed, epiretinal membranes usually stabilize after about 6 months and do not progressively cause more distortion and traction. By contrast, proliferative vitreoretinopathy complicating rhegmatogenous retinal detachment forms membranes consisting of RPE, glial cells and fibroblasts that proliferate on both the anterior and posterior surfaces of the retina to form collagen and causes progressive contraction and traction. This may extend a retinal detachment or if occurring after retinal detachment surgery, cause failure of surgery (see Ch. 12).
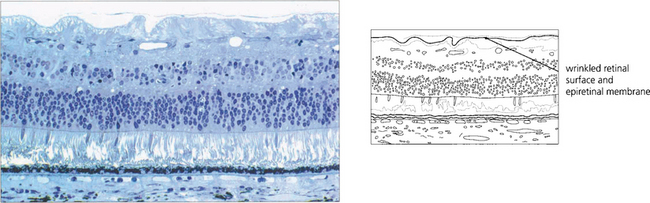
Fig. 13.65 Histological examination shows wrinkling of the retinal surface by an epiretinal membrane.
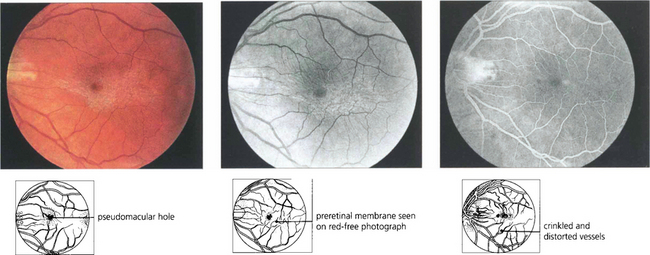
Fig. 13.66 Cellophane maculopathy is the mildest form of epiretinal membrane formation and usually presents with slight blurring of acuity and metamorphopsia. Some epiretinal membranes will simulate macular oedema or a macular hole. In this patient, a preretinal membrane lying inferior to the macula, which is clearly seen on red-free photography, mimics a pseudomacular hole. It is not unusual to find that traction and distortion of retinal vessels in the affected area cause vascular leakage and macular oedema. OCT can be very useful in distinguishing the underlying pathology.
[/level-membership-for-opthalmology-category][not-level-membership-for-opthalmology-category]
13 The Normal Retina, Retinal Imaging and the Interpretation of Pathological Changes
THE NORMAL RETINA
EMBRYOLOGY
The overall adult arrangement of retinal layers is present by 5½ months’ gestation but retinal development is not uniform. For example, although photoreceptors first differentiate at the macula, this is soon overtaken by development in other retinal areas so that at birth the macula is the only area not to be developed fully—it is not completely developed until about 3–4 months after birth, when the baby starts to fixate.
Fig. 13.1 An axial section of the eye of a 20-mm fetus (6 weeks’ gestation) shows the inner and outer layers of the optic cup; these will form the neurosensory retina and RPE respectively. The primary vitreous and hyaloid vascular system are visible, and the inner retina already shows signs of dividing into the inner and outer neuroblastic layers.
ANATOMY OF THE RETINA
Fig. 13.3 The retinal cell layers are listed on the left and the apparent layers that these cells give rise to are shown on the right.
The retinal pigment epithelium
In younger eyes the border of the RPE cell adjacent to Bruch’s membrane is extremely convoluted and many mitochondria reside within this portion of the cell. These convolutions increase the surface area of the cell membrane which is covered with specific biochemical binding sites. RPE cells actively accumulate and transport metabolites diffusing through Bruch’s membrane from the underlying choriocapillaris and actively excrete waste products to the choriocapillaris (the retinal artery circulation does not contribute to the metabolic needs of the photoreceptors). Each RPE cell services up to 45 photoreceptors held in close physiological contact by membranous extensions from the surface of the RPE, termed ‘receptor sheaths’. These sheaths extend up to 50 per cent of the height of outer segments and play a major role in metabolite exchange between the cells. The extracellular space between the photoreceptors is filled with a glycosaminoglycans ground substance called the interphotoreceptor matrix. This differs in structure and chemical composition around rods and cones. There is no anatomical bond between the RPE cell and photoreceptor so that these two layers can be easily separated pathologically (e.g. by retinal detachment). However, the cone matrix sheaths are more strongly adherent to the RPE and resistant to the cone outer segment being withdrawn; this may explain the increased resistance of the macula to retinal detachment.
Fig. 13.5 A flat preparation shows the monolayer of hexagonal RPE cells and the natural colouration of their melanin granules. Tight junctions or zonular occludens between RPE cells prevent free diffusion from the choriocapillaris into the neural retina. These junctional complexes extend around the entire circumference of each RPE cell and bind it to its neighbours. The tight junctions and the active transport mechanisms together constitute the ‘outer blood–retinal barrier’ which ensures that photoreceptor cells are exposed only to selected molecules. The line drawing illustrates the intracellular anatomy. The complex of a pigment epithelial cell and its photoreceptors is a highly metabolically active area and specific failures in the metabolic route to and from the photoreceptor produce many of the inherited retinal dystrophies.
The photoreceptor cells
Fig. 13.6 The zonular occludens junction between RPE cells can be seen here. These surround the cell ensuring that the metabolites entering and leaving the retina from the choroid must pass intracellularly.
Fig. 13.7 The structure of a photoreceptor consists of:
• An outer segment, which is the light-sensitive portion of the cell and consists of a stack of hollow coin-like discs whose membranes contain the visual pigment molecules. In each rod there are about 1000 discs that are separate from all the others and the boundary membrane of the cell. Rod outer segments can be thought of as analogous to a stack of coins in a tube. If the tube is broken and the stack disturbed individual coins will be lost. In cones the outer segments differ in that all the ‘discs’ are joined to the boundary membrane with an aperture; through this hole the discs are in contact with the extracellular space and, therefore, with each other. Consequently, it is not possible to isolate a single ‘disc’ from a cone outer segment.
• A constricted region called the cilium which resembles the structure of other cilia in that it contains a number of paired microtubules.
• An inner segment which is the manufacturing portion of the cell; in each case this is divided into two, an outer ellipsoid and an inner myoid. The ellipsoid contains mitochondria and provides energy for the transduction processes in the outer segment, and the myoid contains Golgi bodies and ribosomes for manufacture of cell components and membranes.
• An outer connecting fibre that runs from the inner segment to the nucleus. In cones this tends to be short as the nuclei are situated in the outer part of the outer nuclear layer close to the outer limiting membrane. For rods the length varies with nuclear position.
• An inner connecting fibre that runs from the nucleus to the synaptic region. In cones it is this structure that becomes elongated as the fibres run out of the foveal pit to make contact with the displaced intermediary neurones and form the fibre layer of Henlé.
• A synaptic region. In rods this is sometimes called the rod spheral and in cones the cone pedicle. In both cells the synaptic region contains vesicles and mediation of transsynaptic information is by chemical transmitters. Both cells exhibit so-called invaginated connections with components from intermediary neurones deep to their synapse surface. These invaginated synapses are called ‘triads’ because they contain three processes, usually one from a bipolar cell and two from horizontal cells. Rods have a single triad whereas cones may have up to 20.
Fig. 13.8 Electron micrograph shows the junction between the inner and outer segment of a rod. Note the cilium. Photoreceptor discs are formed by invagination of the outer segment membrane. In contrast, cone outer segments remain attached to the cell membrane over a small part of their circumference.
Fig. 13.9 Unlike neurones photoreceptor cells continually replace a major structural portion of themselves throughout life and again this process differs between rods and cones. In rods new discs are formed in the region of the cilium at the rate of about 1–5 an hour and as each new disc is formed older ones are progressively displaced towards the RPE. The oldest discs are shed from the tips of the outer segments in packets of about 30 at a time in a balanced process that does not radically alter rod length. Packets of rod discs are shed first thing in the morning or, if in periods of prolonged darkness, at the onset of light. The shed discs are phagocytosed by the RPE and, therefore, the rod outer segment is replaced entirely every 8–14 days. Less is known about cones although the evidence suggests that their discs are also renewed, however, the process is much slower than that for rods so that it takes about 9 months to 1 year for the outer segment to be replaced fully. This time course is supported by clinical observations on the recovery of cone function after retinal detachment surgery. In contrast to rods, cones shed their phagosomes at night. This circadian rhythm is one of many thought to be initiated by the effect of light absorption on the photopigment melanopsin which is located in some retinal ganglion cells.
Topographical variation in the retina
Fig. 13.11 In the foveola, the neural retina is about 170 mm thick, compared to 350 mm in the fovea. This thinning arises because the neurones of the inner retina, together with the ganglion cells, are displaced radially as the nerve fibre layer of Henlè; incident light can thus fall on the highly specialized cones without passing through a potentially light-scattering medium of neural retina and retinal capillaries.
Fig. 13.12 At the fovea the cones have a tall slender shape with a diameter of 1.5μm permitting a resolving power of 20° of arc at the nodal point of the eye.
Fig. 13.13 For the foveal cones to connect with the displaced inner retinal neurones, the inner connecting fibres of the cones become very elongated and collectively form the fibre layer of Henlé. Macular xanthophil pigment is located in this layer and absorbs blue light, which is potentially harmful to the photoreceptors. Pathological oedema and exudation readily accumulate here because the inner connecting fibres are not held tightly together. This is seen clinically as the radially oriented cystoid spaces of macular oedema or as a macular star with lipid exudation.
Fig. 13.14 (Left) At post-mortem examination, the macula has a yellowish colour from the xanthophil pigment (hence the name macula lutea). This pigment has a role in protecting the photoreceptors from short wavelength blue light which has the ability to produce cellular damage as a result of the generation of free radicals. (Right) Histological examination shows the pigment in Henlés layer.
Left image from Miller D (ed.) Clinical Light Damage to the Eye. New York: Springer, 1987.
Fig. 13.15 In the posterior pole the ganglion cell layer is several cells thick. Towards the periphery the retina becomes thinner and the ganglion cell layer less dense. In the elderly the peripheral retina adjacent to the ora serrata may show cystic spaces within the attenuated neural retina. At the ora serrata the inner retinal layers are lost and the photoreceptors become shorter and fewer until finally the retina is lost to fuse with the nonpigmented monolayer of the pars plana which runs forwards over the ciliary processes (see also Ch. 9).
Retinal blood vessels
The central retinal artery supplies all the cells of the neural retina with the exception of the photoreceptors which receive their metabolic supply from the choroid by active transport through the RPE (see Ch. 9
[/not-level-membership-for-opthalmology-category]
