4 The lumbar spine
Introduction
Low back pain is one of the most common presenting complaints to any primary healthcare physician. With the wide variety of structures capable of generating pain and the common inclusion of pathological conditions in the differential diagnosis, it is important for the clinician to be able to reach specific and accurate conclusions as to the precise nature of their patient’s complaint.1 This involves a detailed clinical history, physical examination and appropriate diagnostic imaging.2,3 Magnetic resonance (MR) imaging plays a crucial role in determining the cause of the clinical picture when used in the appropriate clinical context.4
MR imaging is an invaluable tool for the clinician assessing the lumbar spine. Although previously radiographs were always the mainstay for imaging diagnosis of disorders arising from the low back (and, in some countries, this still holds true), it is now generally accepted that cross-sectional imaging, in particular MR imaging, is the perfect tool to assess the potential pain-generating structures of this region.5,6 MR imaging now has the added benefit of being able to be performed in different positions; therefore, if the patient experiences pain only in a particular position, this posture can be recreated within the MR scanner, in order to better identify the origin of the symptoms. This determination is clearly an important factor in the subsequent management of the patient. Positional and upright MR imaging are not widely available at the time of writing, but the benefits are such that the utilization is likely to increase in the near future.7–9
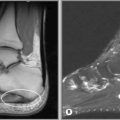
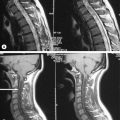
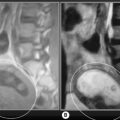
MR imaging’s role in assessment of the lumbar spine is well established. In most clinical situations, it is preferred over computed tomography (CT) and myelography, although the former can still be used in conjunction with MR imaging to more fully assess the multiple components of severe trauma.10 MR imaging has been shown to be superior to both these modalities in the evaluation of degenerative disc conditions, infections, spinal neoplasms and other intrinsic cord diseases; it allows visualization of both components of the intervertebral disc and direct imaging of the bone marrow.11–15 Computed tomography may show an advantage over MRI for the evaluation of postoperative stenosis due to arthrosis, particularly in the case of an instrumented spine, where the artifact produced by the implant affects MR images to a greater extent than CT; however, CT does not allow for distinction between postsurgical fibrosis and scarring and a recurrent disc lesion, even with the use of intrathecal contrast agents (Figure 4.01), a particularly challenging and important clinical determination to make because of the differing management options available.10,16
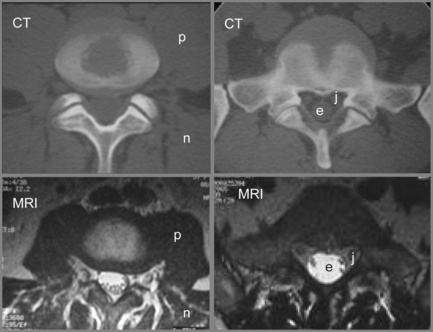
Figure 4.01 • Comparison of structures visualized on a non-contrast computed tomography CT (bone window) axial image [upper images] and MR axial T2-weighted image [lower images] at the lumbosacral junction. The contents of the central canal (filum terminale) are well visualized on the T2-weighted images as well as the relationship between the neural structures and the surrounding borders, which may be involved in neural compromise. MR imaging also allows for closer evaluation of the paraspinal soft tissue including the musculature. The key to the legend is detailed in Box 4.01.
History and examination
Low back pain is one of the most common complaints presenting to the offices of any primary care physician – and one of the most poorly understood and badly managed. Part of the problem is that the condition is frequently treated as a disease in itself rather than a symptom that can emanate from dozens of different causes. Family doctors frequently fail to differentiate these causes beyond a basic elimination of ‘red flag’ pathologies; their argument is that such differentiation is not necessary as any musculoskeletal problem will be treated in the same way: non-steroidal anti-inflammatories and analgesia. There is also a belief that back pain is a self-limiting condition that will spontaneously resolve within 6 weeks.17,18
Unfortunately, the evidence shows that this treatment regimen does little other than to moderately alleviate symptoms in the short term and, rather than self-resolve, many patients simply stop attending their family practice owing to the lack of effective treatment; this, however, is interpreted as evidence of resolution by the treating physician. Current guidelines emphasize early return to normal activities, acupuncture and spinal manipulative therapy, preferably followed by individually tailored prescriptive exercise.19,20
again often linked to lumbosacral dysfunction; any acute back pain will cause muscle guarding and spasm that can, in their own right, contribute to and perpetuate the condition.
Differential diagnosis
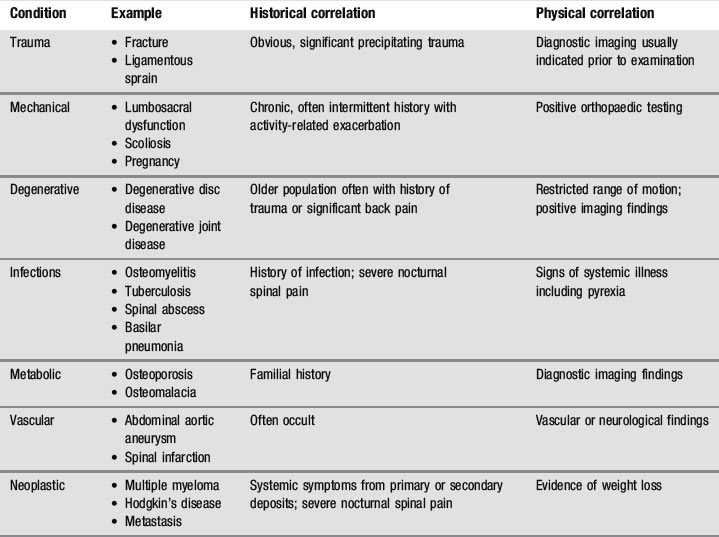
Of the many causes of low back pain, sacroiliac joint syndrome and facet joint syndrome are perhaps the most commonly presenting conditions, contributing to approximately 50% of cases. The accurate diagnosis of these entities, which are best identified by orthopaedic testing and by response to conservative care, either manipulation or injection, is complicated by comorbidity: 30% of low back patients have more than one anatomical source of pain.21 MR imaging is, however, considered the gold standard for several other common low back disorders, including disc lesions and central canal stenosis.22,23
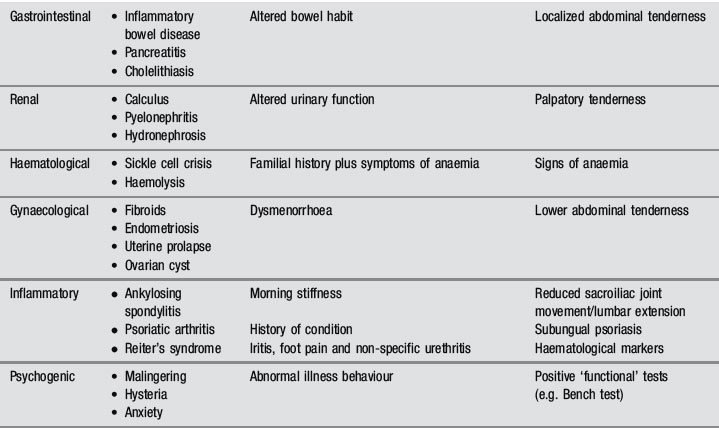
The common differential diagnoses for the lumbar spine are detailed in Table 4.01.24,25
Clinical indications for diagnostic imaging
The symptoms and presentations associated with back pain that are indications for spine imaging are detailed in Box 4.02.21,26 It is important that the clinician orders MR imaging only with valid clinical suspicion and appropriate history and examination findings because, without these, the results of the study may be misleading; in the early years of MR imaging, there were frequent examples of inappropriate back surgery, with its attendant risks and complications, on disc bulges that were not only asymptomatic but simply failed to correlate to the radicular level of the patient’s complaint.
Contraindications
Whilst MR imaging is generally considered safe, the procedure does have a few cautions and contraindications. The following situations are common but do not comprise an inclusive list and should merely serve as a guide for patient screening and consideration. Before undergoing an MR imaging examination, the facility performing the procedure should screen the patient, but it is important that referring doctors are familiar with common contraindications and cautions to better inform the patient and avoid referring inappropriately.27
Caution needs to be taken when referring patients experiencing claustrophobia, anxiety or panic attacks for MR imaging examination. It is important that the process is thoroughly explained to the patient in order to decrease stress and anxiety prior to the procedure. Also, there are several options offered to these patients to minimize the discomfort. Sedatives, open tube architecture, headphones and prisms that allow the patient to see outside the unit all may help to calm these individuals and allow the acquisition of higher-quality images. The first trimester of pregnancy also requires caution with regard to MR imaging.27 The necessity for the imaging procedure should be made on an individual clinical basis if:
It is important that the patient is aware of the benefits and risks of the examination and any alternatives if applicable.27
Absolute contraindications to MR imaging generally involve implants or foreign bodies. The most important concern is whether or not the object is ferromagnetic; objects with ferromagnetic properties need to be assessed for size, shape and anatomical location. The magnetic field strength of the unit also needs to be considered. Common foreign bodies that represent contraindications to MR imaging are detailed in Box 4.03.
Most surgical clips or orthopaedic devices will not contraindicate MR imaging. Electrically, magnetically or mechanically activated devices that cannot be removed during an examination represent another category of contraindications to MR examination and are also included in Box 4.03.
Contrast
Total incidence of adverse reactions for all types of MR contrast ranges from 2% to 4%. Gadolinium is safer than the iodinated contrast utilized in plain film and CT imaging, with fewer side effects.28–30 When side effects do occur, the most common reactions are nausea, emesis, hives, headaches and local injection site symptoms.29,31 Adverse events following gadolinium injection are more common in patients who have had previous reactions to MR imaging or iodinated contrast; therefore, it is necessary to inquire about past reactions and take these into account before requesting studies with contrast. MR contrast agents have been shown to cross the placenta and are therefore not routinely given to pregnant patients, who should only receive contrast medium if the potential benefits outweigh the risk to the fetus; this should be determined by the attending radiologist.27
The traditional recommendation for breastfeeding is a 24-hour suspension following gadolinium injection; however, it has now been shown that less than 0.04% of the administered dose is absorbed by the nursing infant (100 times less than the permitted intravenous dose for infants) and the length of the suspension needs to be reviewed based on the potential risks against the stress that may be placed on a nursing infant due to the suspension.32
An additional, though rare, reaction to gadolinium contrast has also now been recognized: nephrogenic fibrosis. This tends to occur in those patients with kidney failure or where a patient has a dramatically lowered glomerular filtration rate; therefore, if gadolinium is to be used, the patient’s renal status must be assessed. Where clinical suspicion exists, the glomerular filtration rate must be evaluated prior to the imaging study, and, if lowered, gadolinium cannot be used – nephrogenic fibrosis is an irreversible condition that is both debilitating and extremely severe.29,33
Techniques and protocols
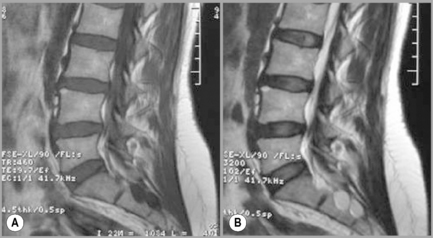
The most common sequences used for imaging the lumbar spine are T1-weighted and T2-weighted; fat suppression techniques are added on occasion. T2-weighted sequences will highlight fluid and, to some extent, fatty tissues as well (Figure 4.02). Sequence combinations are determined by the clinical question being addressed; in most centres, routine orders include T1-weighted and T2-weighted sagittal and continuous axial images from L1 to S1. Slice thickness usually varies from 3 to 4 mm with a 0.5–1.0 mm gap.10,34
When evaluating degenerative disc conditions or patients with radiculopathy, contiguous axial slices through the plane of the disc are obtained in addition to the regular continuous axial images (Figure 4.03). Axial, T1-weighted slices will nicely demonstrate the outline of the intraspinal fat against disc material, bone and nerves. On the T2-weighted sequences, the cerebrospinal fluid (CSF) will act as a contrast agent (the myelographic effect) and allow for good distinction between the disc and adjacent structures (Figure 4.04).
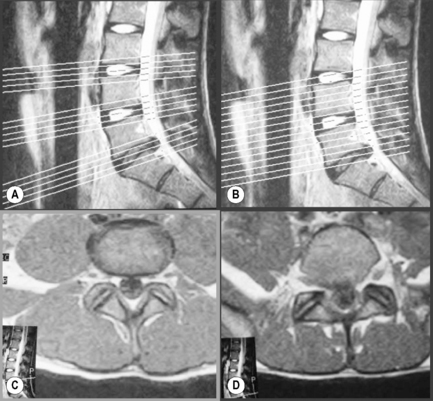
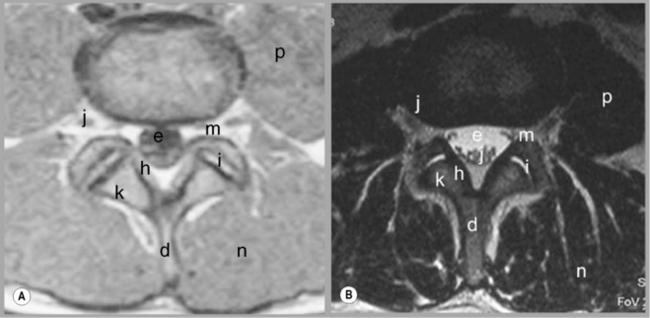
Figure 4.04 • MR imaging of the lumbar spine in the axial plane using T1-weighted (A) and T2 -weighted (B) sequences. The key to the identification of structures is given in Box 4.01; note the different structures that appear with different signal on each type of imaging sequence.
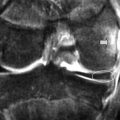
The sagittal sequences are also useful in assessing the status of both discal and ligamentous structures. Parasagittal slices depict the intervertebral foramen and the position of the dorsal root ganglion (Figures 4.05, 4.06). Locating levels on a sagittal slice can be difficult; rudimentary disc spaces and transitional lumbosacral segments are fairly common, making a precise count effectively impossible in certain circumstances. Although identification of the twelfth rib can help to suggest the levels distally, even this is prone to error since transitional lumbosacral anomalies are commonly associated with thoracolumbar abnormalities such as lumbar ribs; or hypoplasticity or agenesis of the twelfth rib.35 Correlation with plain film radiography can be helpful in this regard, along with identification of the conus medullaris and right renal artery, both usually located at the level of L1 or L2. On the axial images, assessment of the orientation of the lumbosacral facet can be used to clarify the findings. Lumbar facets are oriented in the sagittal plane from L1 to L5. The articular facets at L5/S1 are often in the coronal plane. In cases where a count is still uncertain but necessary, a single cervicothoracic sagittal scout can be obtained.30
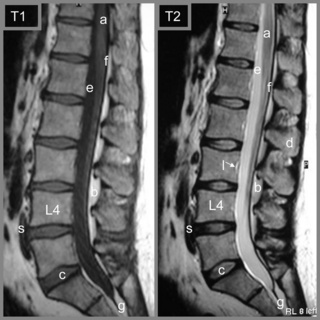
Figure 4.05 • MR imaging of the lumbar spine showing T1- and T2-weighted, mid-sagittal slices, demonstrating the osseous and soft tissue anatomy visible. The key to the identification of structures is given in Box 4.01.
Figure 4.06 • T1-weighted parasagittal MR imaging of the lumbar spine at the level of the pedicles. The key to the identification of structures is given in Box 4.01.
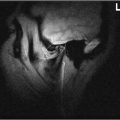
Coronal images are not routinely used in evaluation of the lumbar spine except as ‘scouts’ and in scoliotic patients. Severe curvatures can prevent full visualization of all intraspinal structures in all three planes; the scout can allow data to be acquired in an oblique plane, making interpretation simpler (Figure 4.07).
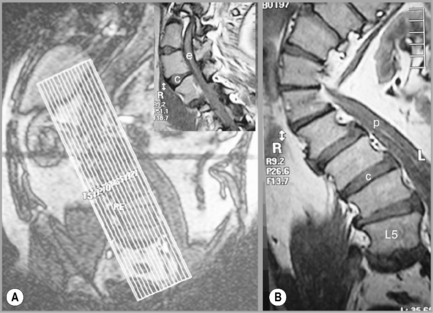
Figure 4.07 • MR imaging of the lumbar spine in a patient with a severe scoliosis. By taking a coronal plan scan (A), it was possible to modify the T1-weighted sagittal images to compensate for the curve, avoid volume averaging and to prevent the area of anatomical and clinical interest falling outside the plane of imaging (B and insert). The key to the identification of structures is given in Box 4.01.
Following disc operations, gadolinium is used to differentiate between postsurgical scar tissue and recurrent herniation. Scar tissue is vascularized and will enhance with contrast injection, whilst disc material is avascular and will generally not enhance.36
When enhancement occurs in a disc fragment, it will typically be present around the periphery (rim enhancement) and corresponds to diffusion of the contrast medium from the adjacent tissues. The rate of diffusion into a fragment is much slower, allowing for distinction between the scar and fragment. Because of this, it is necessary to perform T1-weighted axial sequence imaging immediately after contrast injection.30
In the case of intraspinal tumours, contrast is utilized for the early detection, characterization, localization and extent evaluation of the lesion10,30; gadolinium is the modality of choice when investigating primary tumours of the central nervous system.37–39 When basic MR imaging of an infection is ambiguous, contrast will be used to demonstrate the extent and activity of the lesion and to inform treatment options.40
Normal imaging anatomy and common variants
Vertebrae
The vertebral bodies have a high marrow content, which is demonstrated as high signal on T1-weighted images and intermediate to low signal on T2-weighted images. The signal may be slightly non-homogeneous because of the variable amount of fibrous material interlaced within the marrow component. Marrow signal will also vary depending on the age and health status of the patient.41,42 Before the age of 25, cancellous bone is primarily composed of red marrow; with advancing age, the fatty fraction of marrow will become more important than the red components, leading to an increase in the T1-weighted signal. Any disease leading to an increase in demand of haematopoietic cells (marrow reconversion) will present with signal alterations in the vertebral bodies (increase in T2-weighted signal, decrease in T1-weighted signal).30 The articular cartilage, cortical bone and endplates are low signal intensity on both T1-weighted and T2-weighted images. Additional gradient echo sequences will show articular cartilage as intermediate signal intensity, allowing differentiation from the hypointense cortical bone.43
Spinal ligaments
Normal ligaments generally appear as low signal intensity structures on all sequences; however, there is one exception of note: the ligamentum flavum contains a higher percentage of elastin fibres and will, therefore, appear as an intermediate signal structure on both T1-weighted and T2-weighted sequences.44
Spinal canal
The facet joints and capsules, pedicles and discs outline the borders of the spinal canal together with internal ligamentous structures. Hypertrophy of any of these structures can cause impingement on the contents of the canal: the meninges, cerebrospinal fluid, spinal cord, nerve roots, epidural fat and associated vascular network. All of these elements are best visualized on axial, T1-weighted sequences. The cerebrospinal fluid should surround the nerve roots and spinal cord down to the filum terminale. Axial images also allow for evaluation of the shape of the vertebral canal, lateral recess and intervertebral foramina; the normal canal shape is triangular (Figure 4.04).
Intervertebral disc
The intervertebral disc comprises three components: the annulus fibrosus, nucleus pulposus, and cartilaginous vertebral endplate. Under normal circumstances, only the outer third of the annulus fibrosus has a sensory innervation.45
The cartilaginous endplate represents the interface between the nucleus, the inner layers of the annulus and the bony vertebral body. Nutrients diffuse from the blood vessels of the vertebral body, through the vertebral endplate, and into the nucleus and inner annulus. This relationship allows for disc nutrition; however, when the endplate becomes compromised, most commonly by injury, a sequence of biochemical events begins that may lead to internal disc disruption, which is considered to be the most common painful disc abnormality.46,47
The nucleus pulposus consists of 70%– 90% water, while the nuclear tissues consist largely of proteoglycans (65% of dry weight) and type II collagen (15%–20% of dry weight). The remaining tissues are elastic fibres and non-collagenous proteins. The nucleus is normally cohesive and imbibes water due to the negatively charged proteoglycans, which allows it to absorb and disperse compressive loads.26,45 In the experimental setting, it has been determined that substantial compressive loads do not damage the nucleus; instead, compression may damage the trabecular bone of the adjacent vertebral bodies or the cartilaginous endplates, now recognized as the weak point of the intervertebral disc.1,27
The annular (or external) component is formed by fibrocartilage and collagen fibres and will therefore display a hypointense signal on most sequences, making it difficult to differentiate from the endplate and articular cartilage. The central nucleus is comprised of water and proteinaceous material, which appears as high signal on T2-weighted images. The ideal disc will demonstrate a signal that is isointense to muscle and hypointense to marrow on T1-weighted images. By contrast, the T2-weighted signal should be hyperintense except for the outer annulus. Often, a horizontal band of decreased signal is present on T2-weighted images in the central area of the disc. The aetiology of this phenomenon is unclear; however, it is not considered pathological beyond the age of 40 years.48
The ideal disc should also not extend beyond the adjacent vertebral body margins, particularly on the axial planes. There is some ‘manoeuvrability’ or ‘wiggle’ room whereby the disc contour on the axial slices can extend slightly beyond the borders of the endplates by up to 2 mm; anything more than this is considered to constitute a disc lesion and, depending on the morphology of the disc in the axial and sagittal plane, particular nomenclature will be applied to indicate the type of disc lesion.49–51 This is dealt with in more detail later in the chapter.
Spinal cord
The spinal cord and nerve roots will show intermediate T1-weighted and low T2-weighted signal intensity. These structures are best differentiated on T2-weighted sequences, when surrounded by CSF, which will image as hyperintense or bright (Figure 4.08).30 In the normal adult patient, the spinal cord terminates as the conus medullaris, usually situated at the L1–L2 level. This is important to evaluate, as a low-lying cord may be part of a more clinically significant problem such as tethered cord syndrome.
Pathological imaging
Disc disease
Endplate damage, due to either macro- or micro-trauma, is thought to disrupt the normal homeostasis of the nucleus pulposus. Blood and cellular substances reach the nucleus via the endplate; if this is disrupted, its sets into motion a series of events that leads to the nuclear degradation.26 Enzymes that degrade the connective tissue, referred to as matrix metalloproteinases (MMPs), are normally present in the healthy nucleus; however, they are dormant. Damage to the endplate leads to the disinhibition of MMPs, which then begin to degrade nuclear proteoglycans and collagen. This degradative process increases the fluidity of the nucleus, reducing its cohesion and ability to resist compression.53,54 A plain film radiograph may reveal a reduction in disc height and spondylophytes; however, these changes need not be symptomatic.27,55
The degenerative process that began in the nucleus may extend into the non-innervated inner layers of the annulus fibrosus. As the MMPs degrade the collagen fibres of the annulus, a radial fissure may begin, which can ultimately extend to the outer annulus. A normal, cohesive nucleus will be unaffected by such a fissure; however, a degraded nucleus can track through radial fissures and delaminated circumferential fibres, which can be visualized on a discogram. Only when the outer annulus becomes sufficiently damaged will the degraded nucleus move into the epidural space. In short, disc lesions occur due to pathological processes beginning with the nucleus and then extending to the periphery of the annulus.27
Disc abnormalities have generated controversy amongst radiologists and clinicians for decades. Confusion about the nature of disc pathology was highlighted as early as 1934, when Mixter and Barr published their landmark report of surgery on a ‘ruptured’ disc,56 which ushered in the ‘dynasty of the disc’.49,57 At this time, ‘herniated’ discs were thought to be benign cartilaginous tumours and were called ‘chondromas’ or ‘enchondromas’; since then, defining the nature of disc pathology has been a challenging goal and it was only in 2001 that a consensus paper was finally published.50,58,59
It is important to keep in mind that many disc abnormalities are not necessarily associated with pain generation. In the majority of cases, the disc herniation can be subclassified as either a disc protrusion or a disc extrusion, the latter being more clinically significant in general, although both are able to contribute to clinical symptomatology, depending on the size of the spinal canal, and their relationship to the nerve roots.10
Small tears within the annulus fibrosus can be visualized on T2-weighted sequences as focal hyperintensity areas in the outer annular fibres. For this reason, they are referred to as high intensity zones or ‘HIZes’. The signal is increased due to the presence of granulation tissue and oedema (Figure 4.09); HIZes are associated with painful annular disruption.60,61
Comparison of MR imaging in the supine and upright position shows that the appearance of the HIZ can change; in the standing posture, the HIZ will become more vertically orientated, whereas in the same patient in the supine position, the same HIZ will appear more horizontal. Other interesting observations have been made with the use of upright MR imaging: in the upright position, the central canal size can change, and the surface area of the dural sac has also been seen to alter. Between flexion and extension of the lumbar spine, changes are noted in the contour of the disc, as well as of the contents of the spinal canal and subarticular recess; foramen and extraforaminal region – all of which may play a role in the explanation of the patient’s clinical syndrome.9,62
Disc bulges are defined as an extension of disc material from the vertebral margin of more than 2 mm; classically, they are circumferential and not commonly associated with pain.48,58,59
A general disc bulge may, however, be seen in conjunction with a more focal disc lesion, and the combination may certainly contribute to the patient’s clinical syndrome. A common radiological finding is that of degenerative disc disease with a generalized disc bulge causing a reduction in the subarticular foraminal or extraforaminal region in combination with a more focal disc lesion; hypertrophy of the synovial facet joint or ligamentum flavum or even the development of a synovial cyst, which then contribute further to impingement of the exiting nerve root or, if extraforaminal, the dorsal root ganglion.10,30
Disc protrusions may be broad or focal. A disc protrusion is defined as being present when disc material extends from the vertebral body margin but does not pass the superior or inferior margin of the parent disc and does not extend beneath the posterior longitudinal ligament.10,11 Functionally, this means that the width of the lesion is larger than the height; this is best assessed on the sagittal slices. Disc protrusions are not commonly directly associated with pain generation; however, if there is a congenitally narrow spinal canal or foramen, or if the patient has compounding factors such as degenerative changes to the joint capsule, then it is possible that a simple disc protrusion may cause an impingement on the traversing or exiting nerve root, thus giving rise to a clinical syndrome.48,59
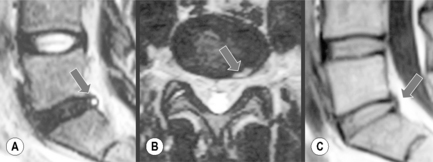
A disc extrusion occurs when disc material extends past the margin of the vertebral body, meaning that the anterior-to-posterior diameter will be larger than the medial-to-lateral dimension. There will be continuity in all sections of the disc. Extrusions may extend in any direction but are more commonly seen in the lateral recess in the posterolateral aspect of the spinal canal and are commonly found in symptomatic patients (Figure 4.10).48,59
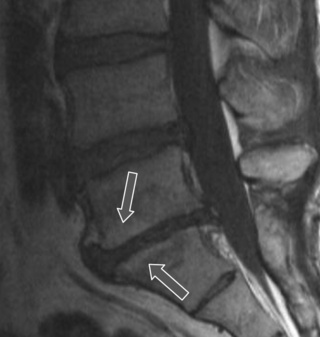
If the herniated disc material lacks continuity or a separate fragment is found, the lesion is defined as a sequestrated disc or free fragment. Epidural inflammation often accompanies sequestration and is thought to complicate the epidural mass effect. A posteriorly displaced free fragment is of particular importance, presenting with a bizarre range of clinical symptoms that traditionally has been treated surgically; however, it now appears that spinal manipulation has a better outcome at 1-year follow-up with regard to both pain and functionality.48,59
Vertebral body changes
Compression fractures, skeletal tumours and infiltrative processes can all alter the signal of the vertebral body. Compression fractures can present as an altered vertebral body shape and also as decreased T1-weighted and T2-weighted signal intensity adjacent to the area of compression.10,63 Neoplastic activity typically shows decreased T1-weighted and increased T2-weighted signal, typical of most pathological processes and consistent with marrow replacement by oedema or abnormal cells, or with subchondral marrow changes associated with degenerative disc disease, the so-called Modic changes (Figure 4.11). Multiple levels of signal changes raise the suspicion for an infiltrative disease such as osteolytic metastasis or multiple myeloma. Decreased T1-weighted and T2-weighted signal intensity is consistent with sclerotic processes such as osteoblastic metastasis or bone islands.43,64
More common causes of altered signal intensity in the vertebral bodies are haemangiomas and fat islands. Both are well visualized on MR imaging even when radiographs are normal. Haemangiomas will usually be hyperintense on both T1-weighted and T2-weighted images (Figure 4.12). Focal fat islands or deposits in the marrow will display high intensity on T1-weighted and virtually disappear on T2-weighted and fat-suppressed techniques.10,30,65
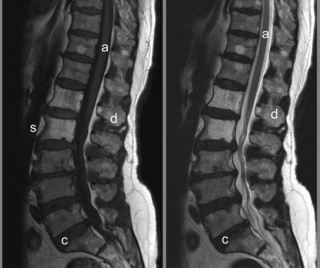
Figure 4.12 • Mid-sagittal T1- and T2-weighted MR images of the lumbar spine in a patient with multiple haemangiomas. Abnormal signal intensity is seen in the vertebral bodies, with increased signal intensity noted on both the T1- and T2-weighted images. The alteration in signal intensity is especially dramatic when compared to the normal bone marrow signal intensity demonstrated in Figure 4.02.
Early in the process of these Modic changes, inflammation and granulomatous tissue lead to a decrease in the T1-weighted signal intensity and an increase in the T2 signal intensity; this defines a Modic type 1 change.66 Traditionally, this type of change has not been associated with the painful symptoms; however, there now appears to be a closer correlation between pain and this type of Modic change than in the other two types.67,68
As the disease progresses, focal fatty marrow conversion may occur and the endplate will demonstrate increased T1-weighted signal intensity; this represents Modic type 2 change. The T2-weighted signal may stay the same or increase, depending on the degree of change; during the early phase, there is still the remnant of the Modic type 1 change, where a high signal was noted on T2-weighting. As the Modic type 2 changes progress, the signal on T2-weighting will become isointense to the normal endplate signal (Figure 4.11).66
Sclerosis parallel to the endplate will be demonstrated by decreased signal intensity on both T1- and T2-weighted sequences and is referred to as Modic type 3 change.66 It should be appreciated that Modic changes do not necessarily progress from type 1 to type 3, and may in fact regress with time.
Osteophytes (or spondylophytes) are a very common occurrence and are caused by disc degeneration placing stress on Sharpey’s fibres. As they are a continuation of the vertebral body, they will demonstrate signal intensity corresponding to bony marrow and cortical bone, the latter appearing on MR imaging as a low signal on T1- and T2-weighting. There may also be cartilaginous tissue surrounding the osteophyte, which will appear as homogeneous, intermediate signal intensity.69
Because it is a common condition – and a common cause for MR referral from primary contact practitioners – assessment of lesions within the canal and foramen is something with which even an occasional reader of MR images is likely to rapidly develop familiarity. However, osteophytes extending laterally from the vertebral body may also be associated with impingement on the dorsal root ganglion (DRG); these are more difficult to detect, possibly because the central and lateral aspects are the ones invariably assessed, particularly on the axial views. It is particularly important not only to ‘think outside the box’ (or, in this case, the oval) but also to try to always search the sagittal cuts that can occasionally reveal a laterally positioned osteophyte causing damage to the DRG.70
Facet arthrosis
Facet (or zygapophyseal) joint arthrosis is usually seen in association with degenerative disc disease.44 When degeneration occurs, cartilaginous damage, loss of joint space, buckling of the ligamentum flavum, subchondral sclerosis, subchondral cyst formation and osteophyte formation may all be present. Signal intensity changes similar to the one present in the vertebral bodies may be visualized in any of the osseous structures of the posterior elements.10,66
If present, subchondral cysts will appear as rounded regions continuous with the articular facets, which display a low signal intensity on T1-weighted sequences and high signal intensity on T2-weighted images; they may also demonstrate peripheral enhancement on contrasted sequences. In addition, increased fluid may be noted in the joint capsule itself. Depending on the amount of facet hypertrophy, the size of the osteophyte and degree of ligamentum flavum buckling, changes in configuration of the spinal canal, lateral recess or foramen may be observed (Figure 4.13).10,30
On occasion, particularly on axial supine MR images, collections of high signal on the T2-weighted images will be seen in association with the facet joints either anteriorly or posteriorly. If these synovial cysts are located anteriorly, they can contribute to the narrowing of the subarticular recess or foramen, contributing to nerve impingement. They are termed synovial cysts and are most likely caused by the changes in pressure within the joint, causing a ‘herniation’ of synovial fluid through a weakened capsule, resulting in the collection of fluid, which may be symptomatic, prompting the need for invasive techniques to remove them.71,72
As well as cysts, facet joints may have an increase in the amount of fluid within them: joint effusion. This can also result in pain due to the stretching effect on the capsule surrounding the joint. Effusion is best demonstrated on the T2-weighted axial slices, and, although there is no specific measurement to apply to the width of the joint or, indeed, the volume within the joint, joint effusion can be confirmed if there is bright signal coming from the joint on three consecutive slices through the articulation.30,73
Spinal stenosis
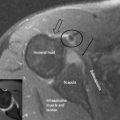
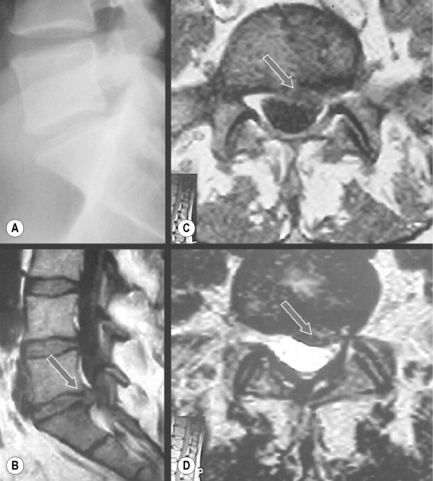
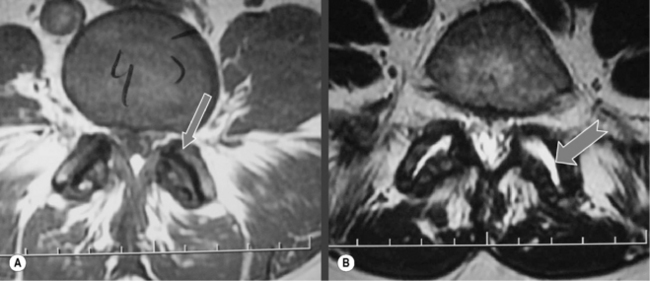
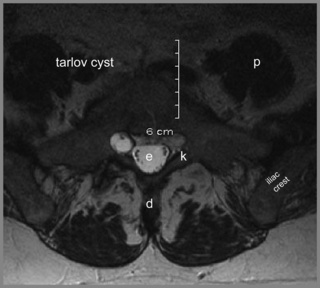
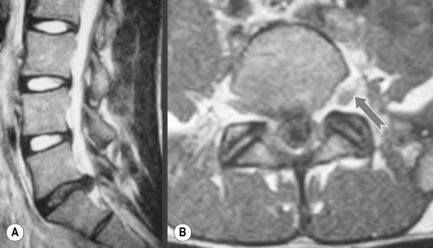
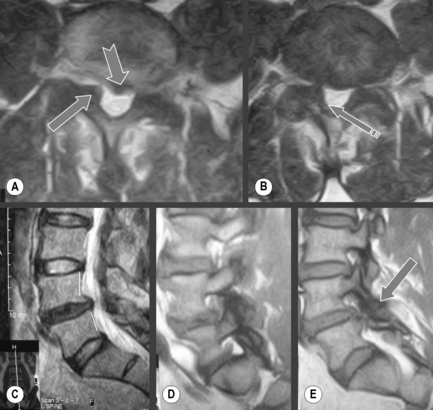
Degenerative processes such as hypertrophy or osteophyte formation may lead to stenosis and encroachment of the dural sac or neural components; an early sign of this can be effacement of the epidural fat line. In the case of spondylolytic spondylolisthesis, an increase in the anteroposterior dimension is typically visible, decompressing the canal; however, if there is reactive bone formation at the pars interarticularis, this may lead to lateral recess stenosis (Figure 4.14).10,44,74,75 Perineural (Tarlov) cysts may also widen the canal by constant erosion of bone by the CSF pulse (Figure 4.15).76
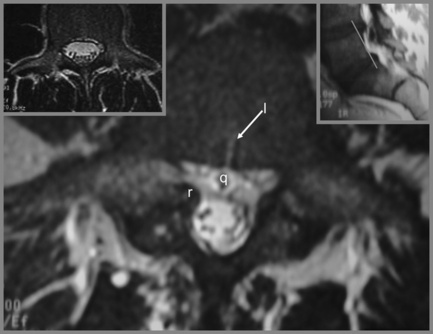
Figure 4.14 • Axial, T2-weighted MR imaging sequence of the lumbar spine demonstrating a spondylolytic spondylolisthesis. The presence of a spondylolytic spondylolisthesis may increase the anterior–posterior diameter of the central canal and usually alters its shape. In the presence of an anterolisthesis, the canal takes on a ‘trefoil’ appearance. Bony or fibrous proliferation at the pars interarticularis may narrow the central canal size in the transverse plane. A normal axial image is provided for comparison (see left insert). The key to the identification of structures is given in Box 4.01.
Whether acquired or congenital, stenosis may involve the spinal canal, the lateral recess or the foramen. Owing to the contrasting effect of CSF, the central canal can be well assessed on T2-weighted images; however, all imaging sequences and planes should be evaluated as nerves may be masked if they take an atypical course or fail to correspond to the angle of the MR imaging plane used. The epidural fat is well visualized on T1-weighted sequences and will facilitate the evaluation of stenosis in the lateral recess or foramen (Figures 4.16, 4.17).
Although various measurements have been published relating to the absolute minimal dimensions of the central canal below which stenosis is guaranteed, an important and yet often-forgotten concept is the fact that what may for one person appear a compromised canal likely to give symptoms, in another will never give rise to problems. This difference can be explained by the relative dimensions of the structures surrounding the central canal, in particular the cord (or conus, depending on the level being considered), the facet capsule and ligamentum flavum. These factors should be taken into account before referring a patient for surgery and should be correlated with clinical history and examination findings.77,78
Treatments for stenosis are variable, with conservative approaches usually being considered first. If these fail to achieve satisfactory improvement, surgical approaches such as laminectomy, discectomy or fasciectomy may be considered (Figures 4.18, 4.19).79 Fusion, with or without instrumentation, may also be performed concomitantly, depending on the amount of decompression required. This surgical hardware may considerably limit the usefulness of subsequent MR imaging because of the associated artifact; this is example of where CT may be superior to MR imaging in evaluating the outcome of the invention.
The postsurgical spine
If a developing infection is suspected, this may warrant MR imaging but with the addition of contrast and perhaps complemented by a CT scan to compensate for the surgical device artifact and also to observe for any subtle bony erosions along the endplate. These should be compared with pre-surgical images; any soft tissue mass will slowly decrease on sequential studies. Over time, scar tissue will also progressively enhance with the addition of contrast; generally, scar tissue enhances earlier on MR imaging and will be hyperintense to adjacent or newly emergent disc material. This determination of whether non-resolving, postsurgical symptoms are arising from a recurrent disc herniation or the development of postoperative scar tissue is important because the management of the patient will differ.38
Disorganization and lack of continuity of the muscle fibres may be seen in the paraspinal tissues following surgery; this may be due either to lack of use or to denervation. Infection may occur following any surgical intervention. Postoperative discitis will be demonstrated by signal alteration in the vertebral bodies: decreased signal intensity on T1-weighted images, increased signal intensity on T2-weighted images and increased enhancement with contrast. These findings can be similar to normal postoperative changes, making careful correlation with laboratory findings important.10,51
And the rest of it …
This is particularly true of the lower thoracic spine, which is often included in the images, albeit principally on the scout views and sagittal slices. The lower thoracic spine often holds information that may contribute to the clinical picture or reveal changes that warrant further investigation. Often, irregular endplates and altered morphology of the vertebral bodies along with decreased signal in the discs on the T2-weighted images strongly suggests evidence of juvenile discogenic disease, which may be important in the determination of the patient’s potential predisposition regarding development of future disc lesions in the lower spine.80 In other cases, patients may have marrow-based lesions affecting the thoracic spine that may be due to more sinister disorders such as multiple myeloma or metastatic disease.81 Lower thoracic disc lesions are also readily identifiable on lumbar sagittal slices and, due to the relative dimensions of the spinal cord and conus, a small disc lesion can have a disproportionate impact and cause symptoms that mimic lumbar pathology (see Chapter 3).
1 Adams M., Bogduk N., Burton K.J., Dolan P. Epidemiology of low back trouble. In The Biomechanics of Back Pain, 2nd ed, Edinburgh: Churchill Livingstone; 2006:55-72.
2 Bates B., Hoekelman R. Interviewing and the health history. In: Bates B., editor. A Guide to Physical Examination. 3rd ed. Philadelphia: JB Lippincott; 1983:1-27.
3 Bates B. The musculoskeletal system. In: Bates B., editor. A Guide to Physical Examination. 3rd ed. Philadelphia: JB Lippincott; 1983:324-370.
4 Rowe L., Yochum T. Principles of radiological interpretation. In: Yochum T., Rowe L., editors. Essentials of Skeletal Radiology. 2nd ed. Baltimore: Williams and Wilkins; 1996:547-585.
5 Chou R., Fu R., Carrino J.A., Deyo R.A. Imaging strategies for low-back pain: systematic review and meta-analysis. Lancet. 2009;373(9662):463-472.
6 Finch P. Technology insight: imaging of low back pain. Nat Clin Pract Rheumatol. 2006;2(10):554-561.
7 Gilbert J.W., Wheeler G.R., Kreft M.P., et al. Repeat upright positional magnetic resonance imaging for diagnosis of disorders underlying chronic noncancer lumbar pain. J Manipulative Physiol Ther. 2008;31(8):627-631.
8 Gedroyc W.M. Upright positional MRI of the lumbar spine. Clin Radiol. 2008;63(9):1049-1050.
9 Alyas F., Connell D., Saifuddin A. Upright positional MRI of the lumbar spine. Clin Radiol. 2008;63(9):1035-1048.
10 Stoller D. Magnetic Resonance Imaging in Orthopaedics and Sports Medicine, 2nd ed. Philadelphia: Lippincott Williams and Wilkins, 1996.
11 Gundry C.R., Fritts H.M. Magnetic resonance imaging of the musculoskeletal system. Part 8. The spine, section 2. Clin Orthop Relat Res 1997:343:260-271.
12 Gundry C.R., Fritts H.M. Magnetic resonance imaging of the musculoskeletal system. Part 8. The spine, section 1. Clin Orthop Relat Res 1997:338:275-287.
13 Oostveen J.C., van de Laar M.A. Magnetic resonance imaging in rheumatic disorders of the spine and sacroiliac joints. Semin Arthritis Rheum. 2000;30(1):52-69.
14 Thomas W.B. Diskospondylitis and other vertebral infections. Vet Clin North Am Small Anim Pract. 2000;30(1):169-182. vii
15 Chin C.T. Spine imaging. Semin Neurol. 2002;22(2):205-220.
16 Jinkins J.R. Acquired degenerative changes of the intervertebral segments at and suprajacent to the lumbosacral junction. A radioanatomic analysis of the nondiscal structures of the spinal column and perispinal soft tissues. Eur J Radiol. 2004;50(2):134-158.
17 Corbett M., Foster N., Ong B.N. GP attitudes and self-reported behaviour in primary care consultations for low back pain. Fam Pract. 2009;26(5):359-364.
18 Somerville S., Hay E., Lewis M., et al. Content and outcome of usual primary care for back pain: a systematic review. Br J Gen Pract. 2008;58(556):790-797. i–vi
19 Croft P.R., Macfarlane G.J., Papageorgiou A.C., et al. Outcome of low back pain in general practice: a prospective study. BMJ. 1998;316(7141):1356-1359.
20 Savigny P., Watson P., Underwood M. Early management of persistent non-specific low back pain: summary of NICE guidance. BMJ. 2009;338:b1805.
21 Kirkaldy-Willis W.H. Managing Low Back Pain, 4th ed. Edinburgh: Churchill Livingstone, 1999.
22 Eley C. Magnetic resonance imaging for low back injuries: appropriate use in managing workers’ compensation claims. AAOHN J. 2006;54(10):429-433.
23 Strayer A. Lumbar spine: common pathology and interventions. J Neurosci Nurs. 2005;37(4):181-193.
24 Ferri F.F. Ferri’s Differential Diagnosis. Philadelphia: Mosby, 2005.
25 Dudley-Hart F., editor. French’s Index of Differential Diagnosis. Bristol: Wright, 1985.
26 Bogduk N. Clinical Anatomy of the Lumbar Spine and Sacrum. Edinburgh: Churchill Livingstone, 2004.
27 Adams M., Bogduk N., Burton K.J., Dolan P. The Biomechanics of Back Pain. Edinburgh: Churchill Livingstone, 2002.
28 Shellock F.G., Parker J.R., Venetianer C., et al. Safety of gadobenate dimeglumine (MultiHance): summary of findings from clinical studies and postmarketing surveillance. Invest Radiol. 2006;41(6):500-509.
29 Li A., Wong C.S., Wong M.K., et al. Acute adverse reactions to magnetic resonance contrast media – gadolinium chelates. Br J Radiol. 2006;79(941):368-371.
30 Berquist T. MRI of the Musculoskeletal System, 4th ed. Philadelphia: Lippincott Williams and Wilkins, 2000.
31 Kanal E., Borgstede J.P., Barkovich A.J., et al. American College of Radiology White Paper on MR Safety. Am J Roentgenol. 2002;178(6):1335-1347.
32 Kubik-Huch R.A., Gottstein-Aalame N.M., Frenzel T., et al. Gadopentetate dimeglumine excretion into human breast milk during lactation. Radiology. 2000;216(2):555-558.
33 Beers M., Berkow R. The Merck Manual, 17th ed. West Point, PA: Merck & Co, 1999.
34 Kaplan P., Helms C., Dussault R., Anderson M. Musculoskeletal MRI. Philadelphia: WB Saunders, 2001.
35 Wigh R.E. The thoracolumbar and lumbosacral transitional junctions. Spine. 1980;5(3):215-222.
36 Haughton V., Schreibman K., De Smet A. Contrast between scar and recurrent herniated disk on contrast-enhanced MR images. AJNR Am J Neuroradiol. 2002;23(10):1652-1656.
37 Castillo M. Contrast enhancement in primary tumors of the brain and spinal cord. Neuroimaging Clin N Am. 1994;4(1):63-80.
38 Bronen R.A., Sze G. Magnetic resonance imaging contrast agents: theory and application to the central nervous system. J Neurosurg. 1990;73(6):820-839.
39 Dillon W.P. Imaging of central nervous system tumors. Curr Opin Radiol. 1991;3(1):46-50.
40 Jarvik J.G., Bowen B., Ross J. Practice Guideline for the Performance of Magnetic Resonance Imaging (MRI) of the Adult Spine. Reston, VA: American College of Radiology, 2006.
41 Vande Berg B.C., Lecouvet F.E., Galant C., et al. Normal variants of the bone marrow at MR imaging of the spine. Semin Musculoskelet Radiol. 2009;13(2):87-96.
42 Hyun S.J., Rhim S.C., Kang J.K., et al. Combined motor- and somatosensory-evoked potential monitoring for spine and spinal cord surgery: correlation of clinical and neurophysiological data in 85 consecutive procedures. Spinal Cord. 2009;47(8):616-622.
43 Helms C., Major N., Anderson M.W., et al. Basic principles of musculoskeletal MRI. In Musculoskeletal MRI, 2nd ed, Philadelphia: Elsevier Saunders; 2009:1-19.
44 Grenier N., Kressel H.Y., Schiebler M.L., et al. Normal and degenerative posterior spinal structures: MR imaging. Radiology. 1987;165(2):517-525.
45 Standring S., editor. Gray’s Anatomy – The back (Section 45). Edinburgh: Elsevier, 2009.
46 Muzin S., Isaac Z., Walker J.3rd. The role of intradiscal steroids in the treatment of discogenic low back pain. Curr Rev Musculoskelet Med. 2008;1(2):103-107.
47 Sehgal N., Fortin J.D. Internal disc disruption and low back pain. Pain Physician. 2000;3(2):143-157.
48 Stoller D.W., Tirman P.F., Bredella M.A. Diagnostic Imaging Orthopaedics. Salt Lake City: Amirsys Inc, 2003.
49 Barr J.S. Lumbar disk lesions in retrospect and prospect: Joseph S. Barr. Address tape-recorded May 1961. Clin Orthop Relat Res 1977:129:4-8.
50 Milette P.C. The proper terminology for reporting lumbar intervertebral disk disorders. AJNR Am J Neuroradiol. 1997;18(10):1859-1866.
51 Ross J.S., Zepp R., Modic M.T. The postoperative lumbar spine: enhanced MR evaluation of the intervertebral disk. AJNR Am J Neuroradiol. 1996;17(2):323-331.
52 Moore K. The back. In Clinically Oriented Anatomy, 2nd ed, Baltimore: Williams and Wilkins; 1985:565-625.
53 Kokubo Y., Uchida K., Kobayashi S., et al. Herniated and spondylotic intervertebral discs of the human cervical spine: histological and immunohistological findings in 500 en bloc surgical samples. Laboratory investigation. J Neurosurg Spine. 2008;9(3):285-295.
54 Bachmeier B.E., Nerlich A., Mittermaier N., et al. Matrix metalloproteinase expression levels suggest distinct enzyme roles during lumbar disc herniation and degeneration. Eur Spine J. 2009;18(11):1573-1586.
55 Rowe L., Yochum T. Arthritic disorders. In: Yochum T., Rowe L., editors. Essentials of Skeletal Radiology. 2nd ed. Baltimore: Williams and Wilkins; 1996:795-974.
56 Mixter W.J., Barr J.S. Rupture of the intervertebral disc with involvement of the spinal canal. N Engl J Med. 1934;211:210-215.
57 Parisien R.C., Ball P.A. William Jason Mixter (1880–1958). Ushering in the “dynasty of the disc”. Spine. 1998;23(21):2363-2366.
58 Milette P.C. Reporting lumbar disk abnormalities: at last, consensus!. AJNR Am J Neuroradiol. 2001;22(3):428-429.
59 Fardon D.F., Milette P.C. Nomenclature and classification of lumbar disc pathology. Recommendations of the Combined Task Forces of the North American Spine Society, American Society of Spine Radiology, and American Society of Neuroradiology. Spine. 2001;26(5):E93-E113.
60 Peng B., Hou S., Wu W., et al. The pathogenesis and clinical significance of a high-intensity zone (HIZ) of lumbar intervertebral disc on MR imaging in the patient with discogenic low back pain. Eur Spine J. 2006;15(5):583-587.
61 Lim C.H., Jee W.H., Son B.C., et al. Discogenic lumbar pain: association with MR imaging and CT discography. Eur J Radiol. 2005;54(3):431-437.
62 Madsen R., Jensen T.S., Pope M., et al. The effect of body position and axial load on spinal canal morphology: an MRI study of central spinal stenosis. Spine. 2008;33(1):61-67.
63 Jung H.S., Jee W.H., McCauley T.R., et al. Discrimination of metastatic from acute osteoporotic compression spinal fractures with MR imaging. Radiographics. 2003;23(1):179-187.
64 Helms C. Trauma. In: Fundamentals of Skeletal Radiology. Philadelphia: Elsevier Saunders; 2005:78-112.
65 Ross J.S., Masaryk T.J., Modic M.T., et al. Vertebral hemangiomas: MR imaging. Radiology. 1987;165(1):165-169.
66 Modic M.T., Masaryk T.J., Ross J.S., Carter J.R. Imaging of degenerative disk disease. Radiology. 1988;168(1):177-186.
67 Thompson K.J., Dagher A.P., Eckel T.S., et al. Modic changes on MR images as studied with provocative diskography: clinical relevance – a retrospective study of 2457 disks. Radiology. 2009;250(3):849-855.
68 Luoma K., Vehmas T., Gronblad M., et al. Relationship of Modic type 1 change with disc degeneration: a prospective MRI study. Skeletal Radiol. 2009;38(3):237-244.
69 Helms C., Major N., Anderson M.W., et al. Spine. In Musculoskeletal MRI, 2nd ed, Philadelphia: Elsevier Saunders; 2009:273-323.
70 Grenier J.M., Scordilis P.J., Seaman D.R., Wessely M. Lumbar MRI. Part 2: Common pathological conditions. Clinical Chiropractic. 2006;9(1):39-47.
71 Ayberk G., Ozveren F., Gok B., et al. Lumbar synovial cysts: experience with nine cases. Neurol Med Chir (Tokyo). 2008;48(7):298-303.
72 Kahilogullari G., Tuna H., Attar A. Management of spinal synovial cysts. Turk Neurosurg. 2008;18(2):211-214.
73 Chaput C., Padon D., Rush J., et al. The significance of increased fluid signal on magnetic resonance imaging in lumbar facets in relationship to degenerative spondylolisthesis. Spine. 2007;32(17):1883-1887.
74 Grenier N., Kressel H.Y., Schiebler M.L., Grossman R.I. Isthmic spondylolysis of the lumbar spine: MR imaging at 1.5 T. Radiology. 1989;170(2):489-493.
75 Schiebler M.L., Grenier N., Fallon M., et al. Normal and degenerated intervertebral disk: in vivo and in vitro MR imaging with histopathologic correlation. Am J Roentgenol. 1991;157(1):93-97.
76 Langdown A.J., Grundy J.R., Birch N.C. The clinical relevance of Tarlov cysts. J Spinal Disord Tech. 2005;18(1):29-33.
77 Lurie J.D., Tosteson A.N., Tosteson T.D., et al. Reliability of readings of magnetic resonance imaging features of lumbar spinal stenosis. Spine. 2008;33(14):1605-1610.
78 Geisser M.E., Haig A.J., Tong H.C., et al. Spinal canal size and clinical symptoms among persons diagnosed with lumbar spinal stenosis. Clin J Pain. 2007;23(9):780-785.
79 Thalgott J.S., Albert T.J., Vaccaro A.R., et al. A new classification system for degenerative disc disease of the lumbar spine based on magnetic resonance imaging, provocative discography, plain radiographs and anatomic considerations. Spine J. 2004;4(suppl 6):167S-172S.
80 Wood K.B., Garvey T.A., Gundry C., Heithoff K.B. Magnetic resonance imaging of the thoracic spine. Evaluation of asymptomatic individuals. J Bone Joint Surg Am. 1995;77(11):1631-1638.
81 Kim H.J., Ryu K.N., Choi W.S., et al. Spinal involvement of hematopoietic malignancies and metastasis: differentiation using MR imaging. Clin Imaging. 1999;23(2):125-133.