[level-membership-for-radiology-category]Chapter 8
 The Liver
Introduction
There have been impressive advances recently in the application of ultrasound contrast medium to liver imaging; but these agents are not universally available. Researchers have shown the benefits of microbubble-enhanced lesion detection and characterisation.1 Unfortunately governing agencies across the world have not uniformly endorsed these agents and there is limited ability and/or interest to apply them in many centres. This chapter is, therefore, written for those ultrasound practitioners who do not have access to or routinely use intravenous ultrasound contrast. For discussion of hepatic applications of sonographic contrast please refer to Chapter 17.
The standard hepatic US examination should include a brief survey with spectral and colour Doppler (Box 8-1). This serves a two-fold purpose: first, it adds valuable haemodynamic information to the evaluation of the liver, in most cases reinforcing normality, but occasionally revealing an unexpected finding. Second, by consistently integrating Doppler into the routine hepatic examination, sonologists will continually refine their Doppler skills so that when presented with significant haemodynamic abnormalities, they can be identified quickly and evaluated accurately. Although a cursory Doppler survey of the hepatic vasculature may add 2–3 min to an abdominal examination, regular practice enables the examiner to become more adept at perceiving abnormalities, dialling in the settings to optimise the display, and more expert in analysing the results. Not infrequently altered blood flow may be the only abnormal finding to suggest the presence of pathology. The Doppler survey may reveal distortion of vascularity around a subtle lesion of which the examiner was otherwise unaware. It may display hypervascularity of an observed lesion and this awareness may increase diagnostic certainty. The use of colour Doppler in the hepatic examination also helps to differentiate vascular from non-vascular structures. Care must be taken, however, to ensure that equipment settings are appropriate: if gain, pulse repetition frequency, and filtration are not optimised, slow flow can be missed in vascular structures or artifactual colour can be painted into non-vascular structures.2
Executing the Liver Doppler Study
SCAN TECHNIQUE
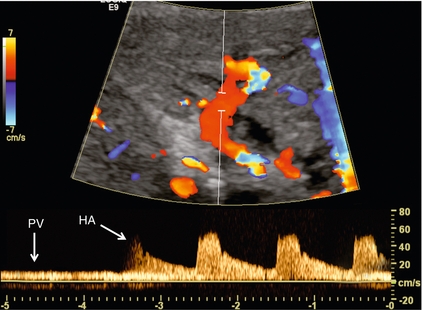
The patient is scanned in a supine or left lateral decubitus position. Depending on vessel orientation and body habitus, the portal vein and hepatic artery are best interrogated by either a subcostal approach pointing posterocephalad, or a right intercostal approach pointing medially. Since the portal vein and hepatic artery travel together in the portal triad, along with the common duct, these approaches should satisfactorily interrogate both vessels (Fig. 8-1).
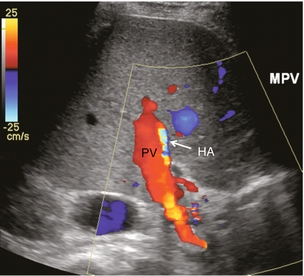
FIGURE 8-1 Oblique colour Doppler image of the porta hepatis. The hepatic artery (HA) accompanies the portal vein (PV) and bile ducts. With the colour scale appropriately set for the slow flow within the portal vein, hepatic arterial flow projects as colour aliasing.
Scanning the left hepatic and middle hepatic veins is best accomplished from a substernal approach. The transducer should be oriented transversely, pointing posterocephalad, and swept up and down across the liver. For the right hepatic vein, a right lateral intercostal approach is used with the transducer pointed cephalad. If the patient’s liver extends below the costal margin during inspiration, a subcostal transverse view, angled cephalad, is useful for the confluence of the hepatic veins (Fig. 8-2).
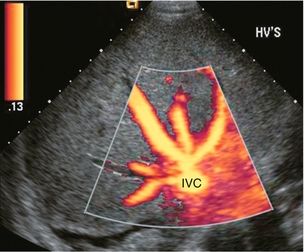
FIGURE 8-2 Power Doppler transverse view of the liver with a subcostal approach. This crow’s foot appearance of the hepatic veins shows the convergence of five hepatic veins onto the IVC. The presence of accessory branches is very common.
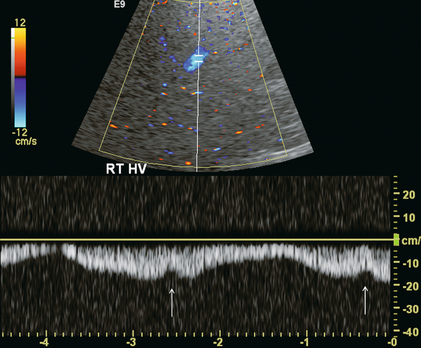
Some patients, when asked to hold their breath perform a vigorous Valsalva manoeuvre. This results in increased intrathoracic pressure which will impede venous return, affecting flow profiles and velocities, particularly in the hepatic veins and inferior vena cava (IVC). This will often alter the hepatic vein profile, creating the perception of hepatic venous outflow obstruction (HVOO). Scanning must be performed in neutral breath-hold to avoid producing a misleading Doppler tracing.3
Varying the width of the sample volume can be advantageous when examining the porta hepatis. If the examiner is screening for vascular patency or trying to locate a specific vessel, a large sample volume is appropriate for rapid interrogation of a broad area; for example, when ruling out hepatic artery thrombosis in a liver transplant recipient. If, however, the examiner wants to precisely characterise flow within a vessel and evaluate waveform detail, then the sample volume must be small and placed near the centre of the vessel, thereby interrogating the highest velocity lamina (Fig. 8-3). A wide sample volume, by incorporating the slower lamina along the wall together with the faster central lamina, will broaden the spectral Doppler tracing and mimic turbulence.4
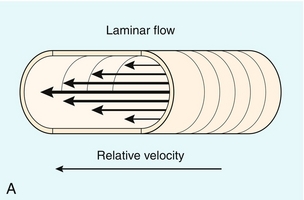
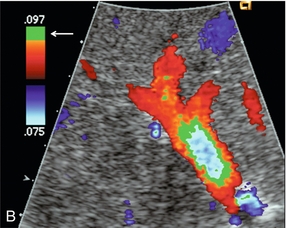
FIGURE 8-3 (A) Schematic representation of normal laminar flow. The velocity of fluid along the wall of a vessel is slowed because of frictional forces causing drag; therefore its relative velocity is less than that at the centre of the vessel. The travelling wave assumes a parabolic form. (B) Colour Doppler image of portal vein flow with a green tag assigned to high velocities towards the transducer. Additionally the pulse repetition frequency (velocity scale) is set low to cause aliasing. This distortion of the colour-encoding thus permits a display of several velocity lamina. Note the transition from the slowest velocities, red through orange, green and blue from the periphery to the centre of the vessel. The actual velocity displayed on a spectral Doppler tracing is, therefore, dependent on sample volume placement relative to these various velocity lamina. A small, centrally placed sample volume will display a higher measured velocity than a peripherally placed sample volume.
Differentiating a patent from a thrombosed vessel is critically dependent on Doppler settings and transducer frequency. Gain, filtration, and pulse repetition frequency settings must be adjusted throughout the study. The settings must be carefully reviewed if one is about to make a diagnosis of thrombosis (Fig. 8-4).
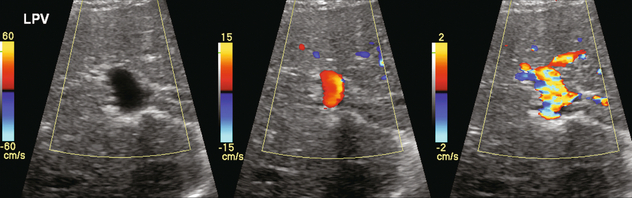
FIGURE 8-4 Series of colour Doppler images of the left portal vein. The only setting changed among these three images is the pulse repetition frequency (colour Doppler scale). On the first image with scale set high (60 cm/s), no colour is displayed within the portal vein which therefore could be interpreted as thrombosed. The second image with scale set appropriately (15 cm/s), relative to normal portal velocity, reveals appropriate colour saturation and confirms patency. On the final image with scale set too low (02 cm/s), colour aliasing distorts the image.
Indications
Patients referred for right upper quadrant (RUQ) US typically have elevated liver enzymes of unknown aetiology incidentally detected on screening blood tests. Although sonographic imaging of the liver may reveal diffuse abnormality or focal disease, the majority of these examinations are normal (Box 8-2). Doppler US, however, may reveal flow alterations caused by inflammatory disease, neoplasm, or other disorders which are too subtle or too small to cause perceptible imaging irregularities. Being able to differentiate flow profile and velocity alterations in the hepatic vasculature between those caused by hepatic versus cardiac disease will help identify those patients needing additional cardiac evaluation versus those who would benefit from liver biopsy. Additionally, the identification of a Doppler abnormality can define those patients who would benefit from further hepatic imaging with computed tomography (CT), magnetic resonance imaging (MRI), or angiography.
When portal hypertension is suspected, Doppler US characterises changes in portal haemodynamics and identifies pathways of portosystemic collateralisation.5 Doppler can confirm the patency of surgical or percutaneous shunts which have been performed in patients with bleeding oesophageal varices. Identification and differentiation of bland thrombus from tumour thrombus within the hepatic or portal veins by Doppler has significant implications for medical, surgical or ablation treatment planning. Doppler US plays a key role in the postoperative monitoring of liver transplant recipients, confirming vascular patency.
The role of Doppler in the characterisation of parenchymal liver disease and screening for hepatocellular carcinoma (HCC) is controversial. Marked alterations in flow profiles and velocities can be seen and have been described in the literature.6–9 It is rare, though, to be able to precisely pinpoint a specific diagnosis based on Doppler findings since there is considerable overlap in velocity and waveform alterations among various disease states.
Vascular Anatomy and Normal Flow Profiles
PORTAL VEIN
The portal vein is formed by the confluence of the splenic and superior mesenteric veins. It supplies around 70% of incoming blood volume to the liver. It is accompanied by the hepatic artery and common bile duct which together make up the portal triad (Fig. 8-1). The triad has echogenic margins as it enters the liver, due to the intrahepatic extension of Glisson’s capsule and presence of perivascular fat. After forming the right and left branches, these vessels progressively branch to supply the liver segments as defined by Couinaud whose US appearance was described by La Fortune.10 The Couinaud system divides the liver vertically along the planes of the hepatic veins, and horizontally along the planes of the left and right portal veins. A thorough understanding of this anatomy is critical for surgical planning in liver resection and living related donation. Anatomic variations of the portal vein are rare.
The portal vein Doppler flow profile in a fasting patient has a relatively constant velocity of approximately 18 cm/s (± 5 cm/s) towards the liver (hepatopetal) (Fig. 8-5A). The flow velocity is uniform because cardiac pulsation is damped by the splenic parenchyma and the capillaries of the gut at one end of the portal system and by the liver sinusoids at the other. Slight phasicity may be seen on the portal spectral tracing due to respiration and a mild degree of periodicity may be present, due either to retrograde pulsation transmitted from the right heart via the hepatic vein (A-wave) or to the hepatic artery systolic pressure wave. Because these brief pressure surges into the liver transiently elevate intracapsular pressure, they increase resistance to portal venous inflow and, thereby, effect a momentary slowing of antegrade flow in the portal vein (Fig. 8-5B).11 Although some periodicity may be expected in portal vein flow, marked velocity variation or reversal of flow, even if brief, should be considered an abnormal finding.12 The blood in the portal vein is relatively deoxygenated since it comes to the liver after perfusing the intestine and spleen. It is rich in nutrients after a meal, and arrives at the liver to be processed by the cells of the hepatic sinusoids.
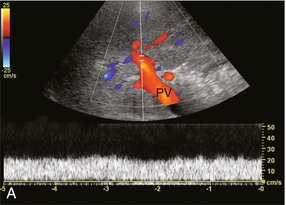
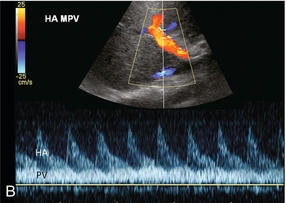
FIGURE 8-5 (A) Spectral Doppler tracing of normal portal vein flow. The flow velocity of 20 cm/s is relatively uniform and in a hepatopetal direction. (B) Spectral Doppler tracing of normal portal vein and hepatic artery flow. Slight periodicity is present in this patient’s portal vein tracing. The dip in antegrade velocity coincides with hepatic arterial systole. The comparison of the two flow profiles is achieved by interrogating with a wide sample volume that encompasses both the artery and the vein in one tracing. Velocity variation may also occur due to pressure change with the hepatic vein A-wave but those are harder to compare since the vessels are separated and cannot be simultaneously interrogated.
HEPATIC ARTERY
The hepatic arterial blood supply arises solely from the celiac axis in approximately 75% of individuals. The celiac trifurcates into the splenic artery, left gastric artery and common hepatic artery. After the take-off of the gastroduodenal artery, the common hepatic is then called the proper hepatic artery. It enters the liver alongside the portal vein (Fig. 8-1) where it divides into left and right hepatic arteries and from there branches into the Couinaud segments. There are, however, numerous variants of hepatic artery anatomy. These include accessory vessels which exist in conjunction with normal branches of the hepatic artery and replaced arteries which make up the sole supply of a segment or lobe. For example, a replaced right hepatic artery arising from the superior mesenteric artery (SMA) is the sole blood supply to the entire right lobe of the liver in 15% of the population.13 In a slender patient, colour Doppler US may be able to identify the replaced right hepatic artery behind the main portal vein as it courses towards the right lobe from the SMA (Fig. 8-6). A branch of the left gastric artery may supply the left lobe of the liver. This occurs less frequently and is more difficult to identify by Doppler US because of its small size.
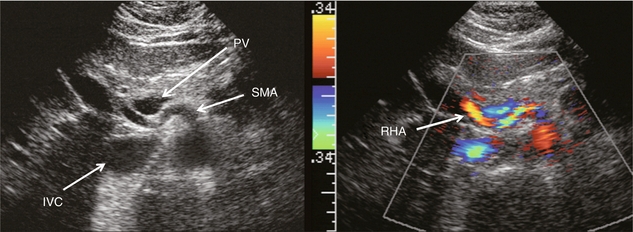
FIGURE 8-6 Transverse image of the mid-abdomen at the level of the superior mesenteric artery origin. A tubular structure is seen coursing from the superior mesenteric artery (SMA) to the right lobe of the liver, between portal vein (PV) and the inferior vena cava (IVC). The addition of colour Doppler identifies this tubular structure as a vessel. An arterial signal on spectral Doppler, identification of its SMA origin and a course towards the right lobe of the liver confirm this to be a replaced right hepatic artery.
The normal proper hepatic artery in a fasting patient has a low-resistance Doppler flow profile, [about 60–70% resistive index (RI)] (Fig. 8-7). During systole, the velocity is approximately 30–60 cm/s; while during diastole, it normally slows to approximately 10–20 cm/s. Normal systolic acceleration time of the hepatic artery is brisk – less than 0.07 seconds.
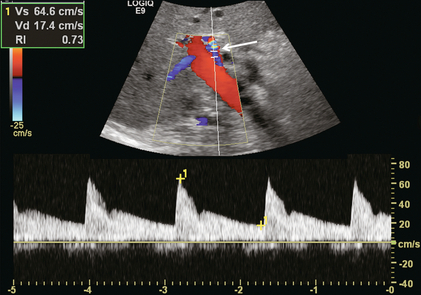
FIGURE 8-7 Spectral Doppler tracing of a normal hepatic artery. Systolic upstroke is brisk with acceleration time < 0.07 s. Resistive index measures 73%. Velocity at end diastole approximates 17 cm/s.
Diastolic arterial velocity approximates the velocity of the portal vein. A comparison between hepatic artery diastolic velocity and the portal vein velocity is called the liver (or hepatic) vascular index. To acquire this comparison one can increase the sample volume size so that both vessels are incorporated into the same tracing (Fig. 8-5B) or swing the sample volume from one vessel to the other in the same tracing (Fig. 8-8).12,14
HEPATIC VEINS
The right, middle, and left hepatic veins enter the IVC in a ‘crow’s foot’ configuration when viewed in the transverse plane (Fig. 8-2). The left and middle hepatic veins usually enter as a common trunk along the left anteromedial aspect of the IVC. Over 50% of individuals have additional hepatic veins that are seen with colour Doppler; a right superior anterior segmental vein may be seen draining into the middle hepatic vein, marginal hepatic veins may drain into the right and left hepatic veins, and a large accessory right hepatic vein may be seen entering the IVC several centimetres inferior to the junction of the three main hepatic veins in 6–10% of people (Fig. 8-9). The venous drainage from the central liver, and the caudate lobe, empties directly into the IVC and is not normally detected by colour Doppler since these veins are small and deep (Fig. 8-10). This separate drainage pathway is responsible for the unique behaviour of the caudate lobe in diffuse liver disease, and for the distinctive enhancement pattern seen on contrast-enhanced CT scans of patients with hepatic vein thrombosis.
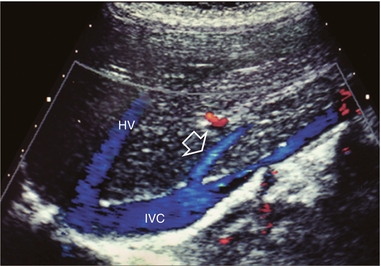
FIGURE 8-9 Longitudinal colour Doppler image of the liver and inferior vena cava (IVC) through the right flank. There is a prominent accessory hepatic vein (open arrow) from the inferior posterior segment of the right lobe of the liver (Couinaud segment 6). This vein joins the inferior vena cava approximately 4 cm inferior to the junction of the main three hepatic veins (HV).
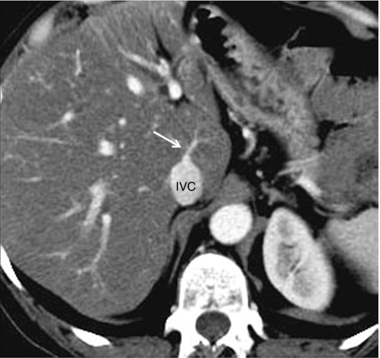
FIGURE 8-10 CT scan at the level of the mid-liver in a patient with steatosis. Because of the fatty background, small central hepatic veins (arrow) can be seen draining directly into the inferior vena cava. This unique drainage of the central liver is the underlying cause for caudate hypertrophy in patients with main hepatic vein thrombosis or cirrhosis.
The normal hepatic vein waveform is referred to as triphasic and is a result of pressure waves emanating from the right heart (Fig. 8-11A). It is similar to the jugular vein waveform. There are four components to this waveform and occasionally a fifth may be perceived. Since hepatic vein flow courses toward the centrally located IVC, the hepatic vein flow is towards the heart and away from the transducer. Therefore, the majority of flow registers below the baseline. During right atrial contraction blood is forced back into the liver and is therefore displayed above the baseline. These directions are best described as being ‘antegrade’ (towards the heart) and ‘retrograde’ (away from the heart).
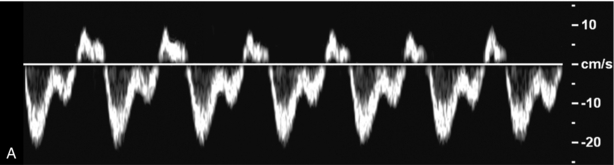
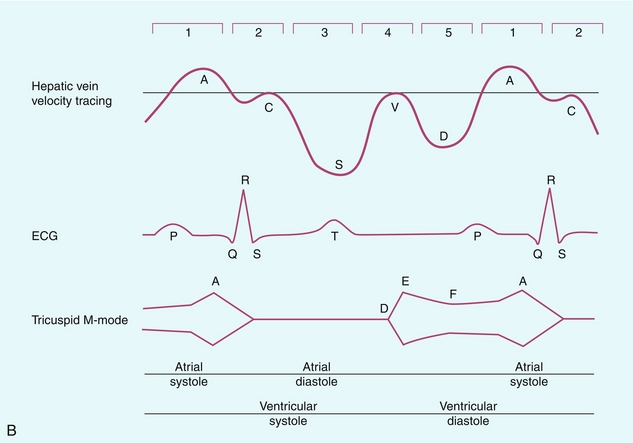
FIGURE 8-11 (A) Normal hepatic vein spectral Doppler tracing. (B) Illustrated tracings of an ECG, hepatic vein spectral Doppler tracing, and mitral valve M-mode tracing with correlation to atrial and ventricular systole and diastole. The divisions at the top of these tracing 1–5 correspond to the discussion in the text.
This complex hepatic vein tracing and associated velocities have been described by Abu-Yousef.15 Figure 8.11B shows the hepatic vein waveform in relationship with an electrocardiogram (ECG) tracing, tricuspid M-mode scan, and atrial and ventricular status. The following stages can be identified:
1. The most distinctive feature is the retrograde A-wave, which is the result of right atrial contraction triggered by the P-wave on the ECG. Since there is no valve between the right atrium and the IVC, a burst of reversed flow travels down the IVC and into the hepatic veins, which has a mean velocity of approximately 18 cm/s.
2. At the end of right atrial contraction, flow returns to the antegrade direction as the atrium relaxes. However, as the right ventricular contracts, the tricuspid valve is slammed shut and bulges back into the right atrium, creating its own pressure wave: the C-wave. This is a subtle brief pause in the steadily increasing antegrade flow. It is infrequently detected. The C-wave coincides with the beginning of ventricular systole and occurs with the QRS complex on the ECG.
3. The right atrium continues to dilate and antegrade flow builds to a relatively high velocity of approximately 30 cm/s. Eventually atrial filling approaches completion and antegrade flow starts to slow. This transition from accelerating to decelerating flow is known as the S-wave and occurs during ventricular systole within 0.15 s of the QRS complex.
4. At the end of atrial filling, antegrade velocity decelerates, or may even briefly reverse. The tricuspid valve then opens and velocities accelerate in the antegrade direction. This is known as the V-wave and has a mean velocity of approximately −1 cm/s. In relation to the ECG, this occurs following the T-wave.
5. As the right ventricle relaxes flow in the hepatic veins again accelerates in the antegrade direction, as both the right atrium and right ventricle fill. Velocity builds to a mean of approximately 22 cm/s. Eventually, the right heart chambers become filled passively and antegrade flow decelerates. This change from accelerating to decelerating velocity is referred to as the D-wave, and occurs during ventricular diastole. We then return to the A-wave as the atrium again contracts to begin another cardiac cycle.
This waveform is seen in the hepatic veins and upper IVC in the vast majority of patients. However, not all individuals have a similar degree of periodicity within the hepatic veins. The percentage of patients that manifest an identifiable C-wave is relatively small (Fig. 8-12). The degree of flow reversal of the A-wave and V-wave may vary depending on the patient’s cardiac status, state of hydration, heart rate, and the distance of Doppler interrogation from the heart. In a survey of a population of normal volunteers, a 9% incidence of a flattened hepatic vein flow profile has been reported.12,16
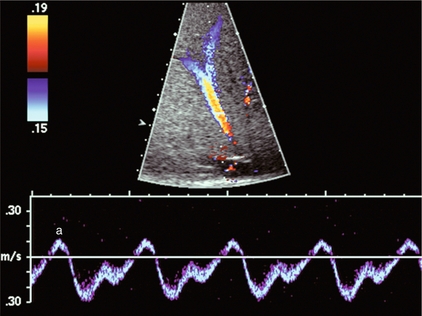
FIGURE 8-12 Normal hepatic vein spectral Doppler tracing. Even though the tracing is acquired within a few centimetres of the heart, the C-wave cannot be identified on this tracing. This is, indeed, the tracing most often visualised in the hepatic vein and inferior vena cava. The retrograde component of flow is appropriately small.
Because the heart is located within the thorax, pressure changes caused by respiration affect the hepatic vein flow profile. When the patient forcefully exhales or bears down against a closed glottis, the elevated intrathoracic pressure resists antegrade flow, causing the S- and D-waves to be less prominent. The reversed component of flow increases so the A- and V-waves become more pronounced (Fig. 8-13). Conversely, during forced inspiration with increasing negative intrathoracic pressure, the S- and D-waves become more prominent, while the A- and V-waves are less pronounced and may actually not manifest as reversed flow.17
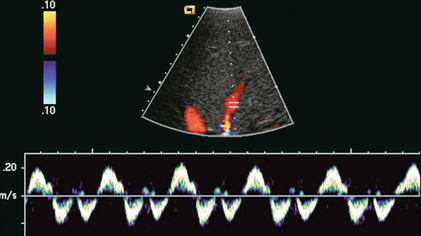
FIGURE 8-13 Hepatic vein spectral Doppler tracing obtained during Valsalva manoeuvre. Because of the elevated intrathoracic pressure, the reversed component of flow is accentuated. Forward flow is decreased. Compare to Figure 8.12. The colour image was captured during the ‘a wave’ as flow was coursing back into the liver.
Assessment of Disease
PORTAL VEIN
Portal Hypertension
In hepatocellular disease, the sinusoids are damaged, destroyed or replaced. As the volume of normally functioning liver parenchyma decreases, the resistance to portal venous flow increases, the portal vein dilates, and portal flow decreases and with increasing severity, reverses.18–20 An elevation of pressure in the portal system above 6 mmHg is considered portal hypertension. Above 12 mmHg pressure, portal hypertension becomes clinically evident.
Use of the ‘congestive index’ has been recommended to help diagnose portal hypertension. This index is the ratio of the portal vein cross-sectional area (cm2) divided by the mean portal flow velocity (cm/s). This takes into account portal vein dilatation and decreased flow velocity, the two physiological changes associated with portal hypertension. In normal subjects, this ratio is less than 0.7. Although there is theoretical value in this index, the interobserver variability in portal vein area measurements and velocity measurements is relatively high, and error is further compounded when the parameters are combined in a ratio. Therefore, few centres now rely on this index.21,22
As liver disease worsens, the periodicity in the portal vein may become more pronounced, usually coinciding with hepatic arterial systole (Fig. 8-14).19,23 Finally, with end-stage liver disease, continuous hepatofugal flow is observed, usually with increased periodicity. Blood entering the liver in the hepatic artery normally passes through the hepatic sinusoids to the hepatic veins, but with increasing hepatocellular disease, scarring, fibrosis, and capillary leak the pathway of least resistance for the arterial inflow becomes the portal vein. Arterial blood shunts to the portal vein via vasa-vasorum, or via direct arteriovenous shunting at the level of the sinusoids. Thus, the origin of hepatofugal flow leaving the liver in the portal vein is blood shunted from the hepatic artery24 (Fig. 8-15).
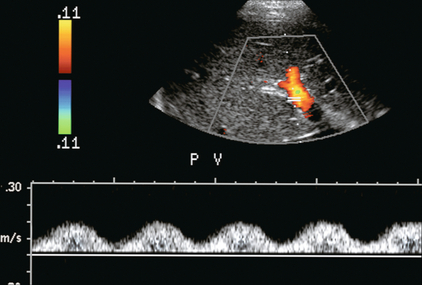
FIGURE 8-14 Spectral hepatic vein Doppler tracing in a patient with alcoholic cirrhosis. Portal vein flow profile has become more sinusoidal although the flow direction does remain hepatopetal throughout the cardiac cycle. This degree of periodicity is beyond what we would expect in a normal portal vein. The dip in antegrade velocity coincides with hepatic arterial systole.
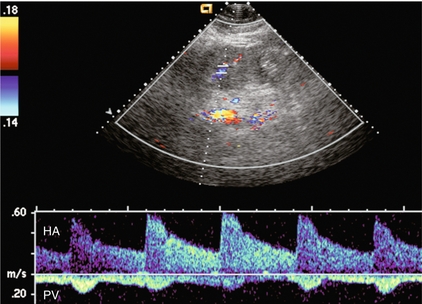
FIGURE 8-15 Portal vein spectral Doppler tracing in a patient with severe hepatocellular injury secondary to paracetamol (acetaminophen) overdose. Portal vein flow is hepatofugal throughout the cardiac cycle. We again see increased periodicity with a velocity surge concurrent with arterial systole secondary to capillary leak.
Pronounced periodicity may be seen in the portal vein, which does not coincide with hepatic arterial systole. This is usually due to cardiac disease, such as right ventricular dysfunction or tricuspid regurgitation, and is caused by a prominent reversed component of flow in the hepatic veins, either a ‘cannon’ A-wave or a reversed S-wave25,26 (Fig. 8-16).
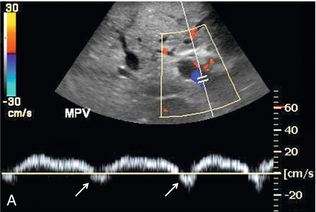
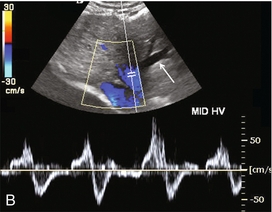
FIGURE 8-16 (A) Spectral Doppler tracing of portal vein flow in a patient with severe right ventricular dysfunction and tricuspid regurgitation. There is marked periodicity in the portal vein waveform. Hepatopetal flow decreases, and briefly reverses, coinciding with the large regurgitant component of hepatic vein flow during tricuspid regurgitation. (B) Colour image and spectral Doppler tracing of the middle hepatic vein. Note the veins are distended. There is complete distortion of the triphasic hepatic vein waveform with a large regurgitant component of flow. This large reversed pressure wave impedes portal vein inflow.
Varices
As portal hypertension progresses and pressure rises to 15 or 20 mmHg, sufficient pressure exists to cause the development of varices. These collateral pathways shunt blood from the portal to the systemic circulation.27 The more common channels are the short gastric, left gastric and coronary veins; recanalised umbilical or paraumbilical vein; and splenorenal-mesenteric collaterals (Fig. 8-17). Other, less typical, pathways include pericholecystic, iliolumbar, gonadal, haemorrhoidal, and ascending retrosternal veins. Indeed, any vein in the abdomen may serve as a potential collateral to the systemic circulation and may be incorporated in a very convoluted shunt.28,29
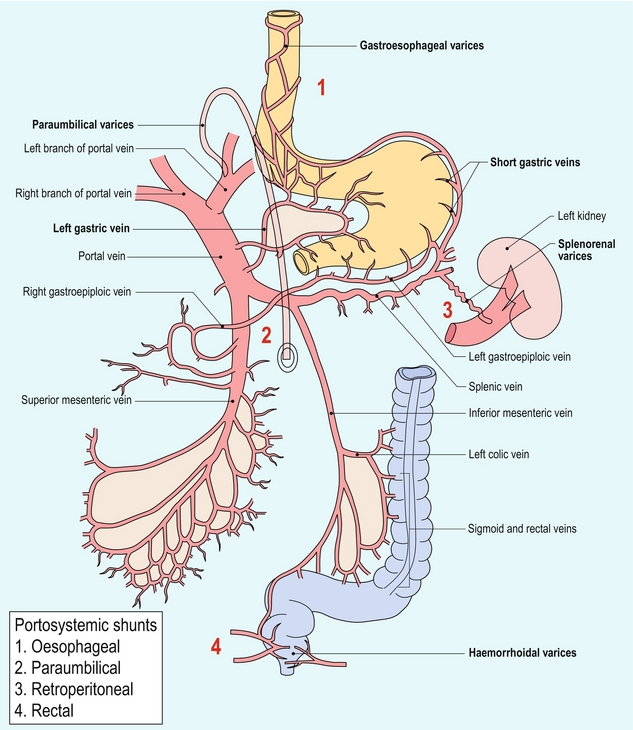
Short gastric varices coursing between the spleen and the greater curvature of the stomach are best imaged via the left flank, using the enlarged spleen as a window (Fig. 8-18). Left gastric or coronary vein varices course from the splenic or portal veins along the lesser curvature of the stomach and are best imaged through the left lobe of the liver (Fig. 8-19). Both sets of varices then converge on the gastro-oesophageal junction (Fig. 8-20A). From there, blood flow proceeds upwards through oesophageal varices to eventually communicate with the azygous vein and the systemic circulation (Fig. 8-20B). Because of the potential lethal risk from spontaneous, brisk haemorrhage from oesophageal varices, a variety of endoscopic, surgical, or percutaneous procedures have been developed to divert blood away from them.
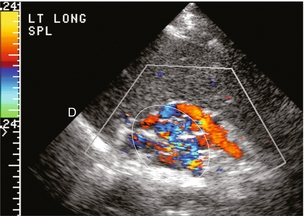
FIGURE 8-18 Longitudinal colour Doppler view of the left flank in a patient with portal hypertension and splenomegaly. A tangled web of veins (arrows) is seen coursing cephalad from the splenic vascular pedicle and extends towards the diaphragm (D). These are short gastric varices coursing from the splenic vein, along the greater curvature of the stomach and from there to the systemic circulation via oesophageal varices.
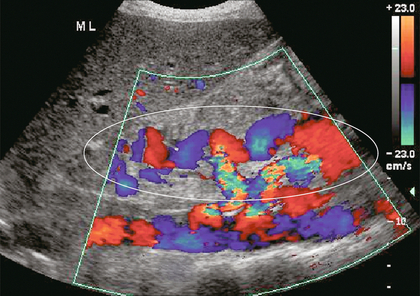
FIGURE 8-19 Longitudinal colour Doppler image in the midline of a patient with portal hypertension. A large tortuous left gastric varix is seen coursing from the region of the coeliac axis towards the gastro-oesophageal junction. Whereas short gastric varices tend to be a plexus of small vessels, the left gastric varix is typically a single large tortuous vessel. (Image courtesy of a friend.)
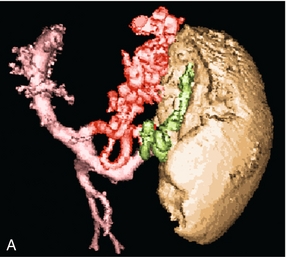
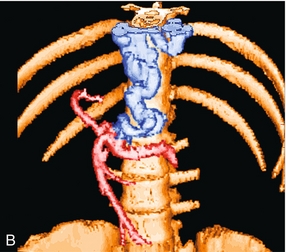
FIGURE 8-20 (A) Anterior view of a colour-coded shaded surface display 3-D rendering of a CT angiogram/portal venous phase in a patient with portal hypertension and splenomegaly. Short gastric varices (green) are best imaged from the left flank using the spleen as a sonographic window. The left gastric varix (red) is best imaged through the left lobe of the liver. (B) Anterior view of a colour-coded shaded surface display 3-D rendering of the portal vasculature in a patient with portal hypertension. The portal venous system is coloured red. The vessel coded blue is a large left gastric varix. Note the serpiginous course of this vessel as it courses cephalad, eventually branching into multiple oesophageal varices.
In utero, oxygenated blood flows from the placenta up the umbilical vein to the left portal vein and then through the ductus venosus into the IVC and right atrium. After birth, this pathway involutes and the umbilical vein remnant becomes the ligamentum teres in the falciform ligament. In portal hypertension, paraumbilical veins in this ligament or the umbilical vein itself can dilate and carry blood from the left portal vein along the anterior abdominal wall to the umbilical region (Fig. 8-21). From the umbilicus, the blood may pass to the superior or inferior epigastric veins, or through subcutaneous veins in the anterior abdominal wall, known as the ‘Caput Medusa’, to reach the systemic circulation. Because inferior epigastric varices run just deep to the rectus muscles, they are not apparent on clinical examination but are easily identified by colour Doppler (Fig. 8-22). Patients with known portal hypertension, who present with an umbilical hernia, should undergo imaging evaluation prior to surgery as the hernia may contain a dilated varix, rather than bowel. This pathway has less risk of life-threatening variceal bleeding.30
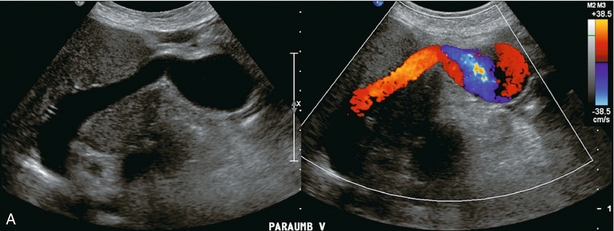
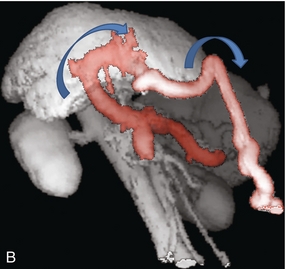
FIGURE 8-21 (A) Longitudinal colour Doppler image of a patient with portal hypertension. A large vein carries flow from the left portal vein towards the transducer. It courses along the falciform ligament and then turns caudad along the abdominal wall passing towards the umbilicus, deep to the rectus muscles. (B) Shaded surface display three-dimensional reformat of the upper abdominal solid organs and portal venous system. Flow in the main portal vein courses towards the liver but immediately channels into a large left portal vein (open arrow). Flow then continues anteriorly towards the anterior abdominal wall and down towards the umbilicus in a large recanalised umbilical vein (pink).
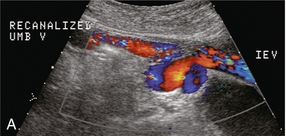
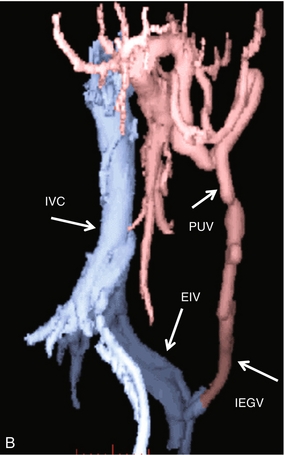
FIGURE 8-22 (A) Longitudinal colour Doppler image directly over the umbilicus. A recanalised umbilical vein carries blood towards the umbilicus. No caput medusa was present in this patient since flow drains from the umbilical region via the inferior epigastric vein (IEV). (B) Right lateral view of a colour-coded shaded surface display 3-D rendering of the portal vasculature in a patient with a large recanalised umbilical vein. The umbilical vein (UV) courses towards the umbilicus. From there flow continues back to the systemic circulation via the left inferior epigastric vein (IEGV) to the left external iliac vein (EIV) and eventually the inferior vena cava (IVC).
Splenorenal-mesenteric collaterals are typically quite large, elongated and very tortuous. Spontaneous splenorenal varices are almost never a direct communication between splenic and renal veins. They are seen in the left flank taking an extremely convoluted course, often extending between diaphragm and pelvis (Fig. 8-23). Very often this pathway arrives at the renal vein via the left gonadal vein.
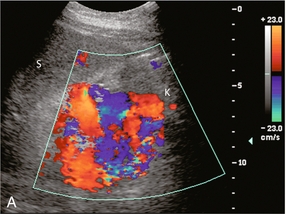
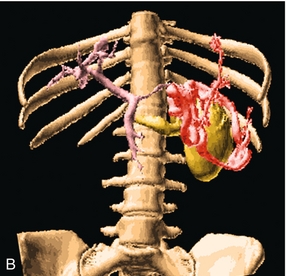
FIGURE 8-23 (A) Longitudinal colour Doppler image of the left flank. A large varix occupies the space between the splenic hilum (S) and the left kidney (K). This represents a convoluted splenorenal varix. (B) Anterior view of a colour-coded shaded surface display 3-D rendering of the portal vasculature in a patient with portal hypertension. The portal venous system is shaded pink. The red vessel represents a large serpiginous splenorenal varix. The kidney and its renal vein are illustrated in yellow. (The spleen has been removed for ease of visualisation of this varix.)
Pericholecystic varices can occur in the gallbladder wall and are associated with portal vein thrombosis. It is common to find pericholecystic varices associated with cavernous transformation of the portal vein. US imaging may reveal cystic or tubular structures in the gallbladder wall. These should not be confused with the Rokitansky Aschoff sinuses of hyperplastic cholecystosis. Colour Doppler is useful to show flow within these vessels; with the spectral tracing showing portal venous flow profile (Fig. 8-24). From the gallbladder, subhepatic collaterals communicate with the abdominal wall and subcostal veins.
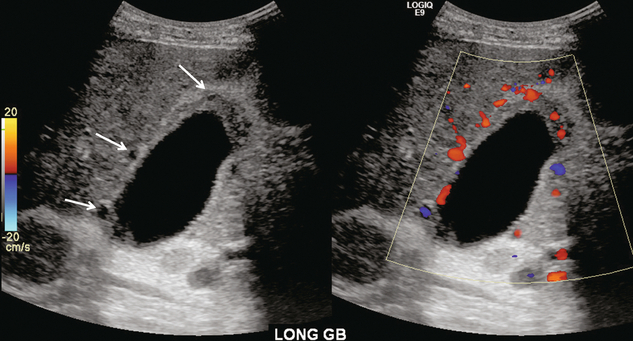
FIGURE 8-24 Grey scale and colour Doppler images of the gallbladder in a patient with portal hypertension and a history of portal vein thrombosis. Several cystic areas are seen in the gall bladder wall. Colour Doppler reveals that these are blood vessels and not sinuses from chronic cholecystitis. Spectral Doppler revealed a portal vein waveform as would be expected in varices and not an arterial waveform as would be seen in the cystic artery. Gallbladder wall varices are seldom seen without portal vein thrombosis.
Portal Vein Thrombosis
Portal vein thrombosis may be completely asymptomatic in patients with cirrhosis; however, more than half of cases present with life-threatening complications, such as gastrointestinal haemorrhage or intestinal infarction.31,32 Portal vein thrombosis must be considered when no Doppler signal is detected within the portal vein. It may be due to blood clot, or to tumour invasion. However, the examiner should first review the scanner set-up and re-evaluate scale, gain, and filtration settings (Fig. 8-3). If these are found to be set appropriately and there is still no perceptible flow, the patient should be asked to perform a Valsalva manoeuvre. This elevates intrathoracic and right atrial pressure, transmitting higher pressure to the IVC, hepatic veins and subsequently into the liver parenchyma. This increased pressure causes even greater resistance to portal venous inflow and may convert stagnant portal flow to hepatofugal flow (Fig. 8-25) thereby decreasing the risk of misdiagnosis of thrombosis. If available, one may also consider the use of intravenous US contrast to enhance perception of very slow flow.33
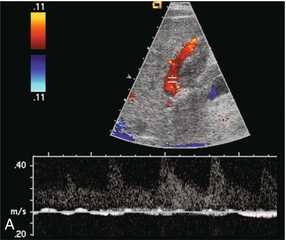
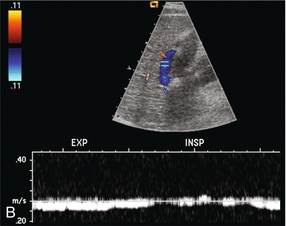
FIGURE 8-25 (A) Spectral Doppler tracing of a patient with end-stage liver disease being considered for liver transplantation. With neutral breath-hold, flow in this portal vein is barely perceptible. It oscillates between hepatofugal during arterial systole and hepatopetal during arterial diastole. (B) When instructed to forcefully breathe in and out, this patient’s portal flow became more dynamic. During forced expiration with elevated intrathoracic pressure there is increasing resistance to hepatic venous outflow forcing portal vein flow to become hepatofugal. During inspiration with negative intrathoracic pressure, this decreases the resistance to hepatic venous outflow, thereby causing flow to become almost stagnant. Note also that colour Doppler flow in the portal vein is reversed from the prior image, simply by the change in intrathoracic pressure.
Early thrombosis of the intrahepatic portal vein branches may be difficult to visualise with US imaging alone as fresh clot can be of similar echogenicity to the adjacent liver (Fig. 8-26). As clot matures, it becomes more echogenic and retracts, allowing partial recanalisation of the portal vein (Fig. 8-27). Patients with long-standing portal vein thrombosis may develop collateral flow into the liver via a lace-like network of veins. This is known as cavernous transformation of the portal vein or cavernoma.34 The absence of a clearly definable portal vein is the notable finding on greyscale imaging alone. Colour Doppler reveals a web of numerous serpiginous small veins which typically involve a fairly wide area of the liver hilum (Fig. 8-28). Spectral Doppler shows portal flow in the branches of the cavernoma.
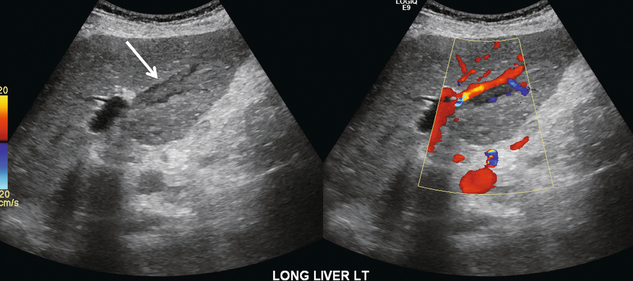
FIGURE 8-26 Oblique colour Doppler image of the left portal vein. The pulse repetition frequency is appropriately set at a low level. A tubular echogenic plug of thrombus is seen within the left portal vein (arrow). Its echogenicity is very similar to that of the adjacent liver parenchyma. The colour image shows a small trickle of flow between the vessel wall and the clot.
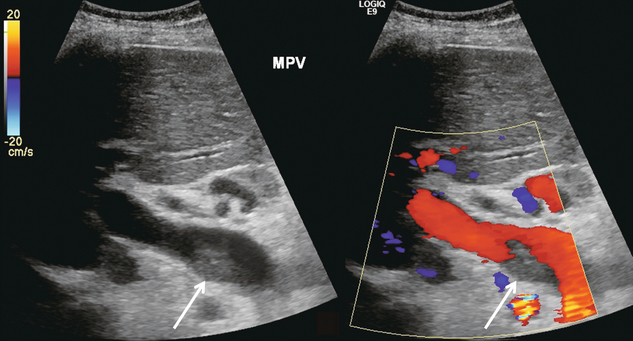
FIGURE 8-27 Oblique colour Doppler along the porta hepatis. An echogenic clot is adherent to the posterior wall of this enlarged portal vein. Colour Doppler shows flow coursing around it. This patient with a long-standing history of hypercoagulability has been successfully managed with anti-coagulant therapy.
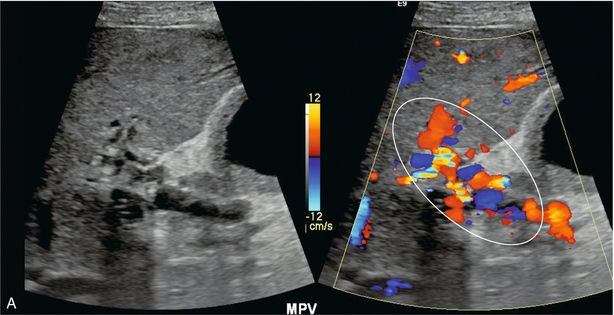
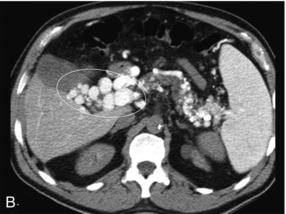
FIGURE 8-28 (A) Oblique greyscale and colour Doppler image of the porta hepatis. A normal portal vein could not be visualised. Instead there is a plexus of small vessels with tortuous, but mostly hepatopetal flow (circled). After portal vein thrombosis this web of vessels reconstitutes portal flow to the liver and is known as cavernous transformation of the portal vein. (B) Axial contrast-enhanced CT scan at the level of the porta hepatis. Note the numerous tributaries of this portal cavernoma after portal vein thrombosis.
Neoplastic Invasion
HCC has a propensity to invade the portal and hepatic veins. Intravascular tumour is classified as stage IV disease and is considered unresectable. Involvement of the portal vein by tumour may cause an increase in its cross-sectional area and a decrease in portal vein flow. Tumour in the portal vein receives its blood supply from the hepatic artery and spectral Doppler of the ‘thrombus’ will show an arterial waveform. Arterial velocities usually project in a hepatofugal direction, supplying the tumour as it grows out of the liver. Bland thrombus will not manifest such a tracing on Doppler, so that invasive tumour can be differentiated from bland thrombus and the diagnosis of stage IV HCC with vascular invasion confirmed (Fig. 8-29).35,36
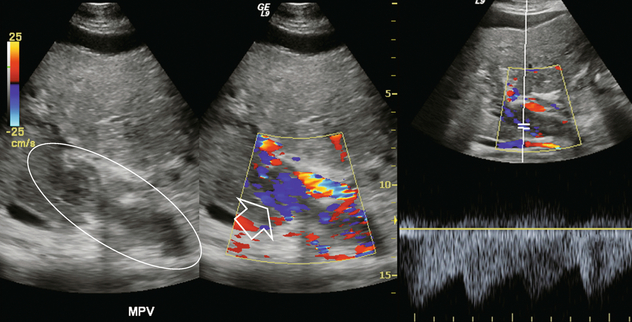
FIGURE 8-29 Greyscale imaging, colour Doppler and spectral Doppler tracing over the portal vein in a patient with known advanced hepatocellular carcinoma (HCC). Echogenic material fills the portal vein. Colour Doppler shows numerous small vessels with flow but in a hepatofugal direction. Spectral Doppler tracing over these vessels shows a very low-resistance arterial waveform. This is vascular invasion of the portal vein by hepatocellular carcinoma. The tumour originates in the liver and grows outward; therefore, the arterial supply runs in a hepatofugal direction. This is tumour neovascularity, therefore, resistance is low.
Portal Vein Aneurysm
Aneurysm of the portal vein has been reported, but it is extremely rare. The vein may enlarge to a diameter of 3 cm or larger. Spectral Doppler should be applied to confirm a portal vein waveform and rule out hepatic artery aneurysm since the latter carries a much higher incidence of complications and rupture.37
Portal Vein Gas
Air bubbles may be seen in the portal vein and its branches in a variety of gastrointestinal disorders, such as sepsis, obstruction with distension, necrotising enterocolitis, infarction or ulceration. Numerous tiny hyperechoic foci can be seen in the portal vein, flowing into the liver. Since these bubbles are moving fairly rapidly, their perception is best with high temporal resolution. This is accomplished by limiting the field of view to the area of the portal vein, scanning with a single focal zone and minimising, or turning off, frame averaging. The spectral Doppler tracing reveals sharp bidirectional spikes superimposed on the Doppler tracing of the portal vein. These spikes do not reflect a higher velocity of the air bubbles but are due to artefact resulting from the system being set to the strength of reflected signal from red blood cells. Since air bubbles are much more intense reflectors, their echoes register as spikes of noise on the tracing (Fig. 8-30).38
FIGURE 8-30 Spectral Doppler tracing of the portal vein in a patient with pneumatosis intestinalis. The spikes present in this spectral Doppler tracing are caused by air bubbles in the portal vein. These bubbles are travelling at the same velocity as the rest of the blood in the portal vein, but with the spectral gain set for blood, the intense sound reflection caused by the passing air bubbles creates spikes of noise.
HEPATIC ARTERY
A comparison of hepatic arterial velocities with those of the portal vein may be used as an indicator of liver disease. The normal portal vein velocity in a fasting patient is about 18 cm/s, the normal systolic velocity in the hepatic artery is 25–40 cm/s and 10–15 cm/s in diastole. If the waveforms of the hepatic artery and portal vein can be captured simultaneously on a Doppler tracing, the normal hepatic arterial diastolic velocity will therefore be seen to dip just below that of the portal vein (Fig. 8-5).
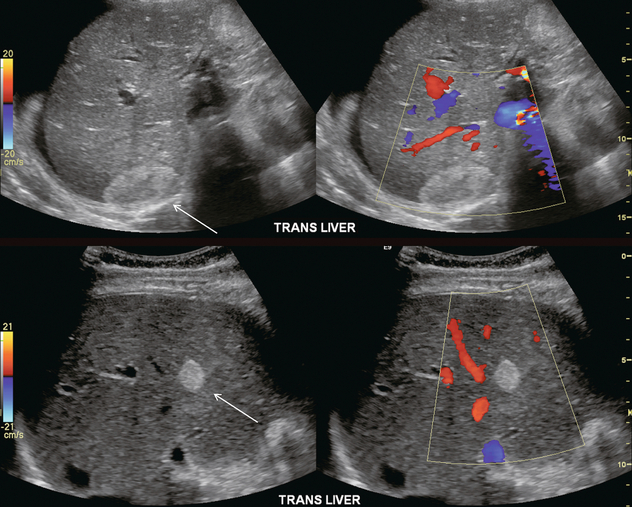
Almost all liver disease processes receive their blood supply primarily from the hepatic artery. As the process becomes more severe, or involves a larger area of liver, hepatic artery velocities increase. As liver disease worsens, portal venous inflow encounters progressively increasing resistance. This results in decreased hepatopetal portal velocity. Therefore, if the Doppler examination shows hepatic arterial diastolic velocities twice or more than that of the portal vein, the liver parenchyma should be carefully evaluated to identify possible focal lesions or diffuse distortion of echotexture.18 This finding, however, is non-specific and can be seen with neoplasm (both primary and metastatic), infection (viral, bacterial, parasitic or fungal), severe steatosis or ingestion of toxins (acetaminophen overdose) (Fig. 8-31).39 Benign conditions such as haemangioma or focal, geographic steatosis do not perceptibly affect main hepatic artery or portal vein flow (Fig. 8-32).
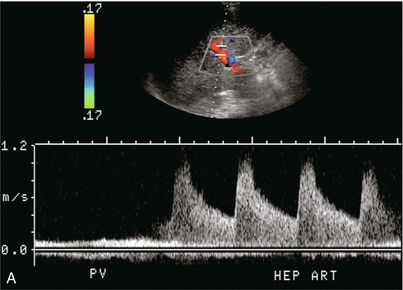
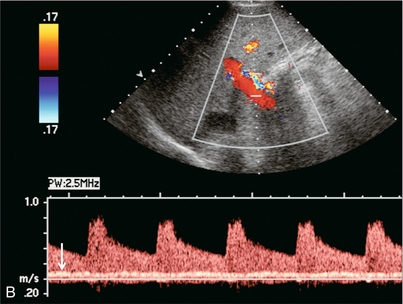
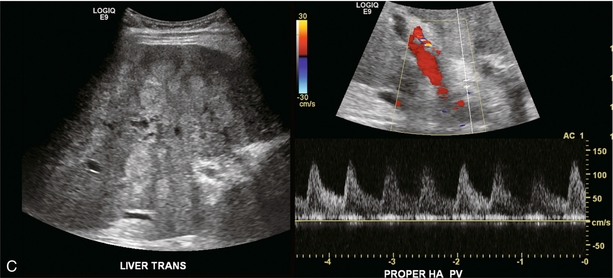
FIGURE 8-31 (A) Spectral Doppler tracing of the porta hepatis in a patient with biopsy-proven chemical hepatitis. This tracing was obtained by a slight change in orientation of the transducer during the scan, traversing from portal vein to the hepatic artery. Hepatic arterial velocities are markedly increased with low resistive index and high diastolic flow. Portal vein flow has decreased to the point where it is barely perceptible. (B) Combined hepatic artery and portal vein tracing at the porta hepatis in a patient with HIV. In contrast to (A) this tracing was obtained with a sample volume opened wide, including the flow profiles of both the hepatic artery and portal vein in the same tracing. Similar alteration in velocities is again perceived with bounding arterial flow and markedly diminished portal vein inflow. (C) Ultrasound image of the liver and combined Doppler tracing of the porta hepatis in a patient with metastatic lung cancer. The bounding arterial flow is supplying the rapidly growing tumour metastases. Portal venous flow is decreased as the liver sinusoids are being replaced by tumour.
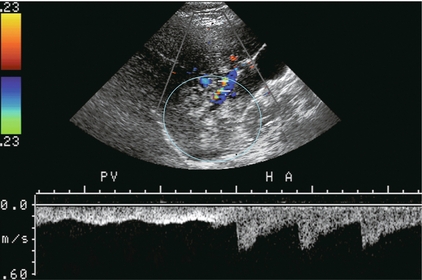
FIGURE 8-32 Transverse image of the right lobe of the liver. A geographic echogenic area is perceived in the inferior aspect of the right lobe (circle). The postero-inferior branch of the right hepatic artery and vein are interrogated by spectral Doppler. The hepatic artery and portal vein supplying this mass reveal normal flow profiles and velocities. The ratio of flow is not altered between the two vessels. Biopsy proved this mass to be focal fatty infiltration.
Hepatic artery resistance has been studied in several disease states. Alterations in resistance may be observed but, to date, have not been shown to be sufficiently specific or sensitive in the diagnosis of any one particular condition.40,41 Rapid onset of oedema or inflammation of the liver may produce a substantial amount of congestion, leading to higher resistance to hepatic arterial inflow and elevation of the RI. Elevated RI in the hepatic artery has been reported as a predictor of fulminant and severe acute liver failure.42 Hypervascular disorders, especially those with arterial venous shunting, such as neoplasm, can lower the arterial resistance. A tardus-parvus waveform and low-resistance flow may also be perceived downstream from hepatic arterial inflow obstruction such as with hepatic artery stenosis, or a diaphragmatic crus defect of the celiac axis. This is also known as arcuate ligament syndrome and is most often seen in slender females. The hepatic artery tracing can change from normal to tardus-parvus between inspiration and expiration. This waveform variation is diagnostic of this condition and is caused by a changing degree of compression of the celiac axis as the patient breathes. It is further reinforced by the identification of aliasing and a high-velocity jet in the celiac artery (Fig. 8-33).
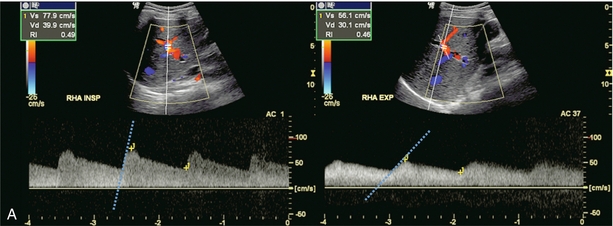
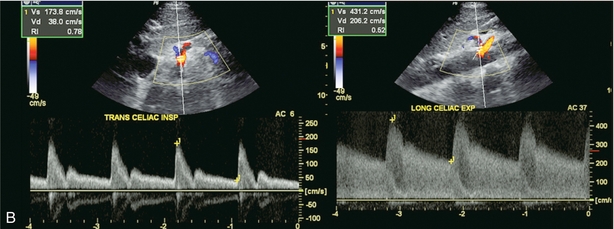
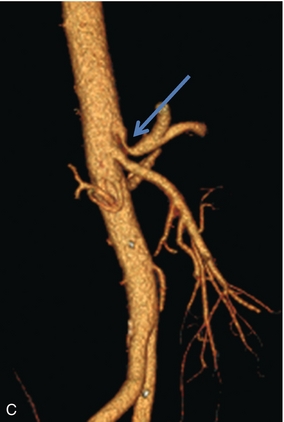
FIGURE 8-33 (A) Spectral Doppler tracing of the right hepatic artery taken in inspiration and expiration in a young patient with upper abdominal pain. The waveform, in inspiration, shows a moderate tardus-parvus configuration. Upon expiration however, it significantly worsened. There is a slow upstroke in systole and a very low resistive index. This indicates inflow compromise which varies with breathing. (B) Spectral Doppler tracing of the celiac artery also in inspiration and expiration. The waveform in inspiration appears completely normal. In expiration, however, it becomes very turbulent with a velocity greater than 4 m/s. (C) CT angiography confirms celiac artery compression by the arcuate ligament of the diaphragm. The origin of the celiac artery is markedly narrowed and pinched against the aorta.
Hepatic Artery Aneurysm/Arteriovenous Fistula
Most hepatic artery aneurysms are extrahepatic and may be congenital or acquired. Pancreatitis, trauma, or liver biopsy are the most common aetiologies. Mycotic aneurysms can be seen in immune-compromised patients, those with bacterial endocarditis or those abusing intravenous drugs. Sonography demonstrates a rounded area with swirling flow on colour. The spectral tracing is usually quite distorted due to turbulence. A clot may eventually develop within the aneurysm or pseudoaneurysm (Fig. 8-34).
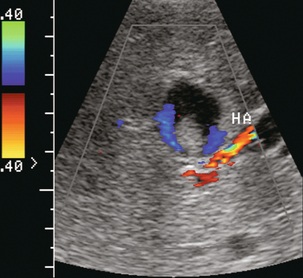
FIGURE 8-34 Transverse colour Doppler image of the mid-liver. A rounded lesion is present with some internal debris. Flow is perceived around this debris. A turbulent arterial spectral Doppler waveform was identified at the neck. Angiography confirmed that this was a partially thrombosed intrahepatic hepatic artery aneurysm.
In this era of percutaneous intervention for diagnosis, if biopsies are performed closer to the centre or hilum of an organ, there is greater risk of an arteriovenous fistula developing. Hepatic arterial inflow can fistulise to either the hepatic veins (Fig. 8-35) or portal vein (Fig. 8-36A). Colour Doppler findings depend upon the scale settings. With a relatively low PRF, the vibration of adjacent tissues induced by the fistula causes a flash of colour artefact. With a higher PRF, the feeding artery and draining vein may be more easily identified along with the nidus of the fistula. Spectral Doppler flow profiles show low-resistance arterial inflow with high velocities, and arterialisation of the venous outflow vein (Fig. 8-36B).43,44
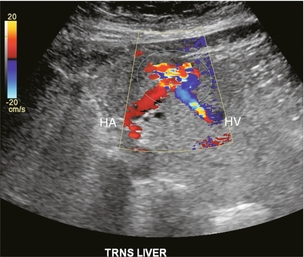
FIGURE 8-35 Transverse colour Doppler image of the mid-liver. The patient had undergone a liver biopsy two months prior. A prominent area of marked turbulent disordered colour flow represents the nidus of the arteriovenous fistula. A large feeding hepatic artery enters from one side. An enlarged draining hepatic vein with turbulent flow is seen coursing away from the lesion.
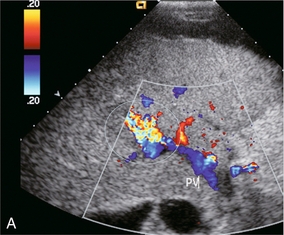
FIGURE 8-36 (A) Transverse colour Doppler image of the mid-liver. Flash artefact is seen in the mid-liver. This is due to tissue vibration adjacent to a large arteriovenous fistula. Flow in the portal vein is hepatofugal. This is due to a combination of the underlying liver disease and shunting of blood at the fistula. (B) Spectral Doppler tracing just proximal to the fistula. Very high-velocity, turbulent, low-resistance arterial flow pours into the fistula. The venous outflow is arterialised.
Hereditary Haemorrhagic Telangiectasia (Osler–Rendu–Weber Disease)
This disease is characterised by multiple small aneurysmal telangiectases distributed over the skin, mucous membranes, alimentary tract, liver, brain and spleen. These patients have a tendency for frequent haemorrhages requiring transfusion. Vascular lesions in the liver can evolve into arterial venous fistulas and aneurysms. Ultrasound may reveal large hepatic arteries feeding large, ectatic, serpiginous arteriovenous malformations, which in turn feed large draining veins.45,46
Hepatic Venous Outflow Obstruction
When most of us hear the term Budd–Chiari syndrome we assume hepatic vein thrombosis. Budd–Chiari syndrome, however, refers to liver dysfunction caused by a wide array of conditions that compromise hepatic vein outflow, both thrombotic and non-thrombotic. The term hepatic venous outflow obstruction (HVOO) is now preferred over Budd–Chiari syndrome. Spectral and colour Doppler are capable of identifying numerous non-thrombotic causes of HVOO and differentiating them from hepatic vein thrombosis. Aetiology may be related to pregnancy, tumour, hypercoagulable state or IVC membranes, but the majority of cases are idiopathic. The clinical presentation of HVOO will vary, depending upon how rapidly it develops and the degree of obstruction. Approximately 50% of patients first present with RUQ pain and hepatomegaly. Almost all develop ascites, while a few progress to mild jaundice. Patients with chronic, partial obstruction may develop cirrhosis and portal hypertension. If the obstruction progresses to complete occlusion, then shock, hepatic coma and death may ensue.9,47
Sonographic imaging features of HVOO may include echogenic intraluminal material (either thrombus or tumour), diffuse narrowing and compression of the veins from generalised liver swelling, or focal vascular compromise by a mass. Doppler findings include complete absence of hepatic vein flow (Fig. 8-37) or localised flow disturbances due to focal partial obstruction. With a more proximal obstruction, the central portions of the hepatic veins (distant from the IVC) that remain patent will become distended and display low-velocity continuous flow, rather than the periodicity seen when the venous flow continues unimpeded to the right atrium. Finally, liver congestion due to HVOO will also cause flow abnormalities in portal vein flow, such as diminished hepatopetal, bidirectional or hepatofugal (reversed) flow. The diagnosis of complete thrombosis by US imaging is difficult since the echogenicity of the clot is often similar to that of the adjacent liver parenchyma. Because the identification of absent blood flow by Doppler is an exclusionary diagnosis, it is difficult to determine with absolute certainty that the cause is thrombosis.
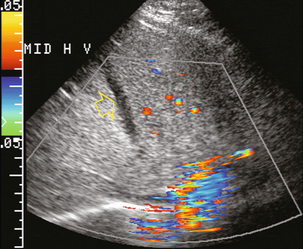
FIGURE 8-37 Transverse colour Doppler image of the upper liver. Even with maximised Doppler sensitivity, no flow was perceived in the middle hepatic vein of this patient (arrow). The hepatic vein had become thrombosed when a central line was inadvertently advanced through the heart into the inferior vena cava and up into the middle hepatic vein. This relatively acute thrombus is hypoechoic compared to the surrounding liver parenchyma. As thrombus matures, however, the echogenicity tends to become isoechoic with the adjacent liver and the thrombus becomes harder to perceive.
Hepatic vein thrombosis most commonly occurs in patients with a hypercoagulation disorder. For instance, females using oral contraceptives have a two and a half time’s increased risk of hepatic vein thrombosis. Hepatic vein injury and phlebitis may also predispose to thrombosis, but in two-thirds of cases, the cause is unknown. The caudate lobe has a separate venous drainage to the IVC. The smaller veins are usually spared from thrombosis, resulting in caudate enlargement and a more normal appearance on contrast-enhanced CT (Fig. 8-38). Occasionally, thrombosis is limited to only one or two of the hepatic veins, resulting in intrahepatic shunting of blood from the affected lobe to the unaffected side through hepatic venous collaterals (Fig. 8-39).
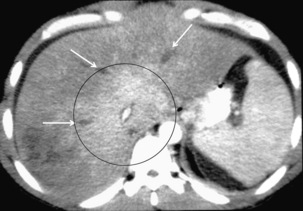
FIGURE 8-38 Contrast-enhanced axial CT of the mid-liver. The caudate lobe and central portion of the liver are uniformly enhancing (encircled), but peripherally the enhancement is decreased and irregular. No contrast is seen within the three hepatic veins because they are thrombosed (arrows).
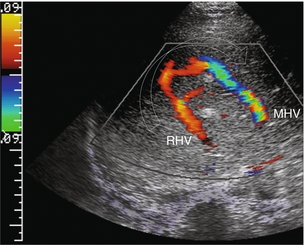
FIGURE 8-39 Transverse colour Doppler view of the mid-liver in a patient with catheter-related inferior vena cava thrombus that obstructed the ostium of the right hepatic vein. Flow in the right hepatic vein (RHV) is reversed and coursing towards the transducer. A prominent collateral vein (arrow) then carries flow to the middle hepatic vein (MHV) and back towards the heart. Intrahepatic veno-venous collateralisation develops quickly in response to focal hepatic venous outflow obstruction of a single branch.
Membranous obstruction (fibrous web) of the IVC has been reported as one of the major causes of HVOO in South Africa and Asia. The aetiology of these is probably acquired since chronic hepatitis B infection is common in these patients, and up to 50% develop HCC. The hypothesis of congenital membranous obstruction of the IVC has faded and the membrane is now considered to be a sequela of thrombosis. The web is usually at, or just above, the level of the hepatic vein ostia; with resultant damping of cardiac periodicity into the IVC and the hepatic veins and flattening of the Doppler waveform.48
Diffuse hepatic parenchymal disease resulting in a reduction of liver compliance can easily compromise hepatic venous drainage as it is a low-pressure system (basically the same as the right atrium; i.e. −2/+ 7 mmHg). Both oedema from acute inflammation and fibrosis from chronic parenchymal disease can narrow the hepatic veins, producing HVOO. Some periodicity may be perceived in close proximity to the junction of the hepatic veins with the IVC, but it quickly fades as the sample volume is moved further away from the heart (Fig. 8-40).49–51
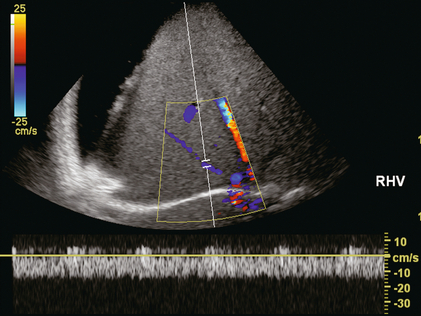
FIGURE 8-40 Transverse image of the liver in a patient with severe cirrhosis and ascites. The liver is small, nodular and very echogenic. The spectral Doppler tracing of the right hepatic within the liver confirms patency but flow is markedly compromised by compression of this vessel. There is complete absence of periodicity and a relatively slow velocity.
Non-thrombotic occlusion of small hepatic veins (hepatic veno-occlusive disease) can occur in bone marrow transplant recipients, secondary to chemotherapy or radiation therapy or with alkaloid toxicity. The obstruction of terminal hepatic venules presents as jaundice, hepatomegaly, pain, ascites and altered liver functions. If the associated coagulopathy is severe, it may preclude biopsy for diagnosis. Spectral Doppler of the hepatic veins typically shows a normal flow profile. Portal vein inflow velocities, however, decrease and may actually reverse. Hepatic artery flow develops increased resistance when the process becomes severe (Fig. 8-41).52,53
FIGURE 8-41 Transverse image of the liver in a recent bone marrow transplant recipient with worsening liver function tests. This spectral tracing incorporates both artery and portal vein. Note the alteration of the liver vascular index. Portal vein inflow is very slow. Hepatic arterial velocities, however, are still appropriate. This was biopsy-proven venoocclusive disease.
Near the heart, the normal spectral Doppler tracing of the hepatic vein has a small retrograde component of flow above the baseline, the A-wave (Fig. 8-12). It is relatively small when compared to the antegrade components below the baseline: the S- and D-waves. The ratio of retrograde to antegrade flow decreases during inspiration (which lowers intrathoracic pressure) or when the Doppler sample volume is moved further from the heart (Fig. 8-42). A consistently large component of retrograde flow is an abnormal finding, and if identified, the examiner should consider the presence of cardiac or pulmonary disease (Fig. 8-43). Distortion of the triphasic hepatic vein waveform can occur with many different cardiac disorders including cardiomyopathy, constrictive pericarditis, tamponade, tricuspid or pulmonary valve disease, atrioventricular dissociation, atrial fibrillation and right ventricular dysfunction. Pulmonary hypertension and massive pulmonary embolism may also distort the hepatic vein waveform. Basically, any condition restricting cardiac inflow will compromise hepatic outflow.
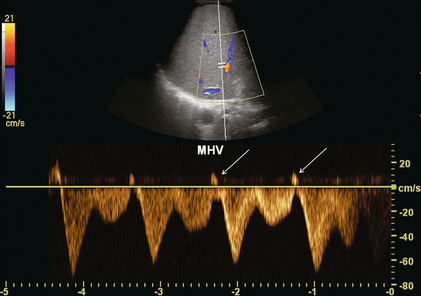
FIGURE 8-42 Transverse spectral and colour Doppler view of the middle hepatic vein. The sample volume is more centrally positioned in the liver. At this distance from the heart, although there is still robust periodicity, the reversed component of flow is actually quite small.
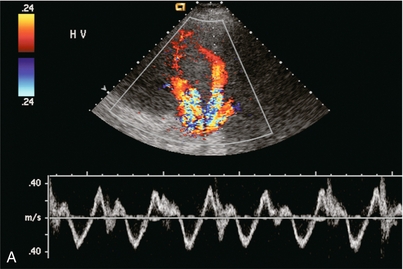
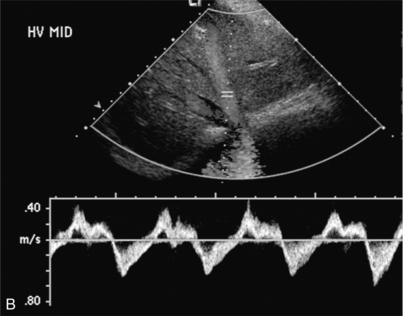
FIGURE 8-43 (A) Transverse spectral and colour Doppler view of the hepatic veins. The hepatic veins are markedly engorged as would be expected with chronic cardiac congestion. Spectral Doppler waveform shows appropriate periodicity within these vessels. The overall amount of retrograde flow, however, is disproportionately large. When summating the area of flow above and below the baseline it becomes apparent that there is relatively little total antegrade flow as would be expected with cardiac congestion. (B) Spectral Doppler tracing in another patient with cardiac congestion. Although periodicity is identified in the tracing it is more disordered than the standard triphasic waveform. Flow away from the heart (above the baseline) is only slightly less than flow towards the heart (below the baseline). This decreased total antegrade flow is a manifestation of cardiac congestion.
Tricuspid regurgitation (TR) results in a large volume of blood pushed back through a diseased/incompetent tricuspid valve by the forceful contraction of the right ventricle. In mild TR, the hepatic vein flow profile is characterised by attenuation of the S-wave and a relative increase in V-wave amplitude. In severe TR, systolic reversal of the S-wave and fusion of the S- and V-waves is seen. Instead of forward flow filling the atrium during atrial diastole, the high right ventricular systolic pressure forces blood back through the tricuspid valve into the IVC and the hepatic veins54,55 (Fig. 8-44).
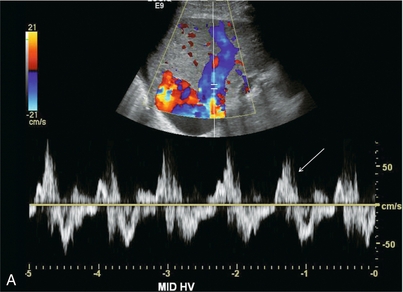
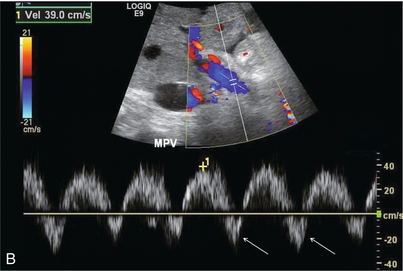
FIGURE 8-44 (A) Spectral Doppler tracing of the hepatic vein in a patient with severe tricuspid regurgitation. The hepatic vein waveform is distorted and basically biphasic. The reversed component of flow is disproportionately large. In the absence of an ECG tracing it is impossible to determine whether this is a reversed S-wave due to tricuspid regurgitation versus a Canon A-wave due to right ventricular dysfunction. Recognition of an inappropriately large retrograde component of flow in conjunction with a disordered waveform and large distended hepatic veins, however, should be enough to channel a patient such as this for a cardiac workup. (B) Spectral Doppler tracing of the portal vein. Instead of uniform flow this waveform is sinusoidal with a brief component of reversed flow. This finding further reinforces the need for a cardiac workup since the retrograde pressure wave of the hepatic vein flow profile is able to resist and actually reverse portal vein inflow.
With atrial arrhythmias, the A-wave may have a varying relationship to the S-wave due to premature atrial contraction or a variable PR interval as seen in Mobitz I heart block. In atrial flutter, multiple small- amplitude A-waves may be present. The lack of organised atrial activity in atrial fibrillation leads to the loss of rhythmic A-waves in the hepatic vein tracing (Fig. 8-45).
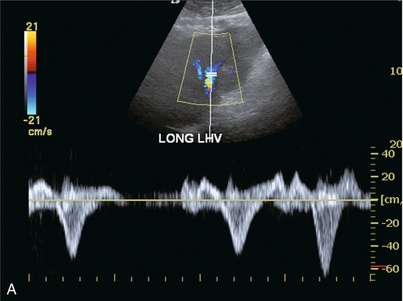
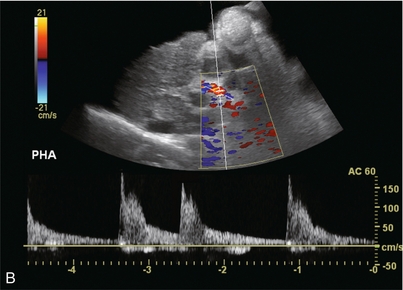
FIGURE 8-45 (A) Spectral Doppler tracing of the left hepatic vein. There is complete distortion of the triphasic waveform. Surges of antegrade flow are not rhythmic. There are reversed components of flow but nothing that resembles an A-wave. (B) Spectral Doppler tracing of the hepatic artery. Arrhythmia is clearly evident by temporal distortion of the systolic spikes.
The precise diagnosis of HVOO caused by cardiopulmonary dysfunction requires correlation of the hepatic vein waveform with the ECG tracing (further refined by correlating with the tricuspid M-mode tracing). The average ultrasound department does not have routine access to these tools. Nevertheless, recognition of hepatic vein waveform distortion, especially with accentuated reversed components of flow should identify the patient who would benefit from further work-up in a cardiac echo lab (Fig. 8-46).
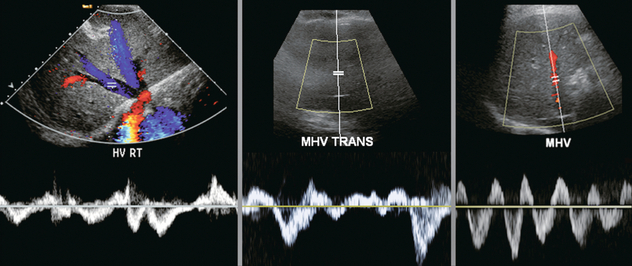
FIGURE 8-46 Spectral Doppler tracing of a hepatic vein in three different patients. None of them is normal. Without an ECG tracing, the precise diagnosis cannot be made. Nevertheless, recognition of a functional hepatic venous outflow obstruction is sufficient to identify the heart as the potential cause of disordered liver function tests and channel the patient’s workup towards cardiology.
Arterialised Hepatic Vein Flow
An arterial waveform within the hepatic veins is an extremely rare finding. It may be seen with a fistula from the hepatic artery to the hepatic vein following biopsy or surgery (Fig. 10-31). Rarely, erosion of a hepatic artery aneurysm into the hepatic vein will result in pulsatile arterial flow in the veins.
FOCAL LIVER LESIONS – MALIGNANT
Hepatocellular carcinoma (HCC) is the most common primary malignant neoplasm of the liver. It occurs primarily in patients with underlying chronic liver disease, such as hepatitis B or C infection, or alcoholic cirrhosis. US is part of screening for hepatocellular carcinoma in high-risk countries where screening programmes exist. Non-contrast enhanced US, however has difficulty detecting HCC on a background of nodular cirrhosis, with a sensitivity of only 50%. Specificity is even worse. The distorted, nodular echo-texture of the cirrhotic liver parenchyma, together with the tumour’s variable sonographic appearance, makes it difficult to distinguish HCC with confidence.56–58
HCC is typically a hypervascular neoplasm and several authors have promoted the use of spectral and colour Doppler in helping with its diagnosis. Tumour neovascularity with intratumoral arterio-venous shunting, results in decreased vascular impedance and a low-resistance Doppler waveform. A basket pattern of flow within the lesion on colour Doppler has been described in HCC; the internal branching vessels within the tumour, combined with the network of surrounding vessels being responsible for this appearance. However, these findings can occur in other conditions and so the specificity is low. A low-RI, high-velocity flow with systolic frequency shifts approximating 3 m/s may be seen in the feeding arteries; but there is too much overlap with other conditions, so again specificity is low.59
Vascular invasion is a hallmark of advanced HCC. Any echogenic plug of tissue within the portal vein should be interrogated with spectral and colour Doppler. The presence of an arterial signal, usually hepatofugal, within the plug makes the diagnosis.35 HCC invades portal veins (Fig. 8-29) more frequently than hepatic veins.
Metastasis
Metastatic liver lesions occur with a frequency 20 times greater than primary hepatic neoplasms. The sonographic appearance is markedly variable, but most often has a target pattern or halo sign. The hypoechoic rim surrounding the lesion is caused by compressed liver parenchyma, or by proliferating tumour at the edge of the lesion. Colour Doppler may reveal displacement of normal liver vasculature by the expanding metastatic lesion. Little if any flow is seen in the metastasis itself. Spectral Doppler can reveal low-resistance, high-velocity flow in the hepatic artery (Fig. 8-31C). However, this is not consistent enough to obviate the need for biopsy. Power Doppler imaging can assess vascularity in the majority of small liver nodules, but the pattern distribution of tumoral vascular signals does not provide reliable differential diagnostic criteria.60
FOCAL LIVER LESIONS – BENIGN
Hepatic Steatosis (Fatty Liver)
The liver can accumulate triglycerides within the hepatocytes in response to hepatocellular disease. This reversible cellular response may be seen with obesity, alcoholic liver disease, diabetes, parenteral nutrition, and numerous other disorders. Ultrasound commonly reveals a bright echogenic liver with poor through transmission. The central vasculature is often poorly visualised due to compression of these vessels by surrounding fat-laden parenchyma. Fatty infiltration can be patchy and irregular (geographic), with geometric margins or wedge-shaped sub-segmental distribution. Doppler ultrasound shows little change in the hepatic haemodynamics, or vascular distribution in focal steatosis or mild to moderate diffuse steatosis. Absence of velocity alterations is helpful in reinforcing the impression of mild benign fatty infiltration in cases where the imaging appearance is confusing (Fig. 8-32). If significant doubt exists, CT or MR can clinch the diagnosis. With severe steatosis, however, vascular compression will result in inflow resistance and loss of hepatic vein periodicity (Fig. 8-47).61
Haemangiomas
Haemangiomas are the most common solid benign neoplasms of the liver. On US, small haemangiomas (< 3 cm) are well-defined, homogeneous and hyperechoic. Echotexture becomes distorted with larger haemangiomas due to haemorrhage, fibrosis, or calcification. Doppler (without contrast) adds nothing to the diagnosis of haemangioma as the flow is typically too slow to register, even at the most sensitive settings (Fig. 8-48).
Focal Nodular Hyperplasia
Focal nodular hyperplasia (FNH) is the second most common benign solid tumour of the liver and makes up approximately 8% of all primary hepatic tumours, typically seen in young to middle-aged women. It is believed to be a hormone-dependent non-neoplastic, hyperplastic response to a congenital vascular malformation. Ultrasound reveals a solitary, small lesion, often at the periphery of the liver. The echogenicity is varied with hypo-, hyper-, and isoechoic FNH reported with equal frequency. A central scar has been reported as a dominant feature of FNH, however, it is seldom seen sonographically but, even if seen, it does not help clinch a benign diagnosis since fibrolamellar HCC often also has a central scar. FNH is typically hypervascular with a prominent central artery and radiating branches in a stellate or spoke-wheel configuration with centrifugal flow. This is a unique characteristic of this lesion (Fig. 8-49), but hard to see without US contrast.62,63
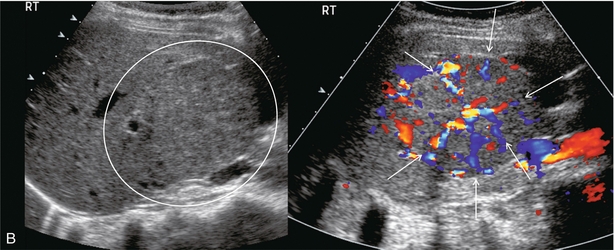
FIGURE 8-49 (A) Arterial phase of a contrast-enhanced CT scan through the upper liver. A briskly enhancing round mass with a central scar is clearly evident (encircled). (B) Ultrasound imaging and colour Doppler through the lesion reveals a mass with a faint central scar. With a little bit of imagination, one can see a spoke wheel distribution of the vasculature. Biopsy confirmed this lesion to be focal nodular hyperplasia. This diagnosis however, is made with much greater confidence when using ultrasound contrast or with contrast-enhanced MR or CT. (Figure courtesy of Paul Sidhu, MD.)
Adenoma
Hepatic adenoma, a rare benign liver tumour, is being seen with increasing frequency. In females it is related to oral contraceptive use, in males to anabolic steroids. Adenomas appear as solid masses with variable echogenicity due to differences in fat content or haemorrhage. Colour Doppler US sometimes demonstrates peripheral peritumoral and intratumoral vessels with spectral Doppler usually showing a flat or uncommonly, triphasic flow profile.64 In a small percentage of females with hepatic steatosis, the condition can progress to liver adenomatosis in which the tumours tend to increase size. Sonographic diagnosis however is difficult because of the variety of appearance.
Infantile Haemangioendothelioma
Infantile haemangioendothelioma is a rare liver tumour of infancy. It commonly presents as multiple lesions scattered throughout the liver with areas of infarction, haemorrhage and occasionally calcification. The tumour is composed of anastomosing vascular channels lined by one or more layers of endothelial cells. The incidence of congestive heart failure is high because of arterial venous (AV) shunting within the masses. It is considered a benign tumour and most gradually regress after presentation. Some children, however, succumb to the congestive heart failure associated with the high degree of AV shunting. The ultrasound appearance of these lesions usually shows mixed or variable echogenicity. Large feeding arteries and draining veins (Fig. 8-50) can be perceived by colour Doppler with turbulent flow on spectral Doppler.
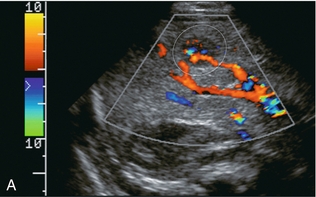
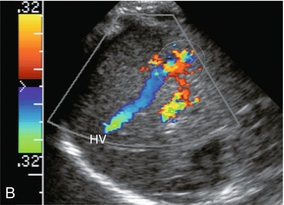
FIGURE 8-50 (A) Oblique colour Doppler image of the right lobe of the liver. A large feeding artery is identified with flow going into a tangled vascular malformation. (B) Longitudinal colour Doppler image. From the vascular malformation flow is seen draining into a large hepatic vein. Infantile haemangioendothelioma was confirmed at autopsy.
Monitoring Treatment of Portal Hypertension
SURGICAL PORTOSYSTEMIC SHUNTS
Numerous variants of surgical portosystemic shunting have been devised over the years including mesocaval, distal splenorenal (Warren), proximal splenorenal, portocaval, and mesoatrial shunts. As with any surgical anastomosis, stenosis or thrombosis may develop. Imaging of shunt integrity by Doppler ultrasound can be difficult because the shunt is usually retroperitoneal and hard to visualise. The sonographer must be informed of the exact type and location of the shunt in order to focus the examination in the correct region. If a prior CT or MR is available it should be reviewed prior to scanning. Brisk hepatofugal flow in the main portal vein is a secondary finding that predicts shunt patency, but the definitive diagnosis is made by direct visualisation of the shunt itself (Fig. 8-51). Spectral velocity measurement across the anastomosis, if possible, should show a velocity gradient of less than 4-fold. Invasive measurement of the pressure gradient across the anastomosis is definitive. Velocity gradients less than 4-fold tend to have insufficient pressure gradients to warrant the risk associated with balloon dilatation.
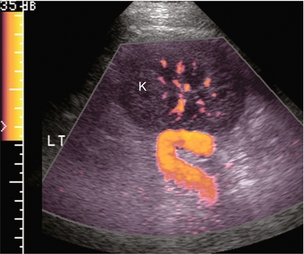
FIGURE 8-51 Oblique longitudinal view of the left flank focused at the upper pole of the left kidney; in a patient with a surgically created splenorenal shunt. A large candy-cane-shaped vessel is identified. The patient is status-post splenectomy with anastomosis of the distal splenic vein to the renal vein. Doppler confirms the anastomosis is widely patent. Fortuitously, the kidney provided a sonographic window in this patient. It is rare to be able to visualise surgical shunts this well.
TRANSJUGULAR INTRAHEPATIC PORTOSYSTEMIC SHUNTS
Treatment of portal hypertension and variceal bleeding by interventional diversion of portal flow as an alternative to surgery or sclerotherapy was first proposed in 1969.65 Transjugular intrahepatic portosystemic shunt (TIPS) is a percutaneously created communication between the high-pressure portal system of a cirrhotic patient and the low-pressure hepatic veins. Its most important role is to divert blood flow away from potential life-threatening haemorrhage of oesophageal varices. Endoscopic sclerotherapy or banding of oesophageal varices has the ability to treat a focal bleed but does not resolve the underlying cause. A recent advance in TIPS design (covering the frame with a fabric sheath) has led to a re-evaluation of treatment priorities.66
Pre-Procedural Assessment
Imaging evaluation is performed before TIPS placement to estimate liver size, evaluate for the presence of tumour, confirm patency of the portal vein and hepatic veins, rule out thrombosis, measure vessel size and search for the presence of portosystemic varices. This is best accomplished with CT angiography. Pre-procedural Doppler flow documentation provides a baseline for comparative appreciation of the results of the procedure; specifically changes in portal haemodynamics, spleen size and the amount of ascites. Any varices (especially left gastric and recanalised paraumbilical) should be identified prior to the procedure so that they may be occluded with coils.67
Post-Procedural Assessment
Unfortunately, TIPS complications are common; the most significant being progressive narrowing with compromised function and eventual thrombosis and occlusion. Clinical monitoring of TIPS function is insensitive. By the time clinical indicators such as ascites become evident, the TIPS is usually occluded. The best way to monitor a TIPS is with Doppler sonography at regular intervals. Prompt identification of a stenosis with timely intervention may prevent progression to thrombosis. A recently thrombosed TIPS may be recanalised successfully, but if the clot has time to mature then treatment usually requires placement of a second TIPS.68
Optimum scanning parameters and normal US findings following TIPS have been described by a number of investigators.69–72 Low-frequency transducers are necessary because of the increased echogenicity and sound-attenuating features of the cirrhotic liver, along with the fact that the shunt is deep within the body. Doppler gain should be set as high as possible, without encountering noise. The transducer is focused at the level of the shunt or vessel of interest. The sample volume is placed in the centre of flow with an angle of insonation less than 60ᵒ when feasible. This is not possible in the mid shunt, where the direction of flow runs perpendicular to the insonating beam. The pulse repetition frequency is set as low as possible, but avoiding aliasing. Scan parameters must be optimised to avoid a false-positive diagnosis of shunt thrombosis.72
Recent introduction of TIPS stents sheathed with thermo-mechanically expanded polytetrafluoroethylene (Gore-Tex) creates a unique problem for immediate post implantation imaging. The nature of the fabric causes trapping of air bubbles within its matrix. This air completely reflects sound and presents the appearance of an acutely thrombosed shunt. By 3–5 days after implantation this air becomes absorbed and visualisation of flow becomes possible. Doppler cannot be used to confirm patency in the immediate post-implant timeframe of a sheathed stent. The advantage of these stents is that the fabric prevents ingrowth of the neo-intimal hyperplasia often seen with traditional stents. Long-term patency rates are better.73–75
Normal Findings
The TIPS follow-up study begins with a survey of the liver to rule out development of tumour, fluid collections or biliary obstruction; and a quick look around the abdomen for ascites. The shunt is then localised, typically between the right portal and right hepatic veins. The stent should extend from within the portal vein, across the parenchyma, and into the hepatic vein. The stent is highly echogenic and appears as two parallel, curvilinear lines, relatively uniform in diameter in its intraparenchymal course but slightly flared at the portal and hepatic vein ends (Fig. 8-52). Imaging sometimes reveals malposition of the stent as a result of inappropriate deployment, or subsequent migration down into the portal vein, or up into the right atrium (Fig. 8-53). Transplant surgeons should be made aware of caval or atrial deployment of the proximal TIPS end since this puts them at risk of contracting hepatitis from the stent wires sticking out of the liver during native hepatectomy prior to transplantation.
FIGURE 8-52 Greyscale longitudinal image of the right lobe of the liver. The TIPS catheter is seen coursing from the portal vein to the junction of the right hepatic vein with the inferior vena cava (arrow). This long shunt is composed of two stent elements. Note the subtle narrowing at the mid-shunt where the two stent elements overlap. The mesh-like appearance of the shunt is due to the echo reflection off the individual wire elements of the stents.
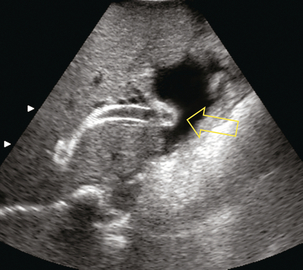
FIGURE 8-53 Transverse view of the TIPS at its junction with the inferior vena cava. The opening of the stent is seen projecting into the right atrium (arrow).
Flow within the stent is then evaluated by Doppler ultrasound. The presence of blood flow is easily confirmed, as the entire shunt lumen fills with colour due to the high-velocity flow (Fig. 8-54). Assuming a right portal to right hepatic vein TIPS, the velocity, flow direction and waveform are checked at the portal vein end, mid-shunt and hepatic vein end. The main portal vein and the left portal vein are assessed and the right hepatic vein is checked both proximal to and just beyond its junction with the stent (Fig. 8-55). Spectral Doppler evaluation should verify that the direction of flow in the shunt is from the portal vein to the hepatic vein. Flow in the widely patent shunt should show standard hepatic vein periodicity throughout the shunt due to right atrial pressure changes being transmitted back through the shunt, against the direction of flow (Fig. 8-56). Periodicity is most pronounced at the hepatic vein end. In one study, half of the patients with patent TIPS demonstrated some periodicity at the hepatic vein end of the shunt, while the other half had high-velocity turbulent flow.71 The presence of the triphasic (hepatic venous) waveform at the portal vein end of the TIPS gives the examiner great confidence that the TIPS is widely patent.
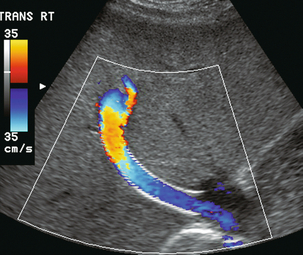
FIGURE 8-54 Oblique colour Doppler image of the TIPS. The entire lumen is saturated with colour indicating patency. Note the non-uniformity of colour encoding – a function of increased velocity at the area of stent overlap. Now turbulence is present, however.
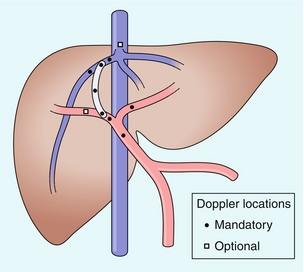
FIGURE 8-55 Illustration of the TIPS and its related vasculature in the standard right hepatic vein to right portal vein configuration. Circles indicate those points at which a Doppler tracing should be obtained in a complete TIPS ultrasound evaluation. (Figure courtesy of Gerald Mulligan, MD.)
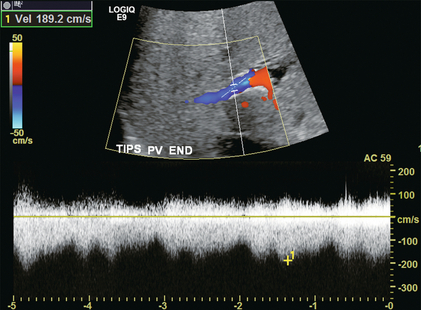
FIGURE 8-56 Doppler tracing obtained at the portal vein end of the TIPS. Note the presence of flow periodicity within the TIPS. The waveform is similar to that seen in hepatic veins. Identification of brisk flow and this degree of periodicity at the portal vein end of the stent is a confident indicator of a widely patent shunt.
Flow velocities in the shunt vary widely, but should not drop below 50 cm/s.69,71,72 Flow across the shunt is usually quite turbulent, especially when multiple stent components are used, since overriding stents cause a relative narrowing of the shunt lumen. Velocities in the main portal vein are just as variable. Following TIPS insertion, the mean portal vein velocity has been reported to increase by two-to three-fold.72 Hepatic arterial flow has also been shown to increase after TIPS, presumably because by decompressing the portal system, the TIPS removes resistance to arteriovenous shunting.70
In a properly functioning TIPS, flow direction in the portal system is towards the portal vein end of the stent. Therefore, flow in the main portal vein is hepatopetal and its velocity is typically brisk (between 20 and 60 cm/s). The faster the better, as long as one is not dealing with focal post-stenotic jet.70 Flow in the left and right portal veins usually becomes hepatofugal, flowing out of the diseased liver and towards the inflow of the shunt (Fig. 8-57). Depending on the diameter of the narrowest shunt component and the severity of the liver disease, however, flow may continue to be hepatopetal into the parenchyma. This is most often seen when the TIPS ends short of the inferior vena cava and most proximal hepatic vein remains narrowed by the surrounding diseased liver. If the patient has a patent but not occluded paraumbilical vein, it will continue to shunt blood away from the liver. Flow in the left portal vein, therefore, continues in a hepatopetal direction despite normal TIPS function.
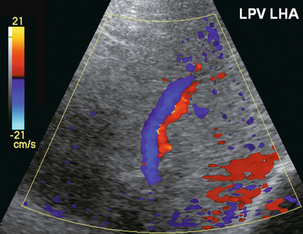
FIGURE 8-57 Colour Doppler image of the left portal vein and hepatic artery in a patient with an appropriately functioning TIPS. The flow in the hepatic artery is towards the transducer, therefore into the left lobe of the liver. The left portal vein flow, however, is away from the transducer, therefore hepatofugal and towards the inflow of the shunt. This is appropriate in a properly functioning TIPS.
The Doppler data are recorded and maintained in a table format for follow-up (Fig. 8-58). Serial documentation provides the best means of identifying any variations in velocity and/or flow direction over time and these changes are the best early indicator of shunt compromise. If a branch of the portal vein changes flow direction over time from hepatofugal to hepatopetal, a significant flow-limiting lesion is assumed to have developed in the TIPS.
FIGURE 8-58 TIPS data sheet. Each patient receiving a TIPS should have a data sheet maintained with velocities and flow directions documented at each visit. Progressive compromise of the TIPS can then be more easily recognised as changes in velocities or a change in direction flow become manifest. Velocity measurement in the mid-TIPS tends to be the most erratic. A continuing decrease in main portal vein inflow velocity over the sequence of studies is the most definitive indicator of progressive shunt compromise.
Shunt Stenosis
The two most common causes of TIPS compromise are neointimal hyperplasia within the shunt, or a focal stenosis at the hepatic vein end. Almost all non-sheathed TIPS have some degree of neointimal hyperplasia, which is overgrowth of liver tissue combined with fibrosis through the stent mesh and into the lumen. As it progresses it limits flow through the TIPS and eventually occludes it. Beyond the point of maximum stenosis, a high-velocity jet may be perceived by Doppler (Fig. 8-59). Through the rest of the TIPS and the portal system, however, velocities decrease. With sufficient compromise, flow direction in the branch portal veins revert – to hepatopetal and eventually flow in the main portal vein may become hepatofugal.
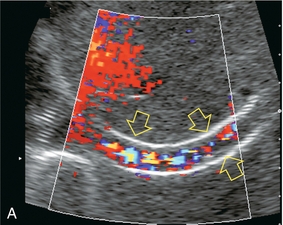
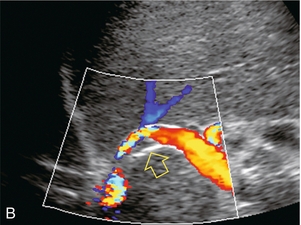
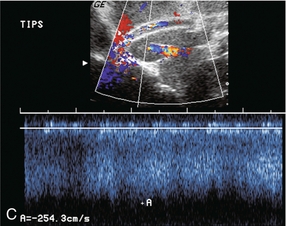
FIGURE 8-59 (A) Oblique colour Doppler image along the length of a TIPS shunt. Turbulent flow is seen across this shunt. Note the absence of flow along the shunt wall (arrows) indicating neointimal hyperplasia along almost the entire length of the TIPS. (B) Oblique colour Doppler image along the length of a TIPS shunt. Flow is seen throughout the TIPS. At the portal vein end it is relatively uniform. At the mid-TIPS, however, there is narrowing and turbulence with a discrete focus of neointimal hyperplasia compromising the lumen. (C) Oblique colour Doppler image along the length of a TIPS shunt. Spectral Doppler tracing at the mid-TIPS shows turbulent flow at the high velocity of greater than 2.5 m/s, well above the accepted normal upper limit of 1.2 m/s for the mid-TIPS. This is caused by a high velocity jet just beyond a focal stenosis.
Focal hepatic vein stenosis can occur where the proximal end of the TIPS abuts the hepatic vein. Focal irritation of the vein wall by the stent wires may cause a bar of granulation tissue to build up. This can obstruct outflow and decrease velocities throughout the shunt.70 If the stent ends short of the inferior vena cava the non-stented segment of the vein remains narrow, continuing to obstruct outflow and resulting in a high-velocity jet. A key Doppler finding of this focal stenosis is flattening of the hepatic vein flow profile within the TIPS, combined with the presence of post-stenotic high-velocity jet above the point of narrowing (Fig. 8-60). The sonologist must therefore evaluate flow beyond the end of the stent, sometimes even as far as the right atrium.
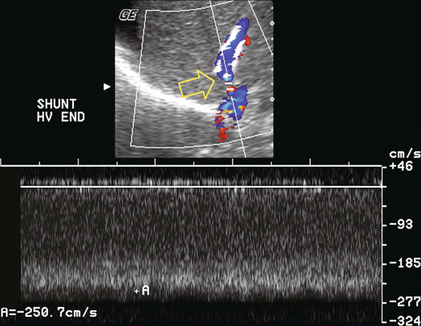
FIGURE 8-60 Spectral and colour Doppler image at the hepatic vein end of a TIPS catheter. Note on the colour image that the catheter ends short of the inferior vena cava. The diameter of the hepatic vein above the TIPS is relatively narrow (arrow). The spectral Doppler tracing shows a velocity of 2.5 m/s. This high-velocity jet is due to the persistent narrowing of the non-stented segment of the hepatic vein.
Flow in all three hepatic veins is normally towards the heart but a stenosis at the junction of the TIPS and its host hepatic vein can compromise outflow. If severe, it causes reversal of flow within that hepatic vein. The path of least resistance for TIPS outflow becomes that hepatic vein with blood coursing back into the liver, percolating across the sinusoids and then returning to the heart via the other hepatic veins (Fig. 8-61).
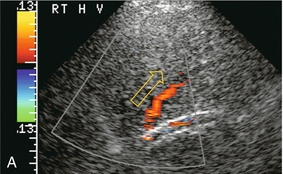
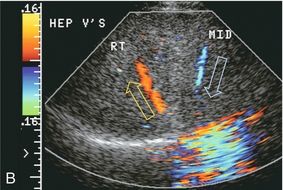
FIGURE 8-61 (A) Longitudinal colour Doppler image including the right hepatic vein and TIPS shunt. Note the poor colour saturation of the TIPS indicating poor flow. Colour signal from the right hepatic vein shows flow coursing towards the transducer, which is away from the inferior vena cava. This is a result of focal stenosis at the hepatic vein junction with the TIPS shunt. (B) Transverse colour Doppler image of the same patient. Flow in the right hepatic vein is indeed coursing away from the heart. Flow collateralises to the middle hepatic vein which has appropriate flow direction back towards the heart.
Several investigators have attempted to determine flow velocities which define critical TIPS stenosis,69,70,76 but reported findings have varied considerably. In one study, a velocity < 50 cm/s at the portal venous end was 100% sensitive and 93% specific.77 In another study, a velocity < 50 cm/s in the middle segment of the TIPS was 78% sensitive and 99% specific.78 The wide variability of reported TIPS velocity criteria underscores the merits of establishing individual patient baseline velocities soon after TIPS placement and using those as the foundation upon which to make a diagnosis. A change in velocity of ± 50 cm/s from baseline is a reasonably sensitive and specific threshold value for predicting haemodynamically significant shunt compromise.79 If there is significant flow compromise through the TIPS, main portal vein velocity decreases. Flow in the left portal vein may revert back to a hepatopetal direction (Fig. 8-62), representing a reversion to pre-TIPS haemodynamics (Box 8-3).70,72,80,81
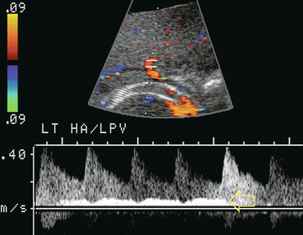
FIGURE 8-62 Spectral Doppler tracing of the left hepatic artery and portal vein including a portion of the TIPS stent. Absence of colour signal with the shunt indicates TIPS thrombosis. This is further reinforced by conversion back to a hepatopetal direction of flow in the left portal vein (arrow). Compare this to the hepatofugal left portal vein hepatic artery flow direction normally seen with a properly functioning TIPS as illustrated in Figure 8.57.
Shunt Occlusion
If flow cannot be detected in the shunt and portal vein flow reverts to pre-TIPS velocity and direction, shunt occlusion is likely. The absence of flow by colour or power Doppler within the TIPS is a highly specific indicator of shunt thrombosis (Fig. 8-63). However, before concluding that the stent is occluded, meticulous scanning for slow flow should be performed. Colour Doppler settings (including pulse repetition frequency, gain and filtration) need to be optimised to differentiate true occlusion from very slow flow. A functioning TIPS, however, is not a low-flow system, so misinterpretation of thrombosis for technical reasons is rarely a problem. Identifying low flow or recent occlusion mandates TIPS revision. Indeed, repeat interventions are the key to long-term success of a TIPS.
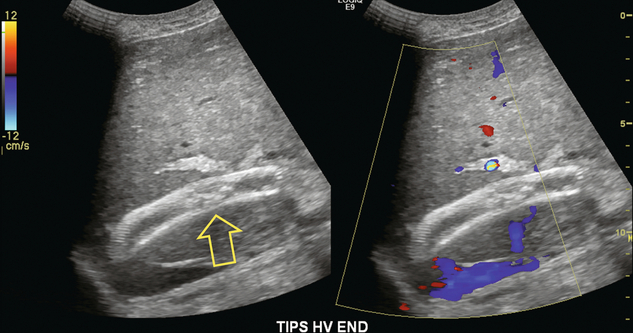
REFERENCES
1. Sutherland, T., Temple, F., Lee, W. K., et al. Evaluation of focal hepatic lesions with ultrasound contrast agents. J Clin Ultrasound. 2011; 39(7):399–407.
2. Grenier, N., Basseau, F., Rey, M. C., et al. Interpretation of Doppler signals. Eur Radiol. 2001; 11(8):1295–1307.
3. Altinkaya, N., Koc, Z., Ulusan, S., et al. Effects of respiratory manoeuvres on hepatic vein Doppler waveform and flow velocities in a healthy population. Eur J Radiol. 2011; 79(1):60–63.
4. Kruskal, J. B., Newman, P. A., Sammons, L. G., et al. Optimizing Doppler and color flow US: application to hepatic sonography. Radiographics. 2004; 24(3):657–675.
5. Baik, S. K. Haemodynamic evaluation by Doppler ultrasonography in patients with portal hypertension: a review. Liver Int. 2010; 30(10):1403–1413.
6. Sacerdoti, D., Merkel, C., Bolognesi, M., et al. Hepatic arterial resistance in cirrhosis with and without portal vein thrombosis: relationships with portal hemodynamics. Gastroenterology. 1995; 108(4):1152–1158.
7. Ohta, M., Hashizume, M., Kawanaka, H., et al. Prognostic significance of hepatic vein waveform by Doppler ultrasonography in cirrhotic patients with portal hypertension. Am J Gastroenterol. 1995; 90(10):1853–1857.
8. Iwao, T., Toyonaga, A., Shigemori, H., et al. Hepatic artery hemodynamic responsiveness to altered portal blood flow in normal and cirrhotic livers. Radiology. 1996; 200(3):793–798.
9. Goyal, N., Jain, N., Rachapalli, V., et al. Non-invasive evaluation of liver cirrhosis using ultrasound. Clinical Radiol. 2009; 64(11):1056–1066.
10. Lafortune, M., Madore, F., Patriquin, H., et al. Segmental anatomy of the liver: a sonographic approach to the Couinaud nomenclature. Radiology. 1991; 181(2):443–448.
11. Gallix, B. P., Taourel, P., Dauzat, M., et al. Flow pulsatility in the portal venous system: a study of Doppler sonography in healthy adults. AJR Am J Roentgenol. 1997; 169(1):141–144.
12. Wood, M. M., Romine, L. E., Lee, Y. K., et al. Spectral Doppler signature waveforms in ultrasonography: a review of normal and abnormal waveforms. Ultrasound Q. 2010; 26(2):83–99.
13. Gielecki, J., Zurada, A., Sonpal, N., et al. The clinical relevance of coeliac trunk variations. Folia Morphol. 2005; 64(3):123–129.
14. Oppo, K., Leen, E., Angerson, W. J., et al. Doppler perfusion index: an interobserver and intraobserver reproducibility study. Radiology. 1998; 208(2):453–457.
15. Abu-Yousef, M. M. Normal and respiratory variations of the hepatic and portal venous duplex Doppler waveforms with simultaneous electrocardiographic correlation. J Ultrasound Med. 1992; 11(6):263–268.
16. Shapiro, R. S., Winsberg, F., Maldjian, C., et al. Variability of hepatic vein Doppler tracings in normal subjects. J Ultrasound Med. 1993; 12(12):701–703.
17. McNaughton, D. A., Abu-Yousef, M. M. Doppler US of the liver made simple. Radiographics. 2011; 31(1):161–188.
18. Iwao, T., Toyonaga, A., Oho, K., et al. Value of Doppler ultrasound parameters of portal vein and hepatic artery in the diagnosis of cirrhosis and portal hypertension. Am J Gastroenterol. 1997; 92(6):1012–1017.
19. Westra, S. J., Zaninovic, A. C., Vargas, J., et al. The value of portal vein pulsatility on duplex sonograms as a sign of portal hypertension in children with liver disease. AJR Am J Roentgenol. 1995; 165(1):167–172.
20. Kuo, C. H., Changchien, C. S., Tai, D. I., et al. Portal vein velocity by duplex Doppler ultrasound as an indication of the clinical severity of portal hypertension. Changgeng Yi Xue Za Zhi. 1995; 18(3):217–223.
21. Berzigotti, A., Piscaglia, F. Ultrasound in portal hypertension – part 1. Ultraschall Med. 2011; 32(6):548–568.
22. Berzigotti, A., Piscaglia, F., Education, E., Professional Standards C. Ultrasound in portal hypertension–part 2–and EFSUMB recommendations for the performance and reporting of ultrasound examinations in portal hypertension. Ultraschall Med. 2012; 33(1):8–32.
23. Barakat, M. Portal vein pulsatility and spectral width changes in patients with portal hypertension: relation to the severity of liver disease. Br J Radiol. 2002; 75(893):417–421.
24. Rector, W. G., Jr., Hoefs, J. C., Hossack, K. F., et al. Hepatofugal portal flow in cirrhosis: observations on hepatic hemodynamics and the nature of the arterioportal communications. Hepatology. 1988; 8(1):16–20.
25. Abu-Yousef, M. M., Milam, S. G., Farner, R. M. Pulsatile portal vein flow: a sign of tricuspid regurgitation on duplex Doppler sonography. AJR Am J Roentgenol. 1990; 155(4):785–788.
26. Loperfido, F., Lombardo, A., Amico, C. M., et al. Doppler analysis of portal vein flow in tricuspid regurgitation. J Heart Valve Dis. 1993; 2(2):174–182.
27. Berzigotti, A., Ashkenazi, E., Reverter, E., et al. Non-invasive diagnostic and prognostic evaluation of liver cirrhosis and portal hypertension. Dis Markers. 2011; 31(3):129–138.
28. Gorg, C., Riera-Knorrenschild, J., Dietrich, J. Pictorial review: Colour Doppler ultrasound flow patterns in the portal venous system. Br J Radiol. 2002; 75(899):919–929.
29. Robinson, K. A., Middleton, W. D., Al-Sukaiti, R., et al. Doppler sonography of portal hypertension. Ultrasound Q. 2009; 25(1):3–13.
30. Gupta, D., Chawla, Y. K., Dhiman, R. K., et al. Clinical significance of patent paraumbilical vein in patients with liver cirrhosis. Dig Dis Sci. 2000; 45(9):1861–1864.
31. Amitrano, L., Guardascione, M. A., Brancaccio, V., et al. Risk factors and clinical presentation of portal vein thrombosis in patients with liver cirrhosis. J Hepatol. 2004; 40(5):736–741.
32. Ponziani, F. R., Zocco, M. A., Campanale, C., et al. Portal vein thrombosis: insight into physiopathology, diagnosis, and treatment. World J Gastroenterol. 2010; 16(2):143–155.
33. Sorrentino, P., D’Angelo, S., Tarantino, L., et al. Contrast-enhanced sonography versus biopsy for the differential diagnosis of thrombosis in hepatocellular carcinoma patients. World J Gastroenterol. 2009; 15(18):2245–2251.
34. Raby, N., Meire, H. B. Duplex Doppler ultrasound in the diagnosis of cavernous transformation of the portal vein. Br J Radiol. 1988; 61(727):586–588.
35. Pozniak, M. A., Baus, K. M. Hepatofugal arterial signal in the main portal vein: an indicator of intravascular tumor spread. Radiology. 1991; 180(3):663–666.
36. Hidajat, N., Stobbe, H., Griesshaber, V., et al. Imaging and radiological interventions of portal vein thrombosis. Acta Radiol. 2005; 46(4):336–343.
37. Mhanna, T., Bernard, P., Pilleul, F., et al. Portal vein aneurysm: report of two cases. Hepatogastroenterology. 2004; 51(58):1162–1164.
38. Maher, M. M., Tonra, B. M., Malone, D. E., et al. Portal venous gas: detection by gray-scale and Doppler sonography in the absence of correlative findings on computed tomography. Abdom Imaging. 2001; 26(4):390–394.
39. Balci, A., Karazincir, S., Sumbas, H., et al. Effects of diffuse fatty infiltration of the liver on portal vein flow hemodynamics. J Clin Ultrasound. 2008; 36(3):134–140.
40. Joynt, L. K., Platt, J. F., Rubin, J. M., et al. Hepatic artery resistance before and after standard meal in subjects with diseased and healthy livers. Radiology. 1995; 196(2):489–492.
41. Han, S. H., Rice, S., Cohen, S. M., et al. Duplex Doppler ultrasound of the hepatic artery in patients with acute alcoholic hepatitis. J Clin Gastroenterol. 2002; 34(5):573–577.
42. Tanaka, K., Numata, K., Morimoto, M., et al. Elevated resistive index in the hepatic artery as a predictor of fulminant hepatic failure in patients with acute viral hepatitis: a prospective study using Doppler ultrasound. Dig Dis Sci. 2004; 49(5):833–842.
43. Falkoff, G. E., Taylor, K. J., Morse, S. Hepatic artery pseudoaneurysm: diagnosis with real-time and pulsed Doppler US. Radiology. 1986; 158(1):55–56.
44. Finley, D. S., Hinojosa, M. W., Paya, M., et al. Hepatic artery pseudoaneurysm: a report of seven cases and a review of the literature. Surg Today. 2005; 35(7):543–547.
45. Ocran, K., Rickes, S., Heukamp, I., et al. Sonographic findings in hepatic involvement of hereditary haemorrhagic telangiectasia. Ultraschall Med. 2004; 25(3):191–194.
46. Memeo, M., Scardapane, A., De Blasi, R., et al. Diagnostic imaging in the study of visceral involvement of hereditary haemorrhagic telangiectasia. La Radiol Med. 2008; 113(4):547–566.
47. Erden, A. Budd-Chiari syndrome: a review of imaging findings. Eur J Radiol. 2007; 61(1):44–56.
48. Kew, M. C., Hodkinson, H. J. Membranous obstruction of the inferior vena cava and its causal relation to hepatocellular carcinoma. Liver Int. 2006; 26(1):1–7.
49. Barakat, M. Non-pulsatile hepatic and portal vein waveforms in patients with liver cirrhosis: concordant and discordant relationships. Br J Radiol. 2004; 77(919):547–550.
50. Janssen, H. L., Tan, A. C., Tilanus, H. W., et al. Pseudo-Budd-Chiari syndrome: decompensated alcoholic liver disease mimicking hepatic venous outflow obstruction. Hepatogastroenterology. 2002; 49(45):810–812.
51. Zhang, L., Yin, J., Duan, Y., et al. Assessment of intrahepatic blood flow by Doppler ultrasonography: relationship between the hepatic vein, portal vein, hepatic artery and portal pressure measured intraoperatively in patients with portal hypertension. BMC Gastroenterol. 2011; 11:84.
52. Mahgerefteh, S. Y., Sosna, J., Bogot, N., et al. Radiologic imaging and intervention for gastrointestinal and hepatic complications of hematopoietic stem cell transplantation. Radiology. 2011; 258(3):660–671.
53. Coy, D. L., Ormazabal, A., Godwin, J. D., et al. Imaging evaluation of pulmonary and abdominal complications following hematopoietic stem cell transplantation. Radiographics. 2005; 25(2):305–317.
54. Abu-Yousef, M. M. Duplex Doppler sonography of the hepatic vein in tricuspid regurgitation. AJR Am J Roentgenol. 1991; 156(1):79–83.
55. Jeong, W. K., Kim, K. W., Kim, M. Y., et al. Increase of modified retrograde to antegrade flow ratio on Doppler ultrasounds of the hepatic vein indicating tricuspid regurgitation during follow-up of liver transplantation: correlation with echocardiographic results. Transplant Proc. 2009; 41(10):4238–4242.
56. Tchelepi, H., Ralls, P. W. Ultrasound of focal liver masses. Ultrasound Q. 2004; 20(4):155–169.
57. Kudo, M. Diagnostic imaging of hepatocellular carcinoma: recent progress. Oncology. 2011; 81(Suppl. 1):73–85.
58. Murakami, T., Imai, Y., Okada, M., et al. Ultrasonography, computed tomography and magnetic resonance imaging of hepatocellular carcinoma: toward improved treatment decisions. Oncology. 2011; 81(Suppl. 1):86–99.
59. Tochio, H., Kudo, M. Afferent and efferent vessels of premalignant and overt hepatocellular carcinoma: observation by color Doppler imaging. Intervirology. 2004; 47(3–5):144–153.
60. Gaiani, S., Casali, A., Serra, C., et al. Assessment of vascular patterns of small liver mass lesions: value and limitation of the different Doppler ultrasound modalities. Am J Gastroenterol. 2000; 95(12):3537–3546.
61. Bhatnagar, G., Sidhu, H. S., Vardhanabhuti, V., et al. The varied sonographic appearances of focal fatty liver disease: review and diagnostic algorithm. Clin Radiol. 2012; 67(4):372–379.
62. Hussain, S. M., Terkivatan, T., Zondervan, P. E., et al. Focal nodular hyperplasia: findings at state-of-the-art MR imaging, US, CT, and pathologic analysis. Radiographics. 2004; 24(1):3–17.
63. Soresi, M., Carroccio, A., Campagna, P., et al. Diagnosis of focal nodular hyperplasia. Role of imaging techniques. Ann Ital Med Int. 2002; 17(2):95–101.
64. Choi, B. Y., Nguyen, M. H. The diagnosis and management of benign hepatic tumors. J Clin Gastroenterol. 2005; 39(5):401–412.
65. Rosch, J., Hanafee, W. N., Snow, H. Transjugular portal venography and radiologic portacaval shunt: an experimental study. Radiology. 1969; 92(5):1112–1114.
66. Bhogal, H. K., Sanyal, A. J. Using transjugular intrahepatic portosystemic shunts for complications of cirrhosis. Clin Gastroenterol Hepatol. 2011; 9(11):936–946.
67. Saad, N., Darcy, M., Saad, W. Portal anatomic variants relevant to transjugular intrahepatic portosystemic shunt. Tech Vasc Interv Radiol. 2008; 11(4):203–207.
68. Darcy, M. Evaluation and management of transjugular intrahepatic portosystemic shunts. AJR Am J Roentgenol. 2012; 199(4):730–736.
69. Feldstein, V. A., Patel, M. D., LaBerge, J. M. Transjugular intrahepatic portosystemic shunts: accuracy of Doppler US in determination of patency and detection of stenoses. Radiology. 1996; 201(1):141–147.
70. Foshager, M. C., Ferral, H., Finlay, D. E., et al. Color Doppler sonography of transjugular intrahepatic portosystemic shunts (TIPS). AJR Am J Roentgenol. 1994; 163(1):105–111.
71. Longo, J. M., Bilbao, J. I., Rousseau, H. P., et al. Transjugular intrahepatic portosystemic shunt: evaluation with Doppler sonography. Radiology. 1993; 186(2):529–534.
72. Surratt, R. S., Middleton, W. D., Darcy, M. D., et al. Morphologic and hemodynamic findings at sonography before and after creation of a transjugular intrahepatic portosystemic shunt. AJR Am J Roentgenol. 1993; 160(3):627–630.
73. Charon, J. P., Alaeddin, F. H., Pimpalwar, S. A., et al. Results of a retrospective multicenter trial of the Viatorr expanded polytetrafluoroethylene-covered stent-graft for transjugular intrahepatic portosystemic shunt creation. J Vasc Interv Radiol. 2004; 15(11):1219–1230.
74. Hausegger, K. A., Karnel, F., Georgieva, B., et al. Transjugular intrahepatic portosystemic shunt creation with the Viatorr expanded polytetrafluoroethylene-covered stent-graft. J Vasc Interv Radiol. 2004; 15(3):239–248.
75. Maleux, G., Nevens, F., Wilmer, A., et al. Early and long-term clinical and radiological follow-up results of expanded-polytetrafluoroethylene-covered stent-grafts for transjugular intrahepatic portosystemic shunt procedures. Eur Radiol. 2004; 14(10):1842–1850.
76. Dodd, G. D., 3rd., Zajko, A. B., Orons, P. D., et al. Detection of transjugular intrahepatic portosystemic shunt dysfunction: value of duplex Doppler sonography. AJR Am J Roentgenol. 1995; 164(5):1119–1124.
77. Chong, W. K., Malisch, T. A., Mazer, M. J., et al. Transjugular intrahepatic portosystemic shunt: US assessment with maximum flow velocity. Radiology. 1993; 189(3):789–793.
78. Mituzani, P., Saxon, R., Alexander, P. Duplex US screening after transjugular intrahepatic portosystemic shunt placement. Radiology. 1993; 189(P)(Suppl. ):254.
79. Wachsberg, R. H. Doppler ultrasound evaluation of transjugular intrahepatic portosystemic shunt function: pitfalls and artifacts. Ultrasound Q. 2003; 19(3):139–148.
80. Zemel, G., Katzen, B., Grubbs, G. Sonographic indicators of unsuccessful transjugular intrahepatic portosystemic shunt placement. Radiology. 1994; 193(P)(Suppl. ):254.
81. Middleton, W. D., Teefey, S. A., Darcy, M. D. Doppler evaluation of transjugular intrahepatic portosystemic shunts. Ultrasound Q. 2003; 19(2):56–70.
[/level-membership-for-radiology-category][not-level-membership-for-radiology-category]Chapter 8
The Liver
Introduction
There have been impressive advances recently in the application of ultrasound contrast medium to liver imaging; but these agents are not universally available. Researchers have shown the benefits of microbubble-enhanced lesion detection and characterisation.1 Unfortunately governing agencies across the world have not uniformly endorsed these agents and there is limited ability and/or interest to apply them in many centres. This chapter is, therefore, written for those ultrasound practitioners who do not have access to or routinely use intravenous ultrasound contrast. For discussion of hepatic applications of sonographic contrast please refer to Chapter 17.
The standard hepatic US examination should include a brief survey with spectral and colour Doppler (Box 8-1). This serves a two-fold purpose: first, it adds valuable haemodynamic information to the evaluation of the liver, in most cases reinforcing normality, but occasionally revealing an unexpected finding. Second, by consistently integrating Doppler into the routine hepatic examination, sonologists will continually refine their Doppler skills so that when presented with significant haemodynamic abnormalities, they can be identified quickly and evaluated accurately. Although a cursory Doppler survey of the hepatic vasculature may add 2–3 min to an abdominal examination, regular practice enables the examiner to become more adept at perceiving abnormalities, dialling in the settings to optimise the display, and more expert in analysing the results. Not infrequently altered blood flow may be the only abnormal finding to suggest the presence of pathology. The Doppler survey may reveal distortion of vascularity around a subtle lesion of which the examiner was otherwise unaware. It may display hypervascularity of an observed lesion and this awareness may increase diagnostic certainty. The use of colour Doppler in the hepatic examination also helps to differentiate vascular from non-vascular structures. Care must be taken, however, to ensure that equipment settings are appropriate: if gain, pulse repetition frequency, and filtration are not optimised, slow flow can be missed in vascular structures or artifactual colour can be painted into non-vascular structures.2
Executing the Liver Doppler Study
SCAN TECHNIQUE
The patient is scanned in a supine or left lateral decubitus position. Depending on vessel orientation and body habitus, the portal vein and hepatic artery are best interrogated by either a subcostal approach pointing posterocephalad, or a right intercostal approach pointing medially. Since the portal vein and hepatic artery travel together in the portal triad, along with the common duct, these approaches should satisfactorily interrogate both vessels (Fig. 8-1).
FIGURE 8-1 Oblique colour Doppler image of the porta hepatis. The hepatic artery (HA) accompanies the portal vein (PV) and bile ducts. With the colour scale appropriately set for the slow flow within the portal vein, hepatic arterial flow projects as colour aliasing.
Scanning the left hepatic and middle hepatic veins is best accomplished from a substernal approach. The transducer should be oriented transversely, pointing posterocephalad, and swept up and down across the liver. For the right hepatic vein, a right lateral intercostal approach is used with the transducer pointed cephalad. If the patient’s liver extends below the costal margin during inspiration, a subcostal transverse view, angled cephalad, is useful for the confluence of the hepatic veins (Fig. 8-2).
FIGURE 8-2 Power Doppler transverse view of the liver with a subcostal approach. This crow’s foot appearance of the hepatic veins shows the convergence of five hepatic veins onto the IVC. The presence of accessory branches is very common.
Some patients, when asked to hold their breath perform a vigorous Valsalva manoeuvre. This results in increased intrathoracic pressure which will impede venous return, affecting flow profiles and velocities, particularly in the hepatic veins and inferior vena cava (IVC). This will often alter the hepatic vein profile, creating the perception of hepatic venous outflow obstruction (HVOO). Scanning must be performed in neutral breath-hold to avoid producing a misleading Doppler tracing.3
Varying the width of the sample volume can be advantageous when examining the porta hepatis. If the examiner is screening for vascular patency or trying to locate a specific vessel, a large sample volume is appropriate for rapid interrogation of a broad area; for example, when ruling out hepatic artery thrombosis in a liver transplant recipient. If, however, the examiner wants to precisely characterise flow within a vessel and evaluate waveform detail, then the sample volume must be small and placed near the centre of the vessel, thereby interrogating the highest velocity lamina (Fig. 8-3). A wide sample volume, by incorporating the slower lamina along the wall together with the faster central lamina, will broaden the spectral Doppler tracing and mimic turbulence.4
FIGURE 8-3 (A) Schematic representation of normal laminar flow. The velocity of fluid along the wall of a vessel is slowed because of frictional forces causing drag; therefore its relative velocity is less than that at the centre of the vessel. The travelling wave assumes a parabolic form. (B) Colour Doppler image of portal vein flow with a green tag assigned to high velocities towards the transducer. Additionally the pulse repetition frequency (velocity scale) is set low to cause aliasing. This distortion of the colour-encoding thus permits a display of several velocity lamina. Note the transition from the slowest velocities, red through orange, green and blue from the periphery to the centre of the vessel. The actual velocity displayed on a spectral Doppler tracing is, therefore, dependent on sample volume placement relative to these various velocity lamina. A small, centrally placed sample volume will display a higher measured velocity than a peripherally placed sample volume.
Differentiating a patent from a thrombosed vessel is critically dependent on Doppler settings and transducer frequency. Gain, filtration, and pulse repetition frequency settings must be adjusted throughout the study. The settings must be carefully reviewed if one is about to make a diagnosis of thrombosis (Fig. 8-4).
FIGURE 8-4 Series of colour Doppler images of the left portal vein. The only setting changed among these three images is the pulse repetition frequency (colour Doppler scale). On the first image with scale set high (60 cm/s), no colour is displayed within the portal vein which therefore could be interpreted as thrombosed. The second image with scale set appropriately (15 cm/s), relative to normal portal velocity, reveals appropriate colour saturation and confirms patency. On the final image with scale set too low (02 cm/s), colour aliasing distorts the image.
Indications
Patients referred for right upper quadrant (RUQ) US typically have elevated liver enzymes of unknown aetiology incidentally detected on screening blood tests. Although sonographic imaging of the liver may reveal diffuse abnormality or focal disease, the majority of these examinations are normal (Box 8-2). Doppler US, however, may reveal flow alterations caused by inflammatory disease, neoplasm, or other disorders which are too subtle or too small to cause perceptible imaging irregularities. Being able to differentiate flow profile and velocity alterations in the hepatic vasculature between those caused by hepatic versus cardiac disease will help identify those patients needing additional cardiac evaluation versus those who would benefit from liver biopsy. Additionally, the identification of a Doppler abnormality can define those patients who would benefit from further hepatic imaging with computed tomography (CT), magnetic resonance imaging (MRI), or angiography.
When portal hypertension is suspected, Doppler US characterises changes in portal haemodynamics and identifies pathways of portosystemic collateralisation.5 Doppler can confirm the patency of surgical or percutaneous shunts which have been performed in patients with bleeding oesophageal varices. Identification and differentiation of bland thrombus from tumour thrombus within the hepatic or portal veins by Doppler has significant implications for medical, surgical or ablation treatment planning. Doppler US plays a key role in the postoperative monitoring of liver transplant recipients, confirming vascular patency.
The role of Doppler in the characterisation of parenchymal liver disease and screening for hepatocellular carcinoma (HCC) is controversial. Marked alterations in flow profiles and velocities can be seen and have been described in the literature.6–9 It is rare, though, to be able to precisely pinpoint a specific diagnosis based on Doppler findings since there is considerable overlap in velocity and waveform alterations among various disease states.
Vascular Anatomy and Normal Flow Profiles
PORTAL VEIN
The portal vein is formed by the confluence of the splenic and superior mesenteric veins. It supplies around 70% of incoming blood volume to the liver. It is accompanied by the hepatic artery and common bile duct which together make up the portal triad (Fig. 8-1). The triad has echogenic margins as it enters the liver, due to the intrahepatic extension of Glisson’s capsule and presence of perivascular fat. After forming the right and left branches, these vessels progressively branch to supply the liver segments as defined by Couinaud whose US appearance was described by La Fortune.10 The Couinaud system divides the liver vertically along the planes of the hepatic veins, and horizontally along the planes of the left and right portal veins. A thorough understanding of this anatomy is critical for surgical planning in liver resection and living related donation. Anatomic variations of the portal vein are rare.
The portal vein Doppler flow profile in a fasting patient has a relatively constant velocity of approximately 18 cm/s (± 5 cm/s) towards the liver (hepatopetal) (Fig. 8-5A). The flow velocity is uniform because cardiac pulsation is damped by the splenic parenchyma and the capillaries of the gut at one end of the portal system and by the liver sinusoids at the other. Slight phasicity may be seen on the portal spectral tracing due to respiration and a mild degree of periodicity may be present, due either to retrograde pulsation transmitted from the right heart via the hepatic vein (A-wave) or to the hepatic artery systolic pressure wave. Because these brief pressure surges into the liver transiently elevate intracapsular pressure, they increase resistance to portal venous inflow and, thereby, effect a momentary slowing of antegrade flow in the portal vein (Fig. 8-5B).11 Although some periodicity may be expected in portal vein flow, marked velocity variation or reversal of flow, even if brief, should be considered an abnormal finding.12 The blood in the portal vein is relatively deoxygenated since it comes to the liver after perfusing the intestine and spleen. It is rich in nutrients after a meal, and arrives at the liver to be processed by the cells of the hepatic sinusoids.
FIGURE 8-5 (A) Spectral Doppler tracing of normal portal vein flow. The flow velocity of 20 cm/s is relatively uniform and in a hepatopetal direction. (B) Spectral Doppler tracing of normal portal vein and hepatic artery flow. Slight periodicity is present in this patient’s portal vein tracing. The dip in antegrade velocity coincides with hepatic arterial systole. The comparison of the two flow profiles is achieved by interrogating with a wide sample volume that encompasses both the artery and the vein in one tracing. Velocity variation may also occur due to pressure change with the hepatic vein A-wave but those are harder to compare since the vessels are separated and cannot be simultaneously interrogated.
HEPATIC ARTERY
The hepatic arterial blood supply arises solely from the celiac axis in approximately 75% of individuals. The celiac trifurcates into the splenic artery, left gastric artery and common hepatic artery. After the take-off of the gastroduodenal artery, the common hepatic is then called the proper hepatic artery. It enters the liver alongside the portal vein (Fig. 8-1) where it divides into left and right hepatic arteries and from there branches into the Couinaud segments. There are, however, numerous variants of hepatic artery anatomy. These include accessory vessels which exist in conjunction with normal branches of the hepatic artery and replaced arteries which make up the sole supply of a segment or lobe. For example, a replaced right hepatic artery arising from the superior mesenteric artery (SMA) is the sole blood supply to the entire right lobe of the liver in 15% of the population.13 In a slender patient, colour Doppler US may be able to identify the replaced right hepatic artery behind the main portal vein as it courses towards the right lobe from the SMA (Fig. 8-6). A branch of the left gastric artery may supply the left lobe of the liver. This occurs less frequently and is more difficult to identify by Doppler US because of its small size.
FIGURE 8-6 Transverse image of the mid-abdomen at the level of the superior mesenteric artery origin. A tubular structure is seen coursing from the superior mesenteric artery (SMA) to the right lobe of the liver, between portal vein (PV) and the inferior vena cava (IVC). The addition of colour Doppler identifies this tubular structure as a vessel. An arterial signal on spectral Doppler, identification of its SMA origin and a course towards the right lobe of the liver confirm this to be a replaced right hepatic artery.
The normal proper hepatic artery in a fasting patient has a low-resistance Doppler flow profile, [about 60–70% resistive index (RI)] (Fig. 8-7). During systole, the velocity is approximately 30–60 cm/s; while during diastole, it normally slows to approximately 10–20 cm/s. Normal systolic acceleration time of the hepatic artery is brisk – less than 0.07 seconds.
FIGURE 8-7 Spectral Doppler tracing of a normal hepatic artery. Systolic upstroke is brisk with acceleration time < 0.07 s. Resistive index measures 73%. Velocity at end diastole approximates 17 cm/s.
Diastolic arterial velocity approximates the velocity of the portal vein. A comparison between hepatic artery diastolic velocity and the portal vein velocity is called the liver (or hepatic) vascular index. To acquire this comparison one can increase the sample volume size so that both vessels are incorporated into the same tracing (Fig. 8-5B) or swing the sample volume from one vessel to the other in the same tracing (Fig. 8-8).12,14
HEPATIC VEINS
The right, middle, and left hepatic veins enter the IVC in a ‘crow’s foot’ configuration when viewed in the transverse plane (Fig. 8-2). The left and middle hepatic veins usually enter as a common trunk along the left anteromedial aspect of the IVC. Over 50% of individuals have additional hepatic veins that are seen with colour Doppler; a right superior anterior segmental vein may be seen draining into the middle hepatic vein, marginal hepatic veins may drain into the right and left hepatic veins, and a large accessory right hepatic vein may be seen entering the IVC several centimetres inferior to the junction of the three main hepatic veins in 6–10% of people (Fig. 8-9). The venous drainage from the central liver, and the caudate lobe, empties directly into the IVC and is not normally detected by colour Doppler since these veins are small and deep (Fig. 8-10). This separate drainage pathway is responsible for the unique behaviour of the caudate lobe in diffuse liver disease, and for the distinctive enhancement pattern seen on contrast-enhanced CT scans of patients with hepatic vein thrombosis.
FIGURE 8-9 Longitudinal colour Doppler image of the liver and inferior vena cava (IVC) through the right flank. There is a prominent accessory hepatic vein (open arrow) from the inferior posterior segment of the right lobe of the liver (Couinaud segment 6). This vein joins the inferior vena cava approximately 4 cm inferior to the junction of the main three hepatic veins (HV).
FIGURE 8-10 CT scan at the level of the mid-liver in a patient with steatosis. Because of the fatty background, small central hepatic veins (arrow) can be seen draining directly into the inferior vena cava. This unique drainage of the central liver is the underlying cause for caudate hypertrophy in patients with main hepatic vein thrombosis or cirrhosis.
The normal hepatic vein waveform is referred to as triphasic and is a result of pressure waves emanating from the right heart (Fig. 8-11A). It is similar to the jugular vein waveform. There are four components to this waveform and occasionally a fifth may be perceived. Since hepatic vein flow courses toward the centrally located IVC, the hepatic vein flow is towards the heart and away from the transducer. Therefore, the majority of flow registers below the baseline. During right atrial contraction blood is forced back into the liver and is therefore displayed above the baseline. These directions are best described as being ‘antegrade’ (towards the heart) and ‘retrograde’ (away from the heart).
FIGURE 8-11 (A) Normal hepatic vein spectral Doppler tracing. (B) Illustrated tracings of an ECG, hepatic vein spectral Doppler tracing, and mitral valve M-mode tracing with correlation to atrial and ventricular systole and diastole. The divisions at the top of these tracing 1–5 correspond to the discussion in the text.
This complex hepatic vein tracing and associated velocities have been described by Abu-Yousef.15 Figure 8.11B shows the hepatic vein waveform in relationship with an electrocardiogram (ECG) tracing, tricuspid M-mode scan, and atrial and ventricular status. The following stages can be identified:
1. The most distinctive feature is the retrograde A-wave, which is the result of right atrial contraction triggered by the P-wave on the ECG. Since there is no valve between the right atrium and the IVC, a burst of reversed flow travels down the IVC and into the hepatic veins, which has a mean velocity of approximately 18 cm/s.
2. At the end of right atrial contraction, flow returns to the antegrade direction as the atrium relaxes. However, as the right ventricular contracts, the tricuspid valve is slammed shut and bulges back into the right atrium, creating its own pressure wave: the C-wave. This is a subtle brief pause in the steadily increasing antegrade flow. It is infrequently detected. The C-wave coincides with the beginning of ventricular systole and occurs with the QRS complex on the ECG.
3. The right atrium continues to dilate and antegrade flow builds to a relatively high velocity of approximately 30 cm/s. Eventually atrial filling approaches completion and antegrade flow starts to slow. This transition from accelerating to decelerating flow is known as the S-wave and occurs during ventricular systole within 0.15 s of the QRS complex.
4. At the end of atrial filling, antegrade velocity decelerates, or may even briefly reverse. The tricuspid valve then opens and velocities accelerate in the antegrade direction. This is known as the V-wave and has a mean velocity of approximately −1 cm/s. In relation to the ECG, this occurs following the T-wave.
5. As the right ventricle relaxes flow in the hepatic veins again accelerates in the antegrade direction, as both the right atrium and right ventricle fill. Velocity builds to a mean of approximately 22 cm/s. Eventually, the right heart chambers become filled passively and antegrade flow decelerates. This change from accelerating to decelerating velocity is referred to as the D-wave, and occurs during ventricular diastole. We then return to the A-wave as the atrium again contracts to begin another cardiac cycle.
This waveform is seen in the hepatic veins and upper IVC in the vast majority of patients. However, not all individuals have a similar degree of periodicity within the hepatic veins. The percentage of patients that manifest an identifiable C-wave is relatively small (Fig. 8-12). The degree of flow reversal of the A-wave and V-wave may vary depending on the patient’s cardiac status, state of hydration, heart rate, and the distance of Doppler interrogation from the heart. In a survey of a population of normal volunteers, a 9% incidence of a flattened hepatic vein flow profile has been reported.12,16
FIGURE 8-12 Normal hepatic vein spectral Doppler tracing. Even though the tracing is acquired within a few centimetres of the heart, the C-wave cannot be identified on this tracing. This is, indeed, the tracing most often visualised in the hepatic vein and inferior vena cava. The retrograde component of flow is appropriately small.
Because the heart is located within the thorax, pressure changes caused by respiration affect the hepatic vein flow profile. When the patient forcefully exhales or bears down against a closed glottis, the elevated intrathoracic pressure resists antegrade flow, causing the S- and D-waves to be less prominent. The reversed component of flow increases so the A- and V-waves become more pronounced (Fig. 8-13). Conversely, during forced inspiration with increasing negative intrathoracic pressure, the S- and D-waves become more prominent, while the A- and V-waves are less pronounced and may actually not manifest as reversed flow.17
FIGURE 8-13 Hepatic vein spectral Doppler tracing obtained during Valsalva manoeuvre. Because of the elevated intrathoracic pressure, the reversed component of flow is accentuated. Forward flow is decreased. Compare to Figure 8.12. The colour image was captured during the ‘a wave’ as flow was coursing back into the liver.
Assessment of Disease
PORTAL VEIN
Portal Hypertension
In hepatocellular disease, the sinusoids are damaged, destroyed or replaced. As the volume of normally functioning liver parenchyma decreases, the resistance to portal venous flow increases, the portal vein dilates, and portal flow decreases and with increasing severity, reverses.18–20 An elevation of pressure in the portal system above 6 mmHg is considered portal hypertension. Above 12 mmHg pressure, portal hypertension becomes clinically evident.
Use of the ‘congestive index’ has been recommended to help diagnose portal hypertension. This index is the ratio of the portal vein cross-sectional area (cm2) divided by the mean portal flow velocity (cm/s). This takes into account portal vein dilatation and decreased flow velocity, the two physiological changes associated with portal hypertension. In normal subjects, this ratio is less than 0.7. Although there is theoretical value in this index, the interobserver variability in portal vein area measurements and velocity measurements is relatively high, and error is further compounded when the parameters are combined in a ratio. Therefore, few centres now rely on this index.21,22
As liver disease worsens, the periodicity in the portal vein may become more pronounced, usually coinciding with hepatic arterial systole (Fig. 8-14).19,23 Finally, with end-stage liver disease, continuous hepatofugal flow is observed, usually with increased periodicity. Blood entering the liver in the hepatic artery normally passes through the hepatic sinusoids to the hepatic veins, but with increasing hepatocellular disease, scarring, fibrosis, and capillary leak the pathway of least resistance for the arterial inflow becomes the portal vein. Arterial blood shunts to the portal vein via vasa-vasorum, or via direct arteriovenous shunting at the level of the sinusoids. Thus, the origin of hepatofugal flow leaving the liver in the portal vein is blood shunted from the hepatic artery24 (Fig. 8-15).
FIGURE 8-14 Spectral hepatic vein Doppler tracing in a patient with alcoholic cirrhosis. Portal vein flow profile has become more sinusoidal although the flow direction does remain hepatopetal throughout the cardiac cycle. This degree of periodicity is beyond what we would expect in a normal portal vein. The dip in antegrade velocity coincides with hepatic arterial systole.
FIGURE 8-15 Portal vein spectral Doppler tracing in a patient with severe hepatocellular injury secondary to paracetamol (acetaminophen) overdose. Portal vein flow is hepatofugal throughout the cardiac cycle. We again see increased periodicity with a velocity surge concurrent with arterial systole secondary to capillary leak.
Pronounced periodicity may be seen in the portal vein, which does not coincide with hepatic arterial systole. This is usually due to cardiac disease, such as right ventricular dysfunction or tricuspid regurgitation, and is caused by a prominent reversed component of flow in the hepatic veins, either a ‘cannon’ A-wave or a reversed S-wave25,26 (Fig. 8-16).
FIGURE 8-16 (A) Spectral Doppler tracing of portal vein flow in a patient with severe right ventricular dysfunction and tricuspid regurgitation. There is marked periodicity in the portal vein waveform. Hepatopetal flow decreases, and briefly reverses, coinciding with the large regurgitant component of hepatic vein flow during tricuspid regurgitation. (B) Colour image and spectral Doppler tracing of the middle hepatic vein. Note the veins are distended. There is complete distortion of the triphasic hepatic vein waveform with a large regurgitant component of flow. This large reversed pressure wave impedes portal vein inflow.
Varices
As portal hypertension progresses and pressure rises to 15 or 20 mmHg, sufficient pressure exists to cause the development of varices. These collateral pathways shunt blood from the portal to the systemic circulation.27 The more common channels are the short gastric, left gastric and coronary veins; recanalised umbilical or paraumbilical vein; and splenorenal-mesenteric collaterals (Fig. 8-17). Other, less typical, pathways include pericholecystic, iliolumbar, gonadal, haemorrhoidal, and ascending retrosternal veins. Indeed, any vein in the abdomen may serve as a potential collateral to the systemic circulation and may be incorporated in a very convoluted shunt.28,29
Short gastric varices coursing between the spleen and the greater curvature of the stomach are best imaged via the left flank, using the enlarged spleen as a window (Fig. 8-18). Left gastric or coronary vein varices course from the splenic or portal veins along the lesser curvature of the stomach and are best imaged through the left lobe of the liver (Fig. 8-19). Both sets of varices then converge on the gastro-oesophageal junction (Fig. 8-20A). From there, blood flow proceeds upwards through oesophageal varices to eventually communicate with the azygous vein and the systemic circulation (Fig. 8-20B). Because of the potential lethal risk from spontaneous, brisk haemorrhage from oesophageal varices, a variety of endoscopic, surgical, or percutaneous procedures have been developed to divert blood away from them.
FIGURE 8-18 Longitudinal colour Doppler view of the left flank in a patient with portal hypertension and splenomegaly. A tangled web of veins (arrows) is seen coursing cephalad from the splenic vascular pedicle and extends towards the diaphragm (D). These are short gastric varices coursing from the splenic vein, along the greater curvature of the stomach and from there to the systemic circulation via oesophageal varices.
FIGURE 8-19 Longitudinal colour Doppler image in the midline of a patient with portal hypertension. A large tortuous left gastric varix is seen coursing from the region of the coeliac axis towards the gastro-oesophageal junction. Whereas short gastric varices tend to be a plexus of small vessels, the left gastric varix is typically a single large tortuous vessel. (Image courtesy of a friend.)
FIGURE 8-20 (A) Anterior view of a colour-coded shaded surface display 3-D rendering of a CT angiogram/portal venous phase in a patient with portal hypertension and splenomegaly. Short gastric varices (green) are best imaged from the left flank using the spleen as a sonographic window. The left gastric varix (red) is best imaged through the left lobe of the liver. (B) Anterior view of a colour-coded shaded surface display 3-D rendering of the portal vasculature in a patient with portal hypertension. The portal venous system is coloured red. The vessel coded blue is a large left gastric varix. Note the serpiginous course of this vessel as it courses cephalad, eventually branching into multiple oesophageal varices.
In utero, oxygenated blood flows from the placenta up the umbilical vein to the left portal vein and then through the ductus venosus into the IVC and right atrium. After birth, this pathway involutes and the umbilical vein remnant becomes the ligamentum teres in the falciform ligament. In portal hypertension, paraumbilical veins in this ligament or the umbilical vein itself can dilate and carry blood from the left portal vein along the anterior abdominal wall to the umbilical region (Fig. 8-21). From the umbilicus, the blood may pass to the superior or inferior epigastric veins, or through subcutaneous veins in the anterior abdominal wall, known as the ‘Caput Medusa’, to reach the systemic circulation. Because inferior epigastric varices run just deep to the rectus muscles, they are not apparent on clinical examination but are easily identified by colour Doppler (Fig. 8-22). Patients with known portal hypertension, who present with an umbilical hernia, should undergo imaging evaluation prior to surgery as the hernia may contain a dilated varix, rather than bowel. This pathway has less risk of life-threatening variceal bleeding.30
FIGURE 8-21 (A) Longitudinal colour Doppler image of a patient with portal hypertension. A large vein carries flow from the left portal vein towards the transducer. It courses along the falciform ligament and then turns caudad along the abdominal wall passing towards the umbilicus, deep to the rectus muscles. (B) Shaded surface display three-dimensional reformat of the upper abdominal solid organs and portal venous system. Flow in the main portal vein courses towards the liver but immediately channels into a large left portal vein (open arrow). Flow then continues anteriorly towards the anterior abdominal wall and down towards the umbilicus in a large recanalised umbilical vein (pink).
FIGURE 8-22 (A) Longitudinal colour Doppler image directly over the umbilicus. A recanalised umbilical vein carries blood towards the umbilicus. No caput medusa was present in this patient since flow drains from the umbilical region via the inferior epigastric vein (IEV). (B) Right lateral view of a colour-coded shaded surface display 3-D rendering of the portal vasculature in a patient with a large recanalised umbilical vein. The umbilical vein (UV) courses towards the umbilicus. From there flow continues back to the systemic circulation via the left inferior epigastric vein (IEGV) to the left external iliac vein (EIV) and eventually the inferior vena cava (IVC).
Splenorenal-mesenteric collaterals are typically quite large, elongated and very tortuous. Spontaneous splenorenal varices are almost never a direct communication between splenic and renal veins. They are seen in the left flank taking an extremely convoluted course, often extending between diaphragm and pelvis (Fig. 8-23). Very often this pathway arrives at the renal vein via the left gonadal vein.
[/not-level-membership-for-radiology-category]
