The Kidneys
Renal Vascular Doppler Ultrasound
CLINICAL CONSIDERATIONS
Common clinical indications for renal ultrasound include renal insufficiency and renal failure. Specifically, the request to exclude renal obstruction as the aetiology of acute renal failure leads the list. Doppler ultrasound is not routinely performed to evaluate acute renal failure but may be prompted by certain clinical indicators (Box 9-1) or greyscale findings. Colour and spectral Doppler is more commonly used in the native kidneys for evaluation of unexplained or uncontrolled hypertension caused by renal artery stenosis (RAS) or for determination of vessel patency. In hypertensive patients, some authors suggest Doppler should be reserved for those patients with a strong clinical suspicion for RAS who are likely to benefit from intervention.1 As will be shown, there are many other vascular abnormalities than can be demonstrated by Doppler, and these can present with a wide variety of symptoms or signs.
TECHNICAL CONSIDERATIONS
Main Renal Artery Evaluation
Doppler evaluation of the renal arteries should not occur without a thorough greyscale examination of the kidneys. Greyscale imaging can provide useful information about renal size and cortical thickness and should be part of the initial series of images. For Doppler image acquisition, a preliminary scan of the abdominal aorta is performed with colour Doppler in the transverse plane beginning at the level of the superior mesenteric artery (SMA) to locate the main renal arteries, which typically originate within 2 cm of the SMA (Fig. 9-1). Transverse images may be obtained from a midline approach with the patient supine or rolled into the left lateral decubitus position. The imager can localise the right renal artery passing posterior to the IVC then rotate the transducer while maintaining the artery in view. Also, the transducer can be placed longitudinally lateral to the rectus muscle resulting in a ‘banana peel’ image (Fig. 9-2), in which the aorta is the banana and the renal artery is the banana skin on each side, being peeled off the banana. If the main renal arteries cannot be demonstrated from the midline approach, a right or left lateral approach is used to follow each artery centrally from the renal hilum. Regardless of the technique used to identify the renal artery origin, the entire main renal artery should be visualised sonographically. Lack of visibility of even a 10 mm segment of main renal artery will limit the sensitivity of the direct method for RAS. This is especially relevant in younger patients in whom fibromuscular dysplasia is a concern; stenosis in these patients may not be near the renal artery origins (described later). As part of the direct Doppler evaluation, the peak systolic velocity with angle correction should be measured at the renal artery origin, mid and distal artery, and at any region of turbulent disorganised flow with aliasing on colour Doppler.
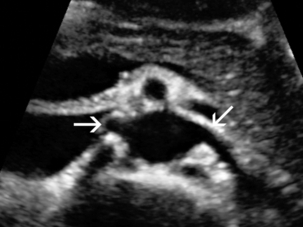
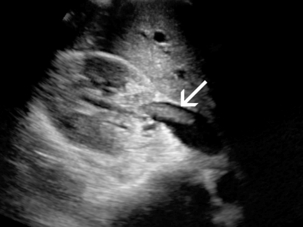
FIGURE 9-1 Normal renal arteries. Greyscale transverse image of the aorta demonstrates normal origins of the renal arteries (arrows).
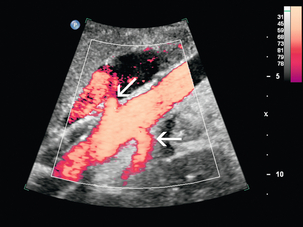
FIGURE 9-2 Normal renal arteries. Longitudinal power Doppler shows the aorta and both renal artery origins in normal location (arrows) with appearance termed as a ‘banana peel’.
Accessory renal arteries occur commonly (approximately 30% of kidneys), but are not always demonstrated sonographically. In fact, studies suggest that only 21–41% of accessory renal arteries are visualised by Doppler evaluation.2,3 This low success rate has prompted some individuals to argue that sonographic evaluation for RAS is not sensitive enough as a screening study. However, Bude et al. found that less than 1% of accessory renal arteries were the only stenotic artery,4 which essentially negates the significance of not visualising an accessory renal artery.
Segmental Intrarenal Artery Evaluation
When the main renal artery is not well seen in its entirety, evaluation of the segmental intrarenal arteries may allow a non-diagnostic direct examination to become diagnostic for RAS.5,6 We always examine the segmental arteries even when the main renal arteries are well seen, because the segmental artery waveform morphology may be useful in detecting concomitant renal parenchymal disease.
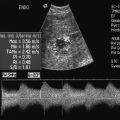
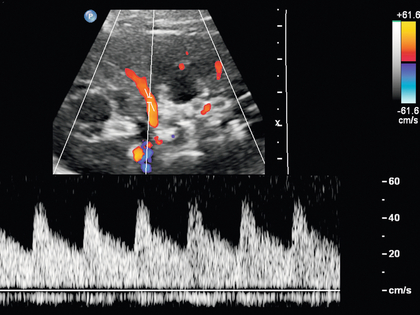
Characteristics of the spectral Doppler tracing in normal segmental intrarenal arteries should include rapid upstroke to an early systolic peak with gentle decrease in flow velocity during late systole and diastole (Fig. 9-3). Persistent antegrade flow throughout the cardiac cycle should be present without return to baseline. The resistive index (RI), calculated as:
is a common parameter for characterisation of arterial flow. The RI is inversely proportionate to the relative amount of diastolic flow. For instance, an end diastolic velocity that is 20% of the peak flow will result in RI of 0.80. The upper limit of RI in normal adults has been reported as less than 0.70,7 but concern for pathology is not often raised until the RI is 0.75–0.80, or higher. Furthermore, the RI may be affected by other factors such as heart rate, Valsalva, and arterial compliance. In fact, RIs greater than 0.70 are common in elderly patients.8 The impact of systemic vascular disease in chronic renal dysfunction is significant. It has been recently suggested that the renal RI measurement does not distinguish local from systemic vascular damage. A new potential ultrasound measurement, the difference of RIs between the spleen and kidney, may allow more specific evaluation of renal parenchymal damage.9 However, this study has not yet been further validated or widely applied in practice.
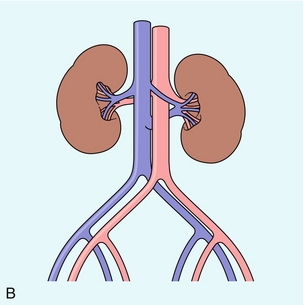
Anatomy of the Native Kidneys
ARTERIAL ANATOMY
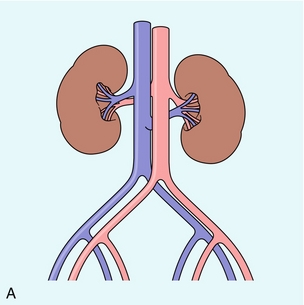
The renal arteries typically arise from the abdominal aorta caudal to the level of the SMA. The right renal artery usually originates from the anterolateral aspect of the aorta, while the left renal artery usually originates from the posterolateral aspect. As noted earlier, approximately 30% of patients will have more than one renal artery.10 Accessory renal arteries usually arise from the aorta caudal to the main renal artery to supply the renal lower pole, but occasionally will course cranially to supply the upper pole. Rarely, accessory arteries may arise from an iliac artery or even the SMA. Renal anomalies such as horseshoe or pelvic kidney almost always have multiple renal arteries, which may arise from the aorta or iliac arteries.
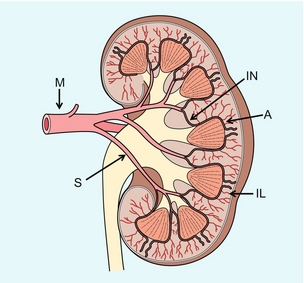
The branching pattern of the renal arteries progresses symmetrically to the renal cortex (Fig. 9-4). Segmental branches arise from the dorsal and ventral rami and run along the infundibulae before dividing into interlobar arteries. These interlobar arteries course between the pyramids, and then branch into arcuate arteries, which run along the bases of medullary pyramids. Within the cortex, small interlobular arteries course outward toward the surface of the kidney.
VENOUS ANATOMY
The renal venous anatomy parallels the arterial anatomy. Normal venous flow on spectral Doppler has a relatively low velocity. Its waveform is driven by right atrial activity. Accessory left renal veins are less frequent than accessory renal arteries; however, accessory right renal veins are quite common. Left venous anomalies may be seen in approximately 11% of patients.11 Variants most commonly include the retroaortic and circumaortic renal veins (Fig. 9-5), and these may be clinically relevant even beyond filter placement. In a recent study by Karazincir et al., the incidence of retroaortic left renal vein was found to be significantly higher in patients with varicocele, compared with controls12 (see Fig. 9-24 in the varicocele section).
Renal Failure and Obstruction
Doppler can play a supportive role in the diagnosis or exclusion of renal obstruction in patients with acute renal failure. Identification of a dilated renal collecting system is fairly easy with ultrasound. The difficulty, however (in the absence of prior examinations) is the differentiation of an acutely obstructed high-pressure system versus that of a low-pressure, chronically dilated system. It has been suggested that elevated resistive index may help differentiate between severe acute urinary obstruction and chronic dilatation.13–15 The RI of the obstructed kidney may be elevated relative to the normal contralateral kidney. An RI difference of greater than 0.10 between the non-obstructed and obstructed kidney is the suggested threshold for diagnosis of acute obstructed uropathy. However, intra-renal autoregulatory hormonal systems counteract the mechanical effect of the high-pressure collecting system pressing upon the parenchyma. This rapidly modifies the resistance to flow, reducing sensitivity of the test. In the setting of partial obstruction or less severe obstruction, this finding also lacks sensitivity.16,17 As an aside, in cases of chronic renal disease without obstruction, elevated RI > 0.80 has been shown to be associated with worsening renal function and mortality.18
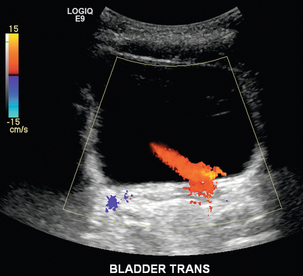
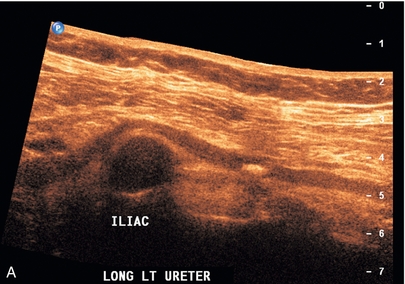
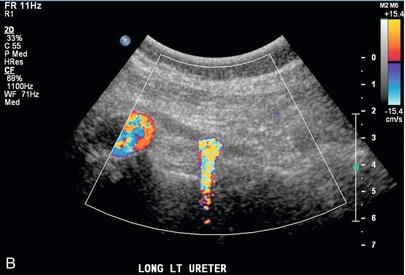
Another Doppler tool to assist in the evaluation of urinary obstruction can be performed within the bladder. In cases with suspected renal obstruction, sonographic evaluation for a ureteral jet should be a component of the renal ultrasound examination (Fig. 9-6). Although entry of urine into the urinary bladder is not synchronous, demonstration of three or more ureteral jets by Doppler on one side without a single pulse of flow from the contralateral side implies obstruction of the non-pulsing ureter.
Nephrolithiasis
Colour Doppler evaluation should be a routine component of the renal ultrasound examination when nephrolithiasis is suspected. Greyscale alone has poor sensitivity for small renal stones. Using colour Doppler, twinkle artifact19 can increase confidence in the presence of renal, ureteral or bladder stones (Fig. 9-7). The irregular surface of the calculus causes a Doppler shift which manifests as a noisy colour and spectral signal. This helps confirm that a bright echogenic focus within the renal hilum is indeed a calculus, rather than bright echogenic renal hilar adipose tissue. This technique should be used to demonstrate the presence of the stone, not to measure size of the stone. This is an especially useful adjunct to evaluate for distal ureteral stone with endovaginal technique when a dilated upper renal collecting system is identified in pregnancy (Fig. 9-8).
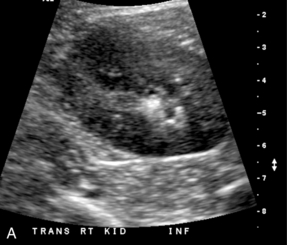
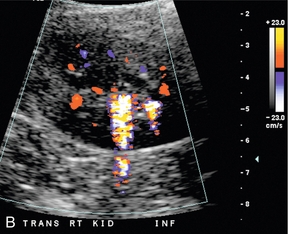
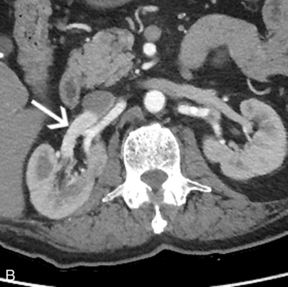
FIGURE 9-7 Renal calculus. (A). Greyscale ultrasound shows an echogenic focus in the calyceal region of the renal lower pole. However, there are other echogenic foci in this region, which may represent additional stones. (B) Colour Doppler confirms presence of two calculi with visualisation of ‘twinkle’ artifact.
Renal Tumours
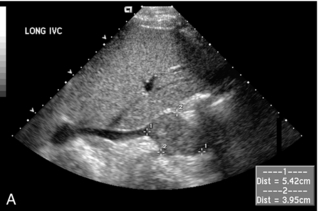
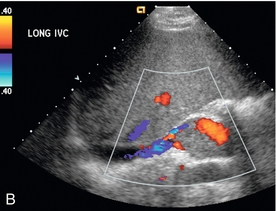
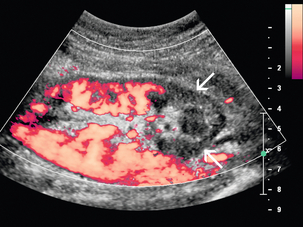
Greyscale ultrasound is the primary sonographic technique for detection of a renal tumour, but colour Doppler can provide additional information for surgical planning. Colour Doppler may be useful in intraoperative ultrasound examinations when trying to precisely identify the depth of tumour invasion (Fig. 9-9). Colour Doppler may also be helpful to confirm the extent of renal cell tumour invasion into the inferior vena cava (Fig. 9-10). This may be helpful for surgical planning by clearly delineating the cranial extent of tumour. Colour Doppler can help confirm whether tumour involves the intrahepatic portion of the IVC, which would significantly increase the complexity of surgical removal. The presence of arterial signal within the thrombus confirms it as tumour thrombus (versus bland thrombus).
FIGURE 9-9 Renal tumour. (A) Longitudinal greyscale ultrasound demonstrates a solid exophytic mass arising from the renal lower pole. (B) Colour Doppler clearly depicts the margins of the tumour and the presence of vessels along its periphery. This allows better definition of the depth of invasion to aid in surgical planning.
Renal Vascular Abnormalities
RAS/HYPERTENSION
Renal vascular disease is an uncommon cause of hypertension; however, it is potentially curable, and is most commonly considered in young adult patients with abrupt onset of hypertension and uncontrolled or rapidly accelerating hypertension. Stenotic renovascular disease has two primary aetiologies, atherosclerosis and fibromuscular dysplasia. In older patients the underlying aetiology is most frequently renal ostial atherosclerotic disease. The second most common aetiology is fibromuscular dysplasia, which is an uncommon disorder seen most frequently in younger women, and unlike atherosclerotic lesions, generally responds well to angioplasty.20,21 The role of imaging is influenced by the potential benefit of intervention.1 Although renal artery stenosis can be identified with imaging, recent studies suggest that simply the identification of stenosis does not justify invasive treatment by stenting. Two recent randomised trials, including the ASTRAL study, have shown no benefit to revascularisation of atherosclerotic lesions, with regards to either blood pressure or renal function.22,23 The ASTRAL study found that there was no significant difference in two randomised cohorts of patients between medical management versus stent therapy for the treatment of RAS. The long-standing ischaemic insult to the renal parenchyma with associated cholesterol crystal embolisation causes significant damage that does not benefit from reestablishment of more normal flow through the main renal artery. Evaluation of renal perfusion in the presence of stenosis may be more useful to select patients who will benefit from intervention. Some authors have suggested Doppler measurement of resistive index, with high resistance behind a stenosis indicating significant parenchymal damage. A patient with a low-resistance tardus-parvus waveform may, however, still benefit. Recent advances in MR perfusion technology allow measurement of perfusion/diffusion and tissue oxygenation, making it more accurate in this prediction.
Although CT and MR angiography are probably used more frequently for evaluation of RAS in most institutions, ultrasound is an ideal initial screening study because of the lack of ionising radiation or contrast administration. In ultrasound programmes experienced with renal vascular ultrasound, recent studies have shown the sensitivity and specificity of Doppler ultrasound for RAS is up to 95% and 90%, respectively.24
There are two main methods for sonographic detection of RAS: direct demonstration of RAS and indirect assessment of the downstream effect of the stenosis on the segmental renal arteries25 (Box 9-2). Greyscale findings are first considered and a renal length disparity greater than 2 cm with cortical thinning should raise concern for the diagnosis. Visualisation of turbulent flow within the renal artery on colour Doppler suggests an area of stenosis.26 Increased velocities in the focal area of stenosis may appear as colour aliasing if the velocity is beyond the scale limits and wraps into the other end of the colour scale (Fig. 9-11), and should lead to close evaluation with spectral Doppler in this area. Spectral Doppler confirmation of RAS relies primarily on demonstration of elevated PSV and demonstration of disturbed flow distal to the lesion.
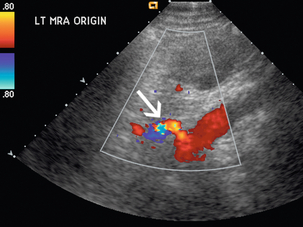
FIGURE 9-11 Renal artery stenosis. Turbulent flow may appear as ‘aliasing’ on colour Doppler (arrow) as elevated velocities wrap around into the lower colour scale.
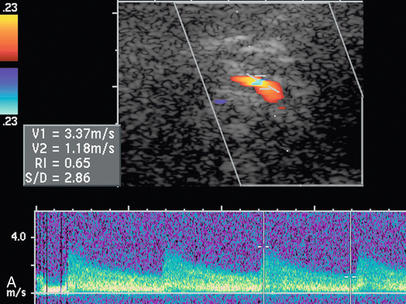
Varying criteria have been suggested for the direct spectral Doppler diagnosis of RAS, which has resulted in controversy. A PSV of greater than 200 cm/s (Fig. 9-12) has been suggested for Doppler diagnosis of 60% diameter reduction of the renal artery.27,28 In a recent meta-analysis, PSV was the best critical factor in diagnosing RAS, with sensitivity and specificity of 85% and 92%, respectively.29 The ratio of the renal artery PSV to the aortic PSV (RA/Ao) is another criterion suggested for diagnosis of RAS. An RA/Ao PSV ratio of greater than 3.5:1 (Fig. 9-13) suggests significant RAS, yielding 91% sensitivity and 91% specificity.30 An elevated ratio of peak renal artery systolic velocity to distal renal artery systolic velocity has also been suggested as a criterion for diagnosis of RAS.31,32 One study of 187 renal arteries with angiographic correlation also showed an absolute renal interlobar PSV of less than 15 cm/s resulted in 87% and 91% sensitivity and specificity, respectively, for Doppler diagnosis of 50% stenosis.32 Jian-Chu et al. have recently studied the impact of atherosclerosis and age on Doppler sonographic parameters for the diagnosis of RAS and suggest that use of the renal-aortic ratio and renal-interlobar ratio diagnostic thresholds differ in patients older versus younger than 46 years. Other sonographic criteria were not substantially affected by patient age in their study.33
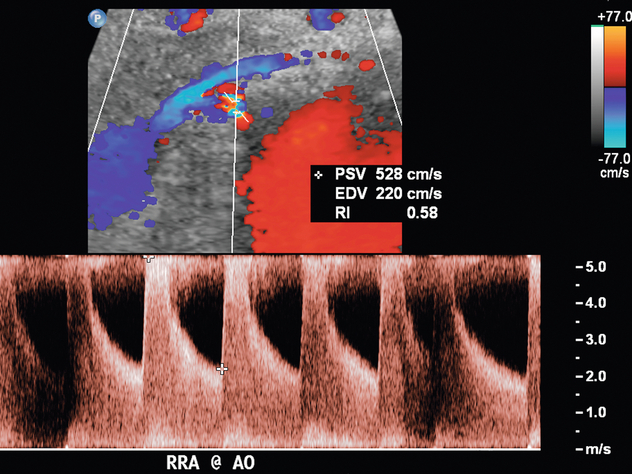
FIGURE 9-12 Renal artery stenosis. Duplex Doppler shows a region of colour Doppler aliasing (Doppler gate), and the peak systolic velocity measures 528 cm/s, which is above the 200 cm/s threshold.
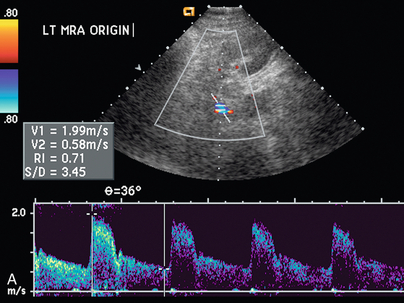
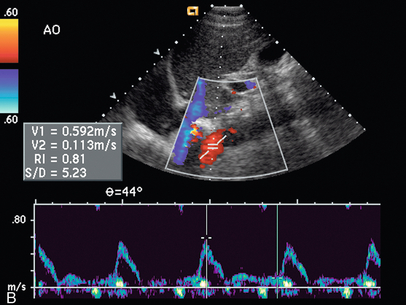
FIGURE 9-13 Renal artery stenosis. (A) Duplex Doppler of renal artery demonstrates borderline peak systolic velocity, 199 cm/s. (B) Spectral Doppler waveform of the aorta shows peak velocity is 59 cm/s. The calculated renal artery-aortic peak systolic velocity ratio of 3.72 is above the 3.5 threshold, suggesting significant stenosis.
The indirect method of RAS assessment of segmental renal artery waveforms becomes important when the entire length of the main renal artery cannot be directly seen with ultrasound. Stavros et al.5,34 have suggested that normal intrarenal waveform morphology with early systolic peak in the upper, interpolar, and lower pole segmental renal arteries may be used to adequately exclude significant RAS. This normal compliance peak (Fig. 9-14) is not present when there is flow-limiting stenosis in the proximal artery, although others have found this sign less sensitive.35
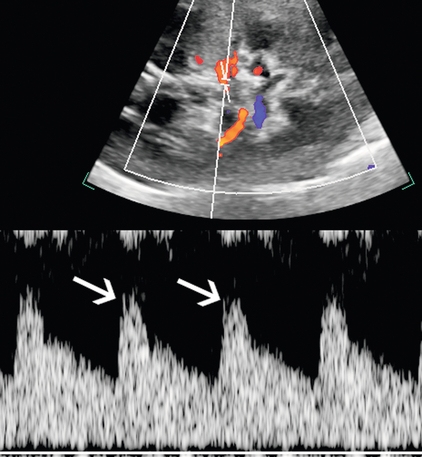
FIGURE 9-14 Normal segmental artery compliance peak. Duplex Doppler shows an early systolic small peak (arrows) at the point of peak systolic velocity in the absence of upstream stenosis.
Another criterion of RAS is prolonged acceleration time of greater than 0.07 second. Acceleration time is the time interval from onset of systole to the early systolic peak. In blunted waveforms, this early peak may be absent, and the measurement should extend from onset of systole to the first point of deflection.36 The presence of the tardus–parvus waveform morphology is helpful in the diagnosis of severe RAS; however, its absence does not exclude RAS.37 The tardus–parvus spectral waveform is defined by the slow upstroke (the tardus) and spectral broadening with blunting of the systolic peak (the parvus) (Fig. 9-15). It is important to note that in patients with atherosclerotic disease, vessel compliance may be diminished, making the tardus–parvus waveform morphology less obvious.38
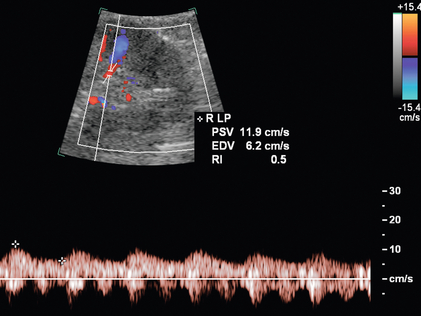
FIGURE 9-15 Renal artery stenosis. On duplex Doppler of a lower pole segmental artery, the delayed systolic acceleration (tardus) and small waveform (parvus) are consistent with upstream stenosis and further main renal artery evaluation is warranted if a stenosis has not yet been directly visualised.
A less common criterion suggested for diagnosis of RAS is excessive difference in RI of the two kidneys (≥ 0.07).5,39 For lesser degrees of stenosis, the abnormal kidney will show lower RIs beyond the point of stenosis due to post-stenotic dilatation. However, as the stenosis becomes more flow limiting, there may not be persistence of flow throughout the cardiac cycle, resulting in a high RI.
Another potential application of Doppler is for follow-up to assess for restenosis in patients after stent placement for RAS (Fig. 9-16). This may be ordered due to worsening renal function or even when clinical signs of restenosis are absent. In a study of 64 stented patients without clinical suspicion of restenosis, 22 patients had elevated PSV of greater than 200 cm/s and had significantly worsened rate of renal function decline than those patients with PSV of less than 200 cm/s.40 In 6 of 11 of these patients with this criterion who underwent angiography despite the lack of clinical suspicion, all had restenosis of greater than 70% at angiography.
RENAL ARTERY THROMBOSIS
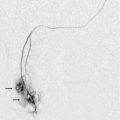
A regional lack of power Doppler flow in the renal parenchyma with wedge-shaped appearance suggests segmental infarction (Fig. 9-17). Search for other similar abnormalities in the contralateral kidney or other organs should be performed since this may be due to showering of emboli from a remote source.
RENAL ARTERY ANEURYSM
The diagnosis of renal artery aneurysm or pseudoaneurysm is most commonly made by CT or MRI. However, there are findings on Doppler that may be seen in this abnormality. It may appear as a vascular structure that is fusiform, eccentric, and saccular. RAA commonly arise from a branch point within the artery. On colour Doppler, there may be circular flow with a ‘yin-yang’ appearance (Fig. 9-18). A portion of the aneurysm may be thrombosed. It is common for RAA to have peripheral calcifications, and these may limit sonographic evaluation of central flow.
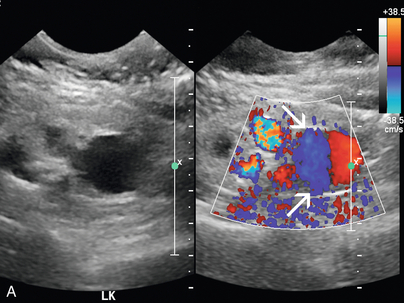
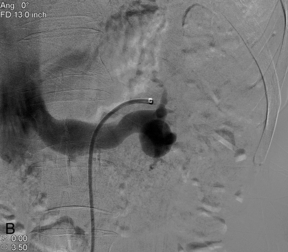
FIGURE 9-18 Renal artery aneurysm. (A) Split image shows anechoic round structure on greyscale with flow on colour Doppler. The circular flow on colour Doppler (arrows), termed the ‘yin-yang’ sign, can be seen with aneurysm or pseudoaneurysm. (B) On angiography, the typical round vascular structure of an aneurysm is confirmed.
ARTERIOVENOUS FISTULA AND MALFORMATIONS (AVF AND AVM)
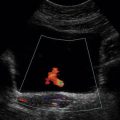
Arteriovenous fistula in the native kidney is rare except in cases of prior renal biopsy and will not be suspected sonographically if colour or power Doppler is not evaluated. Colour or power Doppler characteristically will show a large tortuous cluster of vessels. Spectral Doppler waveforms of the renal arteries feeding the fistula will show high velocity and low resistance (Fig. 9-19). The main renal vein may be dilated and arterialised waveforms may be found in veins near the fistula (Fig. 9-20).
VENOUS DISEASE
Renal Vein Thrombosis
Renal vein thrombosis (RVT) of the native kidneys is seen more commonly in the paediatric population than in adults. In adults, the underlying aetiology may include dehydration and nephrotic syndrome,41 hypercoagulable state, or trauma to the renal vein. Visualisation of renal vein flow with Doppler is critical in patients with clinical suspicion for acute RVT. It is important to demonstrate the entire renal vein before excluding renal vein thrombosis because the native kidney may develop collaterals quickly.
The diagnosis of RVT is based upon demonstration of thrombus filling the renal vein (Fig. 9-21) or non-occlusive thrombus surrounded by venous flow. In some cases, the vein may be expanded by the thrombus. The absence of flow in the renal vein without demonstration of thrombus may suggest RVT; however, demonstration of low-level colour signal within the vein on Doppler does not exclude the possibility of non-occlusive or occlusive renal vein thrombus. Monophasic venous waveforms are abnormal but not specific for RVT.42 Because of the potential for thrombus to extend cranially within the IVC (Fig. 9-22) and the effect on clinical management, the IVC should be imaged as part of the sonographic examination when evaluating for RVT.
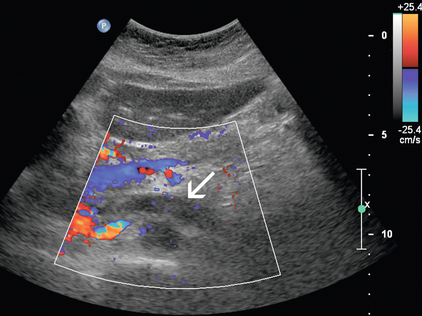
FIGURE 9-21 Renal vein thrombus. On colour Doppler, low-level echoes fill the left renal vein with absence of complete Doppler flow filling of the lumen (arrow).
Nutcracker Syndrome
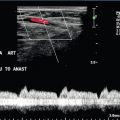
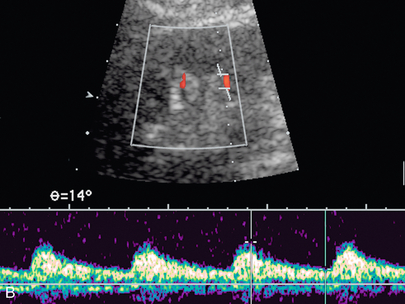
The ‘nutcracker’ phenomenon results from compression of the left renal vein between the superior mesenteric artery and the aorta and may lead to left renal vein hypertension, haematuria, and varix formation. It is important to remember that a distended left renal vein may be seen in some of the normal population by CT, MR, or ultrasound. Therefore, other criteria should be applied, including a high Doppler velocity ratio (Fig. 9-23) and high venous diameter ratio as described in recent literature.43 Due to the complexity of the potential surgical repair, measurement of a pressure gradient between the IVC and the left renal vein may be needed as confirmation before clinically significant renal vein compression is diagnosed. Visualisation of blood from the ureteral orifice on retrograde ureteroscopy may also be supportive. Colour flow Doppler may provide noninvasive evidence of renal vein compression with peak velocity ratio greater than 5:1 when collateral veins are demonstrated. On CT, there may be a sharp change in venous calibre as the vein crosses the SMA, usually with a ‘beaked’ appearance.
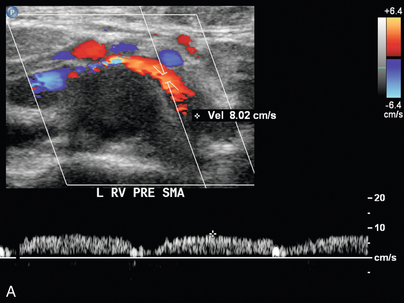
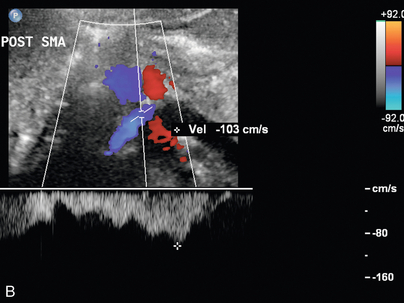
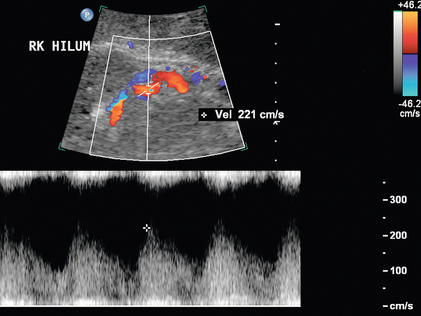
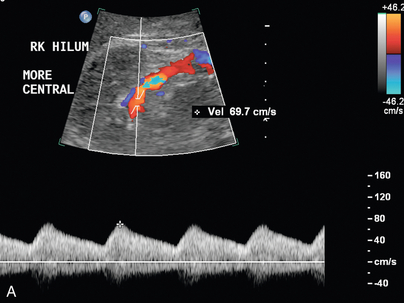
FIGURE 9-23 Renal vein nutcracker. In a patient with unexplained haematuria, spectral Doppler of the (A) preaortic left renal vein demonstrates normal low-velocity flow, 8 cm/s. (B) As the vein crosses between the aorta and SMA (Doppler gate), there is visible narrowing with elevated peak systolic velocity, 103 cm/s.
Varicocele Formation
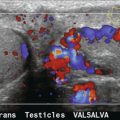
Varicocele is dilatation of the pampiniform venous plexus seen on testicular ultrasound examination, and is more common on the left due to anatomical factors of angle of insertion of the gonadal vein into the left renal vein and potential for compression of the left renal vein by the SMA. The primary type of varicocele is associated with incompetent valves, and the secondary type is associated with increased venous pressure due to obstructed venous outflow. Isolated right varicocele is uncommon and should warrant further evaluation of the right retroperitoneal area and kidney to exclude a right renal hilar mass or adenopathy compressing venous outflow. Diagnosis of varicocele is made on testicular ultrasound examination when the veins in the spermatic cord area are dilated to greater than 2 to 3 mm in diameter (Fig. 9-24). Rarely, the varix may be intratesticular in location. In some cases, colour Doppler of the dilated veins may show intraluminal thrombus. Reversal of venous flow at rest with increased reversed flow during Valsalva is suggestive of the diagnosis, but in some patients there may only be reversal during Valsalva.44 Techniques used to improve detection of varicocele include Valsalva or standing position. As noted earlier, a recent study by Karazincir et al. showed the incidence of retroaortic left renal vein was significantly higher in patients with varicocele compared with controls.12
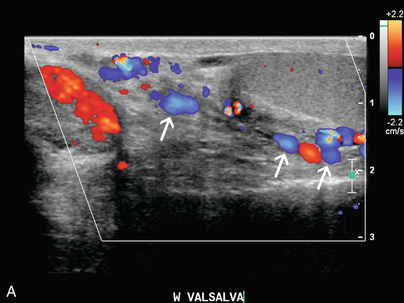
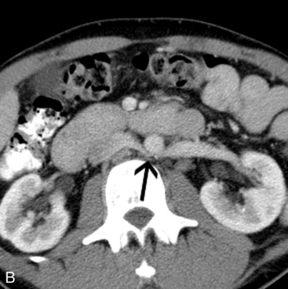
FIGURE 9-24 Varicocele. (A) Colour Doppler shows dilatation and increased flow within the vessels (arrows) of the spermatic cord and scrotum during Valsalva measuring greater than 3 mm diameter. In the setting of borderline findings, standing position of the patient may accentuate the finding. (B) CT in the same patient shows retroaortic left renal vein (black arrow).
REFERENCES
1. O’Neill, W. C., Bardelli, M., Yevzlin, A. S. Imaging for renovascular disease. Semin Nephrol. 2011 May; 31(3):272–282.
2. Aytac, S. K., Yigit, H., Sancak, T., Ozcan, H. Correlation between the diameter of the main renal artery and the presence of an accessory renal artery: sonographic and angiographic evaluation. J Ultrasound Med. 2003 May; 22(5):433–439. [quiz 440–2].
3. Halpern, E. J., Nazarian, L. N., Wechsler, R. J., et al. US, CT, and MR evaluation of accessory renal arteries and proximal renal arterial branches. Acad Radiol. 1999 May; 6(5):299–304.
4. Bude, R. O., Forauer, A. R., Caoili, E. M., Nghiem, H. V. Is it necessary to study accessory arteries when screening the renal arteries for renovascular hypertension? Radiology. 2003 Feb; 226(2):411–416.
5. Stavros, T., Harshfield, D. Renal Doppler, renal artery stenosis, and renovascular hypertension: direct and indirect duplex sonographic abnormalities in patients with renal artery stenosis. Ultrasound Q. 1994; 12(4):217–264.
6. Radermacher, J., Chavan, A., Schaffer, J., et al. Detection of significant renal artery stenosis with colour Doppler sonography: combining extrarenal and intrarenal approaches to minimize technical failure. Clin Nephrol. 2000 May; 53(5):333–343.
7. Platt, J. F. Duplex Doppler evaluation of native kidney dysfunction: obstructive and nonobstructive disease. AJR Am J Roentgenol. 1992 May; 158(5):1035–1042.
8. Tublin, M. E., Bude, R. O., Platt, J. F. Review. The resistive index in renal Doppler sonography: where do we stand? AJR Am J Roentgenol. 2003; 180(4):885–892. [Apr].
9. Grun, O. S., Herath, E., Weihrauch, A., et al. Does the measurement of the difference of resistive indexes in spleen and kidney allow a selective assessment of chronic kidney injury? Radiology. 2012 Sep; 264(3):894–902.
10. Cochran, S. T., Krasny, R. M., Danovitch, G. M., et al. Helical CT angiography for examination of living renal donors. AJR Am J Roentgenol. 1997 Jun; 168(6):1569–1573.
11. Kawamoto, S., Montgomery, R. A., Lawler, L. P., Horton, K. M., Fishman, E. K. Multidetector CT angiography for preoperative evaluation of living laparoscopic kidney donors. AJR Am J Roentgenol. 2003 Jun; 180(6):1633–1638.
12. Karazincir, S., Balci, A., Gorur, S., Sumbas, H., Kiper, A. N. Incidence of the retroaortic left renal vein in patients with varicocele. J Ultrasound Med. 2007 May; 26(5):601–604.
13. Gottlieb, R. H., Luhmann, Kt., Oates, R. P. Duplex ultrasound evaluation of normal native kidneys and native kidneys with urinary tract obstruction. J Ultrasound Med. 1989 Nov; 8(11):609–611.
14. Platt, J. F., Rubin, J. M., Ellis, J. H. Acute renal obstruction: evaluation with intrarenal duplex Doppler and conventional US. Radiology. 1993 Mar; 186(3):685–688.
15. Shokeir, A. A., Abdulmaaboud, M. Resistive index in renal colic: a prospective study. BJU Internat. 1999 Mar; 83(4):378–382.
16. Chen, J. H., Pu, Y. S., Liu, S. P., Chiu, T. Y. Renal hemodynamics in patients with obstructive uropathy evaluated by duplex Doppler sonography. J Urol. 1993 Jul; 150(1):18–21.
17. Gurel, S., Akata, D., Gurel, K., Ozmen, M. N., Akhan, O. Correlation between the renal resistive index (RI) and nonenhanced computed tomography in acute renal colic: how reliable is the RI in distinguishing obstruction? Am J Roentgenol: official journal of the American Institute of Ultrasound in Medicine. 2006 Sep; 25(9):1113–1120. [quiz 1121–3].
18. Radermacher, J., Ellis, S., Haller, H. Renal resistance index and progression of renal disease. Hypertension. 2002 Feb; 39(2 Pt 2):699–703.
19. Lee, J. Y., Kim, S. H., Cho, J. Y., Han, D. Colour and power Doppler twinkling artifacts from urinary stones: clinical observations and phantom studies. AJR Am J Roentgenol. 2001 Jun; 176(6):1441–1445.
20. Dworkin, L. D., Cooper, C. J. Clinical practice. Renal-artery stenosis. New Engl J Med. 2009 Nov 12; 361(20):1972–1978.
21. Safian, R. D., Textor, S. C. Renal-artery stenosis. New Engl J Med. 2001 Feb 8; 344(6):431–442.
22. Bax, L., Woittiez, A. J., Kouwenberg, H. J., et al. Stent placement in patients with atherosclerotic renal artery stenosis and impaired renal function: a randomized trial. Ann Intern Med. 2009 Jun 16; 150(12):840–848.
23. Wheatley, K., Ives, N., Gray, R., et al. Revascularisation versus medical therapy for renal-artery stenosis. New Engl J Med. 2009 Nov 12; 361(20):1953–1962.
24. Bokhari, S. W., Faxon, D. P. Current advances in the diagnosis and treatment of renal artery stenosis. Fall. Rev Cardiovasc Med. 2004; 5(4):204–215.
25. Lockhart, M. E., Robbin, M. L., Renal Vascular Imaging: Ultrasound and Other Modalities. Ultrasound Q. 2007; 23(4):279–292, doi: 10. 1097/ruq. 0b013e31815adf4c.
26. Helenon, O., el Rody, F., Correas, J. M., et al. Colour Doppler US of renovascular disease in native kidneys. Radiographics. 1995 Jul; 15(4):833–854.
27. Olin, J. W., Piedmonte, M. R., Young, J. R., DeAnna, S., Grubb, M., Childs, M. B. The utility of duplex ultrasound scanning of the renal arteries for diagnosing significant renal artery stenosis. Ann Intern Med. 1995 Jun 1; 122(11):833–838.
28. Pellerito, J. S. Z. W. Ultrasound assessment of native and renal vessels and renal allografts. In: WJ Z., ed. Introduction to Vascular Ultrasonography. Philadelphia, Pennsylvania, United States of America: Saunders Elsevier, 2005.
29. Williams, G. J., Macaskill, P., Chan, S. F., et al. Comparative accuracy of renal duplex sonographic parameters in the diagnosis of renal artery stenosis: paired and unpaired analysis. AJR Am J Roentgenol. 2007 Mar; 188(3):798–811.
30. Soares, G. M., Murphy, T. P., Singha, M. S., Parada, A., Jaff, M. Renal artery duplex ultrasonography as a screening and surveillance tool to detect renal artery stenosis: a comparison with current reference standard imaging. J Ultrasound Med. 2006 Mar; 25(3):293–298.
31. Chain, S., Luciardi, H., Feldman, G., et al. Diagnostic role of new Doppler index in assessment of renal artery stenosis. Cardiovasc Ultrasound. 2006; 4:4.
32. Li, J. C., Wang, L., Jiang, Y. X., et al. Evaluation of renal artery stenosis with velocity parameters of Doppler sonography. J Ultrasound Med. 2006 Jun; 25(6):735–742. [quiz 743–4].
33. Li, J. C., Xu, Z. H., Yuan, Y., et al. Impact of atherosclerosis and age on Doppler sonographic parameters in the diagnosis of renal artery stenosis. J Ultrasound Med. 2012 May; 31(5):747–755.
34. Stavros, A. T., Parker, S. H., Yakes, W. F., et al. Segmental stenosis of the renal artery: pattern recognition of tardus and parvus abnormalities with duplex sonography. Radiology. 1992 Aug; 184(2):487–492.
35. Postma, C. T., Bijlstra, P. J., Rosenbusch, G., Thien, T. Pattern recognition of loss of early systolic peak by Doppler ultrasound has a low sensitivity for the detection of renal artery stenosis. J Human Hypertens. 1996 Mar; 10(3):181–184.
36. Halpern, E. J., Needleman, L., Nack, T. L., East, S. A. Renal artery stenosis: should we study the main renal artery or segmental vessels? Radiology. 1995 Jun; 195(3):799–804.
37. Kliewer, M. A., Tupler, R. H., Carroll, B. A., et al. Renal artery stenosis: analysis of Doppler waveform parameters and tardus-parvus pattern. Radiology. 1993 Dec; 189(3):779–787.
38. Demirpolat, G., Ozbek, S. S., Parildar, M., Oran, I., Memis, A. Reliability of intrarenal Doppler sonographic parameters of renal artery stenosis. J Clin Ultrasound. 2003 Sep; 31(7):346–351.
39. Bude, R. O., Rubin, J. M., Platt, J. F., Fechner, K. P., Adler, R. S. Pulsus tardus: its cause and potential limitations in detection of arterial stenosis. Radiology. 1994 Mar; 190(3):779–784.
40. Girndt, M., Kaul, H., Maute, C., Kramann, B., Kohler, H., Uder, M. Enhanced flow velocity after stenting of renal arteries is associated with decreased renal function. Nephron Clin Pract. 2007; 105(2):c84–c89.
41. Llach, F., Papper, S., Massry, S. G. The clinical spectrum of renal vein thrombosis: acute and chronic. Am J Med. 1980 Dec; 69(6):819–827.
42. Mulligan, S. A., Koslin, D. B., Berland, L. L. Duplex evaluation of native renal vessels and renal allografts. Semin Ultrasound CT MR. 1992 Feb; 13(1):40–52.
43. Kurklinsky, A. K., Rooke, T. W. Nutcracker phenomenon and nutcracker syndrome. Mayo Clin Proc. 2010 Jun; 85(6):552–559.
44. Tasci, A. I., Resim, S., Caskurlu, T., Dincel, C., Bayraktar, Z., Gurbuz, G. Colour Doppler ultrasonography and spectral analysis of venous flow in diagnosis of varicocele. Eur Urol. 2001 Mar; 39(3):316–321.