The interpretation of results
How biochemical results are expressed
Most biochemical analyses are quantitative, although simple qualitative or semi-quantitative tests, such as those for the presence of glucose in urine, are commonly encountered methods used for point of care testing. Many tests measure the amount of the analyte in a small volume of blood, plasma, serum, urine or some other fluid or tissue. Results are reported as concentrations, usually in terms of the number of moles in one litre (mol/L) (Table 3.1).
Table 3.1
| Mole | Abbreviation | Definition |
| Millimole | mmol | ×10−3 of a mole |
| Micromole | µmol | ×10−6 |
| Nanomole | nmol | ×10−9 |
| Picomole | pmol | ×10−12 |
| Femtomole | fmol | ×10−15 |
The concept of concentration is illustrated in Figure 3.1. The concentration of any analyte in a body compartment is a ratio: the amount of the substance dissolved in a known volume. Changes in concentration can occur for two reasons:
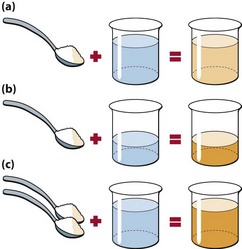
Fig 3.1 Understanding concentrations. Concentration is always dependent on two factors: the amount of solute and the amount of solvent. The concentration of the sugar solution in the beaker can be increased from 1 spoon/beaker (a) to 2 spoons/beaker by either decreasing the volume of solvent (b) or increasing the amount of solute (c).


Variation in results


Precision and accuracy
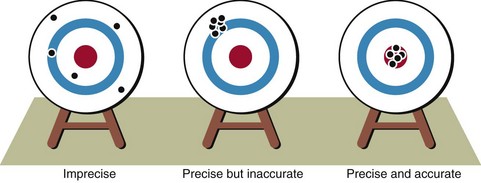
Precision is the reproducibility of an analytical method. Accuracy defines how close the measured value is to the actual value. A good analogy is that of the shooting target. Figure 3.2 shows the scatter of results which might be obtained by someone with little skill, compared with that of someone with good precision where the results are closely grouped together. Even when the results are all close, they may not hit the centre of the target. Accuracy is therefore poor, as if the ‘sights’ are off. It is the objective in every biochemical method to provide good precision and accuracy. Automation of analyses has improved precision in most cases.
Reference intervals
Analytical variation is generally less than that from biological variation. Biochemical test results are usually compared to a reference interval chosen arbitrarily to include 95% of the values found in healthy volunteers (Fig 3.3). This means that, by definition, 5% of any population will have a result outside the reference interval. In practice there are no rigid limits demarcating the diseased population from the healthy; however, the further a result is from the limits of the reference interval, the more likely it is to indicate pathology. In some situations it is useful to define ‘action limits’, at which appropriate intervention should be made in response to a biochemical result. An example of this is plasma cholesterol.
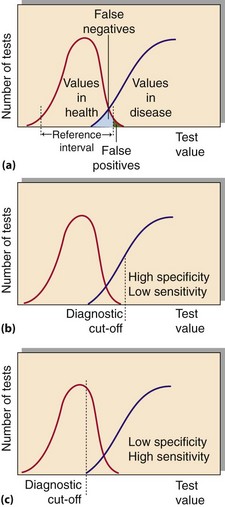
Fig 3.3 (a) Overlap of biochemical results in health and disease. (b) and (c) The effect of changing the diagnostic cut-off on test specificity and sensitivity.
There is often a degree of overlap between the disease state and the ‘normal value’ (Fig 3.3). An abnormal result in a patient who is subsequently found not to have the disease is called a ‘false positive’. A ‘normal result’ in a patient who has the disease is a ‘false negative’.
Specificity and sensitivity of tests
The specificity of a test measures how commonly negative results occur in people who do not have a disease. Sensitivity is a measure of the incidence of positive results in patients who are known to have a condition. As noted above, the use of the terms specificity and sensitivity in this context should not be confused with the same terms used to describe analytical performance. An ideal diagnostic test would be 100% sensitive, showing positive results in all diseased subjects, and 100% specific, with negative results in all persons free of the disease. Figure 3.3 shows the effect of changing the ‘diagnostic cut-off value’ on test specificity and sensitivity.
Biological factors affecting the interpretation of results
 Sex. Reference intervals for some analytes such as serum creatinine are different for men and women.
 Age. There may be different reference intervals for neonates, children, adults and the elderly.
 Diet. The sample may be inappropriate if taken when the patient is fasting or after a meal.
 Timing. There may be variations during the day and night.
 Stress and anxiety. These may affect the analyte of interest.
 Posture of the patient. Redistribution of fluid may affect the result.
 Effects of exercise. Strenuous exercise can release enzymes from tissues.

 Pregnancy. This alters some reference intervals.
 Menstrual cycle. Hormone measurements will vary throughout the menstrual cycle.
 Drug history. Drugs may have specific effects on the plasma concentration of some analytes.
Other factors
The clinician may well ask the following questions on receiving a biochemistry report:
 ‘Does the result fit with the history and clinical examination of the patient?’
 ‘If the result is not what I expected, can I explain the discrepancy?’
 ‘How can the result change my diagnosis or the way I am managing the patient?’

 Clinical note
The interpretation of results
 Biochemistry results are often reported as concentrations. Concentrations change if the amount of the analyte changes or if the volume of solvent changes.
 Variability of results is caused by both analytical factors and biological factors.

 Different reference intervals may apply depending on the age or sex of the patient.


