THE ELECTROCARDIOGRAM (ECG)
Introduction
It is as important to recognize what the electrocardiogram (ECG) is not, as much as what it is. The origin of the cardiac action potential and the structure of the specialized conducting system of the heart are described in Chapter 3. The ECG is not a recording of the electrical activity of individual cells; it does not look like the action potential but reflects the activity of large numbers of cells taken en masse. It is possible to measure this activity because the heart lies in a container, the human body, which is full of a salt solution capable of carrying electrical current. Thus electrodes placed on the skin at a distance from the heart can be affected by the electrical changes within the myocardium. At rest the electrical activity of the heart dominates that of other excitable tissues such as nerve or skeletal muscle because of its relatively large mass and the coordination of its activity. A recording of the electrical activity of the heart is called an electrocardiogram. The overall net direction of the spread of excitation through the muscle mass of the left ventricle is called the cardiac axis.
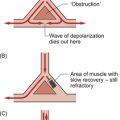
It is helpful to understand the characteristics of the ECG in terms of the underlying physical process. At rest the cardiac myocytes have a resting membrane potential around −85 mV (see Chapter 2). A group of cells undergoes depolarization; the membrane potential rises to around +30 mV before repolarization. Figure 7.1 shows a schematic ‘block’ of myocardial tissue that has groups of cells in all phases of polarization. The wavefront of depolarization is moving from left to right in the diagram from an area of tissue that has just been depolarized towards tissue which is about to be depolarized. If we consider electrodes applied to the left and right of our block of tissue we see that there is an electrical potential difference between the electrodes. It is this potential difference between the tissue in front of the wave of depolarization and the tissue behind it that we measure as an ECG. The flow of current is from behind the wavefront of depolarization to in front of it and this is by convention taken as ‘positive’ and produces an upward deflection of the recorder pen.
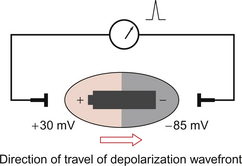
Fig. 7.1 Origin of the ECG signal.
The heart is a complex shape with depolarization spreading simultaneously in many different directions. At any one moment in time there will however be a dominant (net) direction of the spread of depolarization. By considering the heart as a battery lying in the direction of the spread of depolarization the sequential changes in deflection of the ECG pen can be more easily understood. This is equivalent to holding the battery at various orientations (Fig. 7.2). It is important to realize that it is not the heart that is changing orientation, only the direction of the wavefront of depolarization within the heart. The shape of the ECG waveform reflects the changing distribution of polarized and depolarized tissue within the heart with time.
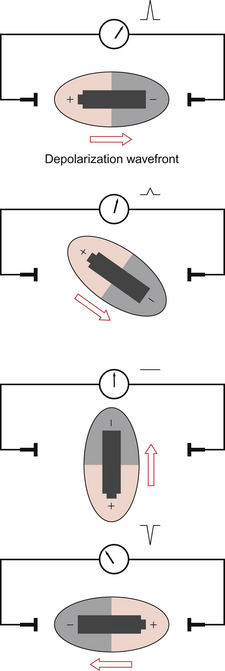
Fig. 7.2 Variation of ECG with orientation.
The amplitude of the ECG deflection reflects the mass of tissue involved. Thus the atrial element of the ECG (P wave) is always smaller than the ventricular element (QRS complex), even though the change in membrane potential is the same in each case. Hypertrophied ventricles, for example, resulting from hypertension, will tend to give larger deflections than the average. The amplitude of the ECG deflection is also affected by other physical factors such as size, chest inflation and fat tissue.
• The ECG represents the spread of depolarization and repolarization through the myocardium.
• The pattern of the ECG is dependent on the net activity of the myocardium at any given instant.
• The pattern of the ECG is dependent on the relative orientation of the heart and the electrodes.
• Many pathological factors within the myocardium such as hypertrophy and ischaemic damage affect the pattern of the ECG.
• Many extracardiac factors such as posture and chest deformity may affect the ECG.
What information can be derived from an ECG recording?
• Heart rate: an ECG recording can trigger electronic ratemeters.
• Rhythm: normal and abnormal rhythms can be recorded.
• Conduction times through components of the heart can be evaluated from the duration of the components of an ECG trace.
• The direction of the mean cardiac axis of the heart in both vertical and horizontal planes can be determined.
• The extent and location of ischaemic damage.
• The effects of altered electrolyte concentration.
• The effects of drugs which affect the conducting system (antiarrhythmic drugs, digitalis glycosides, calcium channel blockers) can be monitored.
Producing a 12-lead ECG
Recording a 12 lead ECG requires the connection of two groups of electrodes to the subject:
The limb lead electrodes are the simplest set of electrodes and were used by Einthoven in his experiments. The basic electrode positions are on the right arm, left arm and left leg. By using the electrodes in pairs we generate sets of measurements with a specific axis or vector described as a ‘lead’. Lead I utilizes the right and left arms and the axis of measurement is from right to left directly through the chest (Fig. 7.3). Lead I is taken as 0° and angles are measured clockwise from lead I. Lead II utilizes the right arm and left leg giving an axis theoretically at +60° to lead I. Lead III utilizes the left arm and left leg giving an axis which lies at +120°. These axes are summarized in Figure 7.3. A further electrode is placed on the right leg. This is not used directly for recording but serves as a neutral reference for the other leads.
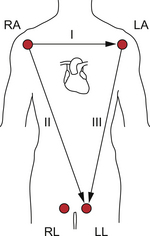
Fig. 7.3 Basic limb leads.
Augmented limb leads (aVR, aVL, aVF)
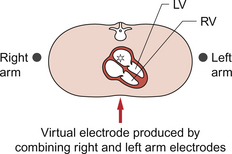
The augmented limb leads are produced by combining pairs of electrodes to produce ‘virtual’ electrodes which do not have direct physical existence. Thus, for example, by electronically combining the right arm and left arm electrodes we get a virtual electrode which appears to lie within the centre of the upper chest (Fig. 7.4). This virtual electrode can then be linked with the electrode on the left leg to give a new lead (aVF) with a new (vertical) axis. The complete set of augmented limb leads is produced by combining groups of three limb electrodes as shown in Table 7.1.
Table 7.1
A complete set of augmented limb leads produced by combining groups of three limb electrodes
| Augmented limb lead | +ve electrode | −ve electrode |
| aVR | Right arm | Left arm + Left leg |
| aVL | Left arm | Right arm + Left leg |
| aVF | Left leg | Right arm + Left arm |
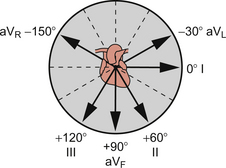
The geometry of the augmented leads is shown in Figure 7.5. The result is a new series of axes which complement the three basic limb leads. It is now possible to identify leads which come in pairs at right angles (orthogonal) to each other: lead I and aVF, lead II and aVL, lead III and aVR. This is of practical value in simplifying the analysis of the ECG (see later in this chapter).
Chest leads
The limb leads provide information about the depolarization wavefront in a coronal (vertical) plane. The chest leads give us information about the wavefront in a skewed transverse plane which approximates to the base–apex axis of the heart. The surface electrodes are applied as shown in Figure 7.6 A and as described below.
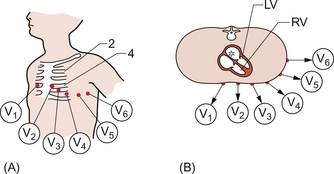
Fig. 7.6 Chest leads. (A) Position on chest. (B) Orientation in transverse plane. Adapted from Hampton 2003.
V1: 4th intercostal space right sternal edge
V2: 4th intercostal space left sternal edge
V3: directly halfway between V2 and V4
V4: 5th left intercostal space mid-clavicular line
The limb leads are ‘combined’ electronically to create a virtual electrode over the spine. Thus leads V1 to V6 record the movement of the depolarization wavefront from the virtual electrode out in the direction of each of the chest electrodes as shown in Figure 7.6B.
12 lead ECG
We now have a total of 12 leads (I, II, III, aVR, aVL, aVF and V1–6) derived from 10 electrodes. This is the standard ECG printout, an example of which is shown in Figure 7.7. Though more leads and different arrangements of presentation are possible this is the commonest form in which the ECG is presented. Note, the ‘V’ leads as described here may sometimes be shown as ‘C’ leads on a printout (see Figure 7.7).
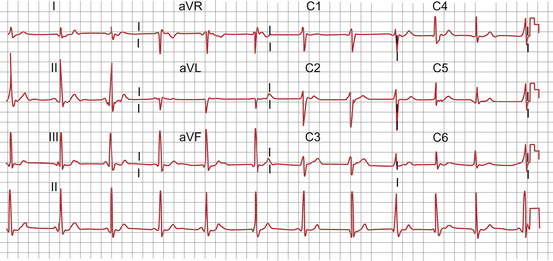
Fig. 7.7 Standard 12-lead ECG.
The components of the ECG trace
A schematic ECG waveform recorded in lead II is shown in Figure 7.8. The standard nomenclature, P, QRS, T and U waves is arcane. Originally waveforms were labelled A, B, C and D. As the equipment developed the waveforms changed shape and needed new labels. It was decided to use the second half of the alphabet starting at O for the starting point of the recording. The next features were labelled P, Q, R, S and T respectively. The flat line which precedes the P wave is equivalent to ‘O’ but this labelling is not used.
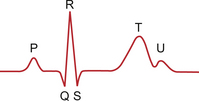
Fig. 7.8 Elements of the ECG waveform.
There is a variable gap between the end of the P wave and the start of the QRS complex, the P–R interval. This interval represents the time taken for the atrial depolarization to reach the ventricular myocardium (see Chapter 2). It is a period of apparent inactivity but it in fact mainly represents the time needed for depolarization of the atrioventricular node (AV node) and the bundle of His. Since only a small amount of cardiac tissue is involved and this is surrounded by other, inactive, ventricular myocardium it does not produce a measurable deflection. However this region is extremely important as many clinically significant pathologies, such as heart block, have their origins in this region of the heart and cause characteristic changes in this part of the ECG.
The QRS complex reflects the stages of mass ventricular depolarization. The initial deflection is produced by the posterior–anterior depolarization of the interventricular septum. In the normal heart the next stage is the depolarization of the bulk of the left ventricular apex and free wall. The final portion of the QRS complex is produced by the depolarization of the right ventricular free wall. The width of the QRS complex reflects the rate at which the wave of depolarization travels through the ventricles. This is largely determined by the Purkinje fibres of the specialized conducting system (see Chapter 2) which act as rapid distributors of the wave of depolarization through the myocardium.
A further ‘quiet’ phase occurs: the ST segment. This phase represents the period when all of the ventricular muscle has been depolarized and myocardial contraction occurs. Myocardial contraction is not complete until the end of the T wave which represents the phase of ventricular repolarization.
Practical use of the ECG
Heart rate
For the purpose of examining rate and rhythm the standard 12 lead ECG is printed with a particularly long recording of lead II (Fig. 7.7) which is referred to as the rhythm strip. Lead II is usually selected because it is one of the leads which gives particularly clear representations of the P wave. V1 may be used for the same reason.
Rhythm
• single P wave precedes every QRS complex
• P–R interval is constant and within normal range for duration
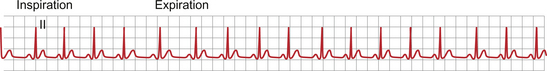
In some individuals a marked sensitivity of the sinus node to vagal tone produces a regular variation in heart rate with respiration. The heart rate increases on inspiration. This is known as sinus arrhythmia and is illustrated in Figure 7.9. It is more common in children and tends to disappear as they get older.
Normal intervals on the ECG
The definition and normal ranges for various ECG intervals are shown in Figure 7.10 and Table 7.2. Most pathologies increase the length of intervals by damaging the conduction tissue. For example surgery on the right ventricle may damage the Purkinje fibres which distribute electrical activity throughout the right ventricle. This leads to delayed depolarization of the right ventricle when compared with the left ventricle. The QRS complex is slurred, with particular broadening of the latter part of the complex.
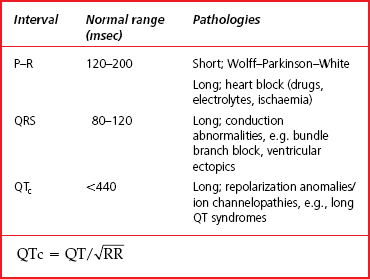
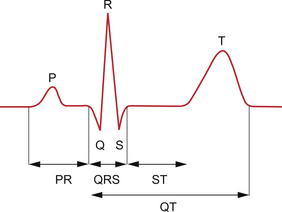
Fig. 7.10 ECG intervals.
Axis
We have discussed the speed (rate) and coordination (rhythm) of electrical activity shown by the ECG. We now come to how the ECG can be used to identify the direction of travel of the wavefront of depolarization through the heart. Figure 7.2 shows how the orientation of the wavefront of depolarization with respect to the electrodes gives a different signal depending on the lead examined. Of course the heart is not a simple block of tissue but a complex tubular structure. However we can use the basic principle of Figure 7.2 to derive the following rules which allow us to define the direction of travel of depolarization;
• deflections are greatest and positive in the leads falling along the line of travel
• deflections are minimal in leads at right angles (orthogonal) to the line of travel
• the greater the amount of tissue involved the greater the deflection.
Thus by examining the deflection in various leads it is possible to identify the depolarization vector, a concept which tells us in what direction the wavefront is travelling, and to some extent the amount of tissue involved. There are two main forms of the depolarization vector: instantaneous and average or mean. The difference between these two is shown in Figure 7.11A. The instantaneous vector involves measurements taken at a single point in time. From the shape of the QRS complex it can be inferred that this vector varies with the cardiac cycle. The mean vector is derived from the average deflection in a lead. Thus the mean vector gives an average over the whole of the cardiac cycle.
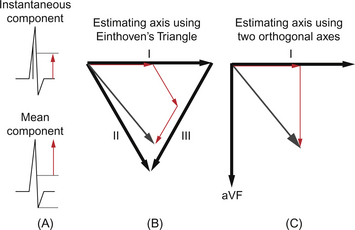
Measuring the axis: Einthoven’s triangle
In Einthoven’s original work he used the geometry of the limb leads to construct an equilateral triangle (Fig. 7.11B). To estimate the axis of any part of the ECG we must measure the deflection in a given lead and by adding these components together in line with their respective leads we generate a vector which represents the direction of depolarization (Fig. 7.11B). By using the limb leads we assess the vertical (frontal) plane vector.
Einthoven’s triangle has confused and intimidated many generations of students. However the concept is similar to that of vectors in mathematics. A vector in any two-dimensional plane may be described by the sum of its orthogonal components (Fig. 7.11C). The fact that the three limb leads describe a triangle makes the summation more difficult. In practice the same result can be obtained from two leads at right angles. Since the three basic limb leads are not orthogonal we must use the augmented limb leads.
The normal range for the mean frontal QRS vector is −30° to +90° in the adult. In children the normal range is taken to be 0° to +180°. The variation in childhood is discussed in Chapter 12 but reflects the greater right ventricle workload before birth. Postnatally the left ventricle comes to dominate the right and so the axis swings from right to left.
At a more practical level we can identify four quadrants into which the mean frontal plane vector will fall by assessing leads I and aVF (Fig. 7.12). The net deflection in each lead is estimated as positive (upward) or negative (downward).

The ECG and rhythm disturbances
The origin of arrhythmias
In order to understand the theoretical basis of arrhythmias it is useful to consider the prerequisites of sustaining abnormal electrical activity. Fundamental is the need to have electrically receptive tissues in which the wavefront of depolarization may propagate. Physical factors such as size and shape combine with electrical factors such as speed of propagation, refractory period and rate of spontaneous depolarization (automaticity). Structural anomalies including ischaemic damage, surgical scars, physiological state, metabolic changes, drugs and genetic variations all contribute separately and together to produce abnormal patterns of electrical activity.
• rate above (tachycardia) or below (bradycardia) the expected rate for circumstances and age
• narrow or broad QRS complex (broad complex implies ventricular distribution is not via the normal conducting system)
Atrial flutter
Using the criteria outlined above atrial flutter is associated with:
Atrio-ventricular (AV) tachycardia
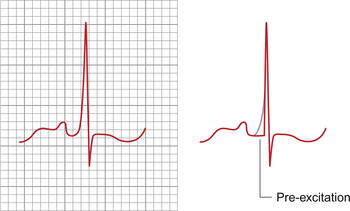
An example of the macroscopic type of accessory pathway is the Wolff–Parkinson–White syndrome (WPW syndrome). In WPW there is myocardial bridging of the ring of fibrous tissue which acts as an insulator at the atrioventricular junction (see Chapter 2). In sinus rhythm the ECG typically shows a short P–R interval with slurring and broadening of the initial part of the QRS complex (so called Δ wave); an example is shown in Figure 7.13. In sinus rhythm the atrial depolarization is conducted to the ventricular myocardium via the normal AV nodal route but also, simultaneously, over the accessory pathway. The apparent shortening of the P–R interval occurs because the AV node slows conduction to the ventricles as normal but the accessory pathway conducts relatively rapidly initiating ventricular depolarization early with respect to the normal conducting system. Whilst the AV node is conducting it produces no obvious deflection on the ECG but the prematurely activated myocardium does. This premature activation spreads slowly through the ventricular myocardium producing the initial slurred portion of the QRS complex. However after the normal P–R interval, activation of the ventricles occurs as usual via the conducting system. Because this normal activation is distributed rapidly throughout the conducting system it overtakes the early activation of the ventricle and so ‘normalizes’ the QRS pattern. This is a good illustration of how the ECG may reflect simultaneous but separate events and how interpreting the ECG in the light of multiple processes aids understanding of the underlying electrical activity.
Abnormalities of conduction
Abnormalities of conduction, as opposed to rhythm, apply to pathologies of the special conducting system of the heart and include heart block and bundle branch block. The term heart block refers to conditions in which the pattern of conduction through the heart is abnormal. Heart block can be divided into two major groups; pathologies affecting the AV node and proximal bundle of His (first, second and third degree heart blocks) and pathologies affecting the distributive conducting systems (intraventricular conduction disturbance, e.g. right and left bundle branch blocks). These topics are well covered in standard texts on the clinical interpretation of the ECG and have been referred to in Chapter 2. Here we shall confine ourselves to a brief overview.
Atrioventricular conduction disturbance
First degree heart block is present when the P–R interval is greater than the normal range (Table 7.2). Since conduction through the atrium is only rarely significantly prolonged an increase in the P–R interval is usually attributable to a delay in conduction through the AV node. This is occasionally found in asymptomatic individuals with normal hearts and is not of clinical significance. However some drugs such as verapamil slow AV nodal conduction and may cause first degree block.
Third degree or complete heart block occurs when there is no relationship between the atrial and ventricular rates. Third degree block only occurs where there is loss of conduction through the AV node or proximal bundle of His and usually reflects significant damage to the conducting system which is either iatrogenic (e.g. surgical) or pathological (e.g. infarction or infection). It is possible to recover from transient third degree heart block but frequently the individual is at risk of late recurrence, particularly if there is an associated bundle branch block. In complete heart block the ventricular rate is determined by the intrinsic rate of the ventricular muscle (see Chapter 2). In most cases the ventricular rate (30–40 bpm) is insufficient to maintain an adequate cardiac output. In this case emergency pacing is required until a permanent pacing system can be implanted. Emergency pacing may be achieved either using external pads on the chest or by placing a pacing wire into the right ventricle via the subclavian, femoral or jugular vein. Permanent pacing is achieved using a battery-powered generator connected to leads which activate the right atrium and right ventricle in synchrony. Modern pacing systems are extremely sophisticated and may even involve pacing both ventricles separately.
Intraventricular conduction disturbances
The width of the QRS complex is largely determined by the time taken to distribute the wavefront of depolarization through the ventricular myocardium. The structure of the conducting system is discussed in Chapter 2. The bundle of His gives rise to left and right branches which supply the left and right ventricles respectively. These fibres follow the inner surface of their respective ventricle and so normal depolarization takes place from inside (endocardium) to outside (epicardium). The earliest ventricular myocardial activation occurs in the interventricular septum and is dominantly from left ventricle to right, producing a positive deflection in V1 on the standard adult ECG. The depolarization of the left ventricular muscle mass proceeds next leading to a negative deflection in V1 and positive deflection in V6. Finally the anterior free wall of the right ventricle depolarizes producing a positive deflection in V1 and negative deflection in V6. When conduction is normal elements may be fused to give a single deflection which is dominated by the left ventricular components producing only a large negative deflection in V1 and positive deflection in V6. Figure 7.14A shows schematic patterns from V1 and V6.
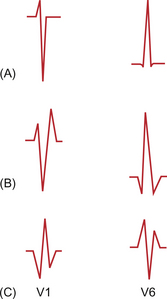
One example of damage to the conducting system is the result of surgery on the right ventricle. Frequently this may damage the right bundle branch and leads to a typical pattern in the chest leads. Since the initial postero-anterior depolarization of the septum is enhanced the initial deflection in V1 is positive, followed by a negative deflection arising from the depolarization of the left ventricle. However the right ventricular depolarization is delayed and so the complex is typically completed with a slurred positive deflection. This typical positive, negative, positive pattern (RSr′) in V1 occurs with a complementary negative, positive, negative (QRS) in V6 (Fig. 7.14B). This pattern is called right bundle branch block. It is important to note that the QRS complex is wider than normal, being especially broad in the latter part of the deflection. Partial right bundle branch block is a normal childhood variant in which the RSr′ pattern occurs without broadening of the QRS width. A typical ECG recording from V1 is shown in Figure 7.15.
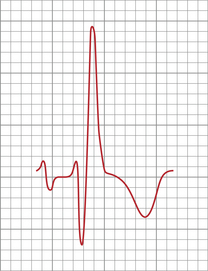
Fig. 7.15 Right bundle branch block pattern in V1.
Damage to the anterior or posterior fascicles of the left bundle branches also gives typical ECG patterns. These are commonly seen after infarction of the respective portions of the left ventricle. Theoretically the left bundle branch is a more diffuse system consisting of multiple fibres. These have been simplified to anterior and posterior fascicles. If the left bundle is interrupted early in its course then several predictable results occur. The first is that the normal postero-anterior depolarization of the septum is reversed; followed by depolarization of the right ventricle giving a QR pattern in the anterior chest leads with a mirror image in the lateral leads (Fig. 7.14C). The late depolarization of the left ventricle gives a large terminal negative deflection in the anterior leads. This results in a broad QRS pattern in V1 with an RSr′ in V6.
Cardiac structure and the ECG
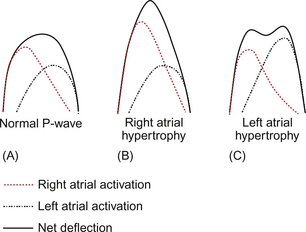
Why is there this difference in the form of the P wave with hypertrophy of the different atria? This comes back to a complete understanding of the interaction between time and space which produces the ECG. Right atrial depolarization precedes left atrial depolarization because the sinus node lies in the right atrium. The right atrium is nearer the front of the chest and so, particularly in the anterior chest leads, produces a dominant deflection. Since the periods of depolarization overlap the P wave takes on a single hump, though in fact there are two separate events within it. If one or other waveform is changed the overall waveform is altered; if the right atrium is hypertrophied then the whole waveform becomes more peaked; if the left atrium is hypertrophied then the left atrial component of the P wave becomes more apparent and generates a second peak in the P wave, slightly later than that of the right atrial waveform. This is illustrated in Figure 7.16. This variation in P wave morphology emphasizes the complex interaction between cardiac morphology and function and the simplified tracing produced in the standard ECG.
As has been alluded to previously this summation of signals from different parts of the heart is important because it affects the way the ECG waveform appears and also how it changes in pathological conditions. For example, in the adult the QRS complex is dominated by the signals from the left ventricle which is much greater in mass than the right ventricle. In newborn babies this is not the case, with the right ventricle having similar mass to the left ventricle. Thus the complexes in the anterior chest leads (V1, V2) are very different in newborns and adults; in newborns they are dominantly positive whilst in adults they are dominantly negative (see Chapter 12). The right ventricle may be virtually ignored in interpreting the normal adult ECG.
Ischaemia and the ECG
Reversible ischaemia
Returning to the concept of the battery (see p. 72) the degree of deflection of the ECG signal is a function of the potential difference between the ends of the battery and the orientation of the battery with respect to the electrodes. Generally the maximum potential difference occurs when one end of the battery is fully depolarized (+30 mV) and the other is fully polarized (−85 mV) giving a total voltage of around 115 mV. If both ends of the battery are depolarized or both ends are polarized then there will be no potential difference and no net deflection. This is the condition which gives the isoelectric line on the ECG, i.e. zero displacement of the trace. Between the T and the Q wave the ventricular muscle cells are polarized. During the ST segment the ventricle is depolarized. The heart is in different states of polarization but the appearance of the ECG, a flat line, is the same.
During ischaemia, maintenance of the myocardium in its fully polarized state is compromised as it requires substantial ATP generation to maintain ionic gradients (see Chapter 1). Thus for portions of the myocardium the resting potential is not as negative as normal. This means that in the fully polarized state there can be a current between different parts of the myocardium. However, because the depolarized state is less energy demanding, as entry of Na+ and Ca++ ions are passive processes down concentration gradients, it is still possible for all myocardial cells to depolarize fully. The T–Q isoelectric line is displaced upwards by the residual flow of current between fully and partially polarized myocardium but during ventricular depolarization this is abolished. The ST segment alone therefore appears to be displaced.
Infarction
Q waves may be understood in the context of complete loss of electrically active tissue. Since, for practical purposes, the right ventricle may be ignored in the adult because the muscle mass is swamped by that of the left ventricle the ECG can be viewed as examining the left ventricle from the outside. The conducting tissue is located on the endocardial surface of the left ventricle and thus depolarization takes place from inside to outside (Fig. 7.17). Where a portion of the ventricle is damaged and becomes fibrosed, i.e. electrically inert then it becomes electrically ‘transparent’ forming an electrical ‘window’. Thus rather than producing a positive deflection as the near wall of the ventricle depolarizes from inside to outside, a negative deflection is produced as the lead records the activity in the opposite wall of the ventricle.
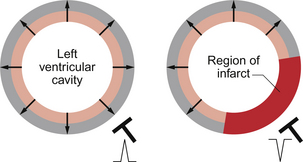
Fig. 7.17 Origin of Q waves on the ECG.
Potassium and the ECG
Considering that potassium fluxes are so key to the membrane potential of myocardial cells (see Chapter 2), it is not surprising that the ECG may be altered by changes in plasma [K+].
With hypokalaemia the dominant effect is flattening of the T wave and may include ST segment depression and the development of prominent U waves. ECG changes associated with hypokalaemia are not clinically significant nor do they have any particular prognostic significance. An ECG may be considered a useful adjunct but is no substitute for monitoring of plasma [K+]. Hypokalaemia promotes the pro-arrhythmic effect of digoxin which acts to block the pumped inflow of K+ in exchange for Na+ (see Chapters 2 and 4).
Drugs and the ECG
All anti-arrhythmic drugs tend to promote arrhythmias as well as suppress them and should only be used where a net benefit to the patient can be identified. Some drugs such as flecainide and amiodarone may prolong the Q–T interval. Digoxin may prolong the P–R interval and causes bradycardia. Though frequently used to control ventricular rate in atrial fibrillation, digoxin tends to promote atrial automaticity and may enhance or induce atrial fibrillation (see Chapter 2).
Conover, M. B. Understanding Electrocardiography, eighth ed. St Louis: Mosby; 2003.
Hampton, J. R. The ECG Made Easy, seventh ed. Edinburgh: Churchill Livingstone; 2008.
Houghton, A. R., Gray, D. Making Sense of the ECG, third ed. London: Arnold; 2008.
Lilly, L. S. Pathophysiology of Heart Disease, third ed. Baltimore: Williams and Wilkins; 2006.
Thaler, M. S. The only EKG Book you’ll Ever Need, fifth ed. Philadelphia: Lippincott/Williams & Wilkins; 2006.