[level-membership-for-pulmolory-and-respiratory-category]Chapter 19
The Electrocardiogram and Cardiac Arrhythmias in Adults
After reading this chapter you will be able to:
• Explain how the components of the electrocardiogram (ECG) relate to the electrical and mechanical activity of the heart
• Explain how heart muscle mass affects ECG amplitude
• Identify factors that determine the QRS complex polarity (positivity or negativity)
• Describe how each of the 12 ECG leads is configured with respect to the heart and the hexaxial reference system
• Explain how the QRS complex recorded in different ECG leads is used to determine the mean direction of current flow (electrical axis) in the heart
• Explain why cardiac electrical axis abnormalities are correlated with certain physiological abnormalities
• Calculate the heart rate from an ECG recording
• Identify ECG characteristics of common cardiac arrhythmias
• Describe the physiological basis for common cardiac arrhythmias
• Discuss the treatment focus for various cardiac arrhythmias
circus movement (circus reentry)
Mobitz type I (Wenckebach) block
paroxysmal supraventricular tachycardia (PSVT)
premature atrial contractions (PACs)
premature junctional contraction (PJC)
premature ventricular contraction (PVC)
Normal Electrocardiogram
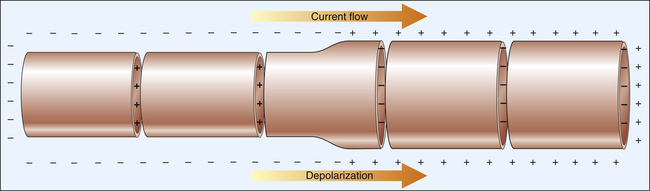
The action potentials conducted through myocardial fibers during depolarization produce small electrical currents that can be detected at the body’s surface with the aid of proper equipment. As the heart depolarizes, the current flows from depolarized to polarized regions.1 Because a depolarized membrane is negatively charged on the outside with respect to the inside, the depolarization impulse sweeps over the surface of myocardial fibers as a wave of electronegativity. Figure 19-1 illustrates the depolarization wave and current flow of a depolarizing, contracting fiber. (The current flows from negatively to positively charged regions.)
Electrodes placed on the skin and attached to a specialized voltmeter, known as an electrocardiograph, can detect small voltage changes as the heart depolarizes and repolarizes. This device reflects the summation of all action potentials conducted through millions of myocardial fibers during the cardiac cycle. This summated recording is called the electrocardiogram (ECG), which is simply a graphic recording of voltage plotted against time during myocardial depolarization and repolarization (Figure 19-2). The ECG may be traced on specialized graph paper or displayed on an LCD monitoring screen.
Electrocardiogram Components
Waves and Complexes
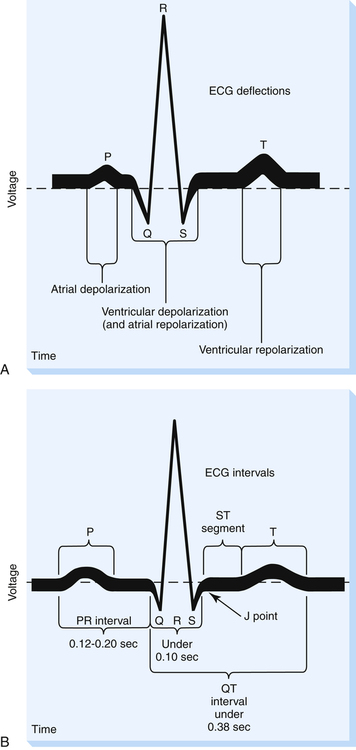
The ECG consists of waves and complexes plotted as voltage on the vertical axis and time on the horizontal axis (see Figure 19-2). The spaces between waves and complexes are called intervals and segments. The P wave (see Figure 19-2, A) is produced as a result of atrial depolarization. The mechanical event of atrial contraction normally follows a fraction of a second after the P wave appears.
Intervals and Segments
Figure 19-2, B, illustrates various ECG time intervals and segments. The PR interval is the time required for the sinus node impulse to reach the ventricles. It is measured from the beginning of the P wave to the next deflection, whether it is a Q or an R wave. The average adult PR interval is between 0.12 second and 0.20 second; a PR interval greater than 0.20 second indicates abnormally slowed impulse conduction from atria to ventricles. The PR interval is normally shorter in fast heart rates than in slow heart rates.
The adult QRS complex lasts on average about 0.08 to 0.10 second. QRS width represents ventricular depolarization time and is measured from the point at which the tracing leaves the baseline to the point at which it returns to baseline (see Figure 19-2, B). This point of return is called the J point.
The ST segment extends from the J point to the beginning of the T wave and represents the early phase of ventricular repolarization. At its end, the normal ST segment curves slightly upward into the beginning of the T wave. The ST segment length varies according to the heart rate; fast heart rates have shorter ST segments than slow heart rates. The ST segment is normally flat, lying on the ECG baseline. However, this segment may be elevated 2 mm above the baseline or depressed 0.5 mm below the baseline and still be considered normal.2 An ST segment that becomes depressed more than 0.5 mm during a stress exercise test signals myocardial ischemia. The drug digitalis produces the same effect. An elevated ST segment generally indicates myocardial tissue injury.3
The QT interval is measured from the beginning of the QRS complex to the end of the T wave. The QT interval varies according to the heart rate but is usually less than 0.40 second.1 It represents the general refractory period of the ventricles. During this time, the ventricles generally cannot accept another depolarizing stimulus. However, as repolarization progresses, some of the ventricular muscle fibers are repolarized, while other fibers are still depolarized. This represents a vulnerable period during which part of the heart can respond to an additional stimulus and part of it cannot. The most vulnerable period is located at about the peak of the T wave and is sometimes called the relative refractory period of the heart. A depolarizing stimulus during this vulnerable time can create electrical chaos in the heart, rendering it quivering (fibrillating) and unable to pump blood. A prolonged QT interval is associated with life-threatening fibrillation because it is associated with a longer vulnerable period.2
Positive and Negative Electrocardiogram Deflections
Lead Axis and Current Flow
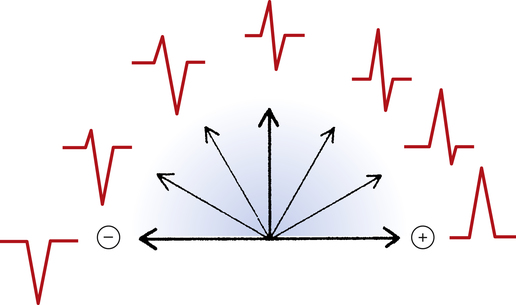
An imaginary straight line between the positive and negative electrodes of a bipolar lead is defined as the lead axis. Similarly, an imaginary line between a unipolar lead’s positive electrode and the center of the heart is the unipolar lead’s axis. In Figure 19-3, a myocardial depolarization current flowing at right angles to a lead’s axis generates an equiphasic or isoelectric deflection on the ECG monitored by the unipolar lead. Current flowing parallel to a lead’s axis generates a strongly negative or positive ECG deflection, depending on whether the current flows toward or away from the positive electrode; this is illustrated by the bipolar lead in Figure 19-3. Figure 19-4 illustrates the range of ECG deflection possibilities, depending on the direction of current flow relative to the lead’s axis.
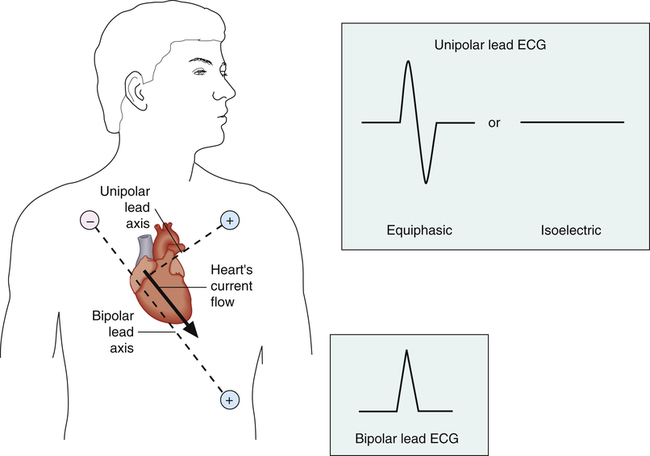
The heart’s electrical axis refers to the average direction of current flow in the heart. The heavy arrow in the heart in Figure 19-3 is the heart’s electrical axis. The length of this arrow is proportional to the current’s intensity and is called a vector because it has direction and magnitude. For this reason, the average direction of current flow in the heart is commonly called the mean cardiac vector (MCV)
Electrocardiogram Graph Paper
ECG graph paper is a grid, permitting time measurement along the horizontal lines and voltage measurement along the vertical lines (Figure 19-5). Dark and light intersecting lines form large and small squares. The light vertical lines that help form the small squares are 1 mm apart and represent 0.04 second at a standard sweep speed of 25 mm per second. The heavy vertical lines are 5 mm apart and represent 0.20 second at standard recording speed. (The large squares have five small squares on each side [see Figure 19-5]).
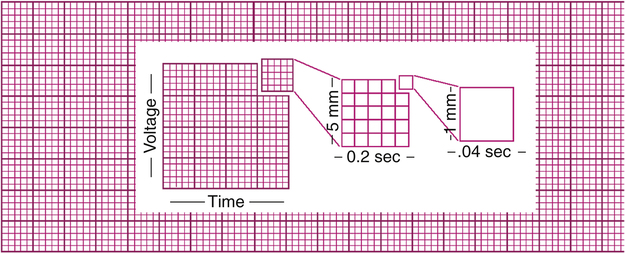
Vertically, each small square represents 0.1 mV, which means each large square represents 0.5 mV (see Figure 19-5). By convention, ECG machines are adjusted, or standardized, so that a 1-mV electrical signal produces a 10-mm (two large squares) deflection. The amplitude of the ECG is discussed in terms of millivolts.
Electrocardiogram Leads
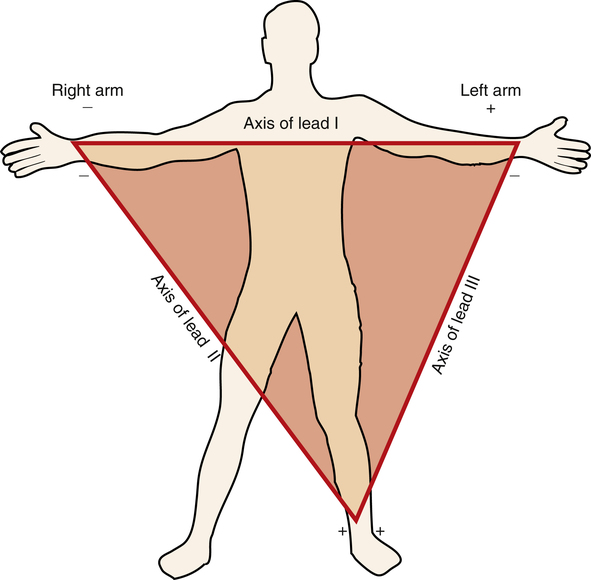
Standard Bipolar Limb Leads: Einthoven’s Triangle
At the turn of the twentieth century, Einthoven invented the ECG machine and introduced the three bipolar limb leads.3 Figure 19-6 illustrates these three standard limb leads. In lead I, the negative electrode is placed on the right arm, and the positive electrode is placed on the left arm. The axis of lead I is a horizontal line running from shoulder to shoulder. In lead II, the negative electrode is on the right arm, and the positive electrode is on the left leg; the axis of lead II runs from the right arm to the left leg (see Figure 19-6). Lead III has a negative electrode on the left arm and a positive electrode on the left leg. The lead III axis runs from the left arm to the left leg.
Standard Unipolar Limb Leads
Clinical Focus 19-1 Methods for Assessing Heart Rate on the Electrocardiogram
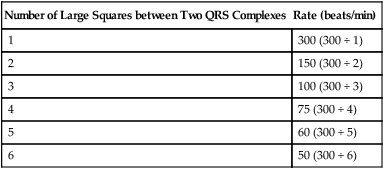
Look at Figure 19-5. Notice that five large squares equal 1 second (0.2 sec × 5 = 1.0 sec). Because 1 minute contains 60 seconds, 1 minute is represented by 300 large squares (5 squares/sec × 60 sec = 300 squares). If the heart rate is 300 beats per minute, the interval between two QRS complexes is one large square (i.e., a heartbeat [QRS complex] occurs every 0.2 second). When the heart rate is 150 beats per minute, the interval between two QRS complexes is two large squares. For determining the heart rate, the number 300 is divided by the number of large squares between two QRS complexes. This is summarized as follows:
| Number of Large Squares between Two QRS Complexes | Rate (beats/min) |
| 1 | 300 (300 ÷ 1) |
| 2 | 150 (300 ÷ 2) |
| 3 | 100 (300 ÷ 3) |
| 4 | 75 (300 ÷ 4) |
| 5 | 60 (300 ÷ 5) |
| 6 | 50 (300 ÷ 6) |
In Figure 19-5, markers identify 3-second intervals on the ECG paper. First, a 6-second interval is identified by using these markers (two 3-second intervals). Next, within this 6-second strip, the number of QRS complexes is counted. Because 1 minute contains 10 6-second intervals, the number of QRS complexes that were counted is multiplied by 10. For example, if eight QRS complexes are counted in a 6-second strip, the heart rate is 8 × 10 or 80 beats per minute. This method is best for averaging the heart rate when the rhythm is irregular (i.e., when the interval between QRS complexes varies).
electrode attachment points as the standard bipolar limb leads—that is, right arm, left arm, and left leg. The QRS complex recorded by a unipolar lead has a greater amplitude than the QRS complex recorded by bipolar leads; for this reason, unipolar leads are known as augmented limb leads. (Figure 19-7 illustrates the three unipolar augmented limb leads and their axes.)
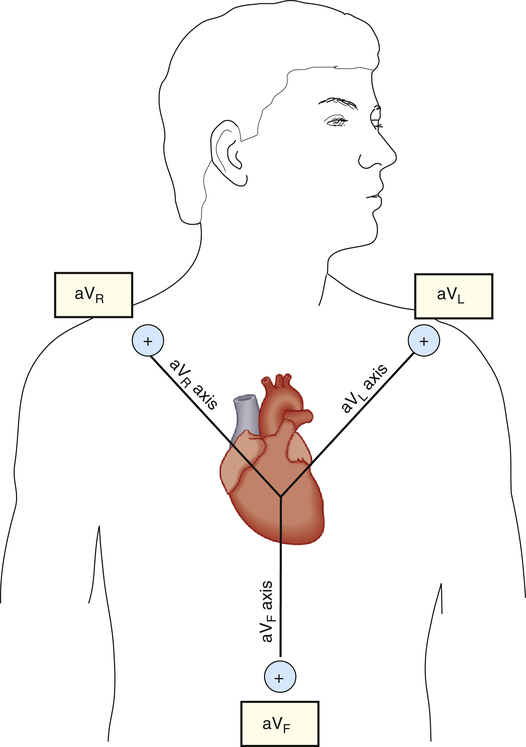
The symbols for the three unipolar leads are aVR, aVL, and aVF. The a stands for “augmented,” the V stands for “voltage,” and the subscript letters R, L, and F indicate the positive electrode’s attachment points (right arm, left arm, or left foot). The axis of a unipolar lead is a line drawn from the positive electrode to the heart’s atrioventricular (AV) node (see Figure 19-7).
The three standard bipolar limb leads and three unipolar leads combined provide six different views of the heart’s electrical activity. In practice, it is unnecessary to place these lead terminals on the limbs; instead, they are generally placed directly on the anterior chest in patients who are continuously monitored (as shown for the augmented leads in Figure 19-7).
Precordial (Chest) Leads
The six ECG leads discussed up to this point are categorized as frontal plane leads because their axes lie in the frontal or vertical plane of the chest. From these leads, information can be obtained about current flowing right, left, up, or down but not about current flowing from the front of the chest toward the back, or vice versa. The axes of the precordial leads are located on a horizontal plane through the chest (Figure 19-8). They consist of six positive unipolar electrodes placed on the surface of the chest, as shown in Figure 19-9. These leads are designated V1, V2, V3, V4, V5, and V6. The 12-lead ECG comprises three bipolar limb leads, three unipolar limb leads, and six precordial leads. The standard 12-lead ECG allows the heart’s QRS vector to be viewed from 12 different electrical vantage points.
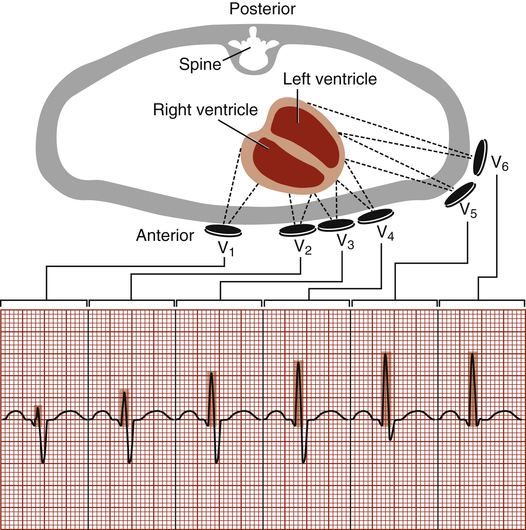
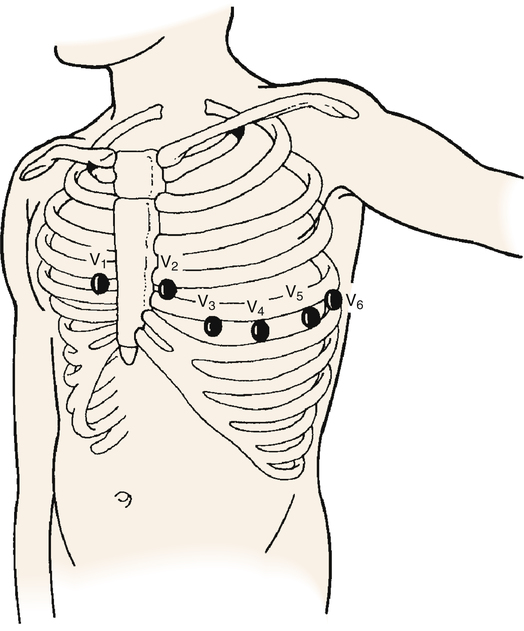
The axes of the precordial leads are lines drawn from the positive electrode to the heart’s AV node, as shown in Figure 19-8. Leads V1 and V2 are placed on either side of the sternum at the fourth intercostal space (see Figure 19-9). V4 is at the midclavicular line and fifth intercostal space. V3 is equidistant from V1 and V4. V5 and V6 are at the anterior and midaxillary lines, horizontal with V4.
Because they lie directly over the heart on the chest’s surface, the precordial leads are valuable in localizing abnormal depolarization of the myocardium. The ventricles depolarize in a leftward, downward, and posterior direction.2 Therefore, the precordial leads record a strongly negative QRS complex in V1, progressing to a strongly positive QRS in V6.
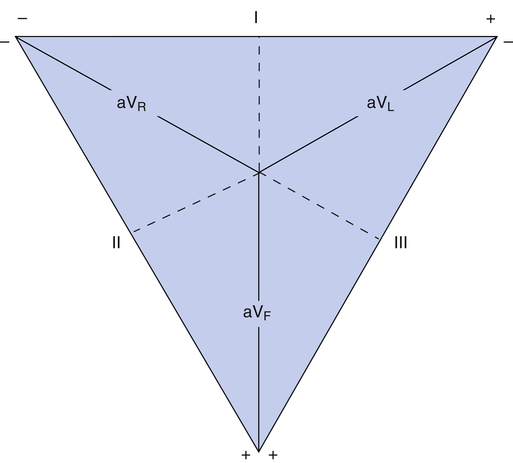
Hexaxial Reference Figure
If the axes of the six frontal plane leads are superimposed on one another such that all six lead axes have the same midpoint, the hexaxial reference figure is formed (Figure 19-10); the three unipolar limb lead axes are plotted inside the triangle formed by the axes of leads I through III. In Figure 19-10, the axis of each unipolar lead is extended through the heart (dotted lines) and is perpendicular to the opposite side’s bipolar lead axis. For example, the aVR axis is perpendicular to the lead III axis. Imagine pushing each side of the triangle in Figure 19-10 to the center (keeping the angles of the sides constant) so that all six axes of unipolar and bipolar leads intersect each other at a single point in the heart’s center. This forms the hexaxial reference figure (Figure 19-11), which allows the direction of the MCV to be determined precisely.
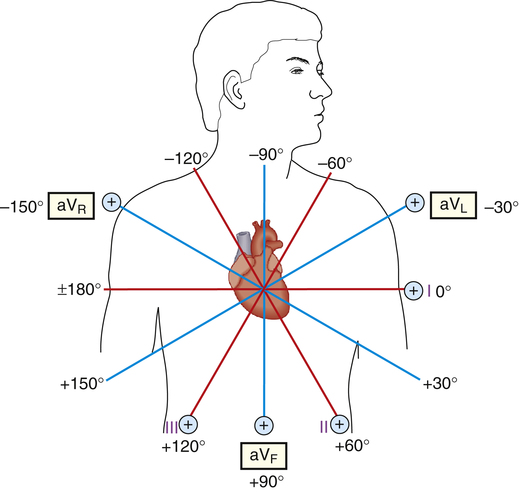
The six axes of the hexaxial figure form 12 “spokes,” spaced 30 degrees apart (see Figure 19-11). By standard convention, the zero-degree point is placed at the 3-o’clock position. Negative values are assigned to degrees moving counterclockwise from 0 degrees; positive values are assigned to degrees moving clockwise from 0 degrees. Figure 19-3 shows that the normal MCV points toward +60 degrees. This direction is parallel to the standard limb lead II axis and points toward the lead II positive electrode. Lead II is thus expected to record a strongly positive QRS complex (see Figure 19-3).
Locating the Heart’s Electrical Axis
Determinants of the Electrical Axis
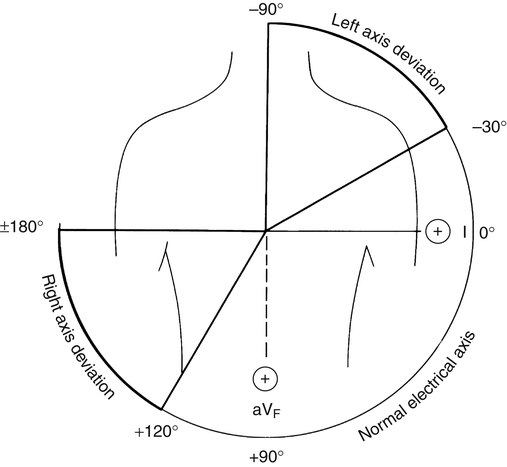
The normal QRS vector points slightly to the left side of the chest toward +60 degrees. The larger left ventricular muscle mass generates most of the heart’s electrical activity, explaining why the QRS vector points to the left. Relative ventricular muscle mass is a major determinant of the MCV direction. For example, if high pulmonary vascular resistance overworks the right ventricle, it may gain mass (hypertrophy) and generate more electrical current. Consequently, the QRS vector would shift more to the right, which is known as a right axis deviation. The normal electrical axis of the heart is usually between 0 degrees and +90 degrees, although a range of −30 degrees to +120 degrees may still be considered normal (Figure 19-12).2
Factors other than hypertrophy influence the QRS vector. These factors are summarized in Box 19-1. Extreme obesity pushes the diaphragm up, displacing the heart to a more horizontal position and causing a left axis deviation.
If a major bundle branch is blocked, the cardiac impulse depolarizes the unblocked ventricle first before it depolarizes the blocked ventricle. The depolarized ventricle is momentarily electronegative, while the blocked ventricle is still electropositive. This polarity difference causes a strong electrical current to flow from the depolarized ventricle to the polarized ventricle, creating a marked axis deviation toward the blocked side.4
Myocardial infarction produces a dead (necrotic) area in the heart that cannot conduct electrical impulses. Because this area generates no electrical current, the QRS vector deviates from the infarcted area toward normal, current-generating tissue.3
Easy Method for Determining the Electrical Axis
A positive QRS complex is recorded from leads in which the heart’s depolarizing current flows toward the positive electrode. Lead II generates a positive QRS recording because the MCV normally points directly at the lead II positive electrode. If lead II records a totally negative QRS, this means (1) the lead’s electrode placement is reversed or (2) the heart’s current actually flows in the opposite direction from normal (i.e., toward −120 degrees [see Figure 19-11]).
Use of Leads I and aVF to Determine the Cardiac Axis
Figure 19-13 shows that standard limb lead I separates the chest into positive and negative halves (dashed vertical line). That is, any cardiac vector pointing to the right of the chest produces a negative QRS in lead I. Any cardiac vector pointing to the left of the chest produces a positive QRS in lead I. The QRS recorded from lead I merely reveals whether the cardiac vector points toward the right or left half of the patient’s chest. If the QRS is more positive than negative, the vector points to the left half; if it is more negative than positive, the vector points to the right half.
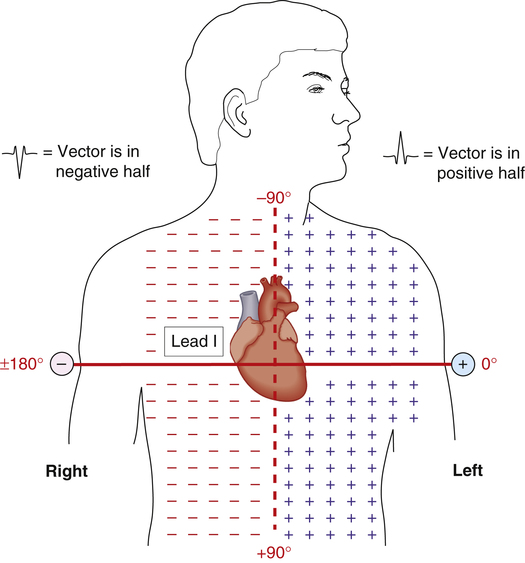
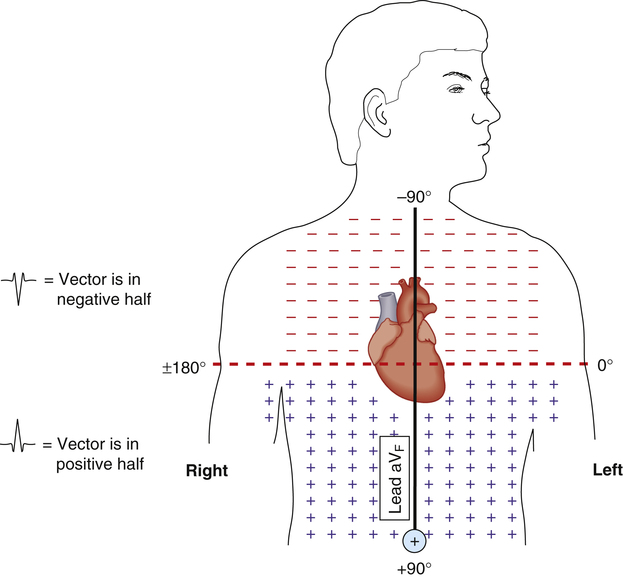
Figure 19-14 shows that the QRS from lead aVF similarly separates the chest into upper negative and lower positive halves (dashed line). Lead aVF records a positive QRS if the MCV points below the dashed line. Likewise, lead aVF records a negative QRS for vectors pointing above the dashed line. The use of aVF alone or lead I alone does not allow the cardiac vector to be pinpointed with any degree of precision.
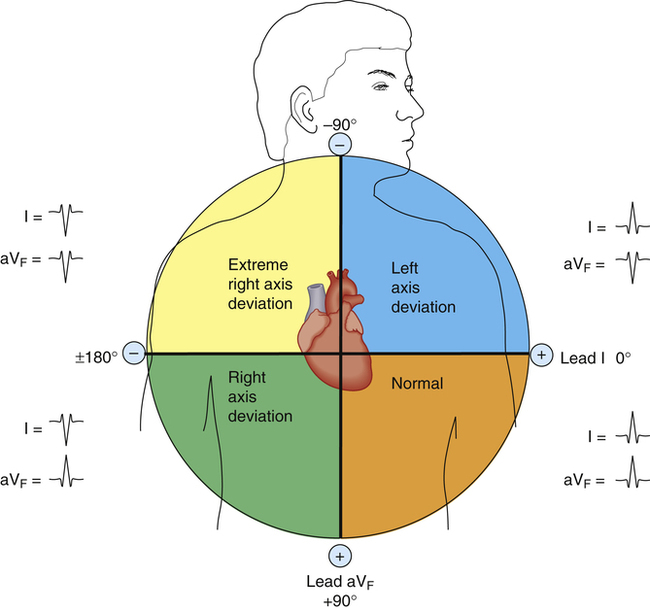
The comparison of QRS configurations from both leads I and aVF allows the cardiac vector to be located within a 90-degree quadrant (Figure 19-15). A positive QRS complex recorded by both leads means the cardiac vector is located in the left lower quadrant, or the normal range (−0 degrees to +90 degrees). Conversely, a positive QRS in lead I and a negative QRS in aVF means the cardiac vector points to the left upper quadrant (0 degrees to −90 degrees), which indicates a left axis deviation. A negative QRS in lead I and positive QRS in aVF means the vector lies in the right lower quadrant (+90 degrees to +180 degrees), or a right axis deviation (see Figure 19-15).
Identification of Common Cardiac Arrhythmias
Systematic Electrocardiogram Analysis
Health professionals approach ECG interpretation in many different ways. No one method is correct; the important factor is to use a consistent, systematic approach.5 Box 19-2 outlines one approach.
Step Two
is assessed. Rhythm regularity is determined by comparing the R-R intervals with each other, using an ECG caliper or a blank sheet of paper and pencil. If the variation between the shortest and longest R-R interval is less than 0.16 second, the ECG rhythm is regular; a greater variation is called irregular.1 Irregular rhythms may be slightly or grossly irregular.
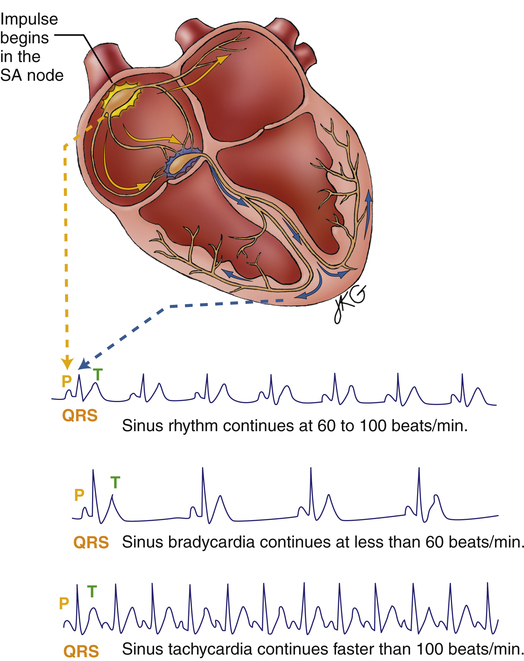
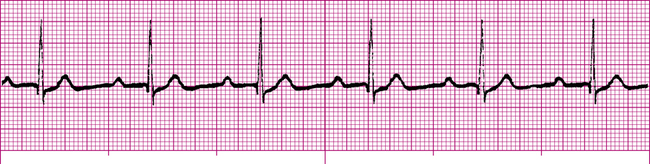
Normal Sinus Rhythm
Normal sinus rhythm (NSR) (Figure 19-16) occurs when the sinus node initiates each depolarizing impulse at a rate of 60 to 100 per minute, and each impulse is conducted normally through the atria and ventricles. The result is coordinated atrial and ventricular contractions. In Figure 19-16, P waves, QRS complexes, and T waves are clearly defined and normal. The P wave-to-QRS complex ratio is 1:1. Also, the spacing between QRS complexes is relatively constant, indicating a regular rhythm. The PR interval, measured from the beginning of the P wave to the beginning of the first QRS deflection, is about four small squares, or 0.16 second. This interval is in the normal range, indicating a normal impulse-conduction time between the SA node and the ventricles. In a 6-second time frame (30 large squares), there are seven QRS complexes; the heart rate is 70 beats per minute.
Abnormal Sinus Rhythms
Tachycardia
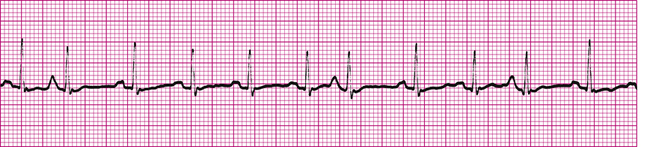
Sinus tachycardia is defined in adults as a heart rate greater than 100 beats per minute.4 The SA node is the pacemaker, and its impulses travel in a normal manner to the ventricles (see Figure 19-16); therefore, P, QRS, and T waves appear normal, as in NSR. The PR intervals shorten in severe tachycardia, as does the space between the T wave and the next P wave. The rhythm is usually regular.
Sinus tachycardia is the normal response of a healthy heart to an increased demand for blood flow in exercise. It also may be caused by fever (increase of 10 beats per minute per degree Fahrenheit increase)4; anxiety; pain; and stimulants such as coffee, tea, alcohol, and nicotine. Anything that increases sympathetic stimulation causes tachycardia. Beta-adrenergic drugs such as epinephrine cause tachycardia because they mimic sympathetic stimulation. Sympathetic stimulation, tachycardia, and increased cardiac output are normal compensatory responses to abnormal conditions such as anemia, hypoxia, and hypovolemia.
A rapid heart rate increases the heart’s workload and oxygen requirements. In individuals with partially blocked coronary arteries, tachycardia may increase the heart’s oxygen requirements above the level that can be supplied by blood flow. This may cause myocardial ischemia and can precipitate myocardial infarction.1 Treatment of sinus tachycardia, if necessary, is always directed at the underlying cause. Strong vagal stimulation such as carotid sinus massage may slow the heart rate momentarily. Beta-blocking drugs such as propranolol block sympathetic cardiac beta receptors and are sometimes used to slow the heart rate.
Bradycardia
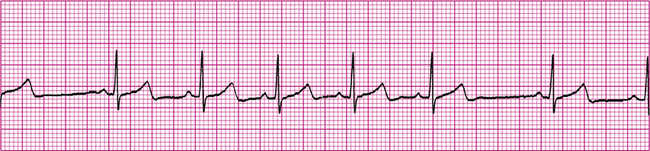
Sinus bradycardia is defined in adults as a heart rate less than 60 beats per minute.4 The SA node is the pacemaker. SA node impulses follow normal conduction pathways to the ventricles. Consequently, ECG waves and complexes appear normal, as in NSR (see Figure 19-16). Normal PR intervals and QRS widths indicate a normal impulse-conduction time; the SA node simply fires at rates that are slower than normal. The rhythm is usually regular.
Carotid sinus syndrome is a condition in which the pressure receptors in the fork of the common carotid artery are oversensitive. These receptors contain many vagal nerve endings. Even slight pressure on the neck near the carotid artery may severely slow or momentarily stop the heartbeat and induce syncope (fainting).4 Vomiting, straining against a closed glottis (Valsalva maneuver), or suctioning the pharynx and trachea with a catheter causes increased vagal stimulation (vagovagal reflex), slowing the sinus node discharge rate.
In patients with acute myocardial infarction, mild bradycardia may be beneficial because it decreases the heart’s workload and oxygen requirements. However, severe bradycardia in myocardial infarction may allow enough time for an irritable ectopic focus to take over the pacemaker function. This situation can produce serious, life-threatening arrhythmias.1
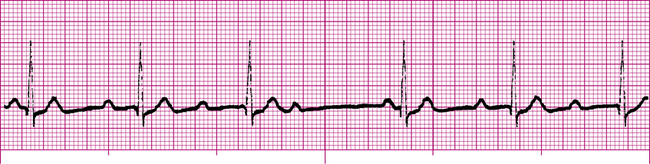
Sinus Arrhythmia
Sinus arrhythmia (Figure 19-17) is defined as irregularly generated sinus node impulses, all of which are normally conducted throughout the heart. Sinus node impulses alternate between faster and slower rates, commonly increasing during inspiration and decreasing during expiration. The pacemaker and conduction times are normal, and all ECG components appear normal. The only abnormality is the irregular spacing between QRS complexes (see Figure 19-19). Sinus arrhythmias are usually of no clinical significance and do not require treatment.1
Premature Atrial Contraction
Premature atrial contractions (PACs) (Figure 19-18) occur when an ectopic focus fires. An ectopic focus fires before the SA node would normally fire, causing an early atrial contraction (identified as P′ on the ECG [see Figure 19-18]). Ventricular QRS complexes are normal because all impulses are conducted normally into the ventricles. However, QRS complexes are irregularly spaced because of the PAC. PACs may originate from a single ectopic focus or from multiple ectopic foci in the atria.
If the ectopic focus discharges too early, the AV node may still be refractory from the preceding beat. Subsequently, the AV node fails to conduct the ectopic impulse to the ventricles. In such a situation, a QRS complex does not follow the P′ wave, and the PAC is called a nonconducted (blocked) PAC.3
Emotional stress, alcohol, caffeine, tobacco, electrolyte imbalances, and sympathetic stimulation may cause PACs in normal hearts. Various drugs may also produce irritable foci in the atria, causing PACs. In ischemic heart disease, insufficient coronary blood flow may increase the irritability of atrial muscle and produce PACs. Occasional isolated PACs are not clinically significant. Frequent PACs in patients with heart disease are a warning sign of increasing atrial muscle irritability and potentially serious atrial arrhythmias.1 Drugs that suppress atrial excitability, such as sodium channel inhibitors (e.g., quinidine) or calcium channel blockers (e.g., verapamil), may be used to manage PACs.
Supraventricular Arrhythmias
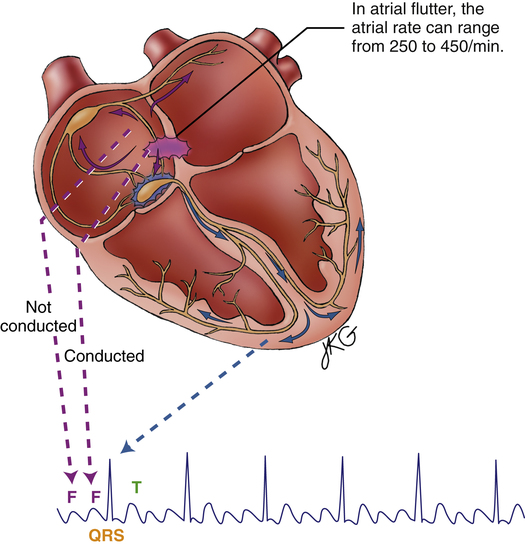
Atrial Flutter
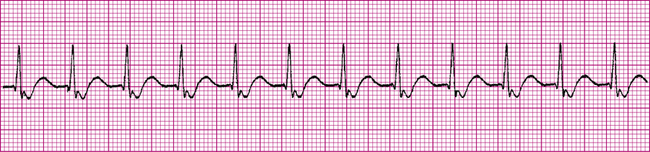
Atrial flutter (Figure 19-19) is a type of supraventricular tachycardia caused by a single ectopic pacemaker located above the AV node firing at a rate of 200 to 350 beats per minute.4 Because the ectopic focus is located above the ventricles, the arrhythmia is called supraventricular. Commonly, the ventricular contraction rate is about half the atrial rate (about 150 beats per minute) because the normal refractory nature of the AV node prevents many of the atrial impulses from entering the ventricles. Otherwise, the ventricles would not have adequate filling time, and cardiac output would decrease significantly.
Typically, the ventricular rhythm is regular (see Figure 19-19) if the refractory nature of the AV node remains constant. Ventricular QRS complexes often appear at regular intervals because of the constant AV conduction ratio (see Figure 19-19). The P waves in atrial flutter are replaced by atrial flutter waves, often described as saw-toothed in appearance. Flutter waves may precede, be buried in, or follow the QRS complexes. They are superimposed on T waves and ST segments.
Atrial flutter is most commonly seen in older people with advanced rheumatic heart disease, especially if the disease affects mitral and tricuspid valves.1 The automaticity of atrial muscle tends to increase in these conditions. Symptoms of atrial flutter include sensations of palpitations in the chest (caused by the rapid ventricular rate), nervousness, and anxiety. If the ventricular rate is extremely high, cardiac output may decrease as a result of inadequate ventricular filling time. This may cause confusion, dizziness, and possibly fainting. In people who have impaired coronary blood flow, atrial flutter may worsen myocardial ischemia or cause an infarction by increasing ventricular oxygen consumption.
Atrial Fibrillation
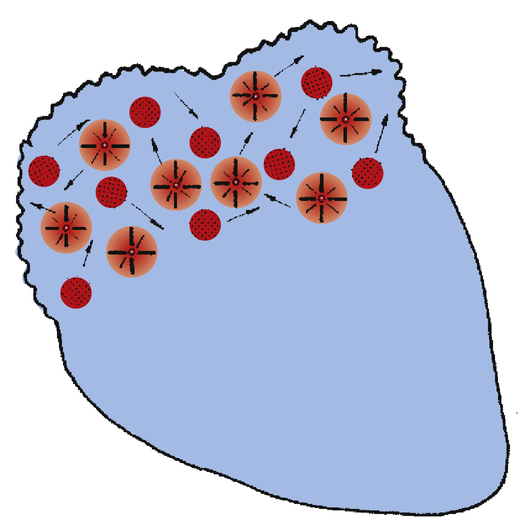
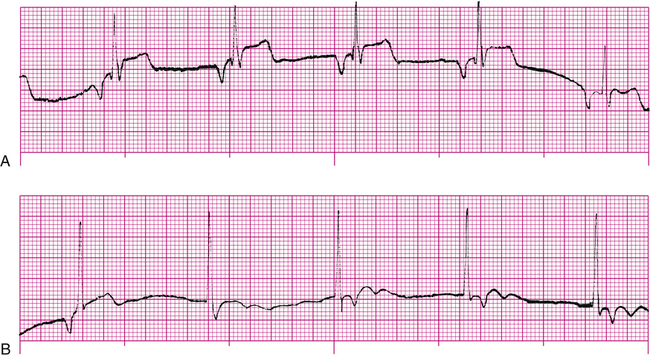
Atrial fibrillation (Figure 19-20) is caused by uncoordinated, chaotic electrical discharge from numerous ectopic foci in the atria (Figure 19-21). These atrial impulses occur about 300 to 600 times per minute, typically averaging about 400 per minute.1 The random discharge of many ectopic foci creates irregular, fine fibrillatory waves; P waves are totally absent (see Figure 19-20). As in atrial flutter, the refractory nature of the AV node prevents many of these atrial impulses from reaching the ventricles; thus, the ventricular rate is much slower. Because AV nodal stimulation is random and erratic, impulse conduction to the ventricles is unpredictable, and the ventricular rhythm is grossly irregular, as illustrated in Figure 19-20. Although QRS complexes are normal, their spacing is highly variable. The hallmark of atrial fibrillation is a totally irregular ventricular rhythm accompanied by fine, irregular undulations of the ECG baseline.
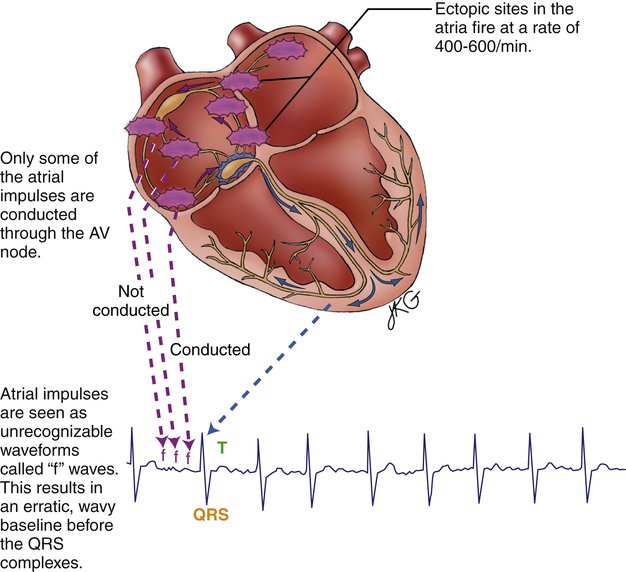
The uncoordinated, chaotic fibrillation of the atria means they have no functional pumping action; instead, they quiver with no distinct contraction or relaxation phases. The “atrial kick” that normally adds to ventricular filling at the end of ventricular diastole is lost. Consequently, the ventricles fill incompletely, causing a reduction of the stroke volume and cardiac output by 20% to 30%.4
The reduction in cardiac output in atrial fibrillation may produce symptoms of confusion, dizziness, hypotension, and fainting. A major concern in atrial fibrillation is the stasis, or pooling, of blood in the atria caused by the lack of coordinated pumping action. This sluggish blood movement predisposes to blood clot (thrombus) formation. The thrombus may break loose from the atrium and travel downstream, in which case it is called a thromboembolism. If it originates from the right atrium, it may plug a vessel in the lungs (pulmonary embolism), or if it originates from the left atrium, it may plug a vessel in the brain, causing a stroke. For this reason, patients with atrial fibrillation are often given anticoagulant drugs.6
Treatment of atrial fibrillation is generally aimed at reducing the rapid ventricular response and restoring normal sinus rhythm. Calcium channel–blocking drugs (diltiazem or verapamil) may be given to control heart rate, and the antiarrhythmic drug amiodarone (which inhibits myocardial Na+ and K+ channels) may be given to reduce atrial irritability and restore normal sinus rhythm.6 Electrical cardioversion also may be used to convert atrial fibrillation to NSR if the patient displays serious symptoms.
Junctional Arrhythmias
The cardiac muscle immediately surrounding the AV node is called the AV junction; the preferred term for rhythms arising from the AV node and junctional area is junctional rhythms. If the sinus node fails to generate impulses, the AV junction may assume the role of the pacemaker. This kind of junctional self-pacing is called a junctional escape rhythm. Because the firing rate of the AV junction is 40 to 60 impulses per minute, a junctional escape rhythm is generally slower than normal sinus rhythm (Figure 19-22).
In a junctional rhythm, the electrical impulse travels to the ventricles through normal pathways; the QRS complex is normal in shape and duration. However, the impulse must travel in a backward, or retrograde, direction to depolarize the atria. Retrograde atrial conduction causes P wave changes characteristic of junctional rhythms: the P wave may be (1) inverted (as shown in Figure 19-22), (2) hidden, or (3) retrograde.
Inverted P waves are of negative polarity, caused by the backward direction of the atrial depolarizing current (see Figure 19-22). If inverted P waves occur immediately before the QRS complex, they originated high in the AV junctional area. Because the distance the impulse travels to depolarize the ventricles is shorter than normal, the PR interval is quite short (usually <0.12 second).1
Junctional tachycardias occur when junctional fibers pace the heart at rates greater than 100 beats per minute. Junctional tachycardia may be paroxysmal (occurring in intermittent spasms) or nonparoxysmal. In nonparoxysmal junctional tachycardia, the heart rate may reach 150 beats per minute.1 The rhythm is usually regular, and the QRS configuration is normal (Figure 19-23). Signs and symptoms of nonparoxysmal junctional tachycardia are the same as signs and symptoms of atrial tachycardias. Nonparoxysmal junctional tachycardia is caused by enhanced AV junction excitability, most commonly resulting from digitalis toxicity.1 Other causes include excessive administration of beta-adrenergic drugs and ischemic damage to the AV junctional fibers.
Paroxysmal junctional tachycardia (PJT) may result in bursts of rapid heart rates approaching 240 beats per minute. A PAC usually initiates the onset. Paroxysms may last for a few minutes or for hours. Parasympathetic stimulation by carotid sinus neck massage usually stops PJT. PJT may occur for no apparent reason in healthy people and can be precipitated by catecholamine drugs, overexertion, alcohol, coffee, tobacco, and electrolyte and acid-base imbalances.1
In patients with no underlying ischemic heart disease, treatment of PSVT involves the following, in sequence: (1) vagal parasympathetic stimulation (e.g., carotid sinus massage), (2) intravenous adenosine administration, and (3) intravenous calcium channel blockers (e.g., verapamil). Parasympathetic stimulation also can be accomplished by breath holding (Valsalva maneuver), coughing, and gag-reflex stimulation. More recently, adenosine has been found to be effective in terminating PSVT. Adenosine inhibits the AV conduction velocity and prolongs the AV nodal refractory period. Verapamil has similar effects but tends to produce more hypotension.6
Ventricular Arrhythmias
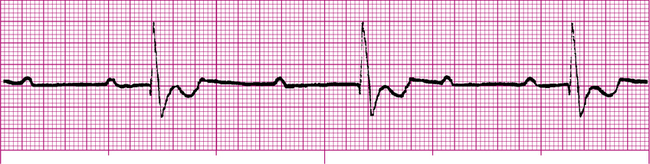
Premature Ventricular Contractions
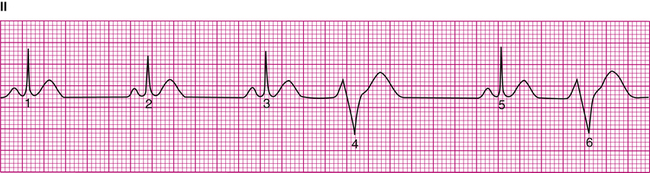
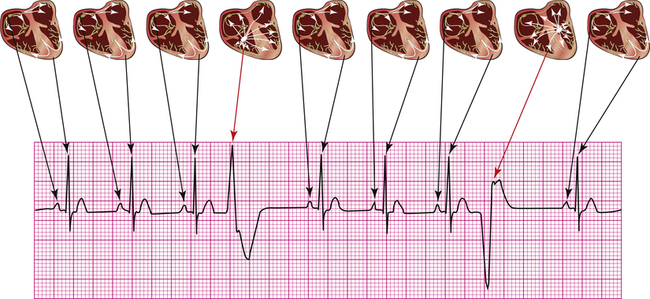
A premature ventricular contraction or complex (PVC) is initiated by an ectopic focus in the ventricles below the branching portion of the bundle of His. An abnormally irritable focus in the ventricle discharges before the next normal SA node impulse arrives. PVCs occur occasionally in healthy people with healthy hearts, especially after alcohol, caffeine, or tobacco use.1 Increased sympathetic stimulation during emotional stress also may cause PVCs. Isolated, occasional PVCs in otherwise healthy people are of no clinical significance. However, frequent PVCs in patients with coronary artery disease signal increased ventricular irritability and the potential appearance of life-threatening arrhythmias, such as ventricular tachycardia (VT) and ventricular fibrillation (VF).
Because an ectopic focus in the ventricles generates a PVC, the QRS complex is not preceded by a P wave (Figure 19-24). Besides appearing before the next expected normal QRS, a PVC also has a wide (>0.12 second), bizarre appearance. The wide QRS shows that depolarization occurred over abnormal conduction pathways, slowing the impulse velocity. The bizarre shape shows that depolarization occurred in an abnormal direction and sequence. However, the bizarre quality of the PVC varies, depending on the location of the ectopic focus. An ectopic focus located high in the ventricles near the bifurcation of the bundle of His may produce a PVC that appears normal. An ectopic impulse arising from a low point in the ventricles depolarizes the ventricles in an abnormal direction, creating a markedly bizarre complex, as shown in Figure 19-24. Figure 19-25 shows two differently shaped PVCs, the first of positive polarity and the second of negative polarity; this indicates the presence of ectopic foci located in different areas of the ventricles. These are called multifocal PVCs, as opposed to unifocal PVCs. Multifocal PVCs indicate increased ventricular irritability and have more serious clinical implications than unifocal PVCs.
PVCs have the following characteristics:
• Their shape differs from normal QRS complexes.
• They generate T waves of opposite polarity from normal.
The compensatory pause occurs because the abnormal ventricular impulse does not enter the atrium to depolarize the SA node (i.e., the SA nodal rhythm is undisturbed). When the SA node fires in its normal sequence, its P wave is obliterated by the PVC, and its impulse arrives at the ventricles while they are still refractory. The ventricles are not stimulated again until the next normal SA nodal impulse arrives. The interval between the two visible P waves on either side of a PVC (see Figure 19-24) is twice the interval between two normally sequenced P waves.
Hypoxia, acidosis, hypokalemia, and myocardial infarction increase myocardial irritability and may cause PVCs. The more irritable the ventricles, the greater the incidence of PVCs. A PVC alternating every other beat with a normal QRS complex is called bigeminy. When three or more PVCs occur in a row, VT is present. Frequent PVCs (more than six per minute) in the presence of acute myocardial infarction are treated by oxygen therapy and coronary vasodilators to relieve tissue hypoxia. In addition, antiarrhythmic drugs such as lidocaine are given to decrease ventricular irritability, although this does not cure the underlying disease process.6
Ventricular Tachycardia
Ventricular tachycardia (VT) (Figure 19-26) is a successive series of PVCs occurring at a rate of 100 to 250 per minute. VT may occur in short bursts or be sustained (>30 seconds).6 VT is most common in patients with myocardial infarction or coronary artery disease. P waves are generally not visible, and all QRS complexes are wide and bizarre in appearance (see Figure 19-26).
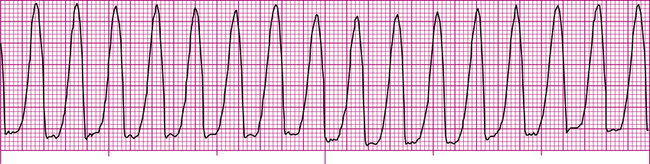
VT is a sign of extremely serious ventricular irritability and instability and is usually considered life-threatening. Rapid ventricular rates reduce ventricular filling time and reduce cardiac output significantly, causing severe hypotension and loss of consciousness. A major danger is the potential for VT to progress into VF. Erratic ectopic impulses may stimulate the ventricles during their vulnerable period of repolarization, creating electrical ventricular chaos. Treatment of VT consists of intravenous lidocaine or amiodarone infusion to reduce ventricular irritability.6 If these antiarrhythmic drugs are unsuccessful, electrical countershock (cardioversion) is generally used.
Torsades de pointes is a special type of VT in which the polarity of the wide QRS complexes rhythmically changes between positive and negative, at heart rates of 200 to 250 beats per minute.6 This French term means “twisting of the points” and aptly describes the QRS twisting around the ECG isoelectric baseline. In contrast to the uniform shape and amplitude of QRS complexes in other forms of VT, in torsades de pointes, the QRS complexes wax and wane as they twist around the ECG baseline.
Torsades de pointes occur in conditions that delay ventricular repolarization, as manifested by a prolonged QT interval. It may be caused by electrolyte imbalances such as hypocalcemia and hypomagnesemia and by prolonged use of drugs that delay repolarization, such as lidocaine, quinidine, and procainamide.6 Therefore, torsades de pointes requires different treatment than other VTs—antiarrhythmic drugs worsen the problem. Treatment options include overdriving the ventricular rhythm by electrical pacing or by isoproterenol (a sympathomimetic drug) infusion and intravenous magnesium sulfate infusion.6 Direct electrical countershock is used if other methods are ineffective. Torsades de pointes may revert spontaneously to NSR but may also degenerate to VF. The underlying cause (e.g., electrolyte imbalances, drug overdose) must be removed to treat this arrhythmia successfully.
Ventricular Fibrillation
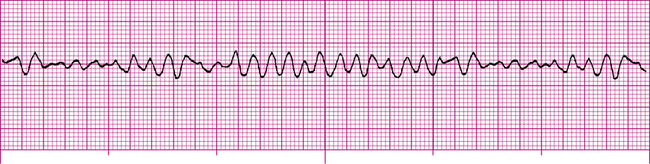
Ventricular fibrillation (VF) is the most lethal of all cardiac arrhythmias and is equivalent to full cardiac arrest. As in atrial fibrillation, many ectopic foci throughout the ventricles fire in a completely unorganized, unsynchronized manner. The ventricles are reduced to a nonfunctional, quivering muscle mass with no pumping ability. Cardiac output decreases to zero, and death occurs in minutes. The ECG (Figure 19-27) reveals no recognizable waves or complexes. Fibrillation may be fine (low amplitude) or coarse (high amplitude). Coarse VF means the heart is fibrillating vigorously.
People who develop VF lose consciousness rapidly and die unless emergency treatment is initiated immediately. No drug can convert VF to a normal rhythm. The only effective treatment for VF is strong, electrical countershock (defibrillation), which must be administered with no delay if it is to be successful. Automatic external defibrillators (AED) and implantable cardioverter-defibrillators (ICD) have facilitated early defibrillation. In defibrillation, a strong depolarizing current (electrical shock) passing through the heart abruptly terminates all electrical activity in all myocardial fibers, allowing the most viable pacemaker (hoped to be the sinus node) to reestablish the rhythm. Coarse VF is generally more successfully defibrillated than fine VF. Epinephrine should be given intravenously to induce vigorous fibrillation if initial defibrillation attempts are unsuccessful.6
If VF persists or returns after several defibrillation attempts, antiarrhythmic drugs (usually lidocaine or amiodarone) are given to depress ventricular irritability.6 Because VF is equivalent to cardiac arrest, cardiopulmonary resuscitation (CPR) (i.e., external cardiac compression and artificial ventilation) must be implemented between defibrillation attempts.
Circus Reentry in Ventricular Fibrillation
The cardiac impulse normally travels throughout the ventricles quite rapidly and then dies out because all muscle is refractory at that time and cannot propagate the impulse further. However, several abnormal factors, including the following, may alter the way ventricles depolarize, predisposing them to develop a fibrillating pattern: (1) lengthened conduction pathways, (2) decreased conduction velocity, and (3) shortened refractory time.4 A lengthened conduction pathway may allow the portion of muscle depolarized first to repolarize before the rest of the ventricular muscle is finished depolarizing. Because heart muscle tends to wrap around the ventricles in a circular fashion, the last muscle to depolarize may be adjacent to recovered, repolarized muscle. The depolarizing stimulus reenters the newly repolarized muscle and is propagated around the circle repeatedly. This phenomenon is called circus movement (circus reentry).
Atrioventricular Conduction Blocks
AV blocks are generally categorized as first-degree, second-degree, or third-degree blocks. In first-degree AV block, all sinus nodal impulses are conducted to the ventricles, but the conduction time is slowed through the AV node–bundle complex. This slowed conduction is marked by an increase of the PR interval greater than 0.2 second (Figure 19-28). All QRS complexes have normal configurations.
In second-degree AV block, some but not all SA nodal impulses are conducted to the ventricles. In type I second-degree block (Figure 19-29), the PR intervals gradually lengthen until a QRS complex fails to appear after the P wave (nonconducted P wave). Following the nonconducted P wave, the PR interval is shorter, only to lengthen progressively again until another P wave fails to conduct to the ventricles. This type of second-degree block is also known as Mobitz type I (Wenckebach) block.6 Type II second-degree block, also called Mobitz type II block, is characterized by constant PR intervals but with various conduction ratios. For example, there may be only four QRS complexes for every five P waves (5:4 conduction ratio), or there may be one QRS for every two P waves (2:1 conduction ratio). In both types of second-degree blocks, QRS complexes are normal.
In third-degree AV block (complete heart block), no SA nodal impulses are transmitted to the ventricles (Figure 19-30). No relationship exists between P waves and QRS complexes; the atria and ventricles are electrically isolated from one another, and each establishes its own rhythm. In this situation, the ventricles must establish their own pacemaker because all SA nodal impulses are blocked. Ventricular self-pacing in this situation is called a ventricular escape rhythm, which is generally less than 40 beats per minute.6 Depending on the location of the ectopic pacemaker, the QRS complexes may appear normal or widened and bizarre. Generally, the ectopic pacemaker emerges just below the block in the AV bundle; the closer this pacemaker is to the bundle, the more stable it is in producing a reliable rhythm.6
Third-degree block may cause a significant decrease in cardiac output and blood pressure, with subsequent dizziness and fainting. In Stokes-Adams syndrome, the ventricular escape pacemaker fails to take over immediately after the onset of third-degree block. Consequently, loss of blood flow to the brain causes fainting. This condition can lead to complete ventricular asystole and death if an escape pacemaker does not eventually take over. In such instances, surgical insertion of an artificial cardiac pacemaker is necessary. Intravenous infusion of atropine (a parasympathetic blocking drug) and beta-adrenergic catecholamines also may be indicated to help reverse the conduction block while the patient waits for pacemaker insertion.6 Treatment for first-degree and second-degree blocks generally consists of withholding drugs known to slow cardiac conduction.
[/level-membership-for-pulmolory-and-respiratory-category][not-level-membership-for-pulmolory-and-respiratory-category]Chapter 19
The Electrocardiogram and Cardiac Arrhythmias in Adults
After reading this chapter you will be able to:
• Explain how the components of the electrocardiogram (ECG) relate to the electrical and mechanical activity of the heart
• Explain how heart muscle mass affects ECG amplitude
• Identify factors that determine the QRS complex polarity (positivity or negativity)
• Describe how each of the 12 ECG leads is configured with respect to the heart and the hexaxial reference system
• Explain how the QRS complex recorded in different ECG leads is used to determine the mean direction of current flow (electrical axis) in the heart
• Explain why cardiac electrical axis abnormalities are correlated with certain physiological abnormalities
• Calculate the heart rate from an ECG recording
• Identify ECG characteristics of common cardiac arrhythmias
• Describe the physiological basis for common cardiac arrhythmias
• Discuss the treatment focus for various cardiac arrhythmias
circus movement (circus reentry)
Mobitz type I (Wenckebach) block
paroxysmal supraventricular tachycardia (PSVT)
premature atrial contractions (PACs)
premature junctional contraction (PJC)
premature ventricular contraction (PVC)
Normal Electrocardiogram
The action potentials conducted through myocardial fibers during depolarization produce small electrical currents that can be detected at the body’s surface with the aid of proper equipment. As the heart depolarizes, the current flows from depolarized to polarized regions.1 Because a depolarized membrane is negatively charged on the outside with respect to the inside, the depolarization impulse sweeps over the surface of myocardial fibers as a wave of electronegativity. Figure 19-1 illustrates the depolarization wave and current flow of a depolarizing, contracting fiber. (The current flows from negatively to positively charged regions.)
Electrodes placed on the skin and attached to a specialized voltmeter, known as an electrocardiograph, can detect small voltage changes as the heart depolarizes and repolarizes. This device reflects the summation of all action potentials conducted through millions of myocardial fibers during the cardiac cycle. This summated recording is called the electrocardiogram (ECG), which is simply a graphic recording of voltage plotted against time during myocardial depolarization and repolarization (Figure 19-2). The ECG may be traced on specialized graph paper or displayed on an LCD monitoring screen.
Electrocardiogram Components
Waves and Complexes
The ECG consists of waves and complexes plotted as voltage on the vertical axis and time on the horizontal axis (see Figure 19-2). The spaces between waves and complexes are called intervals and segments. The P wave (see Figure 19-2, A) is produced as a result of atrial depolarization. The mechanical event of atrial contraction normally follows a fraction of a second after the P wave appears.
Intervals and Segments
Figure 19-2, B, illustrates various ECG time intervals and segments. The PR interval is the time required for the sinus node impulse to reach the ventricles. It is measured from the beginning of the P wave to the next deflection, whether it is a Q or an R wave. The average adult PR interval is between 0.12 second and 0.20 second; a PR interval greater than 0.20 second indicates abnormally slowed impulse conduction from atria to ventricles. The PR interval is normally shorter in fast heart rates than in slow heart rates.
The adult QRS complex lasts on average about 0.08 to 0.10 second. QRS width represents ventricular depolarization time and is measured from the point at which the tracing leaves the baseline to the point at which it returns to baseline (see Figure 19-2, B). This point of return is called the J point.
The ST segment extends from the J point to the beginning of the T wave and represents the early phase of ventricular repolarization. At its end, the normal ST segment curves slightly upward into the beginning of the T wave. The ST segment length varies according to the heart rate; fast heart rates have shorter ST segments than slow heart rates. The ST segment is normally flat, lying on the ECG baseline. However, this segment may be elevated 2 mm above the baseline or depressed 0.5 mm below the baseline and still be considered normal.2 An ST segment that becomes depressed more than 0.5 mm during a stress exercise test signals myocardial ischemia. The drug digitalis produces the same effect. An elevated ST segment generally indicates myocardial tissue injury.3
The QT interval is measured from the beginning of the QRS complex to the end of the T wave. The QT interval varies according to the heart rate but is usually less than 0.40 second.1 It represents the general refractory period of the ventricles. During this time, the ventricles generally cannot accept another depolarizing stimulus. However, as repolarization progresses, some of the ventricular muscle fibers are repolarized, while other fibers are still depolarized. This represents a vulnerable period during which part of the heart can respond to an additional stimulus and part of it cannot. The most vulnerable period is located at about the peak of the T wave and is sometimes called the relative refractory period of the heart. A depolarizing stimulus during this vulnerable time can create electrical chaos in the heart, rendering it quivering (fibrillating) and unable to pump blood. A prolonged QT interval is associated with life-threatening fibrillation because it is associated with a longer vulnerable period.2
Positive and Negative Electrocardiogram Deflections
Lead Axis and Current Flow
An imaginary straight line between the positive and negative electrodes of a bipolar lead is defined as the lead axis. Similarly, an imaginary line between a unipolar lead’s positive electrode and the center of the heart is the unipolar lead’s axis. In Figure 19-3, a myocardial depolarization current flowing at right angles to a lead’s axis generates an equiphasic or isoelectric deflection on the ECG monitored by the unipolar lead. Current flowing parallel to a lead’s axis generates a strongly negative or positive ECG deflection, depending on whether the current flows toward or away from the positive electrode; this is illustrated by the bipolar lead in Figure 19-3. Figure 19-4 illustrates the range of ECG deflection possibilities, depending on the direction of current flow relative to the lead’s axis.
The heart’s electrical axis refers to the average direction of current flow in the heart. The heavy arrow in the heart in Figure 19-3 is the heart’s electrical axis. The length of this arrow is proportional to the current’s intensity and is called a vector because it has direction and magnitude. For this reason, the average direction of current flow in the heart is commonly called the mean cardiac vector (MCV)
Electrocardiogram Graph Paper
ECG graph paper is a grid, permitting time measurement along the horizontal lines and voltage measurement along the vertical lines (Figure 19-5). Dark and light intersecting lines form large and small squares. The light vertical lines that help form the small squares are 1 mm apart and represent 0.04 second at a standard sweep speed of 25 mm per second. The heavy vertical lines are 5 mm apart and represent 0.20 second at standard recording speed. (The large squares have five small squares on each side [see Figure 19-5]).
Vertically, each small square represents 0.1 mV, which means each large square represents 0.5 mV (see Figure 19-5). By convention, ECG machines are adjusted, or standardized, so that a 1-mV electrical signal produces a 10-mm (two large squares) deflection. The amplitude of the ECG is discussed in terms of millivolts.
Electrocardiogram Leads
Standard Bipolar Limb Leads: Einthoven’s Triangle
At the turn of the twentieth century, Einthoven invented the ECG machine and introduced the three bipolar limb leads.3 Figure 19-6 illustrates these three standard limb leads. In lead I, the negative electrode is placed on the right arm, and the positive electrode is placed on the left arm. The axis of lead I is a horizontal line running from shoulder to shoulder. In lead II, the negative electrode is on the right arm, and the positive electrode is on the left leg; the axis of lead II runs from the right arm to the left leg (see Figure 19-6). Lead III has a negative electrode on the left arm and a positive electrode on the left leg. The lead III axis runs from the left arm to the left leg.
Standard Unipolar Limb Leads
Clinical Focus 19-1 Methods for Assessing Heart Rate on the Electrocardiogram
Look at Figure 19-5. Notice that five large squares equal 1 second (0.2 sec × 5 = 1.0 sec). Because 1 minute contains 60 seconds, 1 minute is represented by 300 large squares (5 squares/sec × 60 sec = 300 squares). If the heart rate is 300 beats per minute, the interval between two QRS complexes is one large square (i.e., a heartbeat [QRS complex] occurs every 0.2 second). When the heart rate is 150 beats per minute, the interval between two QRS complexes is two large squares. For determining the heart rate, the number 300 is divided by the number of large squares between two QRS complexes. This is summarized as follows:
| Number of Large Squares between Two QRS Complexes | Rate (beats/min) |
| 1 | 300 (300 ÷ 1) |
| 2 | 150 (300 ÷ 2) |
| 3 | 100 (300 ÷ 3) |
| 4 | 75 (300 ÷ 4) |
| 5 | 60 (300 ÷ 5) |
| 6 | 50 (300 ÷ 6) |
In Figure 19-5, markers identify 3-second intervals on the ECG paper. First, a 6-second interval is identified by using these markers (two 3-second intervals). Next, within this 6-second strip, the number of QRS complexes is counted. Because 1 minute contains 10 6-second intervals, the number of QRS complexes that were counted is multiplied by 10. For example, if eight QRS complexes are counted in a 6-second strip, the heart rate is 8 × 10 or 80 beats per minute. This method is best for averaging the heart rate when the rhythm is irregular (i.e., when the interval between QRS complexes varies).
electrode attachment points as the standard bipolar limb leads—that is, right arm, left arm, and left leg. The QRS complex recorded by a unipolar lead has a greater amplitude than the QRS complex recorded by bipolar leads; for this reason, unipolar leads are known as augmented limb leads. (Figure 19-7 illustrates the three unipolar augmented limb leads and their axes.)
The symbols for the three unipolar leads are aVR, aVL, and aVF. The a stands for “augmented,” the V stands for “voltage,” and the subscript letters R, L, and F indicate the positive electrode’s attachment points (right arm, left arm, or left foot). The axis of a unipolar lead is a line drawn from the positive electrode to the heart’s atrioventricular (AV) node (see Figure 19-7).
The three standard bipolar limb leads and three unipolar leads combined provide six different views of the heart’s electrical activity. In practice, it is unnecessary to place these lead terminals on the limbs; instead, they are generally placed directly on the anterior chest in patients who are continuously monitored (as shown for the augmented leads in Figure 19-7).
Precordial (Chest) Leads
The six ECG leads discussed up to this point are categorized as frontal plane leads because their axes lie in the frontal or vertical plane of the chest. From these leads, information can be obtained about current flowing right, left, up, or down but not about current flowing from the front of the chest toward the back, or vice versa. The axes of the precordial leads are located on a horizontal plane through the chest (Figure 19-8). They consist of six positive unipolar electrodes placed on the surface of the chest, as shown in Figure 19-9. These leads are designated V1, V2, V3, V4, V5, and V6. The 12-lead ECG
[/not-level-membership-for-pulmolory-and-respiratory-category]
