[level-membership-for-cardiovascular-category]7
The Effects of Other Conditions on the ECG
The ECG is not a good method for investigating or diagnosing any condition that is not primarily cardiac. However, some generalized diseases do affect the ECG: it is important to recognize this, and not assume that a patient has heart disease simply because their ECG seems abnormal.
ARTEFACTS IN ECG RECORDINGS
THE EFFECTS OF ABNORMAL MUSCLE MOVEMENT
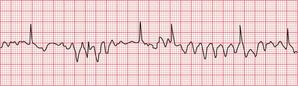
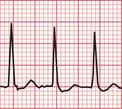
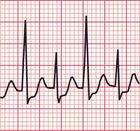
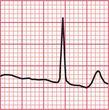
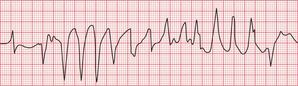
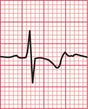
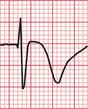
Sustained involuntary tremors, such as those associated with Parkinsonism ( Fig. 7.1) cause rhythmic ECG abnormalities that may be confused with cardiac arrhythmias.
HYPOTHERMIA
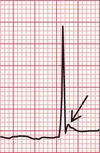
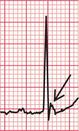
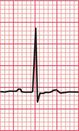
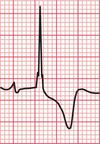
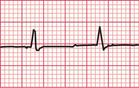
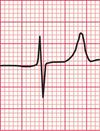
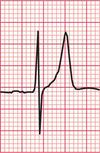
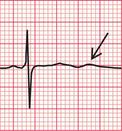
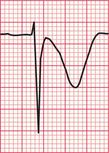
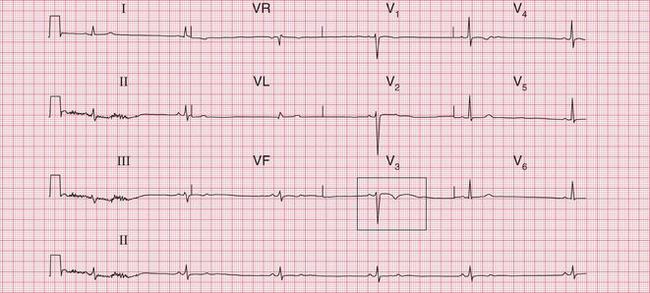
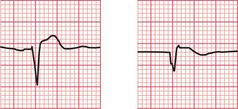
Hypothermia causes shivering, and therefore artefacts due to muscular activity. However, there can be other changes in the ECG, and the characteristic ECG feature of hypothermia is the ‘]’ wave. This is a small hump seen at the end of the QRS complex ( Fig. 7.2).
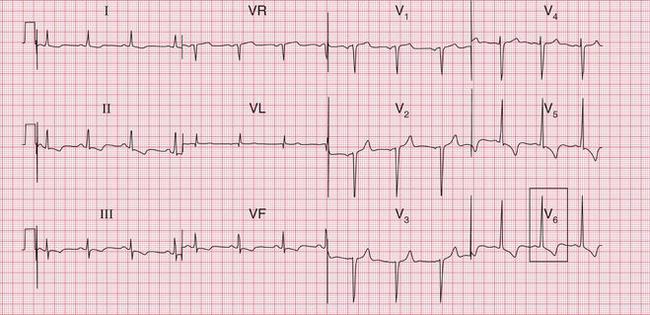
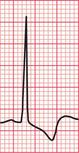
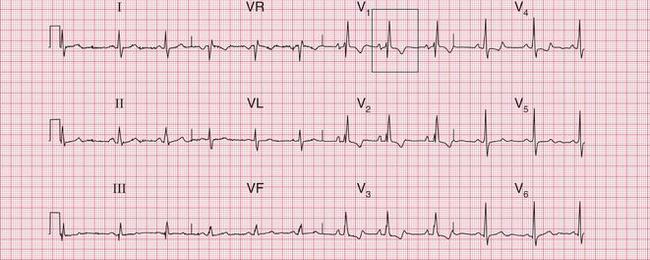
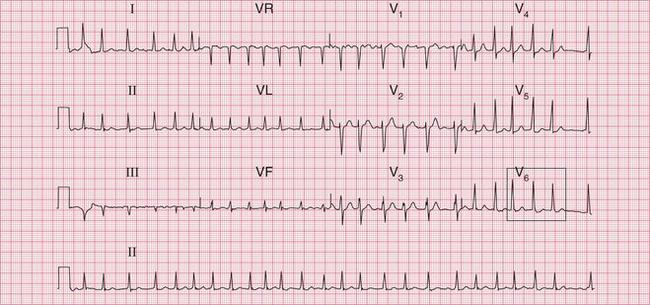
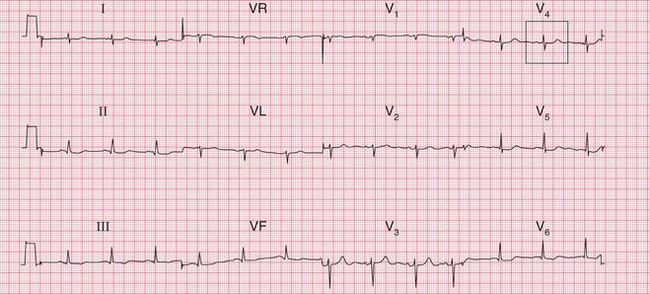
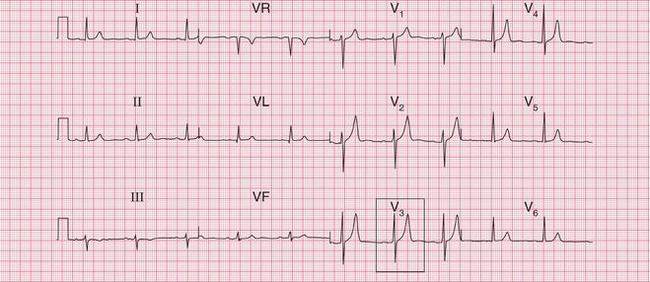
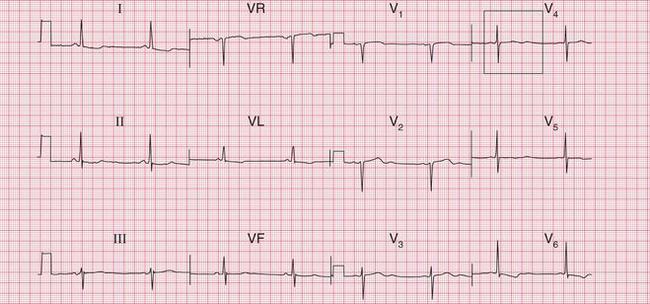
The ECG in Figure 7.2 was recorded from a 76-year-old woman who was admitted to hospital with a temperature of 30°C after lying for a prolonged period in a freezing house, after a fall. She initially had a heart rate of 26/min, and the rhythm was atrial flutter. J waves can be seen in the lateral chest leads. On re-warming, she began to shiver, and, despite the muscle artefact, her heart can be seen to have reverted to sinus rhythm with first degree block. J waves are still visible ( Fig. 7.3). When her temperature had returned to normal, the PR interval normalized and the J waves disappeared ( Fig. 7.4).
THE ECG IN CONGENITAL HEART DISEASE
The ECG provides a limited amount of help in the diagnosis of congenital heart disease by showing which chambers of the heart are enlarged. It is important to remember (see Ch. 1) that at birth the ECG of a normal infant shows a pattern of ‘right ventricular hypertrophy’, and this gradually disappears during the first 2 years of life.
Box 7.1 lists some common congenital disorders and the associated ECG appearances.
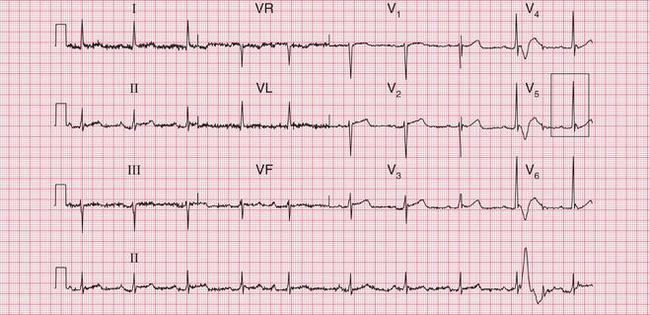
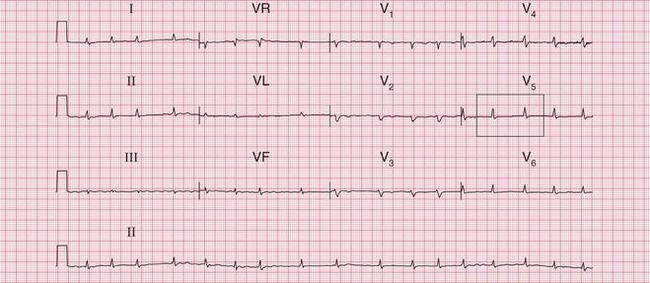
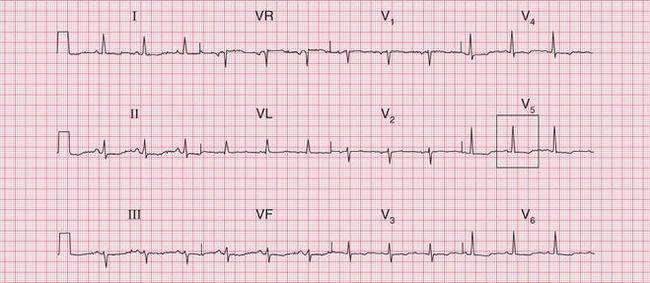
The ECG in Figure 7.5 shows all the features of severe right ventricular hypertrophy: it came from a boy with severe pulmonary stenosis.
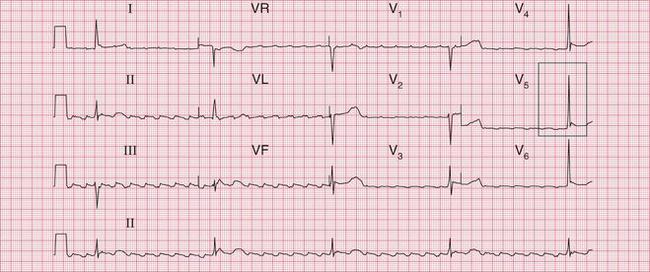
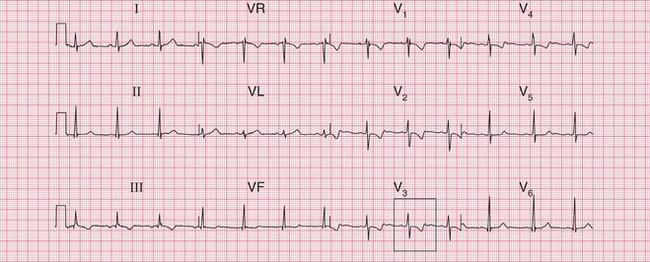
The ECG in Figure 7.6 shows left ventricular hypertrophy, and was recorded in an 8-year-old with severe aortic stenosis.
The ECG in Figure 7.7 shows right ventricular hypertrophy, and came from a young woman who had had a partial correction of Fallot’s tetralogy 20 years previously.
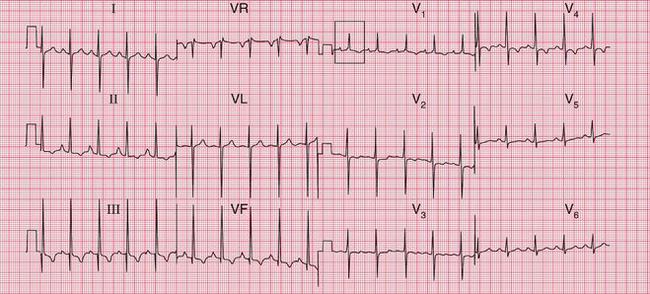

Fig. 7.7 Right ventricular hypertrophy in Fallot’s tetralogy
Note
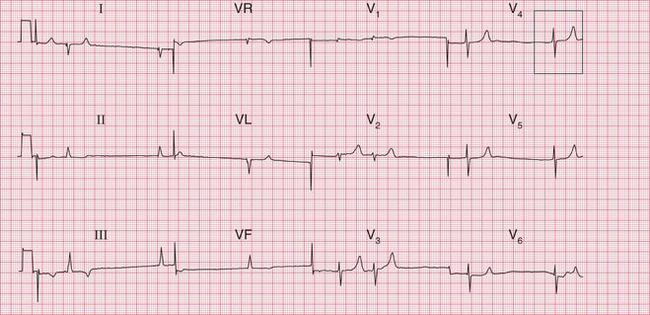
The ECG in Figure 7.8 suggests right atrial hypertrophy and shows right bundle branch block. It came from a teenager with Ebstein’s anomaly and an atrial septal defect.
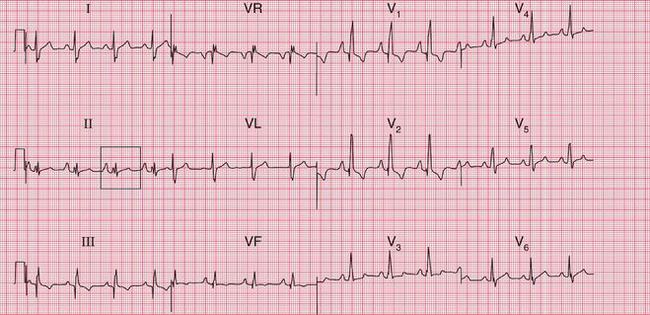

Fig. 7.8 Right atrial hypertrophy and right bundle branch block, in Ebstein’s anomaly
Note
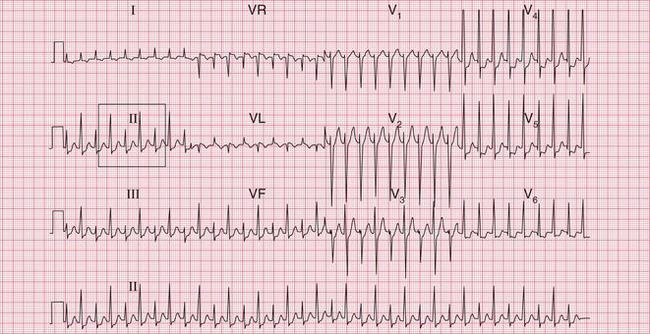
It is usually fairly obvious that a patient has congenital heart disease of some sort, but the condition that may be missed is an atrial septal defect. The ECG in Figure 7.9 is from a 50-year-old woman who complained of mild but increasing breathlessness. She had a rather nonspecific systolic murmur at the left sternal edge. Her GP recorded an ECG which showed right bundle branch block, and as a result she had an echocardiogram which showed an atrial septal defect.
THE ECG IN SYSTEMIC DISEASES
THYROID DISEASE
Thyrotoxicosis is probably the most common non-cardiac disorder that may present as a cardiac problem. It may cause atrial fibrillation, particularly in old age. There is usually a rapid ventricular response, which is difficult to control with digoxin ( Fig. 7.10). An elderly patient may complain of palpitations or the symptoms of heart failure, and arterial embolization may occur. The usual symptoms of thyrotoxicosis may be mild or even absent.
MALIGNANCY
Metastatic deposits in and around the heart can cause virtually any arrhythmia or conduction disturbance. Malignancy is the most common cause of a large pericardial effusion, and a combination of atrial fibrillation and small complexes on the ECG suggest a malignant pericardial effusion. The ECG in Figure 7.11 is from a 60-year-old man with metastatic bronchial carcinoma.
In the case of large pericardial effusions, with each beat the heart can rock within the effusion, causing alternate large and small QRS complexes. This is called ‘electrical alternans’. The ECG in Figure 7.12 is from another patient with carcinoma of the bronchus, who presented with a supraventricular tachycardia. Electrical alternans suggests the presence of a pericardial effusion, though in this case the QRS complexes are of normal size.
THE EFFECTS OF SERUM ELECTROLYTE ABNORMALITIES ON THE ECG
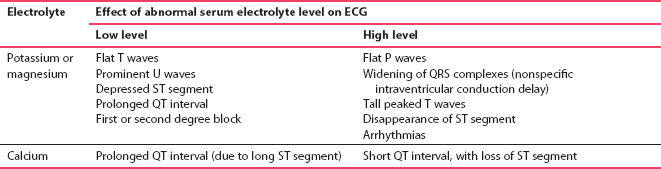
Although abnormal levels of serum potassium, magnesium and calcium can affect the ECG, the ‘classical’ changes are rarely seen. Occasionally an ECG may suggest that the electrolytes should be checked, but the range of normality in the ECG is so great that an ECG is an unrealistic guide to electrolyte balance. Box 7.2 lists possible causes of electrolyte imbalance, and Table 7.1 summarizes the ECG changes that may occur.
POTASSIUM
Hyperkalaemia may cause arrhythmias, including ventricular fibrillation or asystole; flattening of the P waves; widening of the QRS complexes; depression or loss of the ST segment; and, particularly, symmetrical peaking of the T waves. The ECG in Figure 7.13 is from a patient with renal failure and a potassium level of 7.4 mmol. After correction of the plasma potassium level, sinus rhythm was restored and the T waves were no longer peaked ( Fig. 7.14).

Remember, however, that peaked T waves are also a common finding in completely healthy patients ( Fig. 7.15).
Hypokalaemia is common in patients with cardiac disease who are treated with powerful diuretics. It causes flattening of the T waves, prolongation of the QT interval, and the appearance of U waves. The ECG in Figure 7.16 was recorded from a patient with severe heart failure due to ischaemic heart disease. The serum potassium level fell to 1.9 mmol, as a result of loop diuretic treatment without either potassium supplementation or the concomitant administration of an angiotensin-converting enzyme inhibitor.
THE EFFECTS OF MEDICATION ON THE ECG
DIGOXIN
Atrial fibrillation is normally associated with a rapid ventricular response (sometimes inappropriately called ‘fast AF’), unless conduction through the atrioventricular node is slowed by medication. Digoxin is still the best drug for controlling the ventricular rate in atrial fibrillation. The dose can be critical: the first sign of toxicity is a loss of appetite, and then the patient feels sick and vomits. Rarely, the patient complains of seeing yellow (xanthopsia). The main effect of digoxin on the ECG is downward sloping of the ST segments, especially in the lateral leads. The appearance is sometimes referred to as a ‘reverse tick’ ( Fig. 7.17).
With increasing doses of digoxin the ventricular rate becomes regular and slow, and eventually complete heart block may develop. Digoxin can cause almost any arrhythmia, but especially ventricular extrasystoles and sometimes ventricular tachycardia. There is only a loose correlation between the symptoms and the ECG signs of digoxin toxicity.
The ECG in Figure 7.18 was recorded from a patient with a congestive cardiomyopathy which caused atrial fibrillation and heart failure. She was vomiting and her failure had deteriorated, her heart rate having fallen to about 40 beats/min.
The ECG in Figure 7.19 shows another example of digoxin toxicity, which caused syncopal attacks due to runs of ventricular tachycardia.
DRUGS THAT PROLONG THE QT INTERVAL
Over 200 drugs have been claimed to cause QT interval prolongation or torsade de pointes ventricular tachycardia (TdP VT). This is particularly true of the Class I and Class III antiarrhythmic drugs. It is sensible to regard all antiarrhythmic drugs as being potentially pro-arrhythmic, with the exception of the beta-blockers other than sotalol. While TdP VT is most commonly seen in patients whose ECGs have a prolonged QT interval, in some individuals the two are apparently not related. The ECG in Figure 7.20 was recorded from a patient treated with amiodarone; the T wave changes disappeared when the drug was discontinued.
Some of the more commonly used drugs which may cause QT interval prolongation and have been associated with TdP VT are listed in Box 7.4.
‘Quinidine syncope’ was recognized years before its mechanism was understood, and the ECG in Figure 7.21 is from a patient who developed TdP VT while being treated with quinidine.
Any of the drugs listed in Box 7.4 should be discontinued if the corrected QT interval exceeds 500 ms, or if the patient has symptoms suggesting an arrhythmia. It is prudent not to use drugs known to prolong the QT interval in patients with heart disease, and combinations of these drugs (e.g. erythromycin and ketoconazole) must definitely be avoided.
The appearance of T wave changes as, for example, in the patient needing lithium treatment whose ECG is shown in Figure 7.22, is not necessarily an indication to discontinue treatment.
OTHER CAUSES OF AN ABNORMAL ECG
TRAUMA
Myocardial damage can be caused by chest injuries, either penetrating (e.g. stab wound) or closed (usually due to a steering wheel or seat belt). Direct trauma to the front of the heart can lead to occlusion of the left anterior descending coronary artery, and so to an ECG resembling that of an acute anterior myocardial infarction. However, seat belt injuries are more usually associated with myocardial contusion, as was the case in a young woman whose ECG is shown in Figure 7.23.
METABOLIC DISEASES
Most metabolic diseases, e.g. Addison’s disease, are associated with nonspecific ST segment or T wave changes. There may be no apparent abnormality in the serum electrolytes. The ECG in Figure 7.24 is from a young girl with severe anorexia nervosa: her serum electrolytes and thyroid function were perfectly normal – the ECG changes presumably reflect an intracellular electrolyte abnormality.
CEREBROVASCULAR ACCIDENTS
The association of a cerebrovascular accident and ECG abnormalities always suggests that the neurological problem is secondary to a cerebral embolus, which can arise in the heart because of an arrhythmia or a left ventricular thrombus.
Sudden intracerebral events, particularly subarachnoid haemorrhage, can cause widespread T wave inversion. The ECG in Figure 7.25 is from a patient with subarachnoid haemorrhage.
[/level-membership-for-cardiovascular-category][not-level-membership-for-cardiovascular-category]7
The Effects of Other Conditions on the ECG
The ECG is not a good method for investigating or diagnosing any condition that is not primarily cardiac. However, some generalized diseases do affect the ECG: it is important to recognize this, and not assume that a patient has heart disease simply because their ECG seems abnormal.
ARTEFACTS IN ECG RECORDINGS
THE EFFECTS OF ABNORMAL MUSCLE MOVEMENT
Sustained involuntary tremors, such as those associated with Parkinsonism ( Fig. 7.1) cause rhythmic ECG abnormalities that may be confused with cardiac arrhythmias.
HYPOTHERMIA
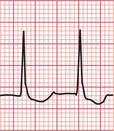
Hypothermia causes shivering, and therefore artefacts due to muscular activity. However, there can be other changes in the ECG, and the characteristic ECG feature of hypothermia is the ‘]’ wave. This is a small hump seen at the end of the QRS complex ( Fig. 7.2).
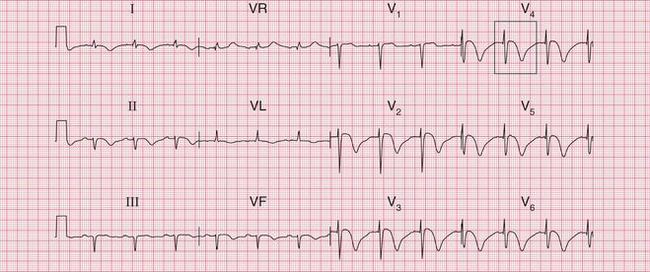
The ECG in Figure 7.2 was recorded from a 76-year-old woman who was admitted to hospital with a temperature of 30°C after lying for a prolonged period in a freezing house, after a fall. She initially had a heart rate of 26/min, and the rhythm was atrial flutter. J waves can be seen in the lateral chest leads. On re-warming, she began to shiver, and, despite the muscle artefact, her heart can be seen to have reverted to sinus rhythm with first degree block. J waves are still visible ( Fig. 7.3). When her temperature had returned to normal, the PR interval normalized and the J waves disappeared ( Fig. 7.4).
THE ECG IN CONGENITAL HEART DISEASE
The ECG provides a limited amount of help in the diagnosis of congenital heart disease by showing which chambers of the heart are enlarged. It is important to remember (see Ch. 1) that at birth the ECG of a normal infant shows a pattern of ‘right ventricular hypertrophy’, and this gradually disappears during the first 2 years of life.
Box 7.1 lists some common congenital disorders and the associated ECG appearances.
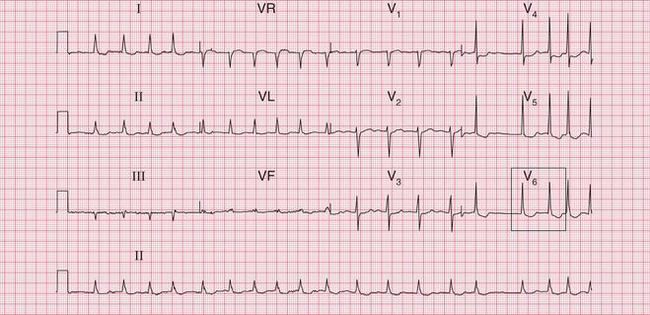
The ECG in Figure 7.5 shows all the features of severe right ventricular hypertrophy: it came from a boy with severe pulmonary stenosis.
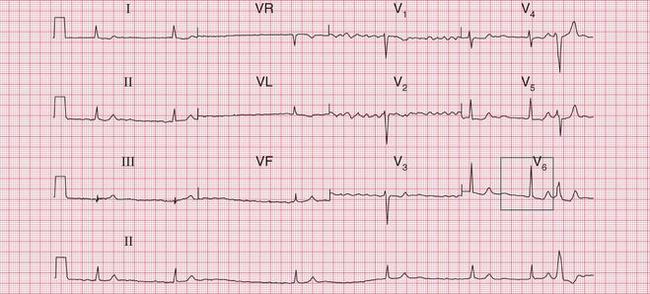
The ECG in Figure 7.6 shows left ventricular hypertrophy, and was recorded in an 8-year-old with severe aortic stenosis.
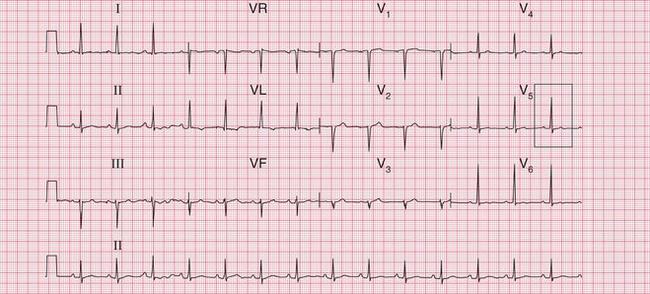
The ECG in Figure 7.7 shows right ventricular hypertrophy, and came from a young woman who had had a partial correction of Fallot’s tetralogy 20 years previously.
Fig. 7.7 Right ventricular hypertrophy in Fallot’s tetralogy
Note
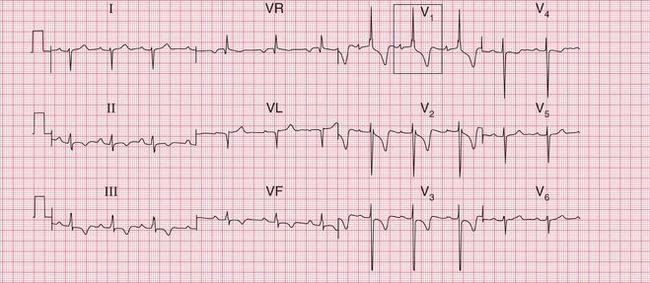
The ECG in Figure 7.8 suggests right atrial hypertrophy and shows right bundle branch block. It came from a teenager with Ebstein’s anomaly and an atrial septal defect.
Fig. 7.8 Right atrial hypertrophy and right bundle branch block, in Ebstein’s anomaly
Note
It is usually fairly obvious that a patient has congenital heart disease of some sort, but the condition that may be missed is an atrial septal defect. The ECG in Figure 7.9 is from a 50-year-old woman who complained of mild but increasing breathlessness. She had a rather nonspecific systolic murmur at the left sternal edge. Her GP recorded an ECG which showed right bundle branch block, and as a result she had an echocardiogram which showed an atrial septal defect.
