[level-membership-for-cardiovascular-category]3
The ECG When the Patient has a Tachycardia
Enhanced automaticity and triggered activity
Abnormalities of cardiac rhythm due to re-entry
Differentiation between re-entry and enhanced automaticity
Extrasystoles causing symptoms
Narrow complex tachycardias causing symptoms
Broad complex tachycardias causing symptoms
Special forms of ventricular tachycardia in patients with symptoms
Tachycardias associated with the Wolff–Parkinson–White syndrome
What to do when an arrhythmia is suspected
What to do when an arrhythmia is recorded
Atrioventricular nodal re-entry tachycardia (AVNRT, junctional tachycardia)
Atrial fibrillation and flutter
The Wolff–Parkinson–White syndrome
Electrophysiology and catheter ablation
Arrhythmias amenable to ablation
The only tachycardia that can be (reasonably) reliably diagnosed from the patient’s history is sinus tachycardia. A patient may notice the irregularity of atrial fibrillation, but it is easy to confuse this with multiple extrasystoles. The heart rate may give a clue to the nature of the arrhythmia ( Table 3.1) but there is really no substitute for the ECG.
Table 3.1
Physical signs and arrhythmias
| Pulse | Heart rate (beats/min) | Possible nature of any arrhythmia |
| Arterial pulse | ||
| Regular | < 50 | Sinus bradycardia |
| Second or third degree block | ||
| Atrial flutter with 3 : 1 or 4 : 1 block | ||
| Idionodal rhythm (junctional escape), with or without | ||
| sick sinus syndrome | ||
| 60-140 | Probable sinus rhythm | |
| 140-160 | Sinus tachycardia or an arrhythmia | |
| 150 | Probable atrial flutter with 2 : 1 block | |
| 140-170 | Atrial tachycardia | |
| Atrioventricular re-entry tachycardia (AVRT) | ||
| Atrioventricular nodal re-entry tachycardia (AVNRT; | ||
| junctional (nodal) tachycardia) | ||
| Ventricular tachycardia | ||
| > 180 | Probable ventricular tachycardia | |
| 300 | Atrial flutter with 1 : 1 conduction | |
| Irregular | Marked sinus arrhythmia | |
| Extrasystoles (supraventricular or ventricular) | ||
| Atrial fibrillation | ||
| Atrial flutter with variable block | ||
| Rhythm varying between sinus rhythm and any arrhythmia or conduction defect | ||
| Jugular venous pulse | ||
| More pulsations visible than heart rate | Second or third degree block | |
| Cannon waves – third degree block |
MECHANISM OF TACHYCARDIAS
ENHANCED AUTOMATICITY AND TRIGGERED ACTIVITY
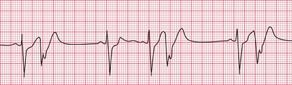
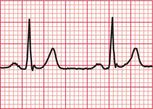
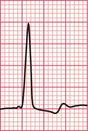
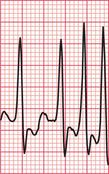
If the intrinsic frequency of depolarization of the atrial, junctional or ventricular conducting tissue is increased, an abnormal rhythm may occur. This phenomenon is called ‘enhanced automaticity’. Single early beats, or extrasystoles, may be due to enhanced automaticity arising from a myocardial focus. The most common example of a sustained rhythm due to enhanced automaticity is ‘accelerated idioventricular rhythm’, which is common after acute myocardial infarction. The ECG appearance ( Fig. 3.1) resembles that of a slow ventricular tachycardia, and that is the old-fashioned name for this condition. This rhythm causes no symptoms, and should not be treated.
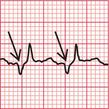
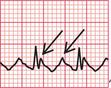
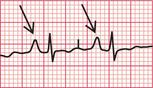
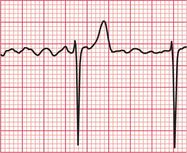
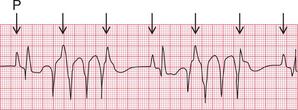
If the junctional intrinsic frequency is increased to a point at which it approximates to that of the SA node, an ‘accelerated idionodal rhythm’ results. This may appear to ‘overtake’ the P waves ( Fig. 3.2). This rhythm used to be called a ‘wandering pacemaker’. The term ‘focal junctional tachycardia’ is used in the (probably rare) instances of a supraventricular tachycardia originating around the AV node, by mechanisms other than re-entry.
‘Triggered activity’ results from late depolarizations which occur after normal depolarization, during what would normally be a period of repolarization. Like enhanced automaticity, this can cause extrasystoles or a sustained arrhythmia, such as right ventricular outflow tract ventricular tachycardia (RVOT-VT) ( Fig. 3.3).
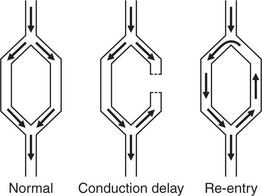
ABNORMALITIES OF CARDIAC RHYTHM DUE TO RE-ENTRY
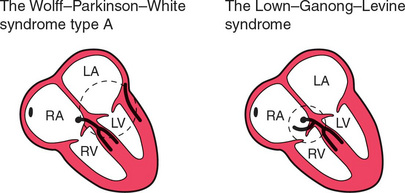
Normal conduction results in the uniform spread of the depolarization wave front in a constant direction. Should the direction of depolarization be reversed in some part of the heart, such as in an accessory connection between the atria and ventricles, it becomes possible for a circular or ‘re-entry’ pathway to be set up. Activation travels round and round the circuit, causing a tachycardia such as the atrioventricular reentry tachycardia (AVRT) experienced by patients with the Wolff-Parkinson-White (WPW) syndrome or the Lown-Ganong-Levine (LGL) syndrome ( Fig. 3.4).
ATRIOVENTRICULAR RE-ENTRY TACHYCARDIA (AVRT)
In the pre-excitation syndromes, normal and accessory pathways between an atrium and a ventricle together form an anatomical circuit round which depolarization can reverberate, causing a ‘re-entry’ tachycardia ( Fig. 3.5). Once established, a circular wave of depolarization will continue until some part of the pathway fails to conduct. Alternatively, the circular wave may be interrupted by the arrival of another depolarization wave, set up by an ectopic focus (e.g. an extrasystole).
In the WPW syndrome, the re-entry circuit comprises the normal AV node-His bundle connection between the atria and the ventricles, and an accessory pathway, the bundle of Kent, which also connects the atria and ventricles, bypassing the AV node ( Fig. 3.4). If forward conduction in the accessory pathway is blocked, depolarization can spread down the normal pathway and back (i.e. retrogradely) via the accessory pathway, to reactivate the atria. Recurrent activation of the circuit can cause a ‘circus movement’, resulting in a ‘reciprocating tachycardia’.
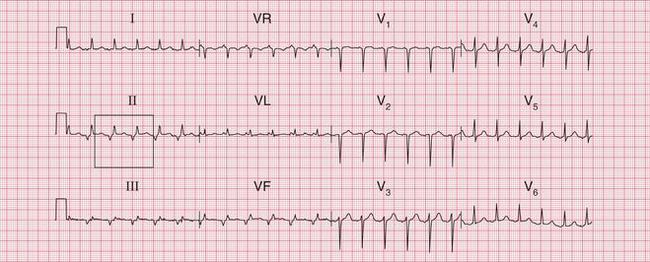
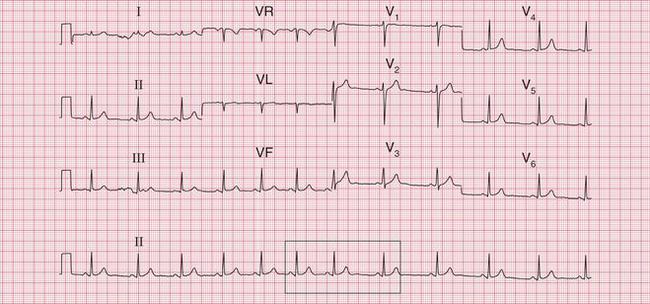
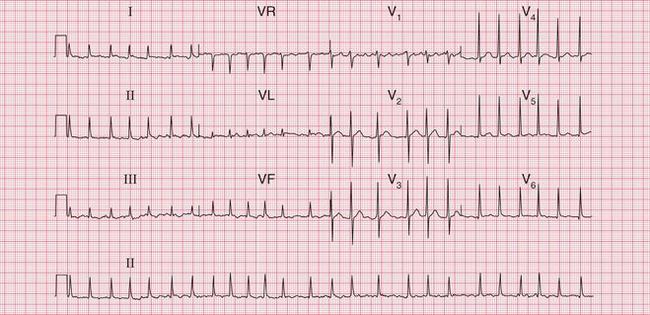
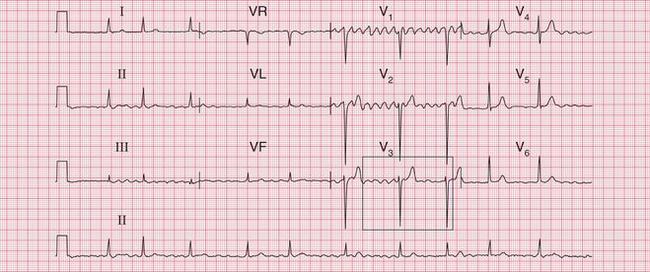
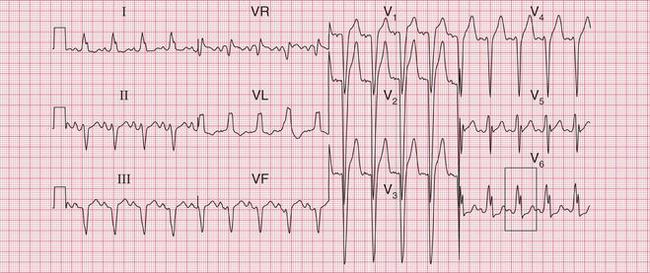
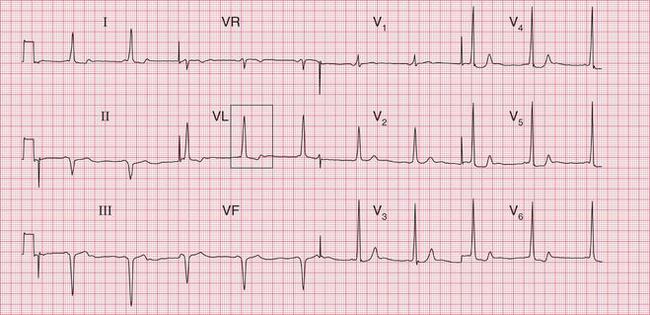
The tachycardia is described as ‘orthodromic’ when conduction within the His bundle is in the normal direction: the ECG then has narrow QRS complexes, and sometimes P waves are visible just after each QRS complex. Less commonly, depolarization passes down the accessory pathway and retrogradely up the His bundle, to cause an ‘antidromic reciprocating tachycardia’, in which the QRS complexes are broad and slurred, and P waves may or may not be seen. When the re-entry tachycardia is associated with a narrow QRS complex (i.e. when it is orthodromic), the pattern resembles a junctional (AV nodal re-entry) tachycardia (see below) and the presence of a preexcitation syndrome may not be suspected ( Figs 3.6 and 3.7).
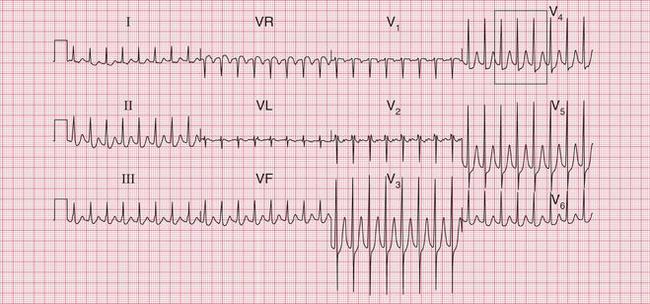
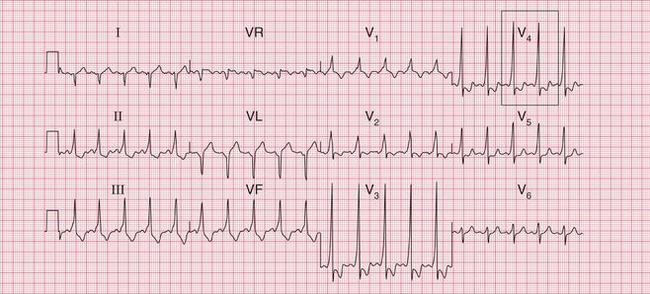
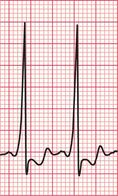
Fig. 3.7 Sinus rhythm, the Wolff–Parkinson–White syndrome, type A
Note
• Same patient as in Figure 3.6, after cardioversion
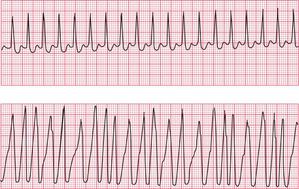
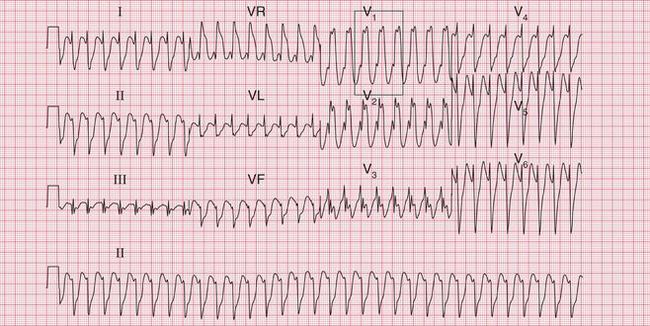
The broad complex (antidromic reciprocating) tachycardias which occur in patients with the WPW syndrome may resemble ventricular tachycardia ( Fig. 3.8). A very irregular broad complex tachycardia, as shown in the lower trace of Figure 3.8, will usually be due to the WPW syndrome with atrial fibrillation and antidromic conduction through the re-entry circuit. This rhythm can only be distinguished with certainty from atrial fibrillation and left bundle branch block if the appearance of the ECG in sinus rhythm is known. Superficially, the rhythm may resemble torsade de pointes ventricular tachycardia, but it lacks the characteristic ‘writhing’ of the QRS complexes that is associated with this arrhythmia.
ATRIAL TACHYCARDIA
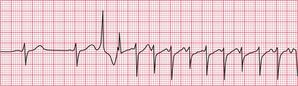
Re-entry within the atrial muscle causes a tachycardia characterized by P waves with a shape different from that of those related to sinus rhythm. The PR interval is usually short ( Fig. 3.9). Atrial tachycardia can also result from enhanced automaticity.
ATRIAL FLUTTER
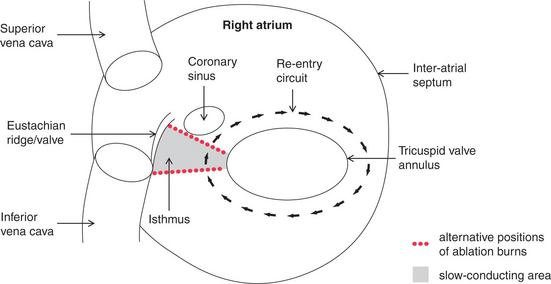
Atrial flutter is an organized atrial rhythm with a rate of 250-350/min. This rhythm depends on a variety of re-entry circuits, which often occupy large areas of the atrium and are known as ‘macro-re-entrant’ circuits. The most common type of flutter, ‘isthmus-dependent’ flutter, involves circuits utilizing the cavotricuspid isthmus. The involvement of a defined isthmus is important in considering ablation therapy (see p. 157).
AV NODAL RE-ENTRY TACHYCARDIA (AVNRT)
Atrioventricular nodal re-entry tachycardia (AVNRT), also known as atrioventricular nodal reciprocating tachycardia, originates in the AV node or His bundle. It may be facilitated by a congenital abnormality of the AV node, in which there are two (or sometimes more) electrically distinct pathways. These allow re-entry to start and be sustained within the node itself. In the absence of a tachycardia, the ECG has no distinguishing features, so the potential for an AVNRT cannot be detected from the ECG, unlike in cases of the WPW and LGL syndromes. During AVNRT, atrial and ventricular activation are virtually simultaneous, so the P wave is hidden within the QRS complex ( Fig. 3.10). AVNRT used to be called ‘junctional tachycardia’.
VENTRICULAR TACHYCARDIA
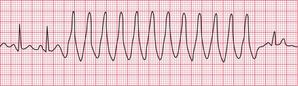
Ventricular tachycardia may be due to re-entry through circuits within the ventricles (for example around areas of scar tissue following myocardial infarction), or may result from enhanced automaticity or triggered activity. The broad QRS complexes are of a constant configuration and are fairly regular if the re-entry pathway is constant ( Fig. 3.11).
DIFFERENTIATION BETWEEN RE-ENTRY AND ENHANCED AUTOMATICITY
Except in the case of the pre-excitation syndromes, there is no certain way of distinguishing from the surface ECG between a tachycardia due to enhanced automaticity and one due to re-entry. In general, however, tachycardias that follow or are terminated by extrasystoles, and those that can be initiated or inhibited by appropriately timed intracardiac pacing impulses, are likely to be due to re-entry ( Figs 3.12 and 3.13).
TACHYCARDIAS WITH SYMPTOMS
SINUS RHYTHM CAUSING SYMPTOMS
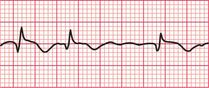
Sinus rhythm can be irregular (sinus arrhythmia) but the patient is never aware of this. The ECG of a patient with sinus arrhythmia ( Fig. 3.14) may suggest atrial extrasystoles – but in sinus rhythm, P wave morphology is constant while with atrial extrasystoles it varies.
Patients often complain of palpitations that are due to sinus tachycardia: the main causes are exercise, anxiety, thyrotoxicosis and the treatment of asthma with beta-adrenergic agonists, and other causes are summarized in Box 1.1 (p. 3). The ECG in Figure 3.15 shows sinus tachycardia due to an unusual cause – the habitual drinking of large quantities of cola.
When sinus tachycardia results from anxiety, heart rates of up to 150/min are possible and the rhythm may be mistaken for an atrial tachycardia. Pressure on the carotid sinus will cause transient slowing of the heart rate and the P waves will become more obvious (see Fig. 3.53, p. 153).
EXTRASYSTOLES CAUSING SYMPTOMS
An ECG is necessary to differentiate between supraventricular and ventricular extrasystoles.
When extrasystoles have a supraventricular origin ( Fig. 3.16), the QRS complex is narrow and both it and the T wave have the same configuration as in the sinus beat. Atrial extrasystoles have abnormal P waves. Junctional (AV nodal) extrasystoles either have a P wave very close to the QRS complex (in front of it or behind it) or have no visible P waves.
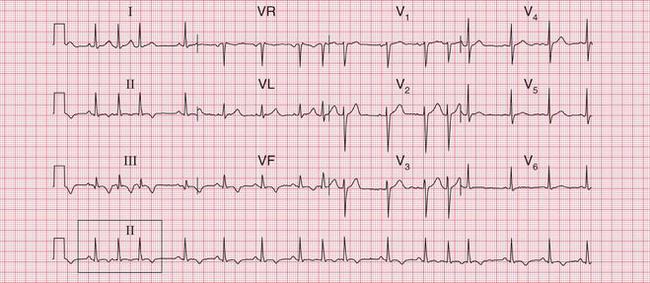
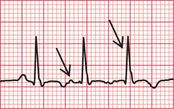
Fig. 3.16 Supraventricular extrasystoles
Note
First beat: normal; second beat: atrial extrasystole, with abnormal P wave; third beat: AV nodal (junctional) extrasystole, with no P wave
Ventricular extrasystoles produce wide QRS complexes of abnormal shape, and the T wave is also usually abnormal. No P waves are present ( Fig. 3.17).
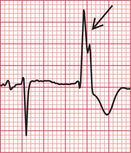
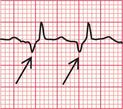
When a ventricular extrasystole appears on the upstroke of the preceding beat, the ‘R on T’ phenomenon is said to be present ( Fig. 3.18). This can initiate ventricular fibrillation, but usually it does not do so.
NARROW COMPLEX TACHYCARDIAS CAUSING SYMPTOMS
A tachycardia can be described as ‘narrow complex’ if the QRS complex is of normal duration, i.e. < 120 ms. Although sinus, atrial and junctional arrhythmias are all supraventricular, the term ‘supraventricular tachycardia’ is often inappropriately used interchangeably with junctional or atrioventricular nodal re-entry tachycardia (AVNRT). All these supraventricular rhythms have QRS complexes of normal shape and width, and the T waves have the same shape as in the sinus beat.
Types of narrow complex tachycardias are listed in Box 3.1.
ATRIAL TACHYCARDIA
In atrial tachycardia ( Fig. 3.19), P waves are present but they have an abnormal shape. They are sometimes hidden in the T wave of the preceding beat.
ATRIAL FLUTTER
In atrial flutter, the atrial rate is 300/min and the P waves form a continuous ‘sawtooth’ pattern. As the AV node usually fails to conduct all the P waves, the relationship between P waves and QRS complexes is usually 2 : 1, 3 : 1 or 4 : 1. Figure 3.20 shows atrial flutter with 2 : 1 block, giving a ventricular rate of 150/min. The ECG in Figure 3.21 is from the same patient after reversion to sinus rhythm.
The ECG in Figure 3.22 shows atrial flutter with 4 : 1 block.
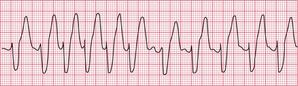
The ECG in Figure 3.23 shows a narrow complex (and therefore supraventricular) rhythm with a rate of 300/min. This is almost certainly atrial flutter with 1 : 1 conduction.
If the ventricular rate is rapid and P waves cannot be seen, carotid sinus pressure will usually increase the block in the AV node and make the ‘sawtooth’ more obvious (see Fig. 3.54, p. 153).
ATRIOVENTRICULAR NODAL RE-ENTRY TACHYCARDIA (AVNRT) OR ‘JUNCTIONAL’ TACHYCARDIA
In AVNRT, no P waves can be seen ( Fig. 3.10, p. 110). Carotid sinus pressure either reverts the heart to sinus rhythm or has no effect (see Fig. 3.55, p. 153).
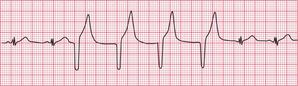
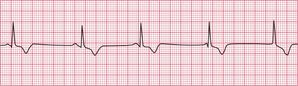
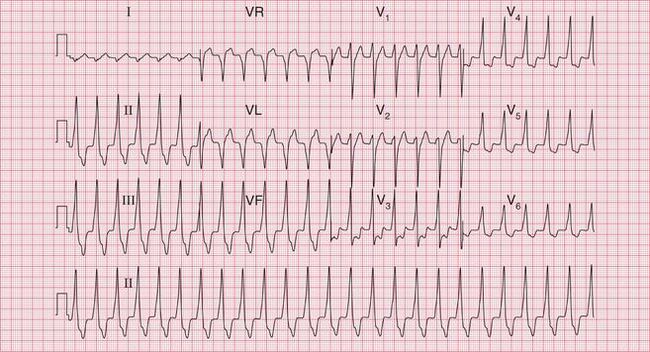
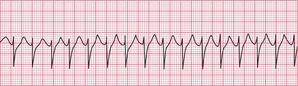
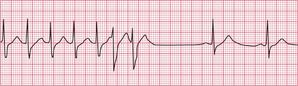
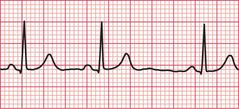
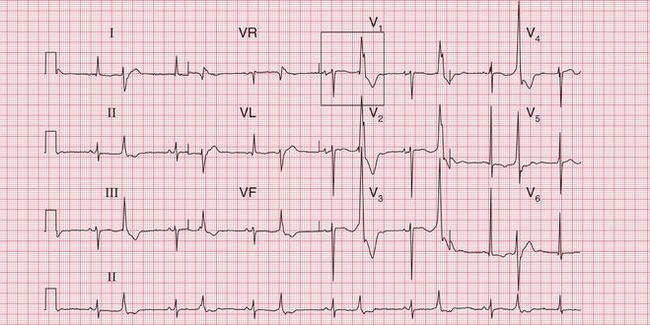
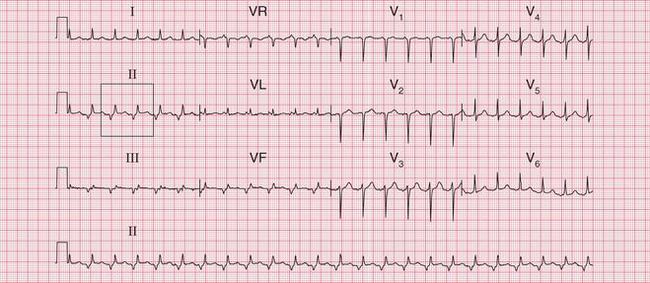
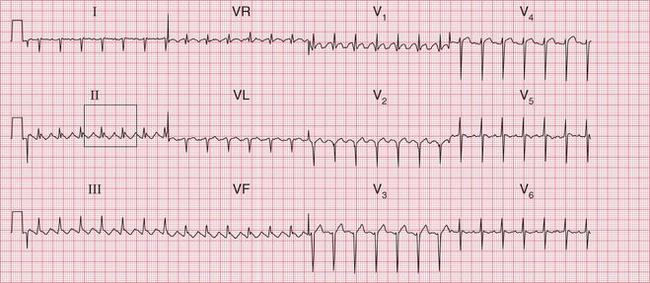
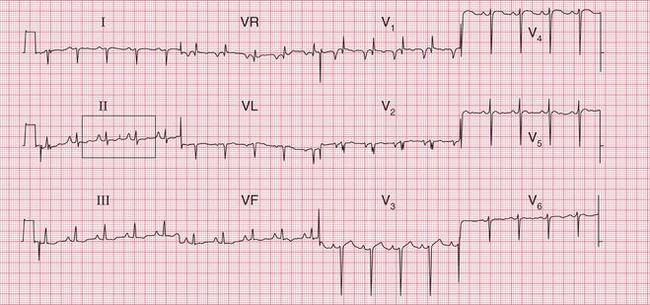
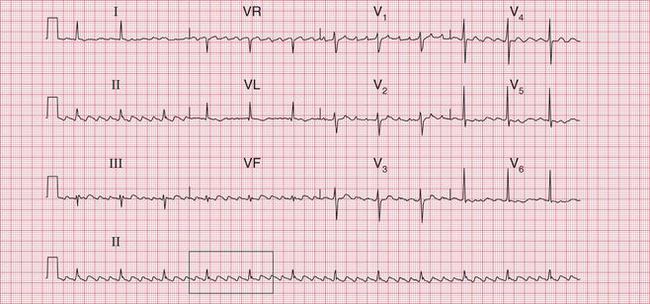
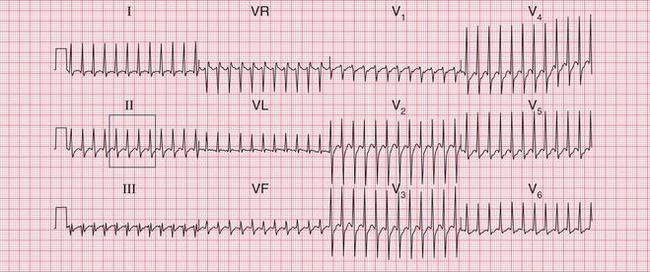
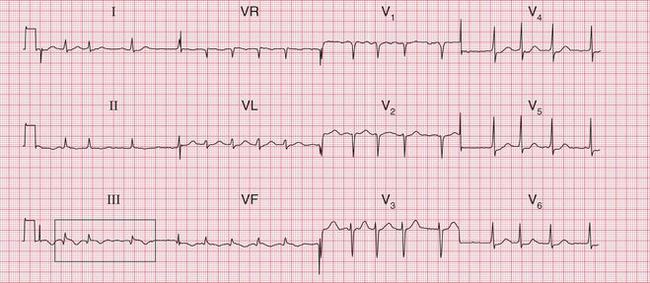
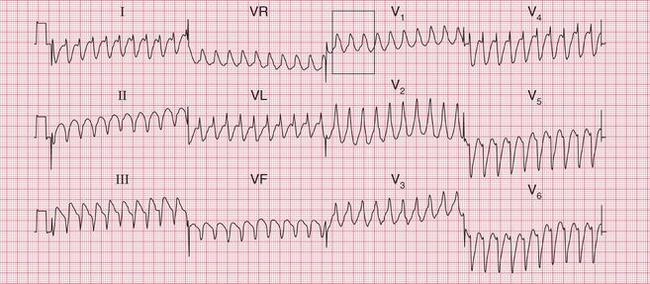
The ECG in Figure 3.24 shows a narrow complex tachycardia at 150/min, without any obvious P waves. After reversion to sinus rhythm ( Fig. 3.25), the shape of the QRS complexes does not change.
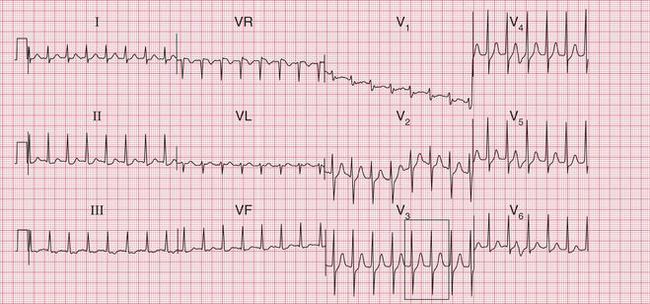
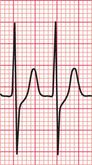
Fig 3.24 Atrioventricular nodal re-entry tachycardia (AVNRT)
Note
The ECG in Figure 3.6 (p. 106) shows what appears to be a straightforward AVNRT, but on return to sinus rhythm ( Fig. 3.6) it shows the Wolff-Parkinson-White type A pattern. The tachycardia was therefore orthodromic, with the re-entry circuit involving anterograde (normal) conduction down the AV node and His bundle (see Fig. 3.5, p. 107).
ATRIAL FIBRILLATION
In atrial fibrillation, disorganized atrial activity causes the P waves to disappear and the ECG baseline becomes totally irregular ( Fig. 3.26). At times atrial activity may become sufficiently synchronized for a ‘flutter-like’ pattern to appear, but this rapidly breaks up ( Fig. 3.27). In atrial fibrillation, as opposed to atrial flutter, the frequency of the QRS complexes is totally irregular.
Some causes of atrial fibrillation are summarized in Box 3.2.
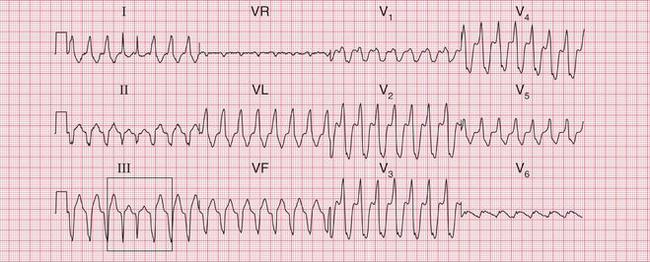
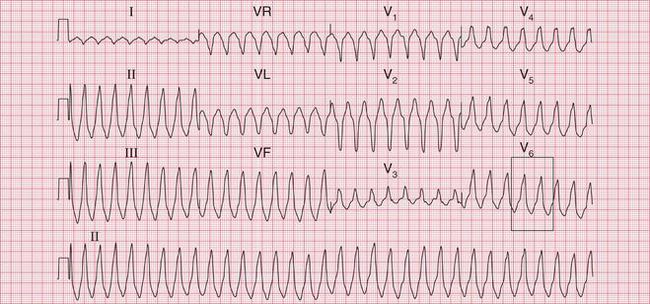
BROAD COMPLEX TACHYCARDIAS CAUSING SYMPTOMS
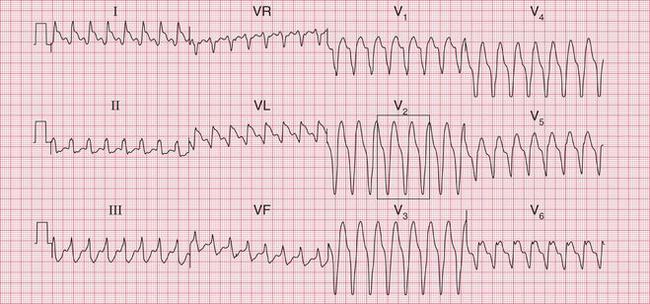
‘Broad complex’ tachycardias are those in which the QRS complex duration exceeds 120 ms and which are not due to sinus rhythm with bundle branch block. Broad complex tachycardias can be either supraventricular with bundle branch block; or due to the Wolff-Parkinson-White syndrome; or may be ventricular in origin. The types of broad complex tachycardia are listed in Box 3.3.
A supraventricular origin for a broad complex tachycardia can only be diagnosed with certainty when there is intermittent sinus rhythm with the same QRS complex configuration as is seen in the tachycardia ( Fig. 3.28).
Here we are concerned with broad complex rhythms without obvious P waves. These could be atrial fibrillation or junctional rhythms with bundle branch block, or could be ventricular rhythms. The differentiation of broad complex tachycardias can be difficult. It is not possible to distinguish between supraventricular and ventricular rhythms from the clinical state of the patient. Either type of rhythm can be well tolerated, and either can lead to cardiovascular collapse. However, broad complex tachycardias occurring in the course of an acute myocardial infarction (which is when they are most often seen) are almost always ventricular in origin. Other causes of ventricular tachycardia (VT) are listed in Box 3.4.
1. The presence of P waves. If there is one P wave per QRS complex, it must be sinus rhythm with bundle branch block. If P waves can be seen at a slower rate than the QRS complexes, it must be VT.
2. QRS complex duration. If longer than 160 ms, it is probably VT.
3. QRS complex regularity. VT is usually regular. An irregular broad complex tachycardia usually means atrial fibrillation with abnormal conduction.
4. The cardiac axis. VT is usually associated with left axis deviation.
5. QRS complex configuration. If the QRS complexes in the V leads all point either upwards or downwards (‘concordance’) it is probably VT.
6. When the QRS complex shows a right bundle branch block pattern, a supraventricular tachycardia with abnormal conduction is more likely if the second R peak is higher than the first. VT is likely if the first R peak is higher.
7. The presence of fusion and capture beats indicates that the broad complexes are due to VT (see p. 142).
P WAVES
The ECG in Figure 3.29 is from a patient with an acute infarction, and shows a broad complex rhythm at about 110/min. One P wave per QRS complex can clearly be seen, and this is obviously sinus rhythm with left bundle branch block (LBBB).
The ECG in Figure 3.30 shows a very irregular broad complex rhythm with no obvious P waves. There is an obvious LBBB pattern in leads V5 and V6. Whether the R-R interval is short or long, the appearance of the QRS complex is the same. The irregularity is the key to the diagnosis of atrial fibrillation with LBBB.
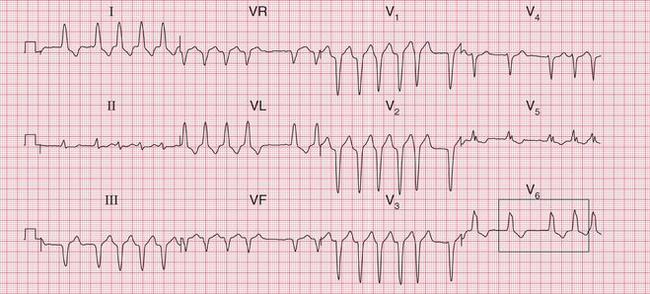
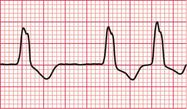
Fig 3.30 Atrial fibrillation with left bundle branch block (LBBB)
Note
The ECG in Figure 3.31 is also an example of atrial fibrillation and LBBB, but this is not quite as obvious as in Figure 3.30. The QRS complexes at first sight may appear regular, but on close inspection they are not. The LBBB is also not so obvious, but can be seen in lead I.
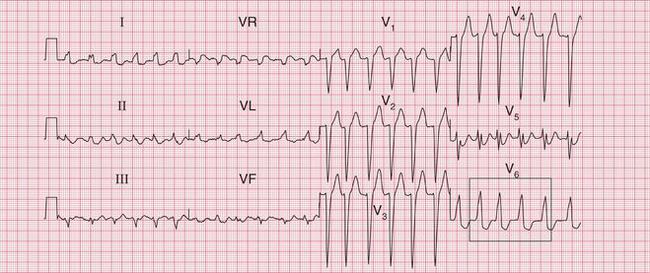
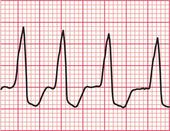
Fig 3.31 Atrial fibrillation with left bundle branch block (LBBB)
Note
Occasionally it may be possible to identify P waves with a slower rate than the QRS complexes, indicating that the QRS complexes must be ventricular in origin. A 12-lead ECG during the tachycardia is important for this, because P waves may be visible in some leads but not in others ( Fig. 3.32).
THE QRS COMPLEX
The ECG in Figure 3.33 shows a broad complex tachycardia recorded from a patient with an acute infarction, and there is no question that this represents VT.
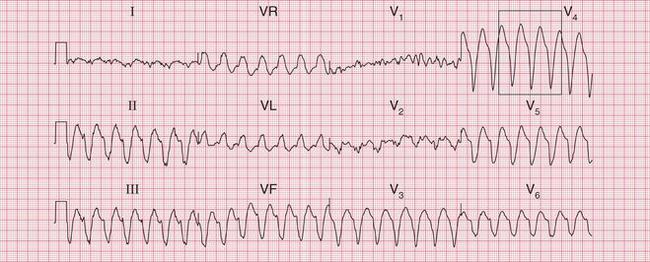
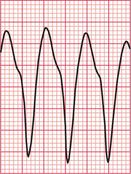
• regular rhythm at 160/min (a fairly typical rate)
• very broad complexes of 360 ms duration (when the QRS complex duration is > 160 ms, VT is likely)
• in the V leads the QRS complexes all point in the same direction (in this case downwards). This is called ‘concordance’.
The ECG in Figure 3.34 shows an ECG from another patient with an acute infarction. The shape of the QRS complexes is different from that in Figure 3.33, but the principles are the same:
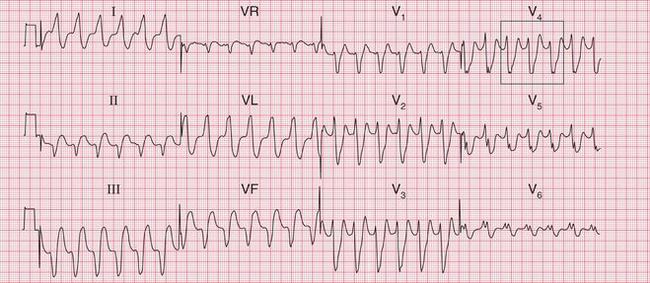
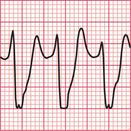
The ECG in Figure 3.35 shows another example of VT, but this time the axis is normal. Unfortunately the ‘rules’ for diagnosing VT are not absolute and one or more of the features above may not be present.
The ECG in Figure 3.36 shows atrial fibrillation with an abnormal QRS complex, the duration of which (116 ms) is just within the normal range. The RSR1 pattern, most obviously seen in lead V2, and the slurred S wave in lead V6, show that this is partial right bundle branch block (RBBB). Note that the second R peak of the QRS complex (R1) is higher than first peak. This is characteristic of RBBB. These features show that this is a supraventricular rhythm.
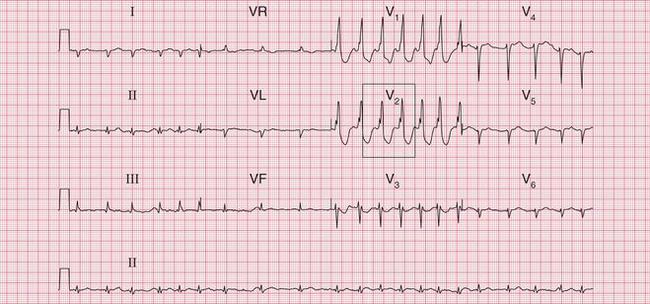
Fig 3.36 Atrial fibrillation with right bundle branch block (RBBB)
Note
The ECG in Figure 3.37 shows a regular tachycardia with no P waves and a QRS complex showing an RBBB pattern. The duration of the QRS complex is at the upper limit of normal, at 120 ms. This might be a supraventricular tachycardia (probably AVNRT) with RBBB conduction, or it might be a fascicular tachycardia. A fascicular tachycardia usually arises in the posterior fascicle of the left bundle branch. Typically there is left axis deviation (not present here). Fascicular tachycardia is an unusual rhythm with a benign prognosis, and it typically responds to verapamil.
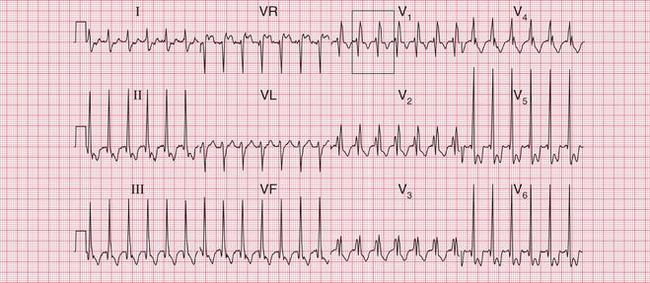
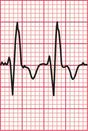
Fig 3.37 ?Junctional tachycardia with right bundle branch block or ?fascicular tachycardia
Note
The ECG in Figure 3.38 shows how difficult differentiation between supraventricular and ventricular rhythms can be. Some features suggest a supraventricular, and some a ventricular, origin of the rhythm.
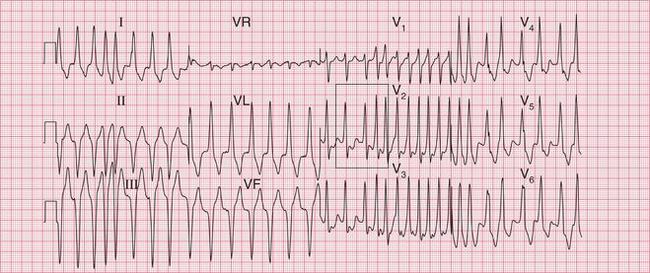
Often only a comparison of the patient′s ECGs taken in sinus rhythm and when the tachycardia is present will establish the nature of the tachycardia. In the case of any patient with a tachycardia it is essential to look through the old notes, to see if any ECGs have been recorded previously. The ECG in Figure 3.39 shows the broad complex tachycardia of a patient who was in pain and was hypotensive. He was cardioverted, and Figure 3.40 shows the post-cardioversion record. The QRS complexes are narrow, so the arrhythmia must have been VT.
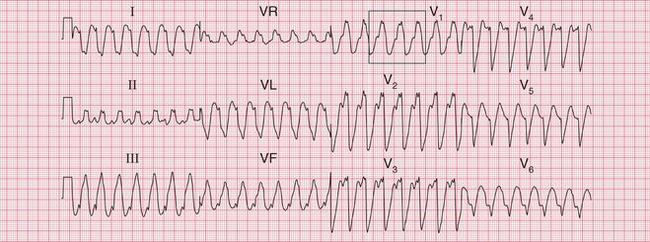
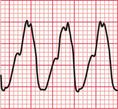
Fig 3.39 Broad complex tachycardia: ?ventricular,?supraventricular
Note
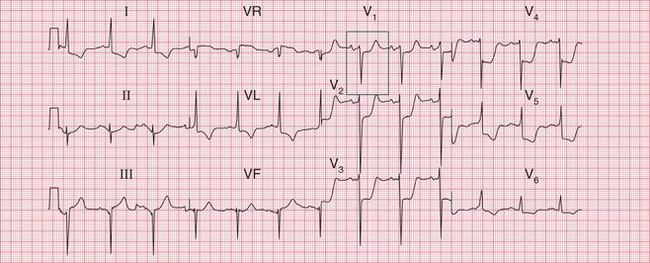
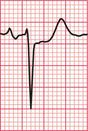
Fig 3.40 Post-cardioversion: sinus rhythm with normal conduction
Note
Figure 3.41 shows the ECG from a patient admitted to hospital with an inferior myocardial infarction, initially with atrial fibrillation. The patient then developed a broad complex tachycardia ( Fig. 3.42). In the context of an acute infarction this would almost certainly be VT. A comparison of Figures 3.41 and 3.42 shows the development of a different, indeterminate, axis and of RBBB. The change of axis is a strong pointer to a ventricular origin of the rhythm.
FUSION BEATS AND CAPTURE BEATS
If an early beat can be found with a narrow QRS complex, it can be assumed that a wide complex tachycardia is ventricular in origin. The narrow early beat demonstrates that the bundle branches will conduct supraventricular beats normally, even at high heart rates.
A ‘fusion beat’ is said to occur when the ventricles are activated simultaneously by a supraventricular and a ventricular impulse, so that a QRS complex with an intermediate pattern is seen ( Fig. 3.43). The appearance of fusion beats is variable.
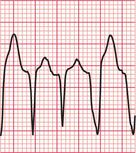
A ‘capture beat’ occurs when the ventricles are activated by an impulse of supraventricular origin during a run of VT (also shown in Fig. 3.43), and so capture beats have a QRS complex like those seen in a supraventricular rhythm. Figure 3.44 shows another example of a capture beat, indicating that the broad complex tachycardia is VT.
SPECIAL FORMS OF VENTRICULAR TACHYCARDIA IN PATIENTS WITH SYMPTOMS
RIGHT VENTRICULAR OUTFLOW TRACT TACHYCARDIA (RVOT-VT)
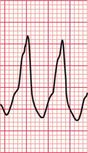
This is usually an exercise-induced tachycardia, which originates in the right ventricular outflow tract. It is recognizable because the broad complex tachycardia shows a combination of right axis deviation and left bundle branch block ( Fig. 3.45). RVOT-VT can be treated by ablation.
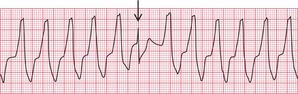
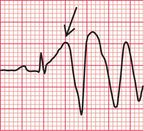
TORSADE DE POINTES
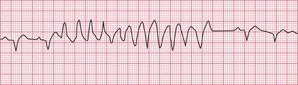
Ventricular tachycardia (VT) is called ‘monomorphic’ when all the QRS complexes have the same appearance, and ‘polymorphic’ when they vary. A ‘twisting’ or ‘writhing’ polymorphic VT is called ‘torsade de pointes’. This is often seen in patients whose ECG in sinus rhythm shows a long QT interval (see pp. 48 and 76). Figures 3.46 and 3.47 show the ECGs from a patient with a long QT interval when in sinus rhythm, who developed torsade de pointes VT. This pattern immediately raises the possibility of drug toxicity, and in this case the cause was a tricyclic antidepressant (see p. 77).
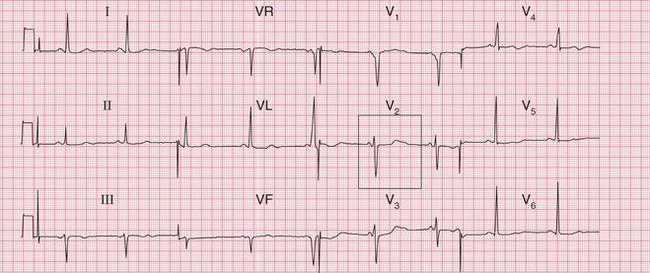
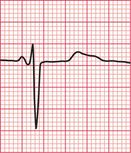
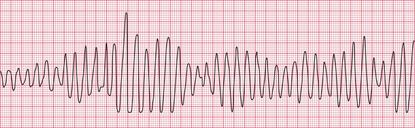
Figure 3.48 shows another example of torsade de pointes VT, in this case due to a Class I antiarrhythmic drug.
Possible causes of torsade de pointes VT due to drugs are listed in Box 3.6.
TACHYCARDIAS ASSOCIATED WITH THE WOLFF-PARKINSON-WHITE SYNDROME
In patients with an accessory pathway due to the Wolff-Parkinson-White (WPW) syndrome, the more common (orthodromic) re-entry tachycardia involves narrow QRS complexes, and thus it resembles a supraventricular tachycardia, unless bundle branch block is present (see p. 69).
In a patient with the WPW syndrome and a tachycardia with a cause other than a re-entry circuit, such as atrial fibrillation, the accessory pathway may have no significant role, and is then described as a ‘bystander’. The tachycardia will have broad complexes, even when conduction in both the His bundle and the accessory pathway is anterograde. With atrial fibrillation, the complexes will be polymorphic (variable-shape) and very irregular. This is extremely dangerous, because if the fast-conducting accessory pathway becomes involved and conducts depolarization associated with atrial flutter or fibrillation to the ventricles, the result can be ventricular fibrillation ( Figs 3.49 and 3.50).
MANAGEMENT OF ARRHYTHMIAS
WHAT TO DO WHEN AN ARRHYTHMIA IS SUSPECTED
1. Consider possible underlying diagnoses.
— haemoglobin (sinus tachycardia)
— thyroid function (sinus tachycardia, bradycardia or atrial fibrillation)
— chest X-ray (for heart size and to exclude the possibility of mild heart failure).
3. Ambulatory ECG: 24-h recording if symptoms are frequent, or event recording when symptoms are infrequent.
4. Echocardiography, to aid diagnosis when any sort of structural heart disease seems possible (e.g. valve disease with atrial fibrillation, or cardiomyopathy with syncope).
5. Tilt testing, when neurocardiogenic syncope or orthostatic hypotension (rather than an arrhythmia) is suspected.
PRECIPITATION OF ARRHYTHMIAS
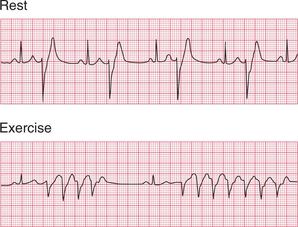
Arrhythmias are sometimes precipitated by exercise ( Fig. 3.51), and if the patient′s history suggests that this is so, then treadmill testing may be helpful. Attempts to provoke an arrhythmia by exercise should, however, only be made when full resuscitation facilities are available.
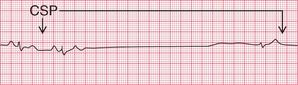
If the patient complains of syncopal attacks, particularly on movement of the head, it is worth pressing the carotid sinus in the neck to see if the patient has carotid sinus hypersensitivity. Complete SA node inhibition may be induced, sometimes with unpleasant effects ( Fig. 3.52).
WHAT TO DO WHEN AN ARRHYTHMIA IS RECORDED
• Does the arrhythmia need treating as an emergency?
— If there are unpleasant symptoms, or evidence of haemodynamic disturbance – yes.
— If the patient is asymptomatic – probably not, unless haemodynamic problems seem likely.
• Does the arrhythmia have an obvious cause?
• Some possible causes of palpitations are listed in Box 3.7.
• Consider the principles of arrhythmia management:
— Any arrhythmia causing significant symptoms or a haemodynamic disturbance must be treated immediately.
— All antiarrhythmic drugs should be considered cardiac depressants, and they are potentially pro-arrhythmic. The use of multiple agents should be avoided.
— Electrical treatment (cardioversion for tachycardias, pacing for bradycardias) should be used in preference to drug therapy when there is marked haemodynamic impairment.
CAROTID SINUS PRESSURE IN THE MANAGEMENT OF TACHYCARDIAS
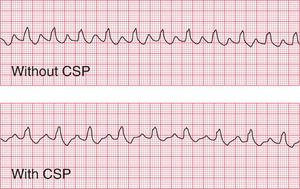
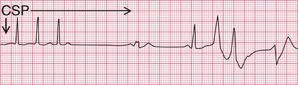
The first step in the management of any tachycardia is to try carotid sinus pressure (CSP).
In sinus rhythm, CSP will cause transient slowing of the heart rate. This may be useful in identifying the true origin of the rhythm when there is doubt ( Fig. 3.53).
In atrial flutter, AV conduction is blocked so the ventricular rate falls. The atrial activity becomes obvious, which helps to identify the rhythm ( Fig. 3.54). CSP seldom converts atrial flutter to sinus rhythm.
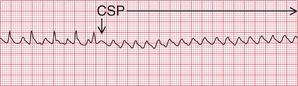
In atrial tachycardia and junctional tachycardia, CSP may restore sinus rhythm ( Fig. 3.55).
In atrial fibrillation and ventricular tachycardia, CSP has no effect.
EXTRASYSTOLES
• Supraventricular: no treatment. If the patient has symptoms, explanation and reassurance. Advise to discontinue smoking and avoid coffee and alcohol.
• Ventricular: usually no treatment, though treatment may be considered:
— when ventricular extrasystoles are so frequent that cardiac output is impaired
— when there is a frequent R on T phenomenon
— when the patient complains of an irregular heartbeat but reassurance and an explanation prove ineffective.
• Three ventricular extrasystoles together (a ‘salvo’) should be treated as a ventricular tachycardia.
SINUS TACHYCARDIA
Remember that sinus tachycardia always has a cause (see Box 3.7), and it is the cause that should be treated.
ATRIAL TACHYCARDIA
Remember that this may be due to digoxin toxicity. Treat as for AVNRT (see below).
ATRIOVENTRICULAR NODAL RE-ENTRY TACHYCARDIA (AVNRT, JUNCTIONAL TACHYCARDIA)
2. Adenosine 3 mg i.v. bolus, followed if necessary after 2 min by a further 6 mg adenosine and, if necessary after a further 2 min, by a further 12 mg adenosine. Unwanted but transient effects include asthma, flushing, chest tightness and dizziness.
3. Verapamil 2.5-5 mg i.v. or atenolol 2.5 mg i.v., repeated at 5 min intervals to a total of 10 mg. Note: These drugs should not be administered together, and verapamil should not be given to patients receiving a beta-blocker.
ATRIAL FIBRILLATION AND FLUTTER
VENTRICULAR TACHYCARDIA
Ventricular tachycardia (VT) can be treated with one of:
• Lidocaine 100 mg i.v., repeated twice at 5 min intervals, followed by a lidocaine infusion at 2–3 mg/min.
• Amiodarone 300 mg i.v. over 30 min then 900 mg over 24 h, followed by 200 mg t.d.s. by mouth for 1 week, 200 mg b.d. for 1 week and 200 mg daily thereafter.
• Atenolol 2.5 mg i.v., repeated at 5 min intervals to 10 mg.
• Flecainide 50–100 mg i.v., or 100 mg b.d. by mouth – but avoid in patients with coronary disease.
• Magnesium 8 mmol i.v. over 15 min, followed by 64 mmol over 24 h.
ELECTROPHYSIOLOGY AND CATHETER ABLATION
THE ENDOCARDIAL ECG
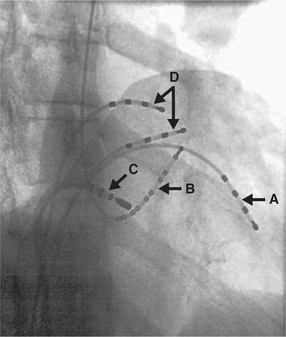
Electrical mapping catheters introduced via a trans-venous route into the heart can be used to measure the pattern of electrical activation in the heart. Usually catheters are placed in the right atrium, the right ventricle, across the tricuspid valve (close to the His bundle), and in the coronary sinus (to measure the pattern of left ventricular depolarization). Figure 3.56 shows an X-ray taken during a fairly typical investigation, with exploring electrodes in different cardiac chambers. More sophisticated mapping catheters, including looped catheters and balloon catheters, may be employed in more complex cases.
CATHETER ABLATION
If an abnormal conduction pathway, e.g. in the Wolff-Parkinson-White syndrome, can be located (mapped) and permanently interrupted, a paroxysmal re-entry tachycardia can be prevented and the patient can be cured without the need for further drug therapy. This used to be done surgically, but now abnormal re-entry pathways are ablated (cauterized) by burning with radiofrequency energy applied through an intracardiac catheter. Ablation can also be used to destroy a focus of enhanced automaticity or triggered activity that is the cause of an arrhythmia.
An example of the use of the endocardial ECG in catheter ablation is shown in Figure 3.57. It is important to recognize that the paper speed used in electro-physiology is usually greater than that used for 12-lead ECGs, and so the scale of the trace differs. Figure 3.57 shows continuous traces from surface ECG leads I and V1. Intracardiac electrograms are recorded at the proximal (CS-prox) and distal (CS-dist) poles of a multipolar catheter placed in the coronary sinus (CS) ( Fig. 3.56). The coronary sinus runs in the groove of the left atrioventricular sulcus, so both atrial (A) and ventricular (V) electrograms are recorded. The atrial electrograms from the coronary sinus arise from atrial tissue close to the AV junction. These areas depolarize late in atrial systole, so coincide with the end of the P wave seen in the surface ECG leads. The final electrogram shown in Figure 3.57 was recorded from the tip of the mapping/ablation catheter (MAP). This single-tip catheter is used as a mapping electrode, to probe for the optimal site for ablation, and is also used to deliver the radiofrequency ablation burn once this position is found.
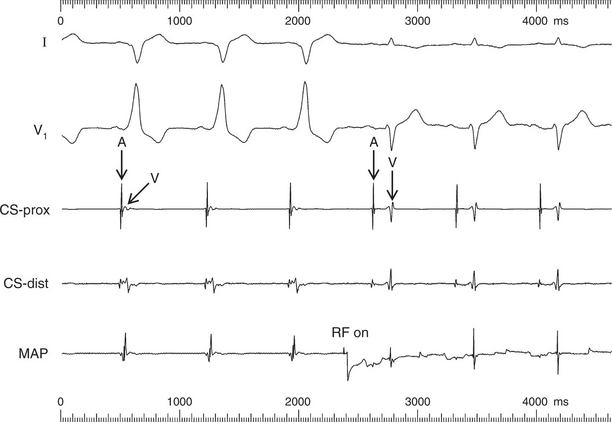
Fig 3.57 Endocardial ECG: ablation of left-sided accessory pathway
Note
The first three beats recorded in Figure 3.57 show sinus rhythm, conducted with pre-excitation via a left-sided accessory pathway – with a negative delta wave in lead I, positive delta wave in lead V1; and closely spaced atrial (A) and ventricular (V) electrograms recorded by the CS catheter. On applying radiofrequency energy for ablation (RF on), there was an almost immediate loss of pre-excitation, with the disappearance of delta waves in the ECG leads in the following beats. The interval between atrial and ventricular electrograms within each beat increased at the CS catheter, indicating normal conduction via the AV node and no conduction via the accessory pathway. The PR interval also increased, from less than 120 ms in the first three beats to 180 ms, following successful radiofrequency ablation of the accessory pathway.
ARRHYTHMIAS AMENABLE TO ABLATION
ATRIAL FLUTTER
Typical atrial flutter results from a re-entry circuit within the atria. This can be abolished by ablating an area known as the right atrial isthmus, which prevents re-entry from occurring ( Fig. 3.58).
ATRIAL FIBRILLATION
There is increasing evidence that in a high proportion of patients atrial fibrillation is initiated either by enhanced atrial automaticity or by triggered activity arising in the vicinity of the pulmonary veins, probably in atrial tissue extending into the pulmonary venous ostia and in the atrial area immediately outside the venous ostia. Ablation ( Fig. 3.59) can isolate the atrial tissue within the pulmonary veins from the rest of the atrium, and hence can suppress the initiation of paroxysmal atrial fibrillation and also reduce relapse after the cardioversion of permanent atrial fibrillation.
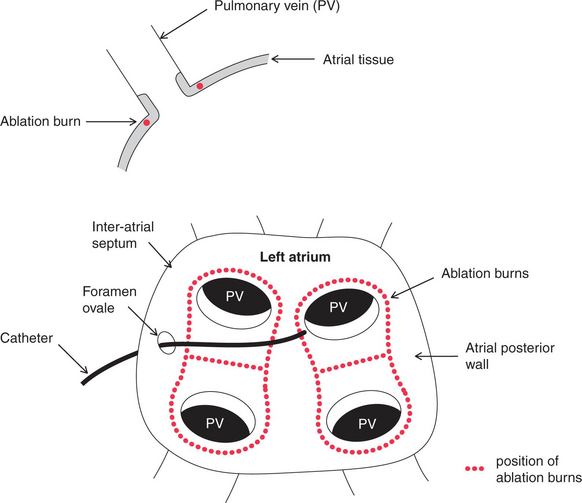
The ablation treatment of atrial fibrillation is more difficult than that of atrial flutter, because the left atrium has to be entered through the inter-atrial septum, involving trans-septal puncture through the foramen ovale, and more burns are needed. It is usually initially performed with a wide-area circumferential ablation (WACA, denoted by red dots in Fig. 3.59). Further segmental ablation, guided by pacing from a coronary sinus electrode, may be required to eliminate persisting areas of conduction until the pulmonary veins are electrically silent. At present this technique is usually regarded as a second-line option, limited to patients with symptoms refractory to conventional medical therapy, although its wider application is the subject of ongoing study.
VENTRICULAR TACHYCARDIA
Some forms of ventricular tachycardia (VT) are amenable to catheter radiofrequency ablation treatment. These include right ventricular outflow tract VT, where triggered activity is the cause, and also VT in some patients with surgically corrected congenital heart disease, if a simple ventricular re-entry circuit can be demonstrated. Ischaemic VT is not usually amenable to electrophysiological ablation, because often there are multiple potential foci of increased automaticity and potential re-entry circuits, due to areas of myocardial scarring. More sophisticated ventricular mapping tools are becoming available which potentially enable ablation treatment even for ischaemic VT.
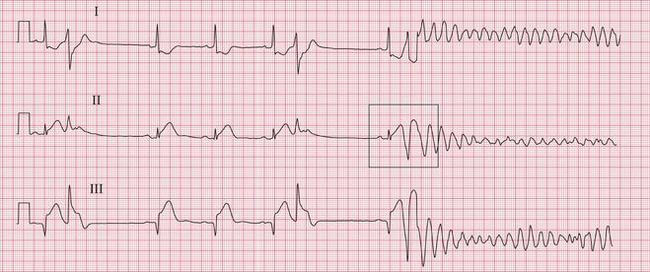
CARDIAC ARREST
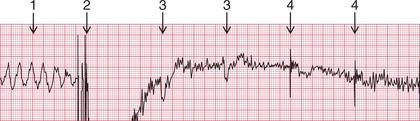
The ECG in Figure 3.60 was being recorded from a patient with an acute inferior myocardial infarction when he collapsed due to VF. Patients who survive ventricular fibrillation should be considered for the insertion of an implanted cardioverter defibrillator (ICD) (see below).
MANAGEMENT OF CARDIAC ARREST
The treatment of an individual patient will depend on the particular arrhythmia involved. Remember, confirm cardiac arrest by checking (ABC):
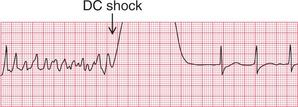
SHOCKABLE RHYTHMS – VENTRICULAR FIBRILLATION (VF) OR PULSELESS VENTRICULAR TACHYCARDIA (VT)
1. Precordial thump (especially useful in VT).
4. If unsuccessful, defibrillate at 360 J.
5. If unsuccessful, give adrenaline (epinephrine) 1 mg i.v.
8. If VF/pulseless VT persists, give amiodarone 300 mg i.v.
9. Give further shocks after 2-min periods of CPR.
10. Give adrenaline (epinephrine) 1 mg i.v. immediately before alternate shocks.
11. For refractory VF, give magnesium sulfate 2 g i.v. bolus (8 mmol).
The ECG in Figure 3.61 shows a successful defibrillation.
NON-SHOCKABLE RHYTHMS – ASYSTOLE AND PULSELESS ELECTRICAL ACTIVITY (PEA)
• CPR 30 : 2 (30 chest compressions followed by 2 ventilations).
• If it is unclear whether the rhythm is ‘fine ventricular fibrillation’ or asystole, treat as VF until three defibrillations have not changed the apparent rhythm.
• Adrenaline (epinephrine) 1 mg i.v.
• If unsuccessful, continue adrenaline (epinephrine) 1 mg after alternate 2-min cycles of CPR.
CAUSES OF CARDIAC ARREST
With any case of cardiac arrest, consider the possibility of a reversible cause (all of which begin with H or T):
IMPLANTED CARDIOVERTER DEFIBRILLATOR (ICD) DEVICES
PACEMAKER FUNCTION
ICD devices have the same functions as a conventional pacemaker (see Ch. 4) . They can be single or dual chamber, or biventricular (CRTD). In patients who do not require the pacing function, the ICD will usually be a single-chamber system, programmed as a backup VVI. The device will then be in continuous sensing mode.
DEFIBRILLATOR FUNCTION
The chest X-ray appearances of ICD devices are similar to those of conventional pacemakers. However, devices with a defibrillating function are bigger, incorporating more battery power for the delivery of shocks. In addition, the right ventricular lead contains the two poles of the shocking coil and so is thicker than a conventional lead ( Fig. 3.62).
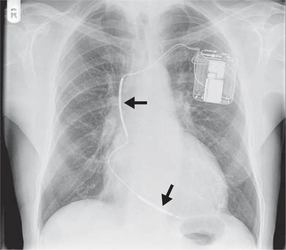
In addition to the normal sensing functions of a pacemaker, an ICD can sense high rates of ventricular activity. If a predetermined ventricular rate is exceeded, an electrical shock discharges between the two poles of the defibrillator coil in the ventricular lead, with the aim of cardioverting a life-threatening ventricular arrhythmia ( Fig. 3.63). If the ventricular rate does not fall below the threshold following one shock, then further shocks may be delivered.
ABNORMAL ICD FUNCTION
Either the pacing function or the defibrillator function of an ICD device may fail. The defibrillator function may either fail appropriately to initiate ventricular arrhythmia therapy, or may deliver inappropriate shocks. This will require specialist input and analysis. In the event of inappropriate repeated shock delivery, an ICD can be inactivated in a monitored patient by the application of a magnet.
[/level-membership-for-cardiovascular-category][not-level-membership-for-cardiovascular-category]3
The ECG When the Patient has a Tachycardia
Enhanced automaticity and triggered activity
Abnormalities of cardiac rhythm due to re-entry
Differentiation between re-entry and enhanced automaticity
Extrasystoles causing symptoms
Narrow complex tachycardias causing symptoms
Broad complex tachycardias causing symptoms
Special forms of ventricular tachycardia in patients with symptoms
Tachycardias associated with the Wolff–Parkinson–White syndrome
What to do when an arrhythmia is suspected
What to do when an arrhythmia is recorded
Atrioventricular nodal re-entry tachycardia (AVNRT, junctional tachycardia)
Atrial fibrillation and flutter
The Wolff–Parkinson–White syndrome
Electrophysiology and catheter ablation
Arrhythmias amenable to ablation
The only tachycardia that can be (reasonably) reliably diagnosed from the patient’s history is sinus tachycardia. A patient may notice the irregularity of atrial fibrillation, but it is easy to confuse this with multiple extrasystoles. The heart rate may give a clue to the nature of the arrhythmia ( Table 3.1) but there is really no substitute for the ECG.
Table 3.1
Physical signs and arrhythmias
| Pulse | Heart rate (beats/min) | Possible nature of any arrhythmia |
| Arterial pulse | ||
| Regular | < 50 | Sinus bradycardia |
| Second or third degree block | ||
| Atrial flutter with 3 : 1 or 4 : 1 block | ||
| Idionodal rhythm (junctional escape), with or without | ||
| sick sinus syndrome | ||
| 60-140 | Probable sinus rhythm | |
| 140-160 | Sinus tachycardia or an arrhythmia | |
| 150 | Probable atrial flutter with 2 : 1 block | |
| 140-170 | Atrial tachycardia | |
| Atrioventricular re-entry tachycardia (AVRT) | ||
| Atrioventricular nodal re-entry tachycardia (AVNRT; | ||
| junctional (nodal) tachycardia) | ||
| Ventricular tachycardia | ||
| > 180 | Probable ventricular tachycardia | |
| 300 | Atrial flutter with 1 : 1 conduction | |
| Irregular | Marked sinus arrhythmia | |
| Extrasystoles (supraventricular or ventricular) | ||
| Atrial fibrillation | ||
| Atrial flutter with variable block | ||
| Rhythm varying between sinus rhythm and any arrhythmia or conduction defect | ||
| Jugular venous pulse | ||
| More pulsations visible than heart rate | Second or third degree block | |
| Cannon waves – third degree block |
MECHANISM OF TACHYCARDIAS
ENHANCED AUTOMATICITY AND TRIGGERED ACTIVITY
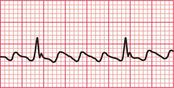
If the intrinsic frequency of depolarization of the atrial, junctional or ventricular conducting tissue is increased, an abnormal rhythm may occur. This phenomenon is called ‘enhanced automaticity’. Single early beats, or extrasystoles, may be due to enhanced automaticity arising from a myocardial focus. The most common example of a sustained rhythm due to enhanced automaticity is ‘accelerated idioventricular rhythm’, which is common after acute myocardial infarction. The ECG appearance ( Fig. 3.1) resembles that of a slow ventricular tachycardia, and that is the old-fashioned name for this condition. This rhythm causes no symptoms, and should not be treated.
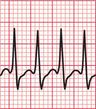
If the junctional intrinsic frequency is increased to a point at which it approximates to that of the SA node, an ‘accelerated idionodal rhythm’ results. This may appear to ‘overtake’ the P waves ( Fig. 3.2). This rhythm used to be called a ‘wandering pacemaker’. The term ‘focal junctional tachycardia’ is used in the (probably rare) instances of a supraventricular tachycardia originating around the AV node, by mechanisms other than re-entry.
‘Triggered activity’ results from late depolarizations which occur after normal depolarization, during what would normally be a period of repolarization. Like enhanced automaticity, this can cause extrasystoles or a sustained arrhythmia, such as right ventricular outflow tract ventricular tachycardia (RVOT-VT) ( Fig. 3.3).
ABNORMALITIES OF CARDIAC RHYTHM DUE TO RE-ENTRY
Normal conduction results in the uniform spread of the depolarization wave front in a constant direction. Should the direction of depolarization be reversed in some part of the heart, such as in an accessory connection between the atria and ventricles, it becomes possible for a circular or ‘re-entry’ pathway to be set up. Activation travels round and round the circuit, causing a tachycardia such as the atrioventricular reentry tachycardia (AVRT) experienced by patients with the Wolff-Parkinson-White (WPW) syndrome or the Lown-Ganong-Levine (LGL) syndrome ( Fig. 3.4).
ATRIOVENTRICULAR RE-ENTRY TACHYCARDIA (AVRT)
In the pre-excitation syndromes, normal and accessory pathways between an atrium and a ventricle together form an anatomical circuit round which depolarization can reverberate, causing a ‘re-entry’ tachycardia ( Fig. 3.5). Once established, a circular wave of depolarization will continue until some part of the pathway fails to conduct. Alternatively, the circular wave may be interrupted by the arrival of another depolarization wave, set up by an ectopic focus (e.g. an extrasystole).
In the WPW syndrome, the re-entry circuit comprises the normal AV node-His bundle connection between the atria and the ventricles, and an accessory pathway, the bundle of Kent, which also connects the atria and ventricles, bypassing the AV node ( Fig. 3.4). If forward conduction in the accessory pathway is blocked, depolarization can spread down the normal pathway and back (i.e. retrogradely) via the accessory pathway, to reactivate the atria. Recurrent activation of the circuit can cause a ‘circus movement’, resulting in a ‘reciprocating tachycardia’.
The tachycardia is described as ‘orthodromic’ when conduction within the His bundle is in the normal direction: the ECG then has narrow QRS complexes, and sometimes P waves are visible just after each QRS complex. Less commonly, depolarization passes down the accessory pathway and retrogradely up the His bundle, to cause an ‘antidromic reciprocating tachycardia’, in which the QRS complexes are broad and slurred, and P waves may or may not be seen. When the re-entry tachycardia is associated with a narrow QRS complex (i.e. when it is orthodromic), the pattern resembles a junctional (AV nodal re-entry) tachycardia (see below) and the presence of a preexcitation syndrome may not be suspected ( Figs 3.6 and 3.7).
Fig. 3.7 Sinus rhythm, the Wolff–Parkinson–White syndrome, type A
Note
• Same patient as in Figure 3.6, after cardioversion
The broad complex (antidromic reciprocating) tachycardias which occur in patients with the WPW syndrome may resemble ventricular tachycardia ( Fig. 3.8). A very irregular broad complex tachycardia, as shown in the lower trace of Figure 3.8, will usually be due to the WPW syndrome with atrial fibrillation and antidromic conduction through the re-entry circuit. This rhythm can only be distinguished with certainty from atrial fibrillation and left bundle branch block if the appearance of the ECG in sinus rhythm is known. Superficially, the rhythm may resemble torsade de pointes ventricular tachycardia, but it lacks the characteristic ‘writhing’ of the QRS complexes that is associated with this arrhythmia.
ATRIAL TACHYCARDIA
Re-entry within the atrial muscle causes a tachycardia characterized by P waves with a shape different from that of those related to sinus rhythm. The PR interval is usually short ( Fig. 3.9). Atrial tachycardia can also result from enhanced automaticity.
ATRIAL FLUTTER
Atrial flutter is an organized atrial rhythm with a rate of 250-350/min. This rhythm depends on a variety of re-entry circuits, which often occupy large areas of the atrium and are known as ‘macro-re-entrant’ circuits. The most common type of flutter, ‘isthmus-dependent’ flutter, involves circuits utilizing the cavotricuspid isthmus. The involvement of a defined isthmus is important in considering ablation therapy (see p. 157).
AV NODAL RE-ENTRY TACHYCARDIA (AVNRT)
Atrioventricular nodal re-entry tachycardia (AVNRT), also known as atrioventricular nodal reciprocating tachycardia, originates in the AV node or His bundle. It may be facilitated by a congenital abnormality of the AV node, in which there are two (or sometimes more) electrically distinct pathways. These allow re-entry to start and be sustained within the node itself. In the absence of a tachycardia, the ECG has no distinguishing features, so the potential for an AVNRT cannot be detected from the ECG, unlike in cases of the WPW and LGL syndromes. During AVNRT, atrial and ventricular activation are virtually simultaneous, so the P wave is hidden within the QRS complex ( Fig. 3.10). AVNRT used to be called ‘junctional tachycardia’.
VENTRICULAR TACHYCARDIA
Ventricular tachycardia may be due to re-entry through circuits within the ventricles (for example around areas of scar tissue following myocardial infarction), or may result from enhanced automaticity or triggered activity. The broad QRS complexes are of a constant configuration and are fairly regular if the re-entry pathway is constant ( Fig. 3.11).
DIFFERENTIATION BETWEEN RE-ENTRY AND ENHANCED AUTOMATICITY
Except in the case of the pre-excitation syndromes, there is no certain way of distinguishing from the surface ECG between a tachycardia due to enhanced automaticity and one due to re-entry. In general, however, tachycardias that follow or are terminated by extrasystoles, and those that can be initiated or inhibited by appropriately timed intracardiac pacing impulses, are likely to be due to re-entry ( Figs 3.12 and 3.13).
TACHYCARDIAS WITH SYMPTOMS
SINUS RHYTHM CAUSING SYMPTOMS
Sinus rhythm can be irregular (sinus arrhythmia) but the patient is never aware of this. The ECG of a patient with sinus arrhythmia ( Fig. 3.14) may suggest atrial extrasystoles – but in sinus rhythm, P wave morphology is constant while with atrial extrasystoles it varies.
Patients often complain of palpitations that are due to sinus tachycardia: the main causes are exercise, anxiety, thyrotoxicosis and the treatment of asthma with beta-adrenergic agonists, and other causes are summarized in Box 1.1 (p. 3). The ECG in Figure 3.15 shows sinus tachycardia due to an unusual cause – the habitual drinking of large quantities of cola.
When sinus tachycardia results from anxiety, heart rates of up to 150/min are possible and the rhythm may be mistaken for an atrial tachycardia. Pressure on the carotid sinus will cause transient slowing of the heart rate and the P waves will become more obvious (see Fig. 3.53, p. 153).
EXTRASYSTOLES CAUSING SYMPTOMS
An ECG is necessary to differentiate between supraventricular and ventricular extrasystoles.
When extrasystoles have a supraventricular origin ( Fig. 3.16), the QRS complex is narrow and both it and the T wave have the same configuration as in the sinus beat. Atrial extrasystoles have abnormal P waves. Junctional (AV nodal) extrasystoles either have a P wave very close to the QRS complex (in front of it or behind it) or have no visible P waves.
Fig. 3.16 Supraventricular extrasystoles
Note
First beat: normal; second beat: atrial extrasystole, with abnormal P wave; third beat: AV nodal (junctional) extrasystole, with no P wave
Ventricular extrasystoles produce wide QRS complexes of abnormal shape, and the T wave is also usually abnormal. No P waves are present ( Fig. 3.17).
When a ventricular extrasystole appears on the upstroke of the preceding beat, the ‘R on T’ phenomenon is said to be present ( Fig. 3.18). This can initiate ventricular fibrillation, but usually it does not do so.
NARROW COMPLEX TACHYCARDIAS CAUSING SYMPTOMS
A tachycardia can be described as ‘narrow complex’ if the QRS complex is of normal duration, i.e. < 120 ms. Although sinus, atrial and junctional arrhythmias are all supraventricular, the term ‘supraventricular tachycardia’ is often inappropriately used interchangeably with junctional or atrioventricular nodal re-entry tachycardia (AVNRT). All these supraventricular rhythms have QRS complexes of normal shape and width, and the T waves have the same shape as in the sinus beat.
Types of narrow complex tachycardias are listed in Box 3.1.
ATRIAL TACHYCARDIA
In atrial tachycardia ( Fig. 3.19), P waves are present but they have an abnormal shape. They are sometimes hidden in the T wave of the preceding beat.
ATRIAL FLUTTER
In atrial flutter, the atrial rate is 300/min and the P waves form a continuous ‘sawtooth’ pattern. As the AV node usually fails to conduct all the P waves, the relationship between P waves and QRS complexes is usually 2 : 1, 3 : 1 or 4 : 1. Figure 3.20 shows atrial flutter with 2 : 1 block, giving a ventricular rate of 150/min. The ECG in Figure 3.21 is from the same patient after reversion to sinus rhythm.
The ECG in Figure 3.22 shows atrial flutter with 4 : 1 block.
The ECG in Figure 3.23 shows a narrow complex (and therefore supraventricular) rhythm with a rate of 300/min. This is almost certainly atrial flutter with 1 : 1 conduction.
If the ventricular rate is rapid and P waves cannot be seen, carotid sinus pressure will usually increase the block in the AV node and make the ‘sawtooth’ more obvious (see Fig. 3.54, p. 153).
ATRIOVENTRICULAR NODAL RE-ENTRY TACHYCARDIA (AVNRT) OR ‘JUNCTIONAL’ TACHYCARDIA
In AVNRT, no P waves can be seen ( Fig. 3.10, p. 110). Carotid sinus pressure either reverts the heart to sinus rhythm or has no effect (see Fig. 3.55, p. 153).
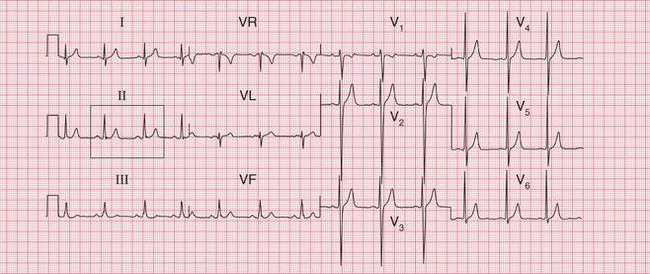
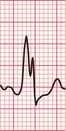
The ECG in Figure 3.24 shows a narrow complex tachycardia at 150/min, without any obvious P waves. After reversion to sinus rhythm ( Fig. 3.25), the shape of the QRS complexes does not change.
Fig 3.24 Atrioventricular nodal re-entry tachycardia (AVNRT)
Note
Fig 3.25 Sinus rhythm following cardioversion
Note
• Same patient as in Figure 3.24
[/not-level-membership-for-cardiovascular-category]
