2
The ECG in Patients with Palpitations and Syncope
Between Attacks
THE CLINICAL HISTORY AND PHYSICAL EXAMINATION
PALPITATIONS
‘Palpitations’ mean different things to different patients, but a general definition would be ‘an awareness of the heartbeat’. Arrhythmias, fast or slow, can cause poor organ perfusion and so lead to syncope (a word used to describe all sorts of collapse), breathlessness and angina. Some rhythms can be identified from a patient’s description, such as:
• A patient recognizes sinus tachycardia because it feels like the palpitations that he or she associates with anxiety or exercise.
• Extrasystoles are described as the heart ‘jumping’ or ‘missing a beat’. It is not possible to distinguish between supraventricular and ventricular extrasystoles from a patient’s description, although they can be differentiated from an ECG.
• A paroxysmal tachycardia begins suddenly and sometimes stops suddenly. The heart rate is often ‘too fast to count’. Severe attacks are associated with dizziness, breathlessness and chest pain.
Table 2.1 compares the symptoms associated with sinus tachycardia and a paroxysmal tachycardia, and shows how a diagnosis can be made from the history. Note that a heart rate between 140/min and 160/min may be associated with either sinus or paroxysmal tachycardia.
Table 2.1
Diagnosis of sinus tachycardia or paroxysmal tachycardia from a patient’s symptoms
| Symptoms | Sinus tachycardia | Paroxysmal tachycardia |
| Timing of initial attack | Attacks probably began recently | Attacks probably began in teens or early adult life |
| Associations of attack | Exercise, anxiety | Usually no associations, but occasionally exercise-induced |
| Rate of start of palpitations | Slow build-up | Sudden onset |
| Rate of end of palpitations | ’Die away’ | Classically sudden, but often ‘die away’ |
| Heart rate | < 140/min | > 160/min |
| Associated symptoms | Paraesthesia due to hyperventilation | Chest pain Breathlessness Dizziness Syncope |
| Ways of terminating attacks | Relaxation | Breath holding Valsalva’s manoeuvre |
DIZZINESS AND SYNCOPE
These symptoms may have a cardiovascular or a neurological cause. Remember that cerebral hypoxia, however caused, may lead to a seizure, and that can make the differentiation between cardiac and neurological syncope very difficult. Syncope is defined as ‘a transient loss of consciousness characterized by unresponsiveness and loss of postural tone, with spontaneous recovery and not requiring specific resuscitative intervention’.
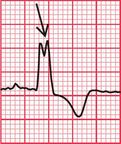
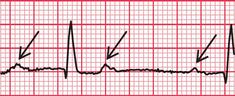
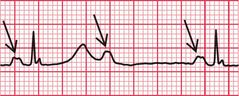
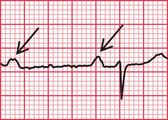
Figure 2.1 shows an EEG that was being recorded in a 46-year-old woman with episodes of limb shaking, suspected of being generalized tonic-clonic seizures. She lost awareness during events, and had violent limb shaking for several seconds as she came round. She felt nauseated, but was rapidly reorientated. By chance, she had one of her ‘attacks’ while her EEG was being recorded, and from the ECG being routinely recorded in parallel, it became clear that the problem was not seizures, but periods of asystole – in this case lasting about 15 s. The numbered arrows in Figure 2.1 mark significant features. The recording begins with a routine period of hyperventilation, with the EEG showing an eye blink in the anterior leads and the ECG showing sinus rhythm. There are then (at arrow 1 on the record) one (or possibly two) ventricular extrasystoles, followed by a narrow complex beat (probably sinus) and another ventricular extrasystole, with a different configuration from the previous ones. Asystole follows, and after 7–8 s (at arrow 2) there is global EEG slowing, and the patient became unresponsive. After 4 s (at arrow 3), there is global attenuation (reduction in signals) in the EEG and after another 3 s, there is an escape beat whose morphology suggests a ventricular origin. This is followed by a beat with a narrow QRS complex and possibly an inverted T wave, and then there is gross artefact due to the ECG lead being checked. During that period, sinus rhythm was restored. There was then (at arrow 4) global EEG slowing for 5 s, followed by (at arrow 5) violent limb thrashing for about 12 s as the patient regained consciousness – these movements were not clonic, and were thought to represent anxiety or fear. Normal EEG and ECG activity were then resumed (at arrow 6).
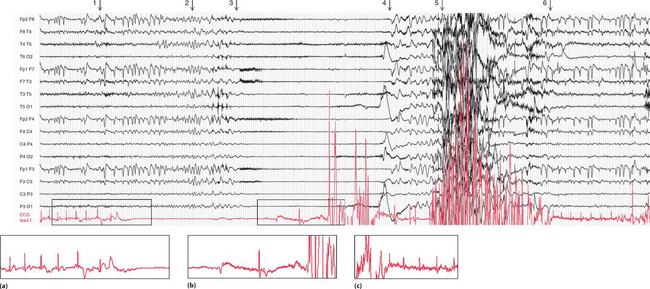
Fig. 2.1 EEG recorded during a syncopal attack
Note
•EEG and ECG lead I (lower trace)
• Paper speed five times normal ECG speed
• (b) Asystole followed by an escape beat, a narrow complex beat, and gross artefact
• (c) Sinus rhythm restored, with a period of limb thrashing before resumption of a normal record
Courtesy of Dr A. Michell, Addenbrooke’s Hospital, Cambridge
Some causes of syncope are summarized in Box 2.1.
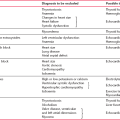
Table 2.2 shows some clinical features of syncope, and possible causes.
Table 2.2
Diagnosis of causes of syncope
| Symptoms and signs | Possible diagnosis |
| Family history of sudden death | Long QT syndrome, Brugada syndrome, hypertrophic cardiomyopathy |
| Caused by unpleasant stimuli, prolonged standing, hot places (situational syncope) | Vasovagal syncope |
| Occurs within seconds or minutes of standing | Orthostatic hypotension |
| Temporal relation to medication | Orthostatic hypotension |
| Occurs during exertion | Obstruction to blood flow (e.g. aortic stenosis, pulmonary hypertension) |
| Occurs with head rotation or pressure on neck | Carotid sinus hypersensitivity |
| Confusion for more than 5 min afterwards | Seizure |
| Tonic-clonic movements, automatism | Seizure |
| Frequent attacks, usually unobserved, with somatic symptoms | Psychiatric illness |
| Symptoms or signs suggesting cardiac disease | Cardiac disease |
PHYSICAL EXAMINATION
If the patient has no symptoms at the time of the examination, look for:
THE ECG
Even when the patient is asymptomatic, the resting ECG can be very helpful, as summarized in Table 2.3.
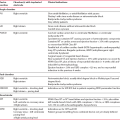
Table 2.3
ECG features between attacks of palpitations or syncope
| ECG appearance | Possible cause of symptoms |
| ECG completely normal | Symptoms may not be due to a primary arrhythmia – consider anxiety, epilepsy, atrial myxoma or carotid sinus hypersensitivity |
| ECGs that suggest cardiac disease | Left ventricular hypertrophy or left bundle branch block – aortic stenosis Right ventricular hypertrophy – pulmonary hypertension Anterior T wave inversion – hypertrophic cardiomyopathy |
| ECGs that suggest intermittent tachyarrhythmia | Left atrial hypertrophy – mitral stenosis, so possibly atrial fibrillation Pre-excitation syndromes Long QT syndrome Flat T waves suggest hypokalaemia Digoxin effect – ?digoxin toxicity |
| ECGs that suggest intermittent bradyarrhythmia | Second degree block First degree block plus bundle branch block Digoxin effect |
SYNCOPE DUE TO CARDIAC DISEASE OTHER THAN ARRHYTHMIAS
The ECG may indicate that syncopal attacks have a cardiovascular cause other than an arrhythmia.
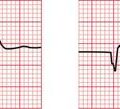
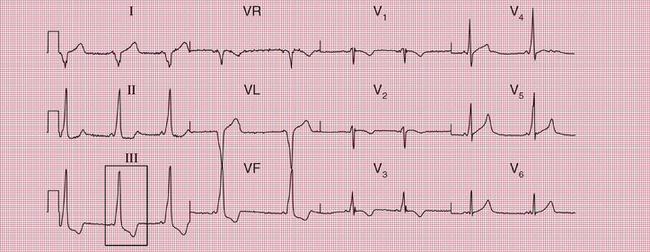
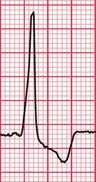
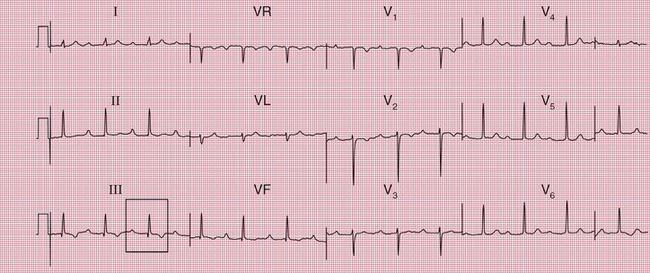
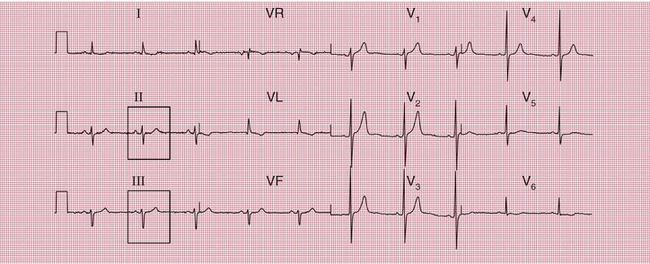
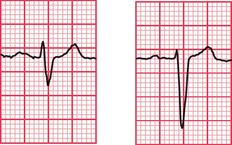
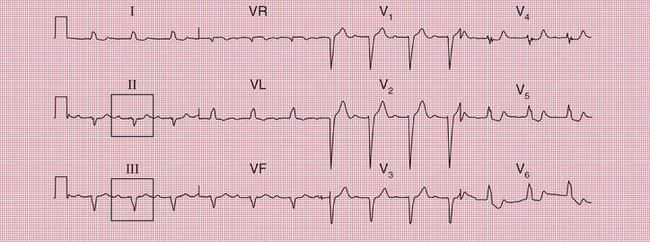
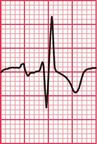
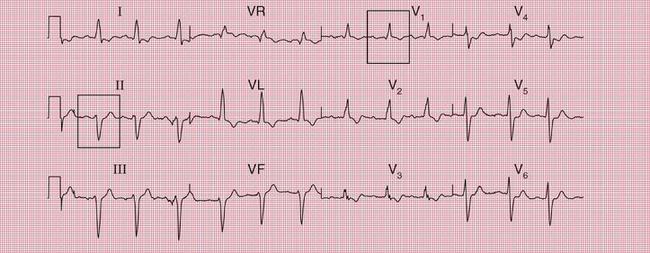
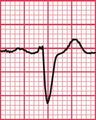
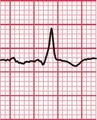
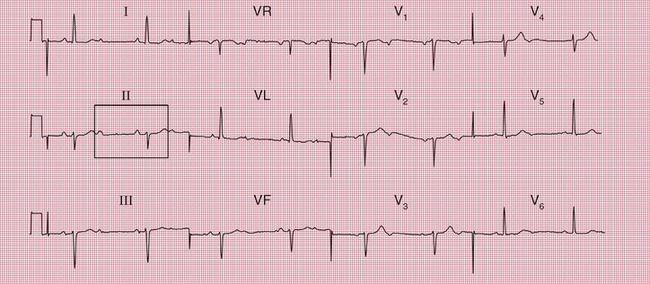
ECG evidence of left ventricular hypertrophy or of left bundle branch block may suggest that syncope is due to aortic stenosis. The ECGs in Figures 2.2 and 2.3 were recorded from patients who had syncopal attacks on exercise due to severe aortic stenosis.
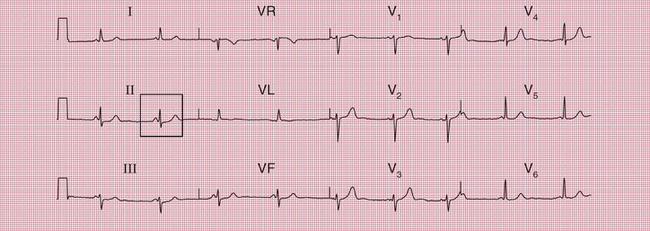
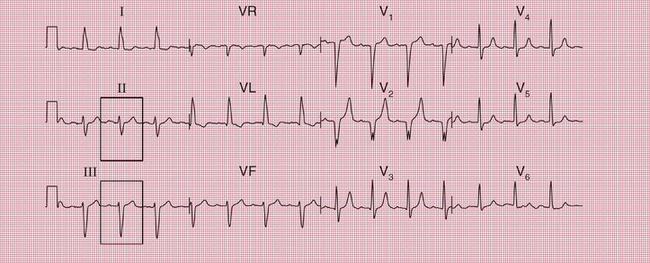
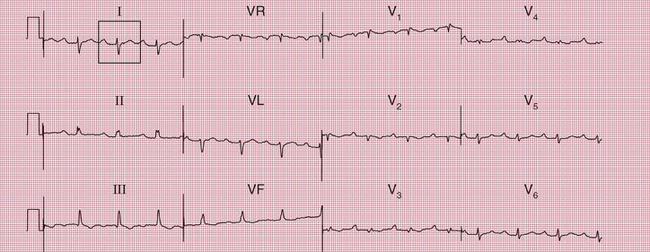
ECG evidence of right ventricular hypertrophy suggests thromboembolic pulmonary hypertension. The ECG in Figure 2.4 is that of a middle-aged woman with dizziness on exertion, due to multiple pulmonary emboli.
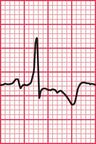
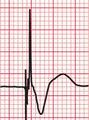
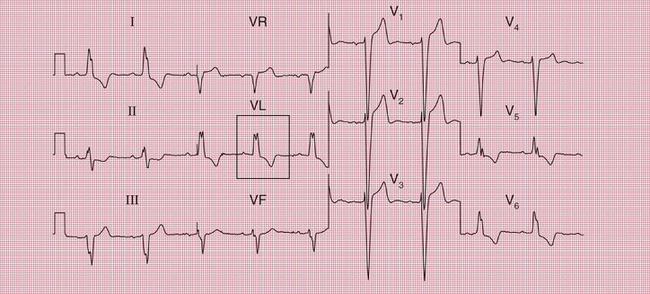
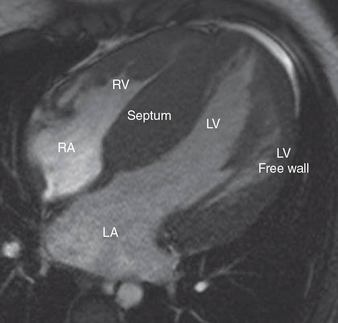
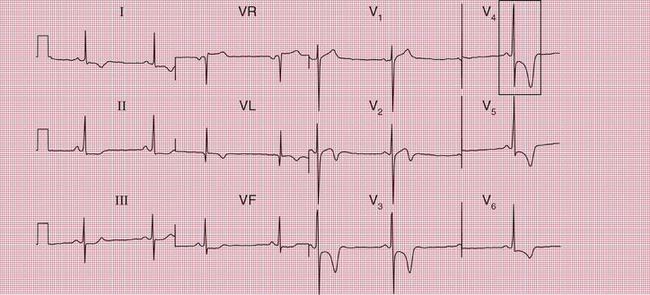
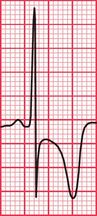
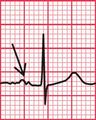
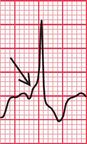
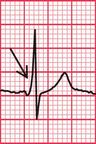
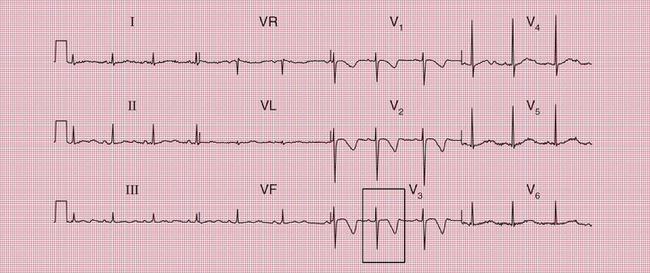
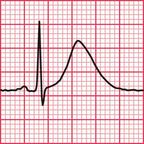
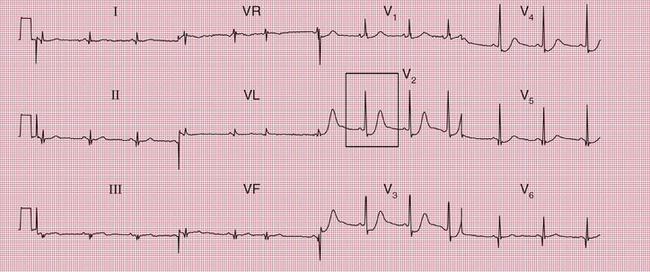
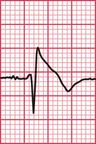
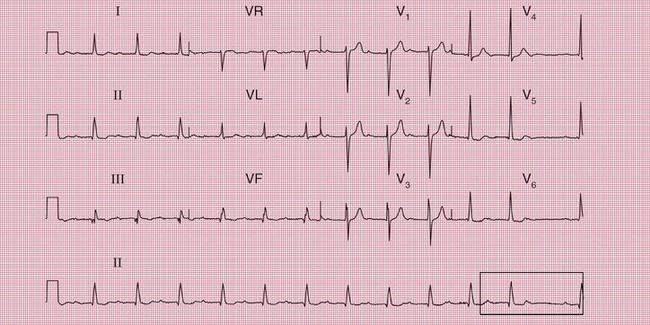
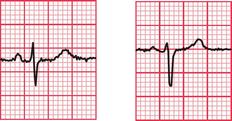
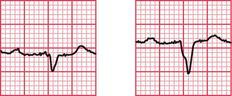
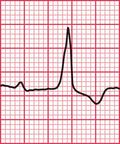
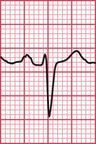
Syncope due to hypertrophic cardiomyopathy ( Fig. 2.5) may be associated with a characteristic ECG ( Fig. 2.6) that resembles that of patients with an anterior non-ST segment elevation myocardial infarction (NSTEMI) (compare with Fig. 5.23, p. 240). With hypertrophic cardiomyopathy, the T wave inversion is usually more pronounced than with an NSTEMI, but differentiation really depends on the clinical picture, not on the ECG appearance. Hypertrophic cardiomyopathy can cause syncope due to obstruction to outflow from the left ventricle, or can cause symptomatic arrhythmias.
PATIENTS WITH POSSIBLE TACHYCARDIAS
MITRAL STENOSIS
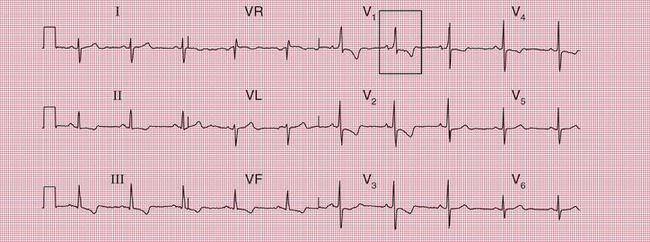
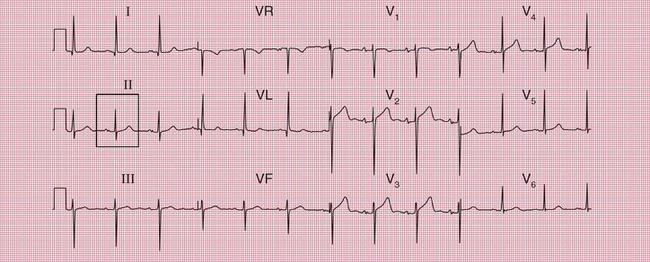
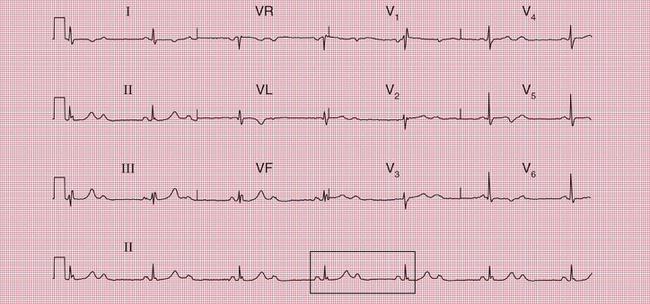
Mitral stenosis leads to atrial fibrillation, but when the heart is still in sinus rhythm the presence of the characteristics of left atrial hypertrophy on the ECG may give a clue that paroxysmal atrial fibrillation is occurring ( Fig. 2.7).
PRE-EXCITATION SYNDROMES
Normal conduction between the atria and ventricles involves the uniform spread of the depolarization wave front in a constant direction, down the bundle of His. In the pre-excitation syndromes, an abnormal additional pathway, or multiple pathways, connect the atria and ventricles. These accessory pathways bypass the AV node, where normal conduction is delayed, and therefore conduct more rapidly than the normal pathway. The anatomical combination of the normal AV node-His bundle pathway and the accessory pathway creates a potential circuit around which excitation may spread, causing a ‘re-entry’ tachycardia ( Ch. 3, p. 105).
The Wolff-Parkinson-White Syndrome
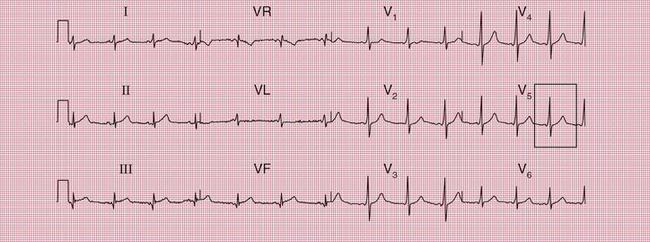
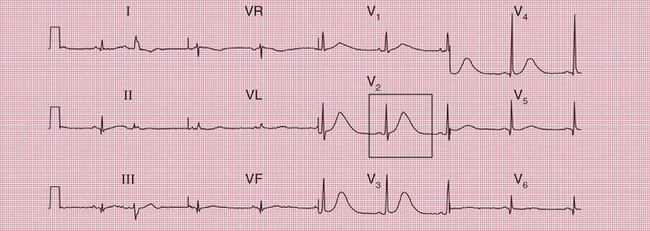
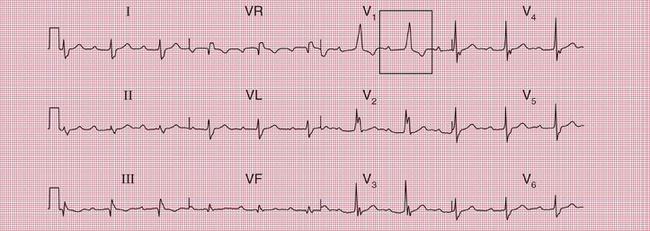
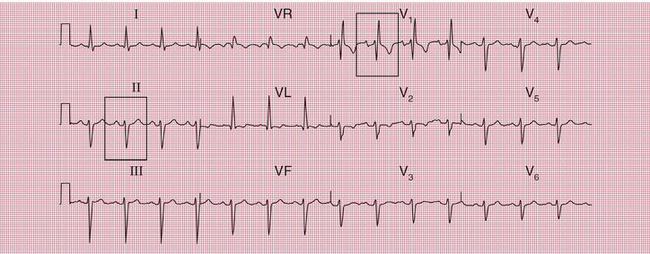
With a left-sided accessory pathway, the ECG shows a dominant R wave in lead V1. This is called the ‘type A’ pattern ( Fig. 2.8). This pattern can easily be mistaken for right ventricular hypertrophy, the differentiation being made by the presence or absence of a short PR interval.
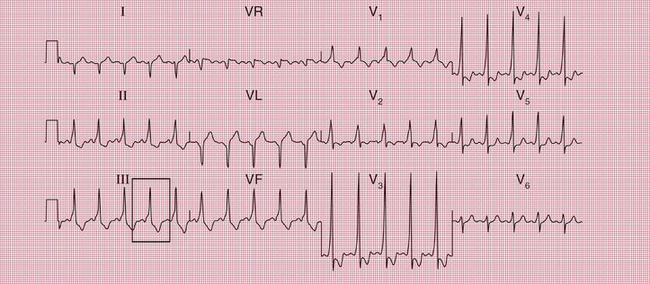
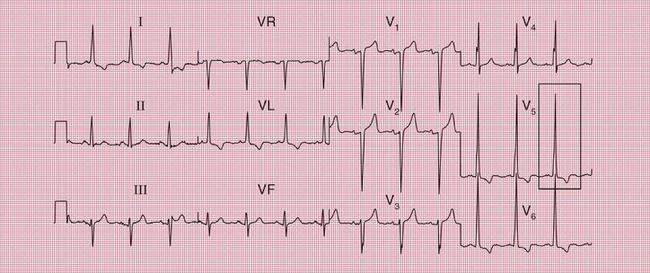
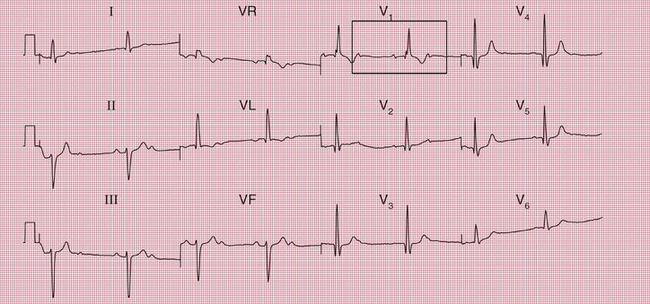
The ECG in Figure 2.9 is from a young man who complained of symptoms that sounded like paroxysmal tachycardia. His ECG shows the WPW syndrome type A, but it would be quite easy to miss the short PR interval unless the whole of the 12-lead trace were carefully inspected. The short PR interval and delta waves are most obvious in leads V4 and V5.
When the accessory pathway is on the right side of the heart, there is no dominant R wave in lead V1, and this is called the ‘type B’ pattern ( Fig. 2.10).
The ECG features associated with the WPW syndrome are summarized in Box 2.2.
The Lown-Ganong-Levine Syndrome
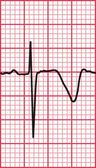
Where an accessory pathway connects the atria to the bundle of His rather than to the right or left ventricle, there will be a short PR interval but the QRS complex will be normal. This is called the Lown-Ganong-Levine (LGL) syndrome ( Fig. 2.11). This syndrome must be differentiated from accelerated idionodal rhythm, where the PR interval varies (see p. 49 and Fig. 1.45).

THE LONG QT SYNDROME
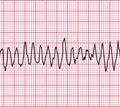
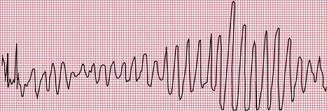
Delayed repolarization occurs for a variety of reasons ( Box 2.3), and causes a long QT interval. A prolonged QT interval is associated with paroxysmal ventricular tachycardia, and therefore can be the cause of episodes of collapse or even sudden death. The ventricular tachycardia associated with a prolonged QT interval usually involves a continual change from upright to downward QRS complexes. This is called ‘torsade de pointes’ ( Fig. 2.12), and it usually occurs at times of increased sympathetic nervous system activity.
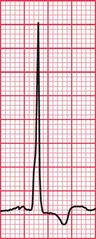
Several genetic abnormalities have been described that lead to familial prolongation of the QT interval. The ECG in Figure 2.13 is from a 10-year-old girl who suffered from ‘fainting’ attacks. Her sister had died suddenly; three other siblings and both parents had normal ECGs.
The most common cause of QT prolongation is drug therapy. The ECG in Figure 2.14 is from a patient who had a posterior myocardial infarction (see Ch. 5). He was treated with amiodarone because of recurrent ventricular tachycardias, and developed a prolonged QT interval. Figure 2.15 shows his record 4 months later: the prolonged QT interval reverted to normal when the amiodarone treatment was stopped.
THE BRUGADA SYNDROME
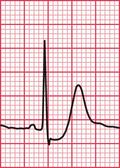
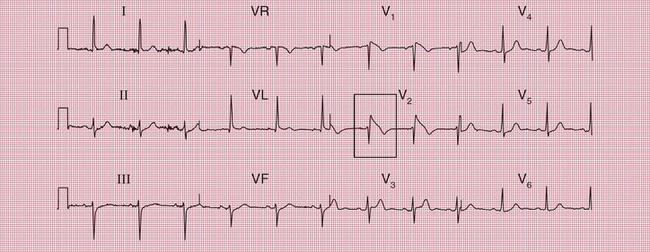
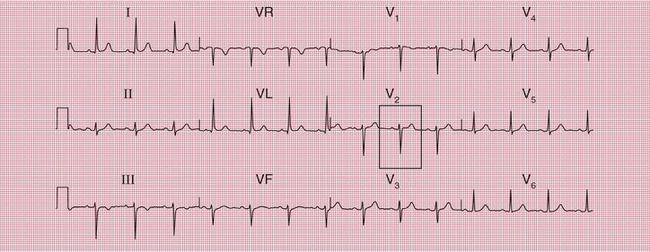
Sudden collapse due to ventricular tachycardia and fibrillation occurs in a congenital disorder of sodium ion transport called the Brugada syndrome. Between attacks, the ECG superficially resembles that associated with right bundle branch block (RBBB), with an RSR1 pattern in leads V1 and V2 ( Fig. 2.16). However, the ST segment in these leads is raised, and there is no wide S wave in lead V6 as there is in RBBB. The changes are seen in the right ventricular leads because the abnormal sodium channels are predominantly found in the right ventricle. The ECG abnormality can be transient – the ECG in Figure 2.17 was taken a day later from the same patient as in Figure 2.16.
PATIENTS WITH POSSIBLE BRADYCARDIAS
When a patient is asymptomatic, an intermittent brady- cardia can be suspected if the ECG shows any evidence of an escape rhythm or a conduction defect. However, it must be remembered that conduction defects and escape rhythms are quite common in healthy people, and their presence may be coincidental.
ESCAPE RHYTHMS
The automaticity of any part of the heart is suppressed by the arrival of a depolarization wave, and so the heart rate is controlled by the region with the highest automatic depolarization frequency. Normally the SA node controls the heart rate because it has thehighest frequency of discharge, but if for any reason this fails, the region with the next highest intrinsic depolarization frequency will emerge as the pacemaker and set up an ‘escape’ rhythm. The atria and the junctional region have automatic depolarization frequencies of about 50/min, compared with the normal SA node frequency of 60-70/min. If both the SA node and the junctional region fail to depolarize, or if conduction to the ventricles fails, a ventricular focus may emerge, with a rate of 30-40/min; this is classically seen in complete heart block.
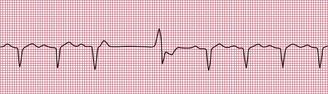
Escape beats may be single or may form sustained rhythms. They have the same ECG appearance as the corresponding extrasystoles, but appear late rather than early ( Fig. 2.18).
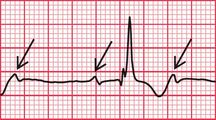
In sustained junctional escape rhythms, atrial activation may be seen as a P wave following the QRS complex ( Fig. 2.19). This occurs if depolarization spreads in the opposite direction from normal, from the AV node to the atria, and is called ‘retrograde’ conduction. Figure 2.20 also shows a junctional escape rhythm.
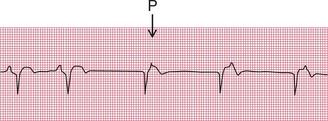
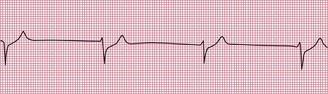
Figure 2.21 shows a ventricular escape beat.
SYNCOPE
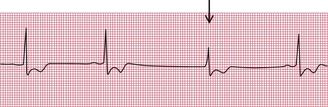
In a patient with syncopal attacks, ECG changes that would be ignored in a healthy person take on a greater significance. First degree block, itself of no clinical importance, may point to intermittent complete block, and complete block is much more likely when the ECG of a currently asymptomatic patient shows second degree block. The ECGs in Figures 2.22, 2.23 and 2.24 are from patients with syncopal attacks, all of whom needed permanent pacemakers.
Left axis deviation usually indicates left anterior hemiblock, but a minor degree of left axis deviation with a narrow QRS complex can be accepted as a normal variant ( Fig. 2.25). A QRS complex near the upper limit of the normal width with marked left axis deviation represents the full pattern of left anterior hemiblock ( Fig. 2.26).
Combinations Of Conduction Abnormalities
ECG evidence of atrioventricular conduction abnormalities will not be associated with syncope unless there is intermittent second or third degree heart block with a bradycardia. It is, however, important to recognize the clinically less common conduction defects because they may be pointers to the cause of syncopal attacks.
When first degree block is associated with left bundle branch block ( Fig. 2.27), conduction must be delayed in either the AV node, the His bundle or the right bundle branch as well as in the left bundle branch. The combination of first degree block and right bundle branch block (RBBB) ( Fig. 2.28) shows that conduction has failed in the right bundle branch and is also beginning to fail elsewhere.
A combination of left anterior hemiblock and RBBB means that conduction into the ventricles is only passing through the posterior fascicle of the left bundle branch ( Fig. 2.29). This is called ‘bifascicular block’.
A combination of left anterior hemiblock, RBBB and first degree block suggests that there is disease in the remaining conducting pathway – either in the main His bundle or in the posterior fascicle of the left bundle branch. This is sometimes called ‘trifascicular block’ ( Fig. 2.30). Complete conduction block in the right bundle and in both fascicles of the left bundle would, of course, cause complete (third degree) heart block.
Right axis deviation is not necessarily a feature of left posterior hemiblock, but, when combined with other evidence of conducting tissue disease such as first degree block ( Fig. 2.31), it usually is.

A combination of second degree (2:1) block with left anterior hemiblock ( Fig. 2.32) or with both left anterior hemiblock and RBBB ( Fig. 2.33) suggests widespread conduction tissue disease.
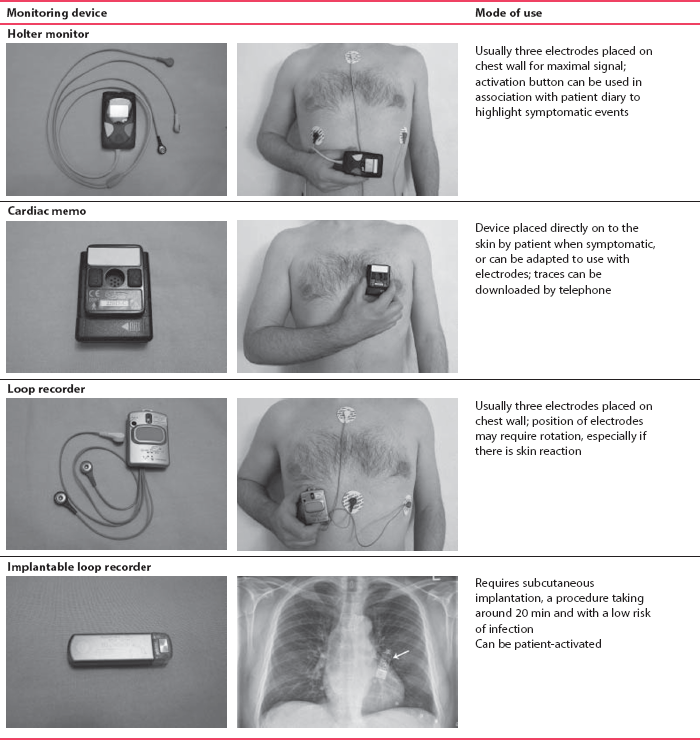
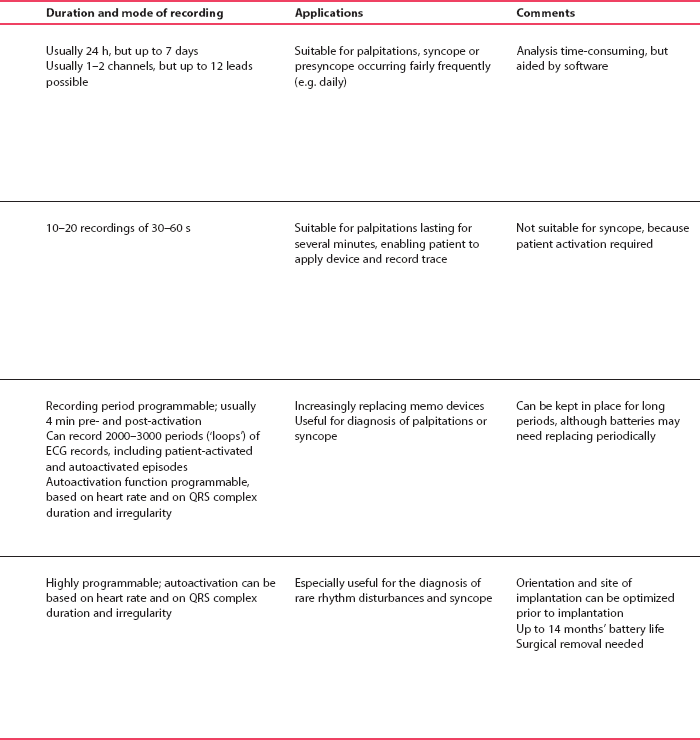
AMBULATORY ECG RECORDING
The only way to be certain that a patient’s symptoms are due to an arrhythmia is to show that an arrhythmia is present at the time of the symptoms. If symptoms occur frequently – say two or three times a week – a 24-h tape recording (called a ‘Holter’ record after its inventor) may show the abnormality. When symptoms are infrequent ‘event recorders’ are more useful, and these can either be patient-activated or programmed to detect rate or rhythm changes. Table 2.4 shows examples of these devices, and some of their advantages and disadvantages.
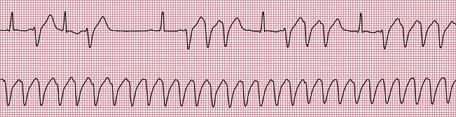
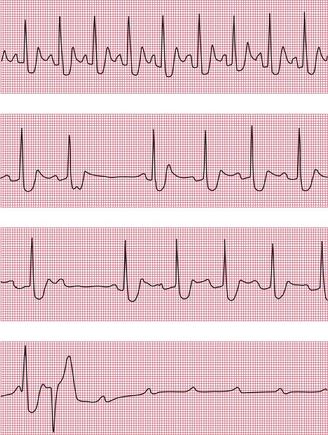
Figures 2.34, 2.35 and 2.36 show examples of ambulatory records obtained from patients who complained of syncopal attacks, but whose hearts were in sinus rhythm at the time they were first seen.
When an ambulatory record shows arrhythmias which are not accompanied by symptoms, it is difficult to be certain of their significance. When 24-h recordings are made from healthy volunteers, extrasystoles are found in about two-thirds of them, and a few will even show the R on T phenomenon. Episodes of supraventricular tachycardia are seen in about 3% of apparently healthy subjects, and ventricular tachycardia in about 1%.