5
The ECG in Patients with Chest Pain
The ECG in the presence of chest pain
The ECG in patients with myocardial ischaemia
ECG changes in ST segment elevation myocardial infarction (STEMI)
ECG changes in non-ST segment elevation myocardial infarction (NSTEMI)
Ischaemia without myocardial infarction
The ECG in other causes of chest pain
Aortic stenosis and aortic dissection
ECG pitfalls in the diagnosis of chest pain
Acute chest pain suggesting myocardial infarction
Other investigations for patients with acute chest pain
HISTORY AND EXAMINATION
There are many causes of chest pain. All the non-cardiac conditions can mimic a myocardial infarction, and so the ECG can be extremely useful when making a diagnosis. However, the ECG is less important than the history and (to a lesser extent) the physical examination, because the ECG can be normal in the first few hours of a myocardial infarction.
Some causes of chest pain are listed in Box 5.1.
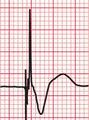
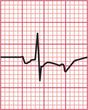
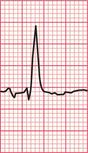
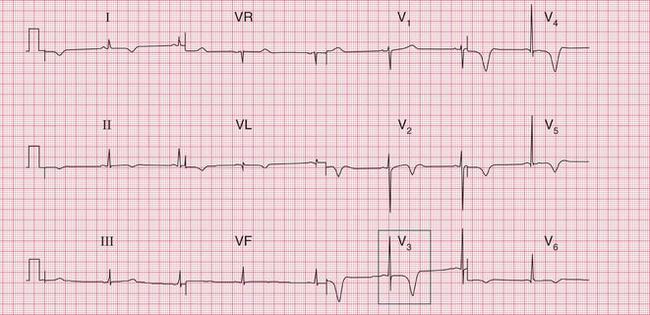
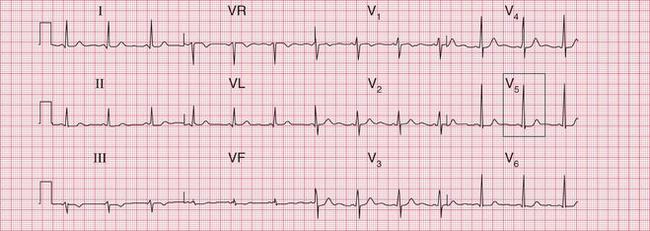
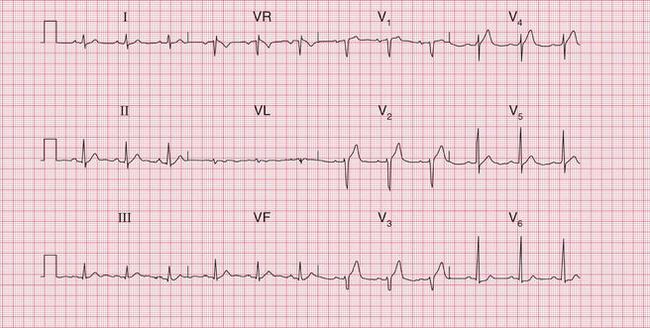
The ECG in Figure 5.1 was recorded in an A & E department from a 44-year-old man with rather vague chest pain. He was thought to have a viral illness and his ECG was considered to be within normal limits. He was allowed home, and died later that day. The post-mortem examination showed a myocardial infarction which was probably a few hours old, and corresponded with his A & E attendance.


ACUTE CHEST PAIN
The features of acute chest pain associated with different causes are summarized in Box 5.2.
• Left ventricular failure suggests myocardial infarction.
• A raised jugular venous pressure suggests myocardial infarction or pulmonary embolus.
• A pleural friction rub suggests pulmonary embolism or infection.
• A pericardial friction rub suggests pericarditis (Pviral, Psecondary to myocardial infarction) or aortic dissection.
• Aortic regurgitation suggests aortic dissection.
• Unequal pulses or blood pressure in the arms suggests aortic dissection.
CHRONIC CHEST PAIN
The main differential diagnosis of chronic chest pain is between angina and the chest pain that is common in middle-aged men, but for which no clear diagnosis is usually made. This pain is sometimes called ‘atypical chest pain’, but this is a dangerous diagnostic label because it implies that there is a diagnosis (by implication, cardiac ischaemia) but that the symptoms are ‘atypical’. Some of these pains are musculoskeletal, Tietze’s syndrome of pain from the costochondral junctions being the most obvious, but in most cases the best diagnostic label is ‘chest pain of unknown cause’. This indicates a possible need for later re-evaluation.
The important features in the history that point to a diagnosis of angina are that the pain:
• usually occurs after a constant amount of exercise
• is worse in cold or windy weather
• is induced by emotional stress
• is induced by sexual intercourse
• is relieved by rest, and rapidly relieved by a short-acting nitrate.
The physical signs to look for are:
• evidence of risk factors (high blood pressure, cholesterol deposits, signs of smoking)
• any signs of cardiac disease (aortic stenosis, an enlarged heart, signs of heart failure)
• anaemia (which will exacerbate myocardial ischaemia)
• signs of peripheral vascular disease (which would suggest that coronary disease is also present).
THE ECG IN THE PRESENCE OF CHEST PAIN
Remember that the ECG can be normal in the early stages of a myocardial infarction. Having said that:
• An abnormal ECG is usually necessary to make a diagnosis of myocardial infarction before treatment is started.
• An ECG will demonstrate ischaemia in patients with angina provided that the patient has pain at the time the ECG is recorded.
• With pulmonary embolism there may be classical ECG changes, but these are often not present.
• With pericarditis, ECG changes, if present at all, are very nonspecific.
THE ECG IN PATIENTS WITH MYOCARDIAL ISCHAEMIA
Myocardial infarction is, properly, a term describing myocardial cell death due to ischaemia. The histological changes – and ECG changes – can take several hours to appear, and the entire process leading to a healed infarction can take 5 or 6 weeks. Myocardial injury causes release into the blood of biomarkers such as troponin T or I and the MB fraction of creatine kinase, CK-MB. Therefore the release of these biomarkers can reflect the necrosis of myocardial cells, but it also occurs in situations other than coronary artery occlusion ( Box 5.3). Thus, although a rise in the blood levels of biomarkers supports the diagnosis of myocardial infarction it is not sufficient, and the most commonly used parts of the ‘universal definition’ of myocardial infarction, require both clinical evidence of myocardial ischaemia and a rise and/or fall of blood troponin levels. Box 5.4 shows the types of infarction listed in the universal definition, drawn up by the ESC/ACCF/AHA/WHF Task Force (Jaffe, A.S., Simoons, M.L., Chaitman, B.R. and White, H.D., on behalf of the Joint ESC/ACCF/AHA/WHF Task Force for the Universal Definition of Myocardial Infarction. European Heart Journal (2012) 33, 2551–2567). Box 5.5 lists the diagnostic criteria for each type of infarction.
• chest pain with ischaemic ST segment depression but no troponin rise (what used to be called ‘unstable angina’)
• chest pain with a troponin rise and T wave inversion or ST segment depression (non-ST segment elevation myocardial infarction, NSTEMI)
• chest pain with a troponin rise and ST segment elevation (ST segment elevation myocardial infarction, STEMI)
ECG CHANGES IN ST SEGMENT ELEVATION MYOCARDIAL INFARCTION (STEMI)
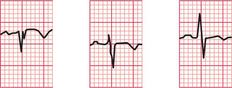
The sequence of features characteristic of STEMI is:
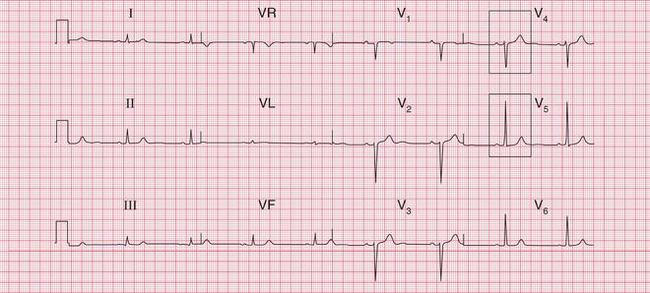
INFERIOR INFARCTION
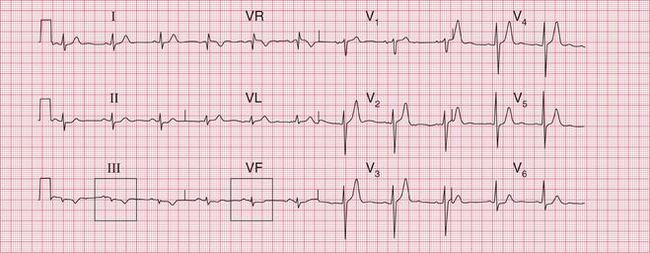
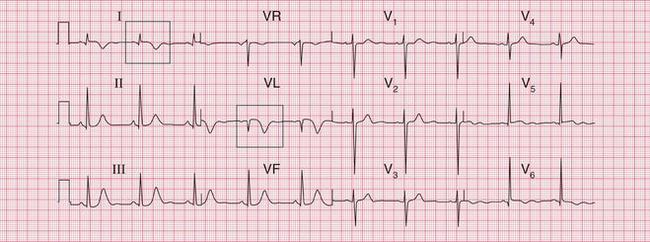
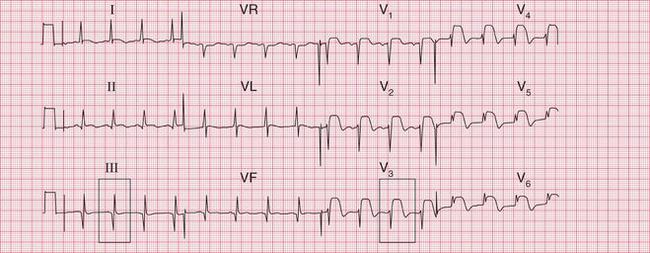
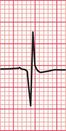
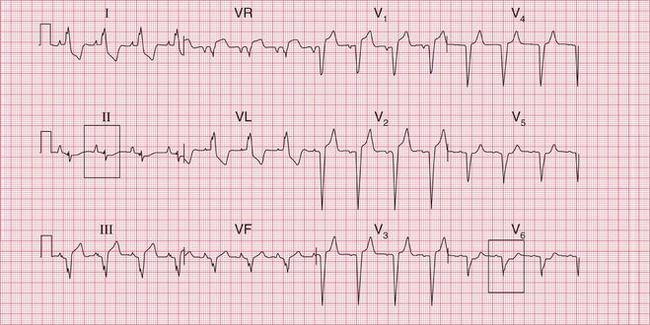
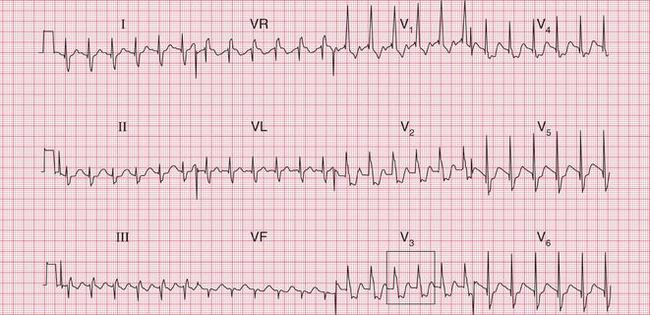
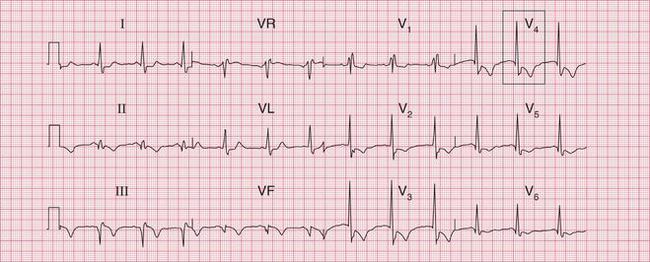
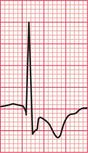
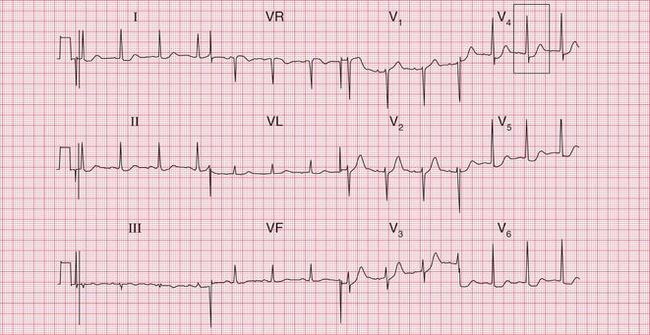
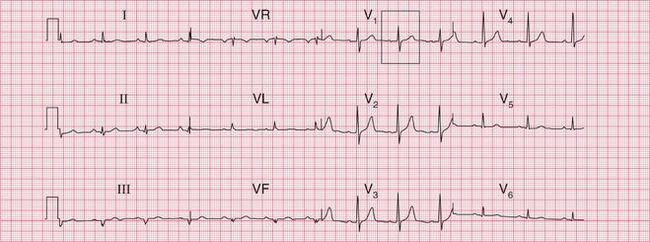
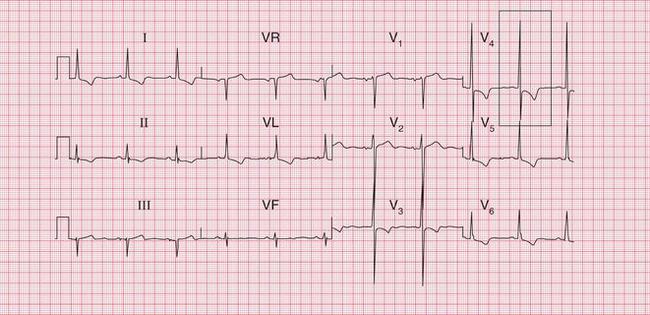
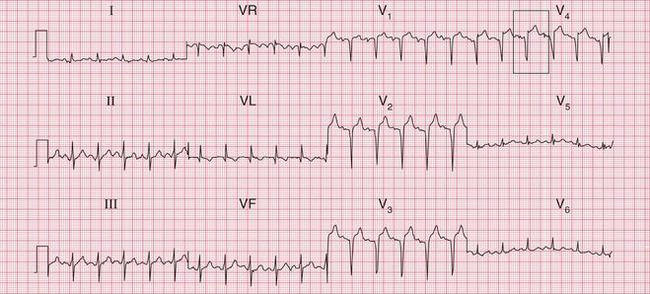
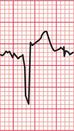
Figures 5.2, 5.3 and 5.4 show traces taken from a patient with a typical history of myocardial infarction: on admission to hospital, 3 h later, and 2 days later. The main changes are in the inferior leads: II, III and VF. Here the ST segments are initially raised, but then Q waves appear and the T waves become inverted. Figure 5.2 includes coronary angiograms showing the effects of an occluded right coronary artery in an inferior STEMI.
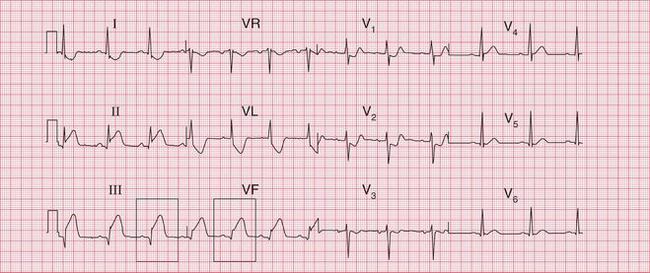
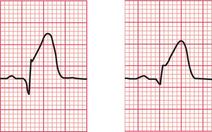
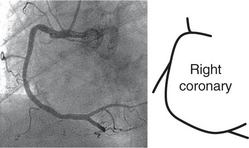
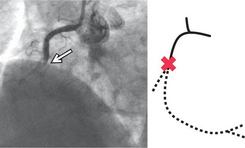
Fig. 5.2 Acute inferior infarction
Note
• Small Q waves in leads II–III, VF
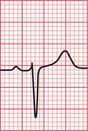
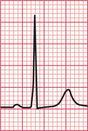
• Raised ST segments in leads II–III, VF
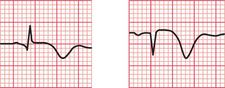
Raised ST segments in leads III and VF
Angiogram showing normal right coronary artery Angiogram showing occluded right coronary artery in inferior STEMI
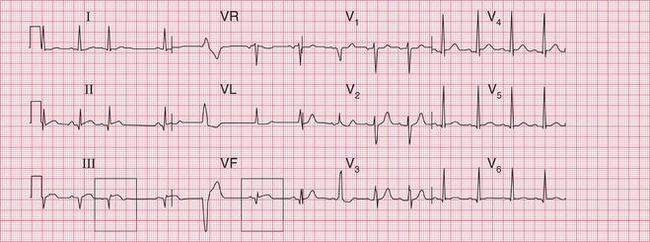
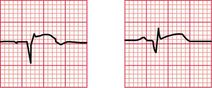
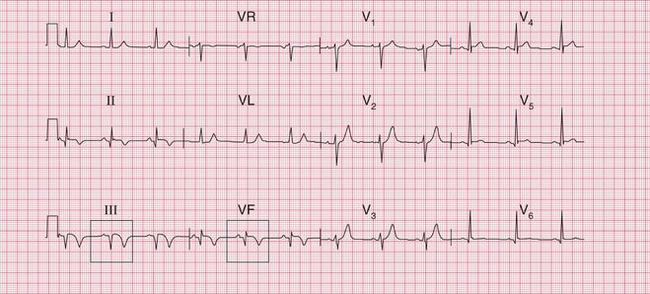
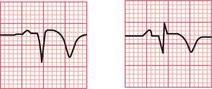
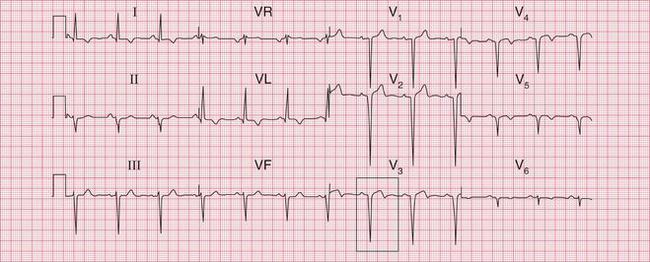
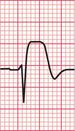
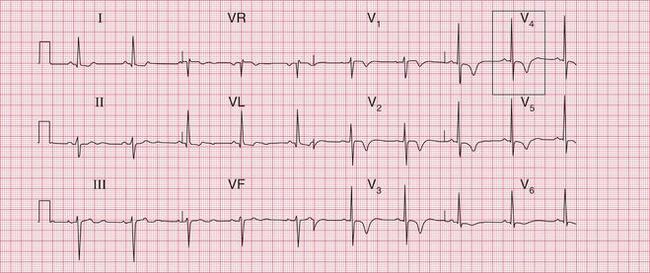
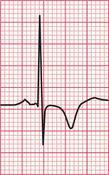
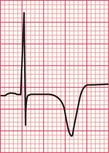
Fig. 5.4 Evolving inferior infarction
Note
• Same patient as in Figures 5.2 and 5.3
• ST segments nearly back to normal
• T wave inversion in leads II–III, VF
• Lateral ischaemia has cleared (as shown by ST segments in lateral leads)
Q waves, normal ST segments, and inverted T waves in leads III and VF
ANTERIOR AND LATERAL INFARCTION
The changes of anterior infarction are seen in leads V2-V5. Lead V1 which lies over the right ventricle, is seldom affected (see Fig. 5.5, which includes corresponding coronary angiograms).
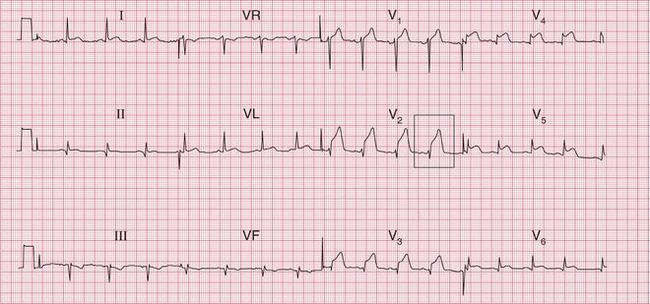
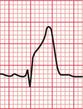
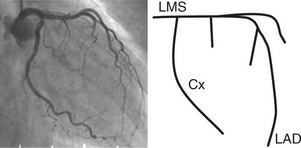
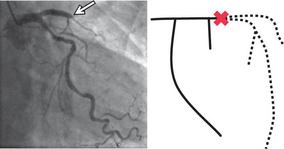
Fig. 5.5 Anterior infarction
Note
Angiogram showing normal left coronary artery:
LMS – left main stem coronary artery
Cx – circumflex branch
LAD – left anterior descending branch Angiogram showing occluded left anterior descending branch in anterior STEMI
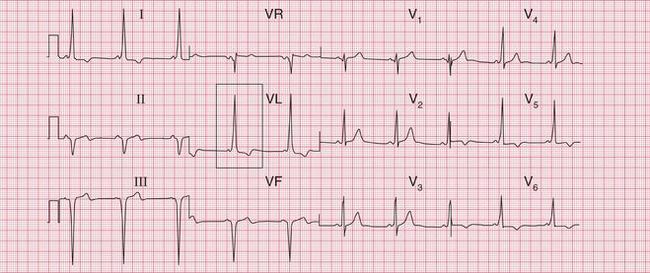
When the lateral wall of the left ventricle is damaged by occlusion of the left circumflex coronary artery, leads I, VL and V6 will show infarction changes. Figure 5.6 shows the record of a patient with an acute lateral STEMI, with the corresponding coronary angiograms. Figure 5.7 shows a record taken 3 days after a lateral infarction, with Q waves and inverted T waves in leads I, VL and V6.
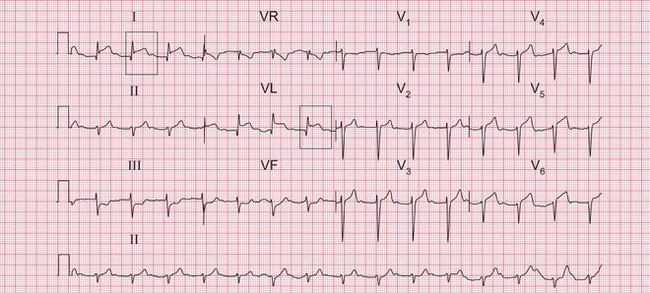
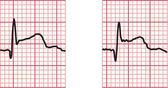
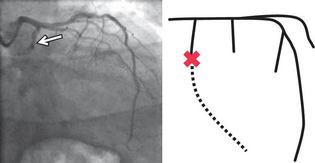
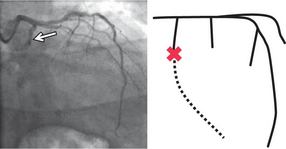
Fig. 5.6 Acute lateral infarction
Note
Raised ST segments in leads I and VL
Angiogram showing normal left coronary artery:
LMS – left main stem coronary artery
CX – circumflex branch
LAD – left anterior descending branch Angiogram showing occluded left circumflex branch in lateral STEMI
The ECG in Figure 5.8 shows an acute STEMI affecting both the anerior and lateral parts of the left ventricle.
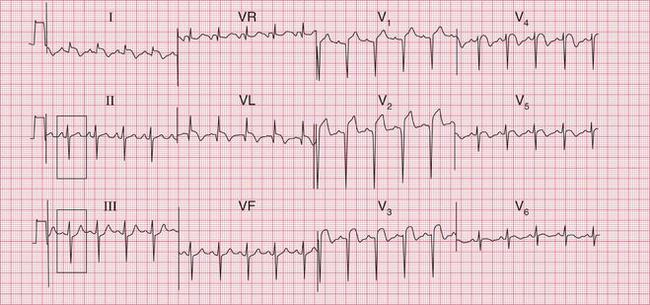
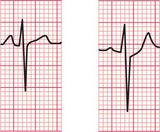
Fig. 5.8 Acute anterolateral infarction with left axis deviation
Note
The ECG in Figure 5.9 was recorded several weeks after an anterolateral myocardial infarction. Although the changes in leads I and VL appear ‘old’, having an isoelectric ST segment, there is still ST segment elevation in leads V3-V5. If the patient had just been admitted to hospital with chest pain these changes would be taken to indicate an acute infarction, but this patient had had pain more than a month previously. Persistent ST segment elevation is quite common after an anterior infarction: it sometimes indicates the development of a left ventricular aneurysm, but it is not reliable evidence of this.
An old anterior infarction often causes only what is called ‘poor R wave progression’. Figure 5.10 shows the record from a patient who had had an anterior infarction some years previously. A normal ECG would show a progressive increase in the size of the R wave from lead V1 to V5 or V6. In this case the R wave remains very small in leads V3 and V4, but becomes normal-sized in V5. This loss of ‘progression’ indicates the old infarction.
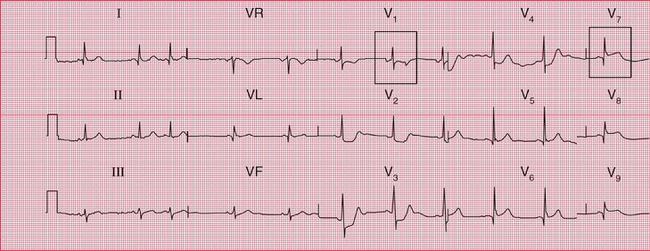
POSTERIOR INFARCTION
It is possible to ‘look at’ the back of the heart by placing the V lead on the back of the left side of the chest, but this is not done routinely because it is inconvenient and the complexes recorded are often small.
Figure 5.11 shows the first record from a patient with acute chest pain. There is a dominant R wave in lead V1 and ischaemic ST segment depression (see p. 231) in leads V2-V4. The chest electrodes were then moved to the V7-V9 positions: all in the same horizontal plane as V5, with V7 on the posterior axillary line, V9 at the edge of the spine, and V8 halfway between, on the midscapular line. The ECG record then showed raised ST segments, with Q waves typical of an acute infarction.
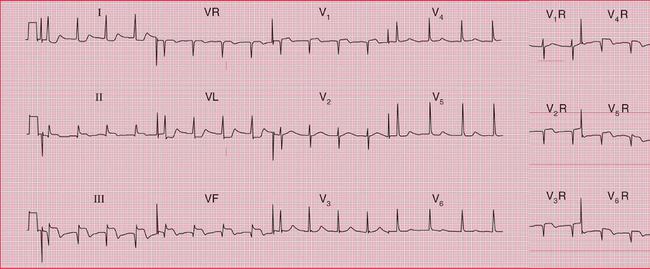
RIGHT VENTRICULAR INFARCTION
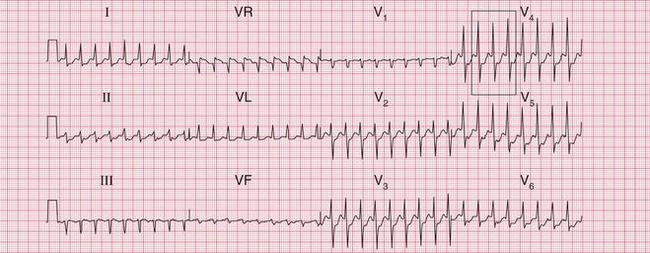
Inferior infarction is sometimes associated with infarction of the right ventricle. Clinically, this is suspected in a patient with an inferior infarction when the lungs are clear but the jugular venous pressure is elevated. The ECG will show raised ST segments in leads recorded from the right side of the heart. The positions of the leads correspond to those on the left side as follows: V1R is in the normal V2 position; V2R is in the normal Vi position; V3R etc. are on the right side, in positions corresponding to V3 etc. on the left side. Figure 5.12 is from a patient with an acute right ventricular infarct.
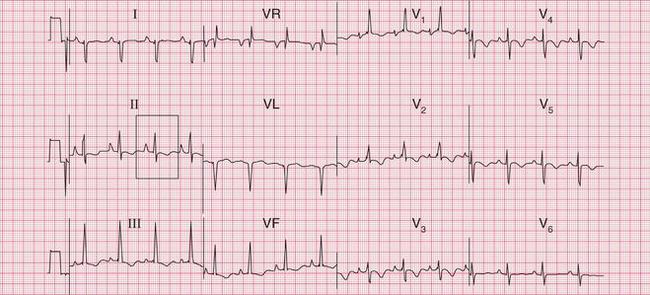
MULTIPLE INFARCTIONS
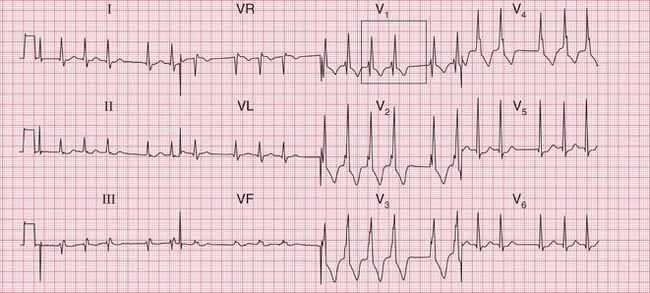
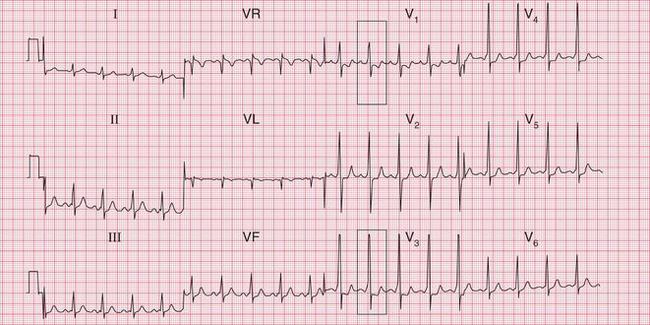
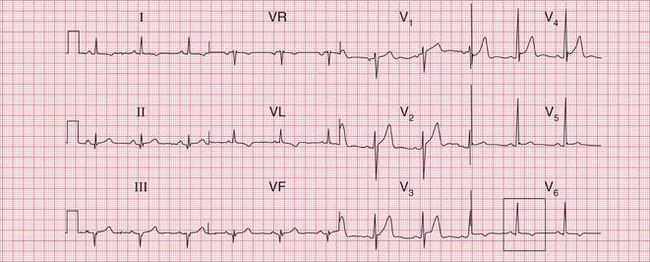
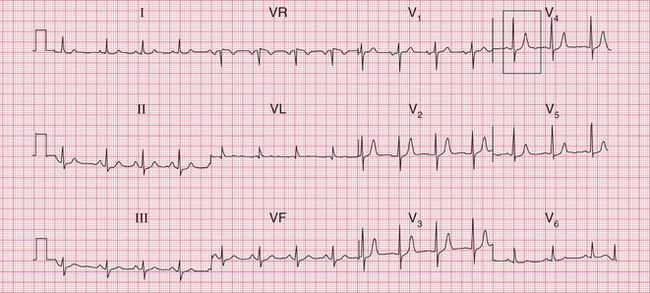
Infarction of more than one part of the left ventricle causes changes in several different ECG territories. This usually implies disease in more than one of the main coronary arteries. The ECG in Figure 5.13 shows an acute inferior myocardial infarction and marked anterior ST segment depression. Later, coronary angiography showed that this patient had a significant stenosis of the left main coronary artery.
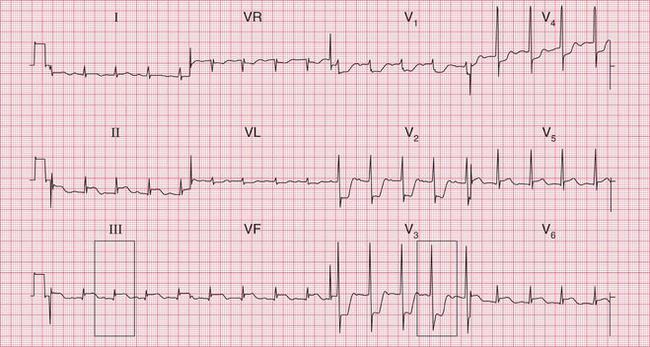
Fig. 5.13 Acute inferior infarction and anterior ischaemia
Note
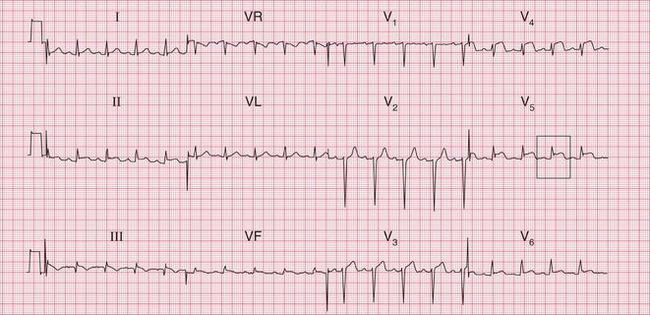
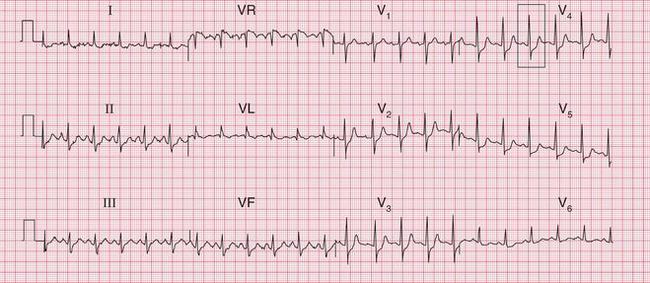
Fig. 5.14 is the record from a patient with an acute inferior myocardial infarction. Poor R wave progression in leads V2-V4 indicates an old anterior infarction as well.
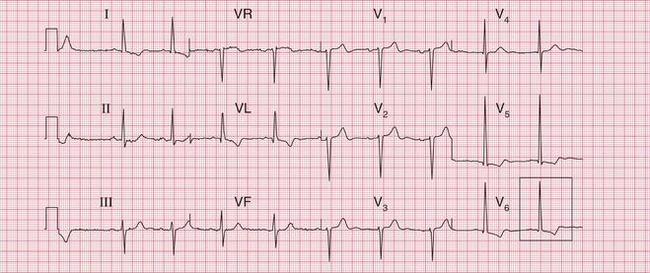
Figure 5.15 is an ECG showing an acute inferior STEMI and anterior T wave inversion due to an NSTEMI of uncertain age.
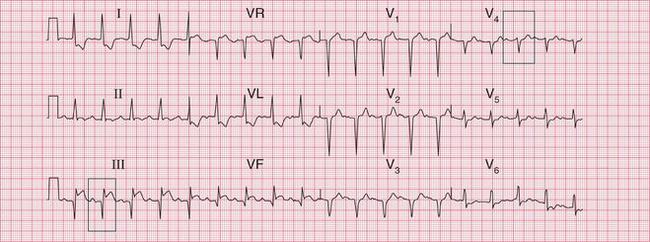
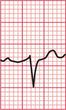
Fig. 5.14 Acute inferior and old anterior infarctions
Note
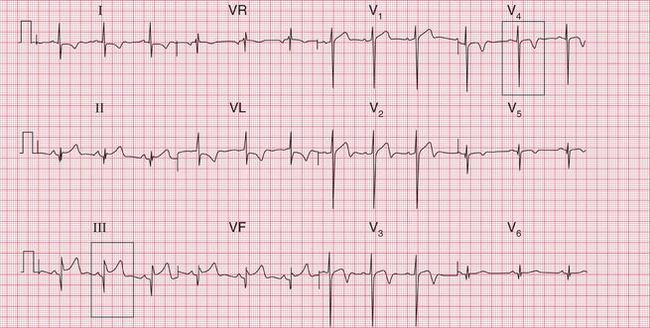
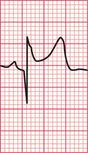
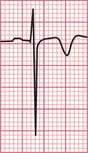
Fig. 5.15 Acute inferior infarction (STEMI) and anterior NSTEMI
Note
Figure 5.16 is an ECG showing an acute anterior myocardial infarction. Deep Q waves in leads III and VF indicate an old inferior infarction.
BUNDLE BRANCH BLOCK AND MYOCARDIAL INFARCTION
Left bundle branch block
Left bundle branch block (LBBB) is very rare in patients with totally normal hearts, but it may be associated with many different heart diseases ( Box 5.6).
With LBBB, the abnormal and slow conduction in to the left ventricle, and the abnormal pattern of repolarization, mean that no changes due to myocardial infarction can be seen ( Fig. 5.17). However, this does not mean that the ECG can be totally disregarded. If a patient has chest pain that could be ischaemic and the ECG shows LBBB that is known to be new, it can be assumed that an acute infarction has occurred and appropriate treatment should be given.
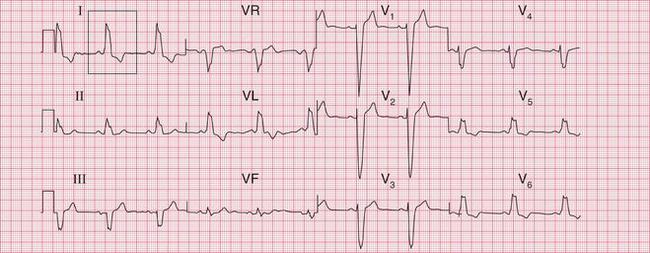
Figure 5.18 is the record from another patient presenting with chest pain who had LBBB, but there are important differences compared to Figure 5.17. Peaked P waves suggest right atrial hypertrophy. ‘Clockwise rotation’ with no left ventricular QRS complex pattern in lead V6 raises the possibility of either a pulmonary embolus (see p. 247) or chronic lung disease.
Right bundle branch block
Right bundle branch block (RBBB) will not necessarily obscure the pattern of inferior infarction ( Fig. 5.19).
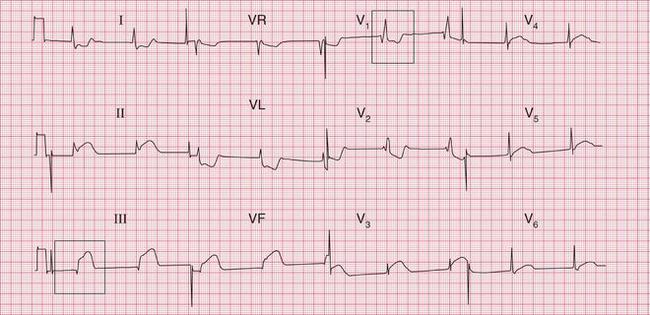
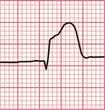
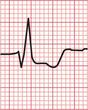
Fig. 5.19 Right bundle branch block and acute inferior infarction
Note
Anterior infarction is more difficult to detect, but RBBB does not affect the ST segment and when this is raised in a patient who clinically has had an infarction, the change is probably significant ( Fig. 5.20).
ST segment depression associated with RBBB indicates ischaemia ( Fig. 5.21). However, T wave inversion in the anterior leads ( Fig. 5.22) is more difficult to interpret because it is a common feature of RBBB itself.
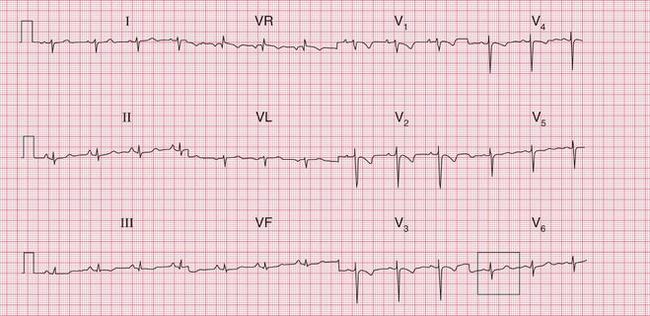
ECG CHANGES IN NON-ST SEGMENT ELEVATION MYOCARDIAL INFARCTION (NSTEMI)
When the infarction does not involve the whole thickness of the ventricular wall, no electrical ‘window’ will be formed so there will be no Q waves: hence the term ‘non-Q wave infarction’, although this has now been superseded by the term ‘NSTEMI’. The infarction causes an abnormality of repolarization that leads to T wave inversion. This pattern is most commonly seen in the anterior and lateral leads ( Fig. 5.23).
ISCHAEMIA WITHOUT MYOCARDIAL INFARCTION
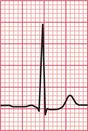
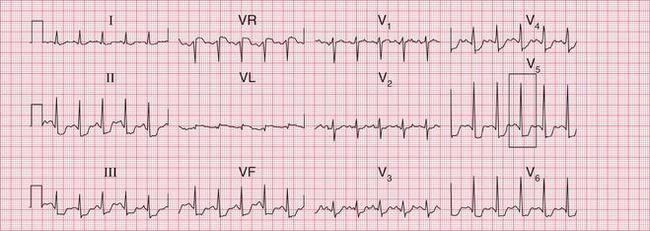
Cardiac ischaemia causes horizontal ST segment depression; to be diagnostic of ischaemia, there must be horizontal or downward-sloping depression of > 0.05 mV in two contiguous leads, and/or T wave inversion of > 0.1 mV in two contiguous leads. Such changes appear and disappear with the pain of stable angina. Persistent pain and ST segment depression ( Fig. 5.24) may not be associated with any rise in troponin level.
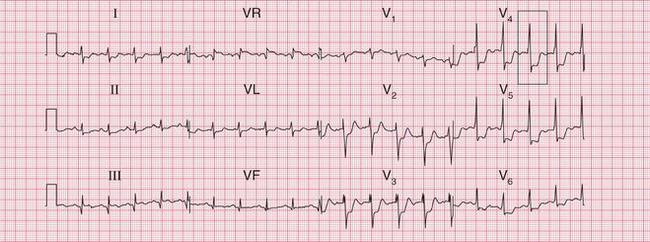
Fig. 5.24 Anterior ischaemia, possible old inferior infarction
Note
If a patient has chest pain that persists long enough for him or her to seek hospital admission, and the ECG shows ST segment depression, the outlook is relatively poor – even when the depression is not marked ( Figs 5.25 and 5.26) and there is no rise in troponin level. These patients usually need further investigation, though on the whole they can be managed as outpatients.
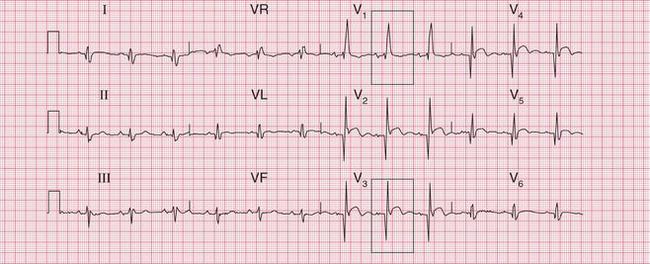
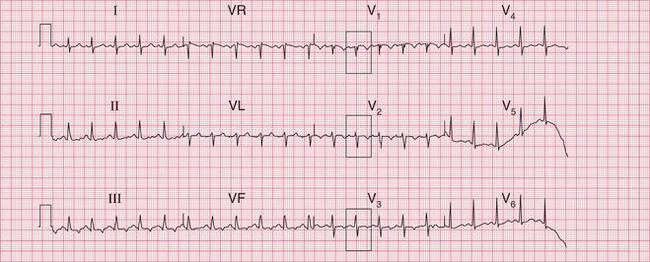
Ischaemia may be precipitated by an arrhythmia, and will be resolved when either the heart rate is controlled or the arrhythmia is corrected. The ECG in Figure 5.27 shows ischaemia during atrial fibrillation with a rapid ventricular rate (this patient had not been treated with digoxin). The ECG in Figure 5.28 shows ischaemic ST segment depression in a patient with an AV nodal re-entry tachycardia and a ventricular rate of > 200/min.
PRINZMETAL’S ‘VARIANT’ ANGINA
Angina can occur at rest due to spasm of the coronary arteries. This is accompanied by elevation rather than depression of the ST segments. The ECG appearance is similar to that of an acute myocardial infarction, but the ST segment returns to normal as the pain settles ( Fig. 5.29). This ECG appearance was first described by Prinzmetal, and it is sometimes called ‘variant’ angina.
THE ECG IN PULMONARY EMBOLISM
Most patients with a pulmonary embolus will have sinus tachycardia, but an otherwise normal ECG.
• inverted T waves in leads V1-V3, and sometimes V4
• right bundle branch block pattern
• shift in the transition point from leads V3-V4 to V5-V6, leading to a persistent deep S wave in lead V6
Figures 5.30, 5.31, 5.32 and 5.33 show the records from four patients with a pulmonary embolus – but remember, in most patients the ECG is normal.

THE ECG IN OTHER CAUSES OF CHEST PAIN
PERICARDITIS
Pericarditis classically causes raised ST segments in most leads ( Fig. 5.34). This may suggest a widespread acute infarction, but in pericarditis the ST segment remains elevated and Q waves do not develop. This pattern is actually very rare: most patients with pericarditis have either a normal ECG, or a variety of nonspecific ST segment/T wave changes.

AORTIC STENOSIS AND AORTIC DISSECTION
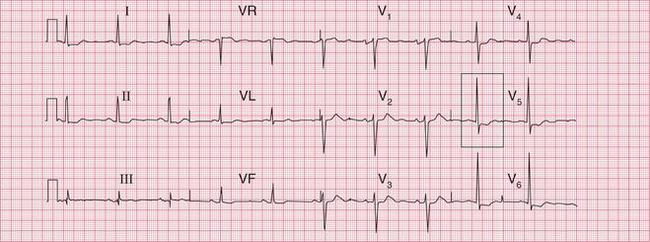
Aortic stenosis is an important cause of angina. The ECG should show left ventricular hypertrophy ( Fig. 5.35). However, the ECG is an unreliable guide to left ventricular hypertrophy and the difficulty of distinguishing it from ischaemia is discussed in Chapter 6.
ECG PITFALLS IN THE DIAGNOSIS OF CHEST PAIN
The normal variants of the ECG have been described in Chapter 1. The important features that may cause confusion with ischaemia are:
• septal Q waves (mainly in leads II, VL, V6)
• Q waves in lead III but not VF
• anterior T wave inversion (not uncommon in lead V2, common in black people in leads V2, V3 and sometimes V4)
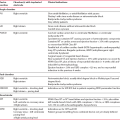
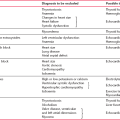
Several abnormal ECG patterns may cause difficulty in making a diagnosis in patients with chest pain, and some of these are summarized in Table 5.1. Other causes of ‘false positives’ include benign early repolarization (see Ch. 1), left bundle branch block, the Brugada syndrome, myocarditis and pericarditis, and pulmonary embolism. ‘False negatives’ may be the result of prior myocardial infarction with persistent ST segment elevation, a permanent pacemaker, or left bundle branch block. The conditions in which the ECG can give false positive or false negative results in the diagnosis of myocardial infarction are listed in Box 5.7.
Table 5.1
ECG pitfalls in the diagnosis of chest pain
| Condition | ECG pattern | May be confused with |
| Normal record | Q waves in lead III but not VF T wave inversion in leads V1-V3 (especially in black people) |
Inferior infarction Anterior infarction |
| Left ventricular hypertrophy | T wave inversion in lateral leads | Ischaemia |
| Right ventricular hypertrophy | Dominant R waves in lead V1 Inverted T waves in leads V1-V3 | Posterior infarction Anterior infarction |
| The Wolff-Parkinson-White syndrome | Inverted T waves in leads V2-V5 | Anterior infarction |
| Hypertrophic cardiomyopathy | T wave inversion in leads V2-V5 | Anterior infarction |
| Subarachnoid haemorrhage | T wave inversion in any leads | Ischaemia |
| Digoxin effect | Downward-sloping ST segment depression or T wave inversion, especially in leads V5-V6 | Ischaemia |
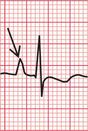
R WAVE CHANGES
The ECG in Figure 5.36 shows a dominant R wave in lead V1. This might be due to right ventricular hypertrophy or to a posterior infarction. Occasionally it could be a normal variant. Here, the normal axis goes against a diagnosis of right ventricular hypertrophy, and a review of previous ECGs from the patient showed that the dominant R wave was due to a posterior infarction.
The ECG in Figure 5.37 also shows a dominant R wave in lead V1. In a patient with chest pain, a posterior infarction might again be considered. However, the PR interval is short and there is a delta wave, so this shows the Wolff-Parkinson-White (WPW) syndrome.
ST SEGMENT AND T WAVE CHANGES
It is, however, repolarization (T wave) changes that cause most problems. The lateral T wave inversion in the ECG in Figure 5.38 might suggest ischaemia, but again this is the WPW syndrome, in which repolarization abnormalities are common.
The anterior and lateral T wave inversion in the ECG in Figure 5.39 suggests either an NSTEMI or hypertrophic cardiomyopathy. This particular patient was white and asymptomatic, and had no family history of arrhythmias or any cardiac disease. There was no echocardiographic evidence of cardiomyopathy, and coronary angiography was normal. The ECG reverted to normal on exercise, and the T wave inversion and the long QT interval remained unexplained.
Differentiation between lateral ischaemia and left ventricular hypertrophy on the ECG is extremely difficult. The ECG in Figure 5.40 shows lateral T wave inversion. There are small Q waves in leads III and VF, suggesting a possible old inferior infarction, and the QRS complexes in the chest leads are not particularly tall. Nevertheless, in this patient the lateral T wave inversion was due to left ventricular hypertrophy.
The patient whose ECG is shown in Figure 5.41 had mild hypertension. The QRS complexes are tall (see Ch. 6) and there is lateral T wave inversion, suggesting left ventricular hypertrophy. However, there is also T wave inversion in leads V3 and V4, which is unusual in left ventricular hypertrophy. This patient had severe narrowing of the left main coronary artery.
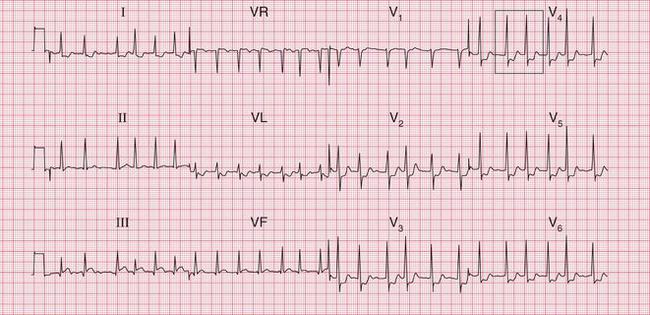
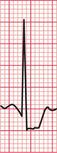
Digoxin therapy causes downward-sloping ST segment depression and T wave inversion (see Ch. 7), particularly in the lateral leads, as is seen in Figure 5.42. The fact that the rhythm is atrial fibrillation with a controlled ventricular rate suggests that the patient is being treated with digoxin. However, T wave inversion in leads V3 and V4 is much more likely to be due to ischaemia, as was the case here.
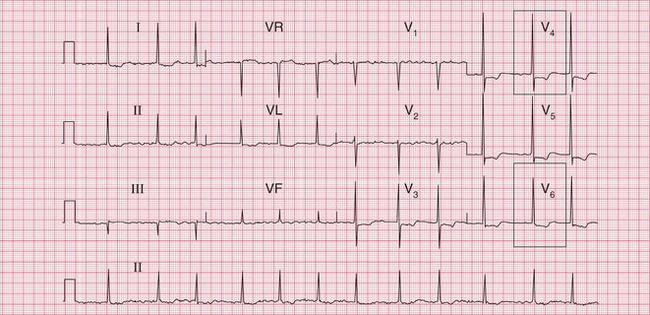
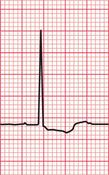
Fig. 5.42 Digoxin effect and ischaemia
Note
An extremely common finding on the ECG is ‘nonspecific T wave flattening’ ( Fig. 5.43). When a patient is completely well and the heart is clinically normal, this is of no importance. However, in a patient with chest pain that appears to be cardiac, ‘nonspecific’ ST segment/T wave changes may indicate ischaemia.
WHAT TO DO
It is essential to remember that while the ECG can on occasions be extremely helpful in the diagnosis of chest pain, frequently it is not. The history, and to a lesser extent the physical examination, are far more important. Serial changes in the ECG are more important than single records.
OTHER INVESTIGATIONS FOR PATIENTS WITH ACUTE CHEST PAIN
Echocardiography is the investigation of choice if pericarditis is suspected, because most patients will have a pericardial effusion which is easily detected. Subsequent treatment will depend on the underlying cause of the pericarditis. Possible causes are listed in Box 5.8.
Echocardiography may also help in the diagnosis of an aortic dissection, but not reliably – CT scanning is probably the investigation of choice in such cases. Echocardiography may also be helpful in suspected pulmonary embolism, because it may show right ventricular dilatation.
THE INVESTIGATION OF CHRONIC CHEST PAIN
The percentage of people estimated to have CAD according to their age, gender, symptoms and risk factors is shown in Table 5.2.
Table 5.2
Percentage of people estimated to have coronary artery disease
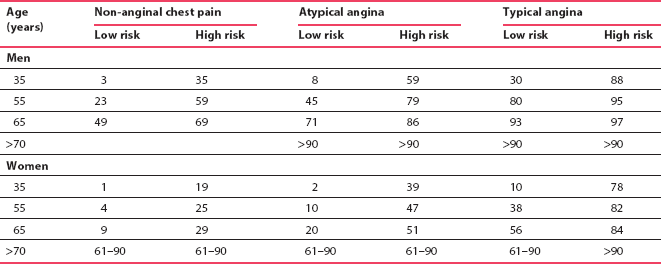
National Institute for Health and Clinical Excellence (2010). Adapted from CG 95 Chest pain of recent onset: assessment and diagnosis of recent onset chest pain or discomfort of suspected cardiac origin. London: NICE. Available from http://guidance.nice.org.uk/CG95. Reproduced with permission. Content accurate at time of going to press.
The NICE guidelines suggest that if the likelihood of CAD is 61-90%, the first-line diagnostic investigation is invasive coronary angiography, if clinically indicated. If the likelihood of CAD is 30-60%, some form of functional imaging should be used; and if the likelihood is 10-29%, the first-line diagnostic investigation should be CT calcium scoring. CT scoring has a higher diagnostic sensitivity than exercise testing, and so it is more useful as a first test for excluding coronary disease, and thus for avoiding a further sequence of tests. When considering the use of CT calcium scoring the risks of radiation (roughly equivalent to a barium swallow) must be taken into account.
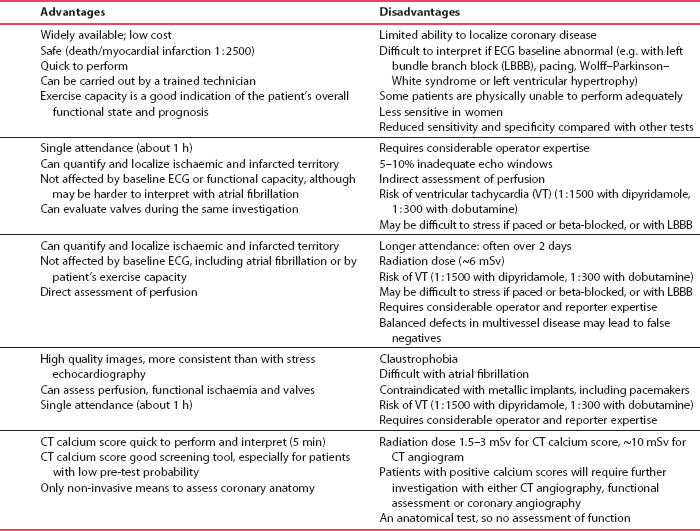
The non-invasive functional imaging tests considered in the NICE guidelines include myocardial perfusion scintigraphy with single-photon emission computed tomography (MPS with SPECT), stress echocardiography, first-pass contrast-enhanced magnetic resonance (MR) perfusion, or MR imaging for stress-induced wall motion abnormalities. Features of these techniques, in order of common availability, are summarized in Table 5.3.
The exercise ECG is thus not regarded as a useful test for the diagnosis of angina, and the guidelines suggest that its remaining use is in the assessment of functional capacity in patients with known coronary artery disease. However, even though exercise testing is undoubtedly less sensitive and less specific than the other tests, it is still probably the most widely used investigation for chest pain, because of its advantages. Above all, it provides an opportunity to assess and judge the patient as a whole ( Box 5.9) and to see what workload they can achieve, and whether the limiting factor is chest pain or some other factor, such as joint pain or anxiety.
Table 5.3
Possible non-invasive investigations in chronic chest pain
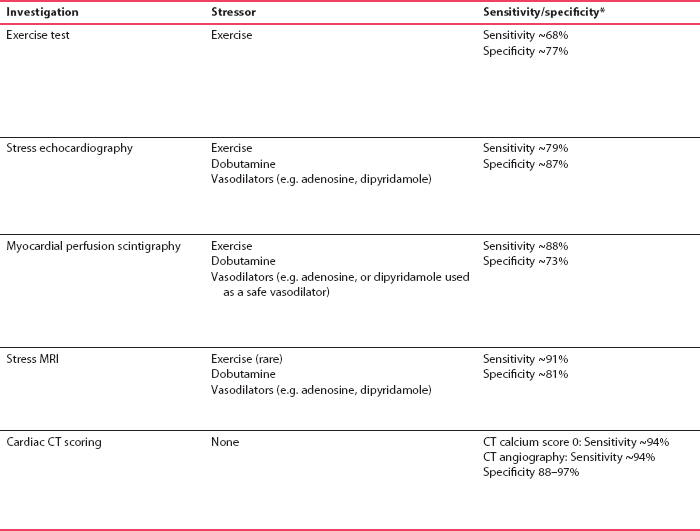
*Note sensitivity and specificity for all tests depend on the pre-test probability of coronary disease in the patient population studied. This should be considered when interpreting the results of any diagnostic test and when selecting the most appropriate test. Hence patients with higher pre-test probabilities will have higher false negative rates, and patients with lower pre-test probabilities will have higher false positive rates.
EXERCISE TESTING
Although any form of exercise that induces pain should produce ischaemic changes in the ECG, it is best to use a reproducible test that patients find reasonably easy to perform, and to use carefully graded increments of exercise. The use of non-standard tests means that the results may be difficult to interpret, and that repeated tests in the same patient cannot be compared meaningfully.
PRACTICAL ASPECTS OF EXERCISE TESTING
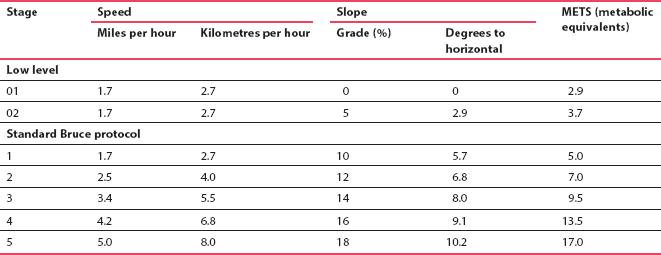
Reproducible exercise testing needs either a bicycle ergometer or a treadmill. In either case, the exercise should begin at a low level that the patient finds easy, and should be made progressively more difficult. On a bicycle, the pedal speed should be kept constant and the workload increased in steps of 25 watts. On a treadmill, both the slope and the speed can be changed and the protocol evolved by Bruce ( Table 5.4) is the one most commonly used.
The workload achieved by a patient on a treadmill is sometimes expressed as metabolic equivalents (METS). The rate at which oxygen is used by an average person at rest is 1 MET, and it equals 3.5 ml/kg/min. However, few people are average, and oxygen consumption is dependent on weight, age and gender, so METS are not particularly useful. Box 5.10 shows the estimated workloads imposed by various activities, and hence how exercise tolerance (as measured on the treadmill) indicates what a patient might be expected to achieve.
REASONS FOR DISCONTINUING AN EXERCISE TEST
1. At the request of the patient – because of pain, breathlessness, fatigue or dizziness.
2. If the systolic blood pressure begins to fall. Normally, systolic pressure will rise progressively with increasing exercise level, but in any subject a point will be reached at which systolic pressure reaches a plateau and then starts to fall. A fall of 10 mmHg is an indication that the heart is not pumping effectively and the test should be stopped – if it is continued, the patient will become dizzy and may fall. In healthy subjects, a fall in systolic pressure is seen only at high workloads, but in patients with severe heart disease the systolic pressure may fail to rise on exercise. The amount of exercise the patient can carry out before the systolic pressure falls is thus a useful indicator of the severity of any heart disease.
3. It is conventional to discontinue the test if the heart rate increases to 80% of the predicted maximum for the patient’s age. This maximum can be calculated in beats/min by subtracting the patient’s age in years from 220. Patients with severe heart disease will usually fail to attain 80% of their predicted maximum heart rate, and the peak rate is another useful indicator of the state of the patient’s heart. It is, of course, important to take note of any treatment the patient may be receiving, because a beta-blocker will prevent the normal increase in heart rate.
4. Exercise should be discontinued immediately if an arrhythmia occurs. Many patients will have ventricular extrasystoles during exercise. These can be ignored unless their frequency begins to rise, or a couplet of extrasystoles occurs.
5. The test should be stopped if the ST segment in any lead becomes depressed by 4 mm. Horizontal depression of 2 mm in any lead is usually taken as indicating that a diagnosis of ischaemia can be made (a ‘positive’ test), and if the aim of the test is to confirm or refute a diagnosis of angina there is no point in continuing once this has occurred. It may, however, be useful to find out just how much a patient can do, and if this is the aim of the test it is not unreasonable to continue, if the patient’s symptoms are not severe.
INTERPRETATION OF ECG CHANGES DURING EXERCISE TESTING
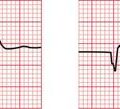
An exercise test is usually considered ‘positive’ for ischaemia if horizontal or downward-sloping ST segment depression of 2 mm or more develops during exercise, and resolves on resting. By convention, ST segment depression is measured relative to the ECG baseline (between the T and P waves) 60–80 ms after the J point (the point of inflection at the junction of the S wave and the ST segment). A diagnosis of ischaemia becomes almost certain if these changes are accompanied by the appearance and then disappearance of angina. Figures 5.44 and 5.45 show an ECG that was normal when the patient was at rest, but which demonstrated clear ischaemia during exercise. Box 5.11 lists the normal changes in the ECG during exercise, and Box 5.12 lists the changes suggesting a high probability of coronary disease.
There are, however, other ECG changes that may be seen during an exercise test. Figures 5.46 and 5.47 show the records of tests in a patient who had had an anterior myocardial infarction some weeks previously. At rest, some ST segment elevation persisted in the anterior leads. During exercise the ST elevation became more marked. The reasons for this are uncertain. It has been suggested that the change is due to the development of an abnormality of left ventricular contraction, but other evidence suggests that it is simply another ECG manifestation of ischaemia. There is, however, no doubt that this is an abnormal result.
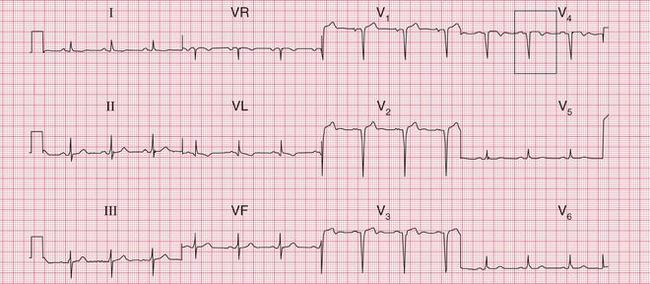
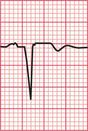
Fig. 5.46 Anterior infarction, ?age
Note
Q wave, slight ST segment elevation and inverted T wave in lead V4
When the resting ECG shows T wave inversion and on exercise the T waves become upright, this is called ‘pseudonormalization’, and it is a sign of ischaemia ( Fig. 5.48).
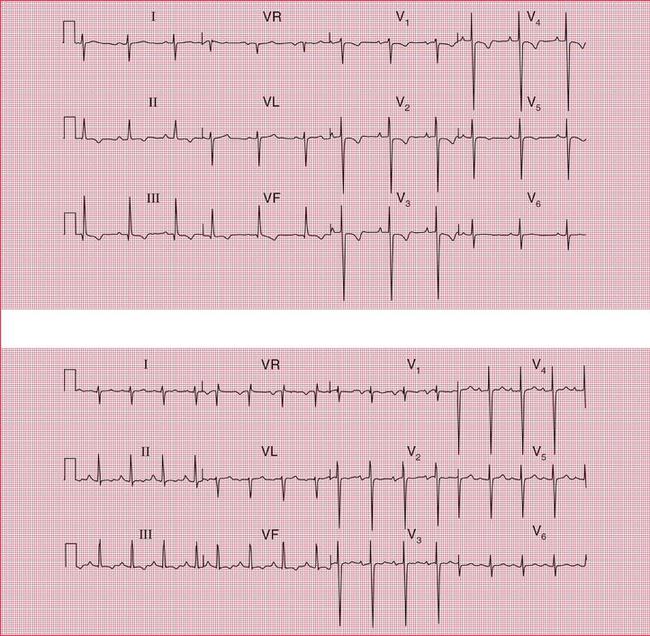
Fig. 5.48 Pseudonormalization
Note
At rest (upper trace):
• Small Q waves with inverted T waves in leads III and VF suggest an old inferior infarction
• T wave inversion in leads II and V2–V4 suggests ischaemia (T wave inversion in lead V1 is normal)
This pattern suggests the pseudonormalization of an ECG showing ischaemia at rest
When the J point and the ST segment become depressed during exercise, but the ST segment slopes upwards, the change is not an indication of ischaemia ( Figs 5.49 and 5.50). Deciding whether ST segment depression slopes upwards or is horizontal can be quite difficult.
False positive changes also occur when exercise testing is performed in patients taking digoxin. Figures 5.51 and 5.52 show the results of an exercise test in a patient being treated with digoxin, whose coronary angiogram was normal.
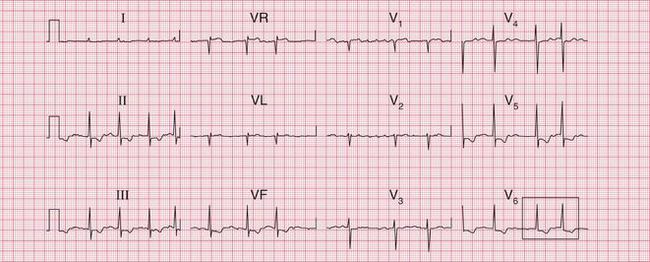
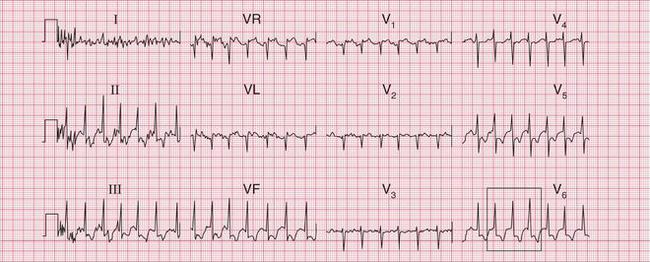
Fig. 5.52 Atrial fibrillation: digoxin effect on exercise
Note
Exercise testing thus has to be used and interpreted with care.
RISKS OF EXERCISE TESTING
Exercise testing involves a risk of about 1 in 5000 of the development of ventricular tachycardia or ventricular fibrillation, and a risk of about 1 in 10000 tests of myocardial infarction or death. There is also a risk of injury if the patient falls, or jumps, off the treadmill. Box 5.13 lists some contraindications of exercise testing.
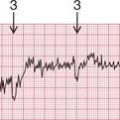
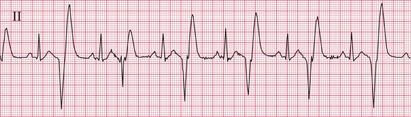
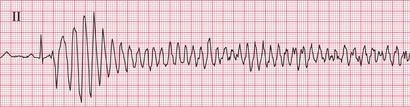
The ECGs in Figures 5.53, 5.54 and 5.55 are from a patient whose resting ECG was normal, but as the test proceeded he began to develop ventricular extra-systoles and then suddenly developed ventricular fibrillation. This demonstrates the need for full resuscitation facilities to be available at the time of exercise testing.
MANAGEMENT OF CHEST PAIN
STEMI
Patients with STEMI require immediate coronary recanalization by means of either percutaneous coronary intervention (PCI) or thrombolysis.
NSTEMI
CHRONIC CHEST PAIN
Otherwise, treatment will depend on the cause of the chest pain. If investigation (see above) reveals that the cause is cardiac, and despite maximum medical therapy the patient remains symptomatic, invasive procedures such as coronary artery bypass grafting or percutaneous transluminal coronary angioplasty may need to be considered.