[level-membership-for-cardiovascular-category]6
The ECG in Patients with Breathlessness
The ECG in disorders affecting the left side of the heart
The ECG in left atrial hypertrophy
The ECG in left ventricular hypertrophy
ECGs that can mimic left ventricular hypertrophy
The ECG in disorders affecting the right side of the heart
The ECG in right atrial hypertrophy
HISTORY AND EXAMINATION
There are many causes of breathlessness (see Box 6.1). Everyone is breathless at times, but people who are physically unfit or who are overweight will be more breathless than others. Breathlessness can also result from anxiety, but when it is due to physical illness the important causes are anaemia, heart disease and lung disease; a combination of causes is common. Apart from ischaemia (see Ch. 5), cardiac diseases causing breathlessness include valve disease, cardiomyopathy, and myocarditis including acute rheumatic fever. Boxes 6.2–6.6 summarize the effects of these conditions on the heart, and the corresponding ECG features. The most important function of the history is to help to determine whether the patient does indeed have a physical illness and, if so, which system is affected.
Breathlessness in heart disease is due to either increased lung stiffness, as a result of pulmonary congestion, or pulmonary oedema. Pulmonary congestion occurs when the left atrial pressure is high. A high left atrial pressure occurs either in mitral stenosis or in left ventricular failure. Pulmonary oedema occurs when the left atrial pressure exceeds the oncotic pressure exerted by the plasma proteins.
RHYTHM PROBLEMS
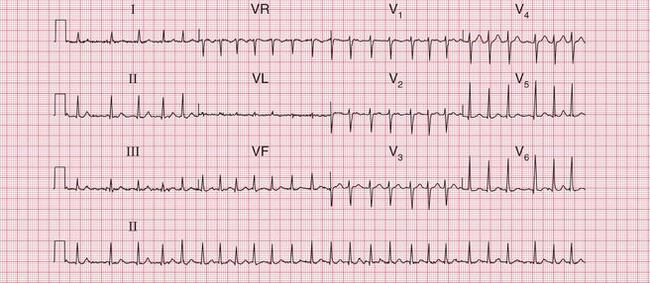
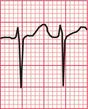
A sudden rhythm change is a common cause of breathlessness, and even of frank pulmonary oedema. Arrhythmias can be paroxysmal, so the patient may be in sinus rhythm when examined, and a patient who is suddenly breathless may not be aware of an arrhythmia. When sudden breathlessness is associated with palpitations it is important to establish whether the breathlessness or the palpitations came first palpitations following breathlessness may be due to the sinus tachycardia of anxiety. The ECG in Figure 6.1 is from a patient who developed pulmonary oedema due to the onset of uncontrolled atrial fibrillation.
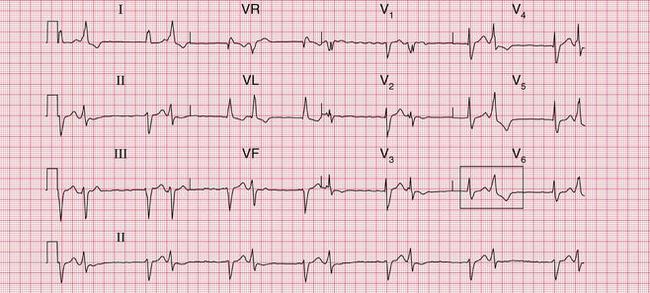
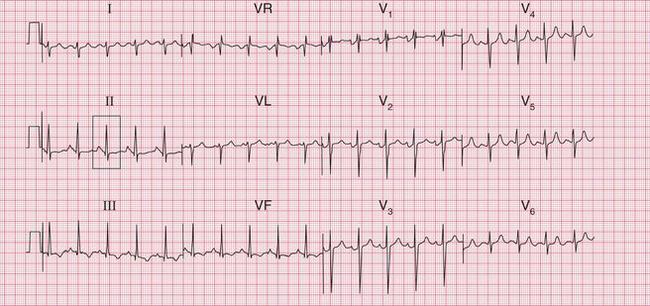
Less dramatic rhythm abnormalities can also contribute to breathlessness, especially to breathlessness on exertion. This is true of both fast and slow rhythms. The ECG in Figure 6.2 is from a patient who had atrial fibrillation but who was breathless on exercise partly because of coupled ventricular extrasystoles, which markedly reduced cardiac output as a result of an effective halving of the heart rate.
THE ECG IN DISORDERS AFFECTING THE LEFT SIDE OF THE HEART
THE ECG IN LEFT ATRIAL HYPERTROPHY
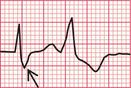
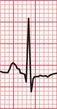
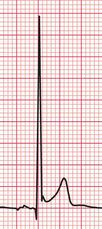
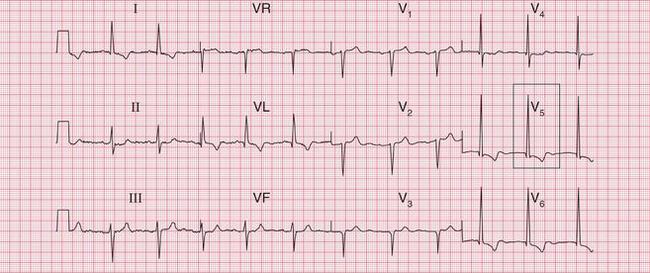
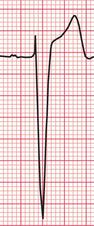
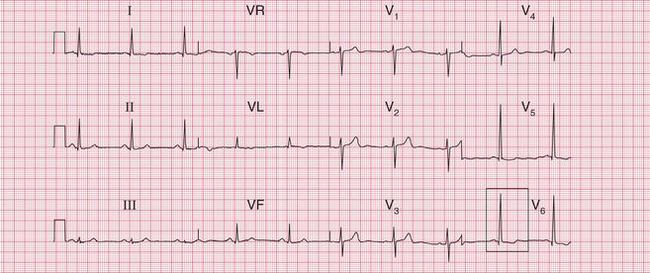
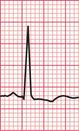
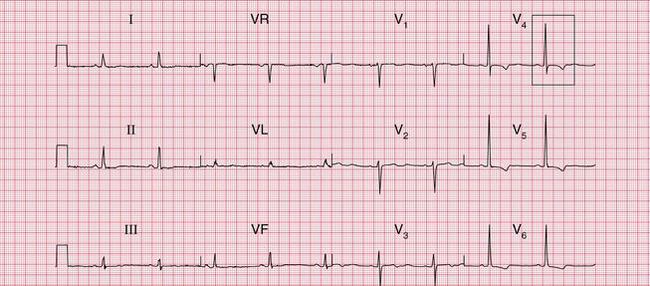
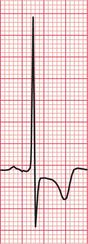
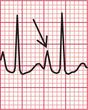
Left atrial hypertrophy causes a double (bifid) P wave. Left atrial hypertrophy without left ventricular hypertrophy is classically due to mitral stenosis, so the bifid P wave is sometimes called ‘P mitrale’. This is misleading, because most patients whose ECGs have bifid P waves either have left ventricular hypertrophy that is not obvious on the ECG or and perhaps this is more common have a perfectly normal heart. The bifid P wave is thus not a useful measure of left atrial hypertrophy.
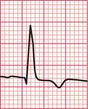
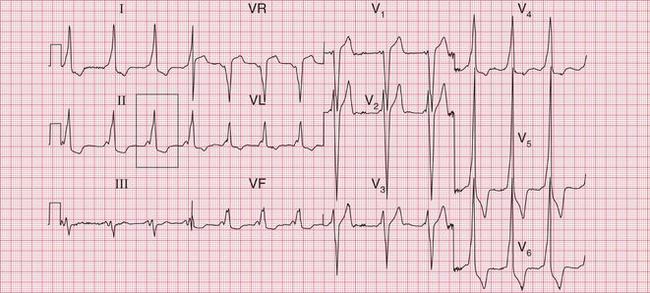
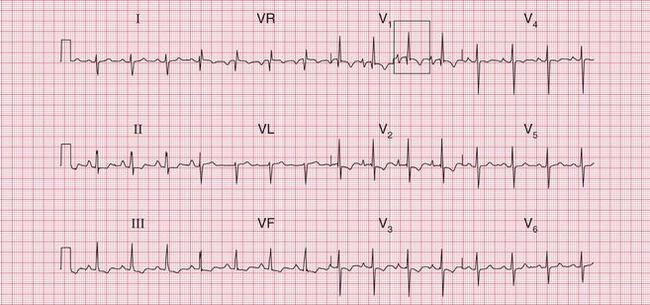
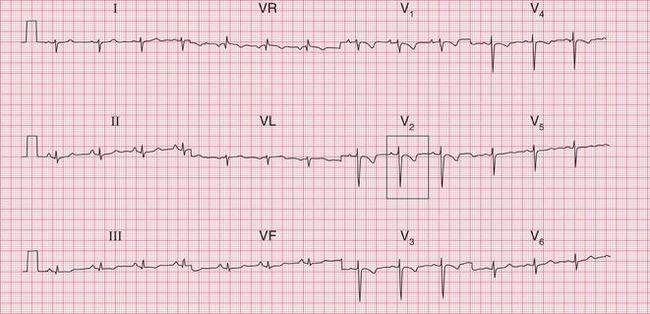
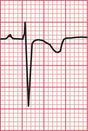
Figure 6.3 shows an ECG with a bifid P wave indicating left atrial hypertrophy. This was confirmed by echocardiography in the patient, who also had concentric left ventricular hypertrophy due to hypertension.
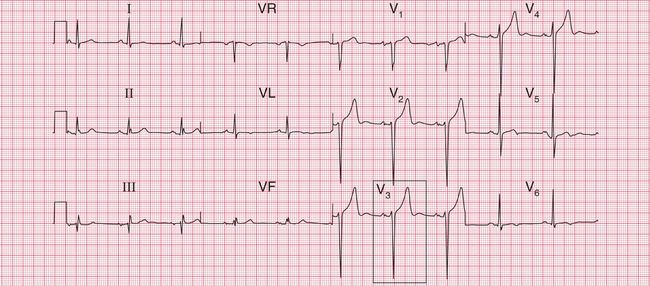
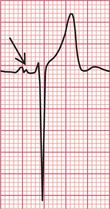
Fig. 6.3 Left atrial hypertrophy and left ventricular hypertrophy
Note
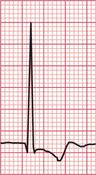
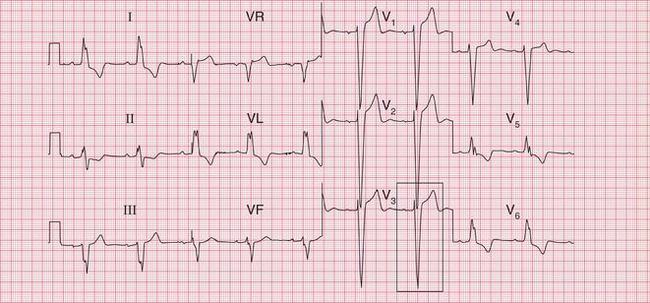
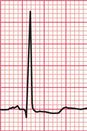
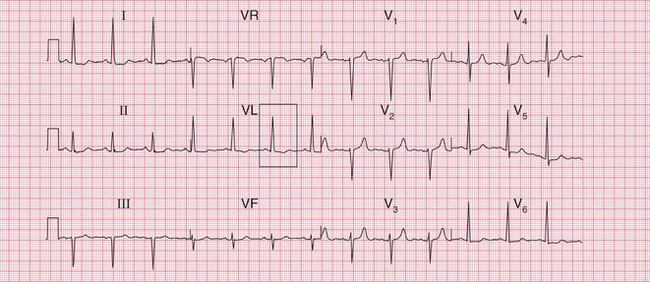
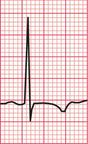
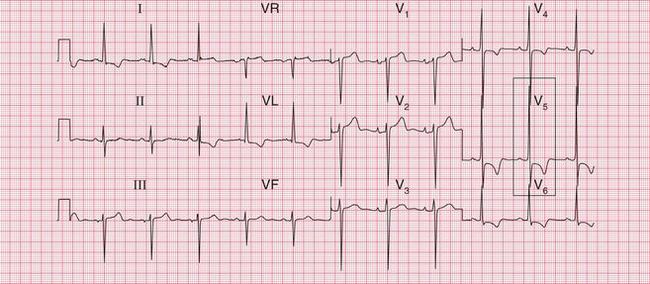
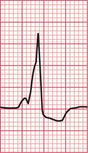
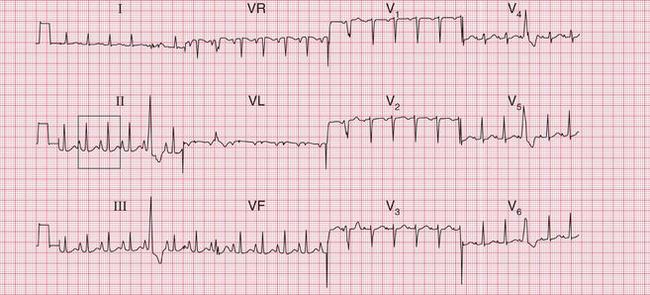
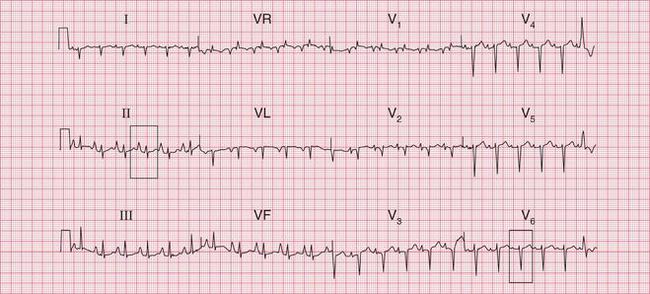
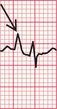
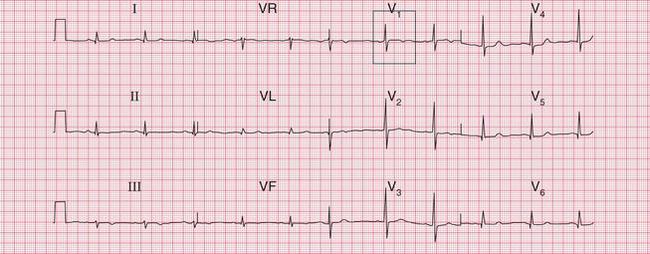
Significant mitral stenosis usually but not always leads to atrial fibrillation, in which no P waves, bifid or otherwise, can be seen. Occasional patients, such as the one whose ECG is shown in Figure 6.4, develop pulmonary hypertension and remain in sinus rhythm. There is then a combination of a bifid P wave with evidence of right ventricular hypertrophy. This combination does allow a confident diagnosis of severe mitral stenosis.
THE ECG IN LEFT VENTRICULAR HYPERTROPHY
Left ventricular hypertrophy may be caused by hypertension, aortic stenosis or incompetence, or mitral incompetence.
The ECG features of left ventricular hypertrophy are:
• an increased height of the QRS comple
• inverted T waves in the leads that ‘look at’ the left ventricle I, VL and V5-V6.
Unfortunately, voltage criteria have a low sensitivity as detectors of left ventricular hypertrophy, and are essentially useless. They would frequently lead to a diagnosis of left ventricular hypertrophy in perfectly healthy young men, even in those who are not athletic ( Fig. 6.5).
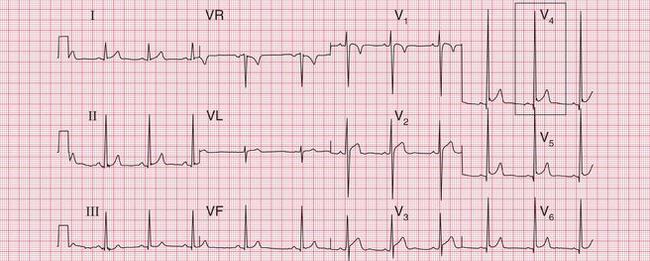
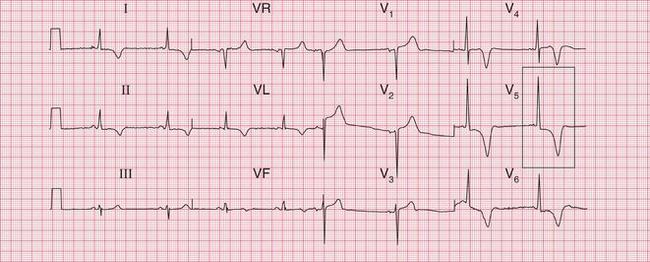
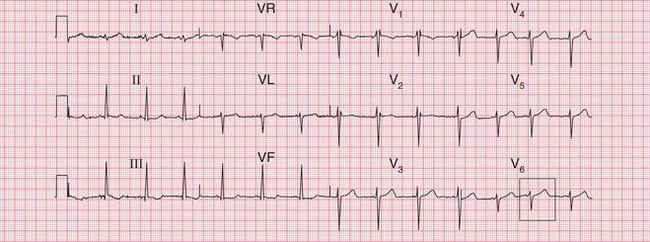
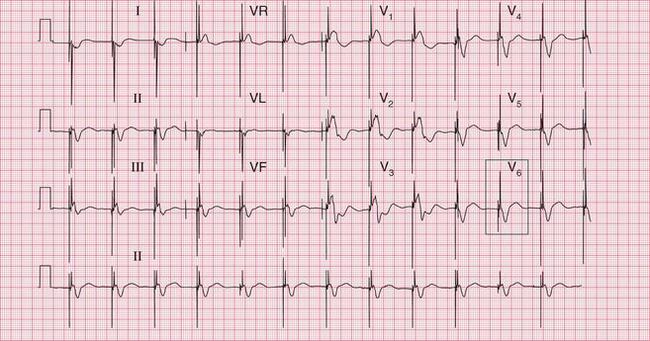
The complete ECG picture of left ventricular hypertrophy is easy to recognize. The ECG in Figure 6.6 is from a patient with severe and untreated hypertension. It shows the ‘voltage criteria’ which, when combined with the T wave inversion in the lateral leads, probably are significant. In this case, the small Q waves in the lateral leads are septal and do not indicate a previous infarction. Note that the T wave inversion is most prominent in lead V6, and becomes progressively less so in leads V5 and V4. This pattern of T wave inversion is sometimes referred to as ‘left ventricular strain’, but this is an old-fashioned and essentially meaningless term.
The most important cause of severe left ventricular hypertrophy is aortic valve disease: when aortic stenosis or incompetence causes left ventricular hypertrophy, aortic valve replacement must be considered. Aortic valve disease is frequently associated with left bundle branch block (LBBB) ( Fig. 6.7), which completely masks any evidence of left ventricular hypertrophy. The patient who is breathless, or who has chest pain or dizziness, and has signs of aortic valve disease and an ECG showing LBBB, needs urgent investigation.
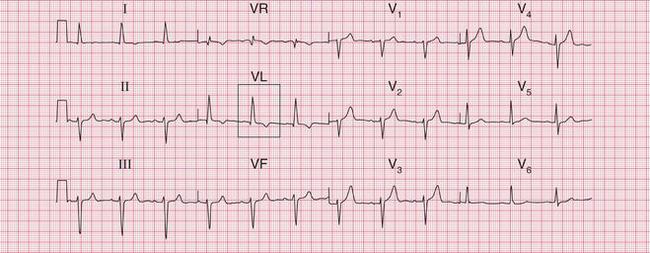
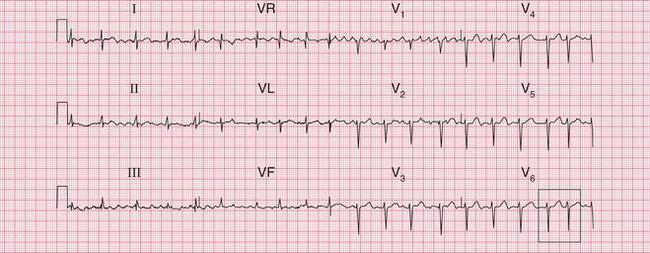
Unfortunately, the severity of ECG changes is an unreliable guide to the importance of the underlying cardiac problem. The ECG in Figure 6.8 shows lateral T wave inversion, but does not meet the ‘voltage criteria’, in a patient with moderate aortic stenosis (aortic valve gradient 60 mmHg).
In contrast, the ECG in Figure 6.9 is from a patient with severe aortic stenosis and an aortic valve gradient of > 120 mmHg, yet it shows little to suggest severe left ventricular hypertrophy.
ECGS THAT CAN MIMIC LEFT VENTRICULAR HYPERTROPHY
The problems of differentiating between lateral T wave changes due to left ventricular hypertrophy and those due to ischaemia have been discussed in Chapter 5. The history and physical examination become extremely important, and the ECG must not be viewed in isolation. The ECG in Figure 6.10 is from a patient with chest pain that was compatible with, but not diagnostic of, angina and who had physical signs suggesting mild aortic stenosis. The T wave inversion is more prominent in leads V4 and V5 than in V6, and is present in V3. The T waves are upright in leads I and VL. These changes point to ischaemia rather than left ventricular hypertrophy, and ischaemia proved to be present in this patient.
The ECG in Figure 6.11 is from a patient with hypertension and breathlessness. He was shown to have left ventricular hypertrophy and coronary disease, but all the changes here could have been due to left ventricular hypertrophy alone.
When a breathless patient has an ECG with gross lateral T wave changes ( Fig. 6.12), hypertrophic cardiomyopathy is a possibility ( Box 6.4).
Lateral T wave changes associated with left anterior hemiblock often accompany left ventricular hypertrophy. However, there was no echocardiographic evidence of this in the patient whose ECG is shown in Figure 6.13. Here the changes must be due to conducting system disease.
Another example of a conducting tissue abnormality that could be mistaken for left ventricular hypertrophy is the Wolff-Parkinson-White (WPW) syndrome. The ECG in Figure 6.14 is from a young man with the WPW syndrome type B. There is left ventricular hypertrophy according to voltage criteria, and there is also lateral T wave inversion, but the diagnosis is made from the short PR intervals and the delta waves. The height of the QRS complexes and the T wave inversion in this situation do not indicate left ventricular hypertrophy.
THE ECG IN DISORDERS AFFECTING THE RIGHT SIDE OF THE HEART
Right-sided heart disease can be the result of chronic lung disease (e.g. chronic obstructive airways disease, bronchiectasis), pulmonary embolism (especially when repeated episodes cause thromboembolic pulmonary hypertension), idiopathic pulmonary hypertension, or congenital heart disease. Any of these can cause right ventricular hypertrophy, but none of them causes a specific ECG abnormality (Boxes 6.7 and 6.8).
THE ECG IN RIGHT ATRIAL HYPERTROPHY
Right atrial hypertrophy causes tall and peaked P waves, which are sometimes described as ‘P pulmonale’. There is, in fact, such variation within the normal range of P waves that the diagnosis of right atrial hypertrophy is difficult to make. Its presence can be inferred when peaked P waves are associated with the ECG changes of right ventricular hypertrophy. Evidence of right atrial hypertrophy without right ventricular hypertrophy will usually only be seen in patients with tricuspid stenosis ( Fig. 6.15).
The ECG in Figure 6.16 is from a patient with right atrial and right ventricular hypertrophy due to severe chronic obstructive pulmonary disease.
THE ECG IN RIGHT VENTRICULAR HYPERTROPHY
The ECG changes associated with right ventricular hypertrophy are:
• a dominant R wave in lead V1
• clockwise rotation of the heart: as the septum is displaced laterally, the transition of the QRS complex in the chest leads from a right to a left ventricular configuration occurs in leads V4-V6 instead of V2-V4; there is thus a persistent S wave in lead V6, which normally does not show an S wave at all
• inversion of the T wave in leads that ‘look at’ the right ventricle: Vi, V2 and occasionally V3.
In extreme cases it is easy to diagnose right ventricular hypertrophy from the ECG. The ECG in Figure 6.17 came from a patient incapacitated by breathlessness due to primary pulmonary hypertension.
As with the ECG in left ventricular hypertrophy, none of the ECG changes of right ventricular hypertrophy individually provide unequivocal evidence of right ventricular hypertrophy ( Table 6.1). Conversely, it is possible to have marked right ventricular hypertrophy without all the typical ECG features being present. Minor degrees of right axis deviation are seen in normal people, and a dominant R wave in lead V1 is occasionally seen in normal people, although it is never more than 3 or 4 mm tall. A dominant R wave in lead V1 may also indicate a ‘true posterior’ myocardial infarction (see Ch. 5). There may be variation in the T wave inversion in leads V1 and V2 in normal subjects (see Ch. 1) and, particularly in black people, the T wave can be inverted in leads V2 and V3.
Table 6.1
Possible alternative causes of the ECG appearance of right ventricular hypertrophy
| ECG feature | Cause |
| Right axis deviation | Normal in tall thin people |
| Dominant R wave in lead V, | Normal variant |
| Posterior infarction | |
| The Wolff-Parkinson-White syndrome | |
| Right bundle branch block of any cause | |
| Inverted T waves in leads V,-V2 | Normal variant, especially in black people |
| Anterior non-ST segment elevation myocardial infarction | |
| The Wolff-Parkinson-White syndrome | |
| Right bundle branch block of any cause | |
| Cardiomyopathy | |
| Apparent clockwise rotation | Dextrocardia |
The ECG in Figure 6.18 shows a dominant R wave in lead V1 but no other evidence of right ventricular hypertrophy. This could indicate a posterior myocardial infarction (see Ch. 5), but this trace was from a young man who was asymptomatic, who had no abnormalities on examination, and whose echocardiogram was normal. This is a normal variant.
The ECG in Figure 6.19 is from a young woman who had become progressively more breathless since the birth of her baby 4 months previously. She had had no chest pain. No previous ECGs were available. The anterior T wave changes could be a normal variant in a black woman. T wave inversion in leads V3-V4 could indicate anterior ischaemia, but the important point here is that the T wave inversion is most prominent in leads Vi-V2, and becomes progressively less in V3-V4. This is characteristic of T wave inversion due to right ventricular hypertrophy. In this case the T wave inversion, combined with right axis deviation and a persistent S wave in lead V6, suggests right ventricular hypertrophy. The patient was shown to have had recurrent small pulmonary emboli.
A prominent S wave in lead V6 is sometimes called ‘persistent’ because this lead should show a pure left ventricular type of complex with a dominant R wave and no S wave. The ‘transition point’, when the R and S waves are equal, indicates the position of the interventricular septum and this is normally under the position of lead V3 or V4. In the ECG in Figure 6.20 a transition point is not present at all, and lead V6 shows a small R wave and a dominant S wave. This is due to the right ventricle underlying more of the precordium than usual. This change is characteristic of chronic lung disease.

When breathlessness is accompanied by a sudden change in rotation, a pulmonary embolus is likely. The ECG in Figure 6.21 is from a patient who had had a normal preoperative ECG but who developed breathlessness with atrial fibrillation a week after cholecystectomy. The deep S wave in lead V6 is the pointer towards a pulmonary embolus being the cause of the atrial fibrillation.
What TO DO
In most patients with breathlessness, the ECG does not contribute very much to diagnosis and management, and the important thing is to treat the patient and not the ECG.
CARDIAC RESYNCHRONIZATION THERAPY (CRT)
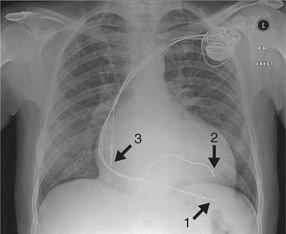
Patients with severe heart failure, especially those whose ECG shows left bundle branch block with a broad QRS complex, may have dyssynchronous cardiac contraction. Instead of both sides of the left ventricle contracting simultaneously in systole, there is a substantial delay between contraction of the left ventricular septum and the free wall. This reduces the stroke volume and exacerbates the heart failure. Contraction can be resynchronized by pacing the left ventricular free wall and the septum simultaneously. This is achieved by two pacing leads one placed in a branch of the coronary sinus (the venous side of the coronary circulation, which drains into the right atrium), with a second, right ventricular, lead to pace the septum. This technique, ‘cardiac resynchronization therapy’ (CRT), is also known as biventricular pacing, or simply ‘bivent’. Resynchronization improves both cardiac output and symptomatic heart failure. In addition to right ventricular and coronary sinus leads, there will usually be an atrial lead if sinus rhythm is present, because atrial systole may make an important contribution to cardiac output ( Fig. 6.22).
INDICATIONS FOR CRT
Numerous clinical studies have shown that, in appropriate patients, CRT can improve left ventricular function and ejection fraction, and can improve exercise capacity. In patients still symptomatic from heart failure despite optimal medical therapy, CRT has been shown to reduce morbidity and all-cause mortality. CRT is therefore now considered a standard therapy; its indications are listed in Box 6.9. However, its role in patients with less severe symptoms, or with atrial fibrillation or pacemaker dependence, has not been established. Since it is an invasive and costly procedure, patient selection is clearly extremely important.
ECG APPEARANCE
The pacing spike may be complex and may have two components. The QRS complex of the paced beat may have either a narrowed left bundle branch block morphology or a right bundle branch block morphology ( Fig. 6.23).
Patients without an atrial lead will usually have atrial fibrillation or atrial flutter.
SPECIALIST FUNCTIONS
Patients with severe left ventricular dysfunction are at increased risk of ventricular arrhythmias, so some CRT devices incorporate a ventricular implanted cardioverter defibrillation element (CRTD). This device will function in the same way as a conventional biventricular pacing device, but with the additional function of an ICD (see Ch. 3).
[/level-membership-for-cardiovascular-category][not-level-membership-for-cardiovascular-category]6
The ECG in Patients with Breathlessness
The ECG in disorders affecting the left side of the heart
The ECG in left atrial hypertrophy
The ECG in left ventricular hypertrophy
ECGs that can mimic left ventricular hypertrophy
The ECG in disorders affecting the right side of the heart
The ECG in right atrial hypertrophy
HISTORY AND EXAMINATION
There are many causes of breathlessness (see Box 6.1). Everyone is breathless at times, but people who are physically unfit or who are overweight will be more breathless than others. Breathlessness can also result from anxiety, but when it is due to physical illness the important causes are anaemia, heart disease and lung disease; a combination of causes is common. Apart from ischaemia (see Ch. 5), cardiac diseases causing breathlessness include valve disease, cardiomyopathy, and myocarditis including acute rheumatic fever. Boxes 6.2–6.6 summarize the effects of these conditions on the heart, and the corresponding ECG features. The most important function of the history is to help to determine whether the patient does indeed have a physical illness and, if so, which system is affected.
Breathlessness in heart disease is due to either increased lung stiffness, as a result of pulmonary congestion, or pulmonary oedema. Pulmonary congestion occurs when the left atrial pressure is high. A high left atrial pressure occurs either in mitral stenosis or in left ventricular failure. Pulmonary oedema occurs when the left atrial pressure exceeds the oncotic pressure exerted by the plasma proteins.
RHYTHM PROBLEMS
A sudden rhythm change is a common cause of breathlessness, and even of frank pulmonary oedema. Arrhythmias can be paroxysmal, so the patient may be in sinus rhythm when examined, and a patient who is suddenly breathless may not be aware of an arrhythmia. When sudden breathlessness is associated with palpitations it is important to establish whether the breathlessness or the palpitations came first palpitations following breathlessness may be due to the sinus tachycardia of anxiety. The ECG in Figure 6.1 is from a patient who developed pulmonary oedema due to the onset of uncontrolled atrial fibrillation.
Less dramatic rhythm abnormalities can also contribute to breathlessness, especially to breathlessness on exertion. This is true of both fast and slow rhythms. The ECG in Figure 6.2 is from a patient who had atrial fibrillation but who was breathless on exercise partly because of coupled ventricular extrasystoles, which markedly reduced cardiac output as a result of an effective halving of the heart rate.
THE ECG IN DISORDERS AFFECTING THE LEFT SIDE OF THE HEART
THE ECG IN LEFT ATRIAL HYPERTROPHY
Left atrial hypertrophy causes a double (bifid) P wave. Left atrial hypertrophy without left ventricular hypertrophy is classically due to mitral stenosis, so the bifid P wave is sometimes called ‘P mitrale’. This is misleading, because most patients whose ECGs have bifid P waves either have left ventricular hypertrophy that is not obvious on the ECG or and perhaps this is more common have a perfectly normal heart. The bifid P wave is thus not a useful measure of left atrial hypertrophy.
Figure 6.3 shows an ECG with a bifid P wave indicating left atrial hypertrophy. This was confirmed by echocardiography in the patient, who also had concentric left ventricular hypertrophy due to hypertension.
Fig. 6.3 Left atrial hypertrophy and left ventricular hypertrophy
Note
Significant mitral stenosis usually but not always leads to atrial fibrillation, in which no P waves, bifid or otherwise, can be seen. Occasional patients, such as the one whose ECG is shown in Figure 6.4, develop pulmonary hypertension and remain in sinus rhythm. There is then a combination of a bifid P wave with evidence of right ventricular hypertrophy. This combination does allow a confident diagnosis of severe mitral stenosis.
THE ECG IN LEFT VENTRICULAR HYPERTROPHY
Left ventricular hypertrophy may be caused by hypertension, aortic stenosis or incompetence, or mitral incompetence.
The ECG features of left ventricular hypertrophy are:
• an increased height of the QRS comple
• inverted T waves in the leads that ‘look at’ the left ventricle I, VL and V5-V6.
[/not-level-membership-for-cardiovascular-category]
