5
The ECG in Healthy Subjects
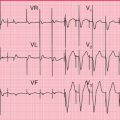
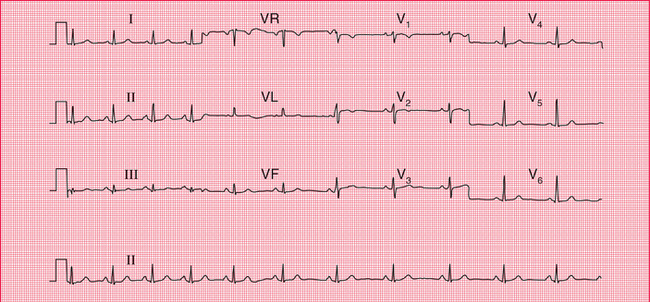
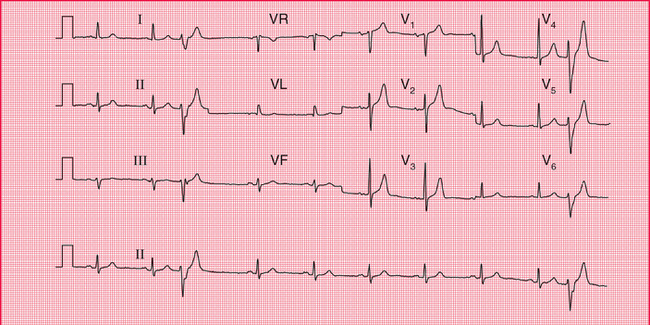
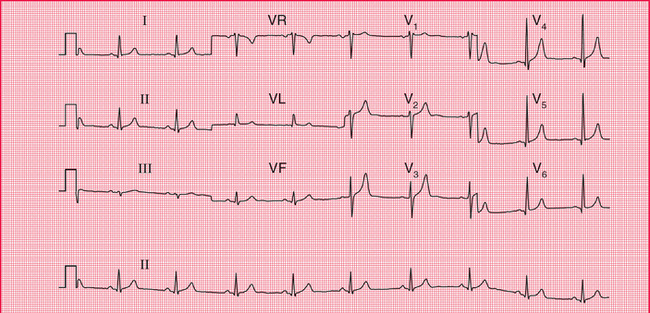
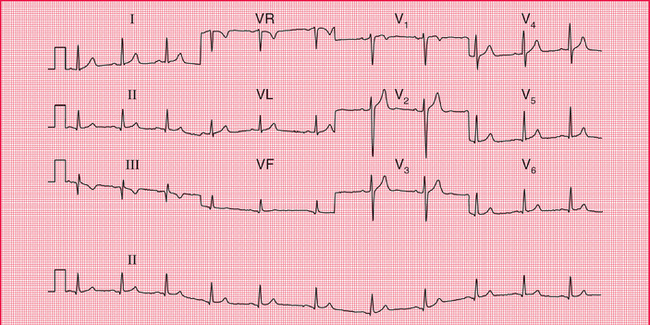
The ECG is frequently used in ‘health screening’, but it is important to remember that not all those who are screened are really asymptomatic – the procedure may be used as an alternative to seeking medical advice. On the other hand, people being screened may be totally free of symptoms and yet important abnormalities may be evident from their ECGs. For example, Figure 5.1 shows the ECG of an asymptomatic patient which, quite unexpectedly, revealed atrial fibrillation. Abnormalities are uncommon in this group of individuals, but perhaps are the best reason for using the ECG in screening. All the ECGs in this chapter came from health screening clinics, and we will assume that the individuals considered themselves to be healthy.
THE NORMAL CARDIAC RHYTHM
Sinus rhythm is the only truly normal rhythm. ‘Sinus bradycardia’ is sometimes said to be present when the heart rate is below 60/min, and ‘sinus tachycardia’ is sometimes used for heart rates above 100/min ( Box 5.1), but these terms are really not helpful, and it is far more useful to describe a patient as having ‘sinus rhythm at x/min’ ( Fig. 5.2).
EXTRASYSTOLES
Supraventricular extrasystoles are of no clinical significance, although atrial extrasystoles need to be differentiated from the variations in beat- to-beat interval which occur in sinus rhythm ( Figs 5.3 and 5.4). Automated ECG reporting often fails to do this.
Occasional ventricular extrasystoles are experienced by many people with normal hearts. Frequent ventricular extrasystoles ( Fig. 5.5) may indicate heart disease, and in a large population their presence does identify a group with a higher than average risk of developing cardiac problems. In an individual patient, however, their presence is not a good predictor of such risk.
ECTOPIC ATRIAL RHYTHM
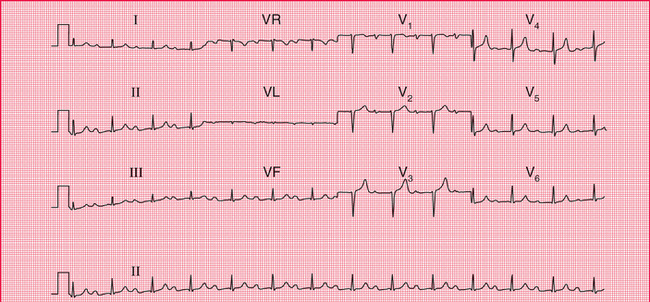
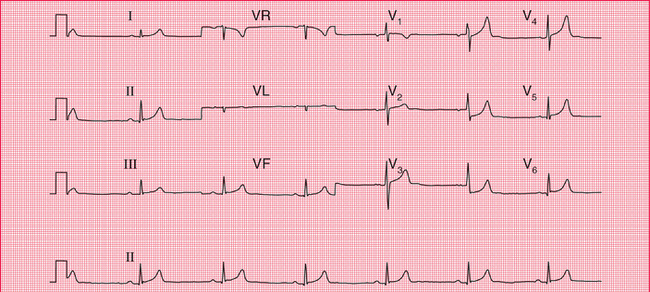
When depolarization is initiated from a focus in the atrium rather than in the sinoatrial node, an ‘ectopic atrial rhythm’ is present ( Fig. 5.6). This does not cause symptoms and is usually of no clinical significance. It is not an uncommon finding in individuals being screened.
THE P WAVE
Tall P waves may be due to right atrial hypertrophy, and are significant if there is evidence of right ventricular hypertrophy as well. Tall P waves alone may indicate tricuspid stenosis, but this is rare. If the patient is well and has no abnormal physical signs, ‘tall’ P waves are probably within the normal limits.
 For an example mitral stenosis, see p. 293
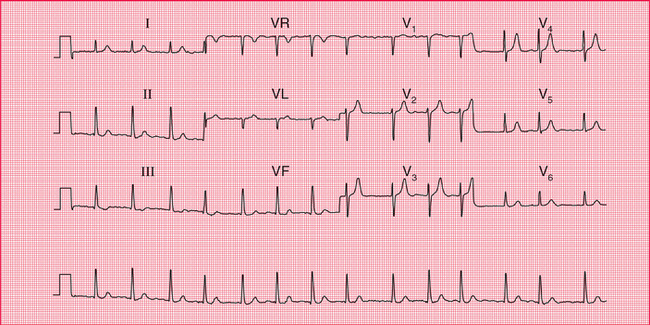
Bifid P waves in the absence of signs of associated left ventricular hypertrophy can indicate mitral stenosis (now fairly rare), but a bifid and not particularly prolonged P wave is often seen in the anterior leads of normal ECGs. Figure 5.7 shows the ECG of an asymptomatic patient with a clinically normal heart.
The P waves of atrial extrasystoles tend to be abnormally shaped compared to the P waves of the sinus beats of the same patient ( Fig. 5.4).
 For more on hyperkalaemia, see p. 331
CONDUCTION
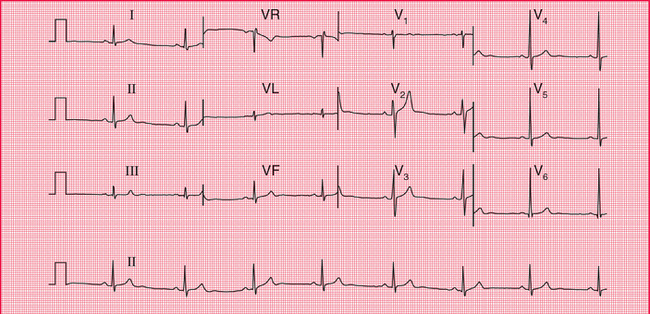
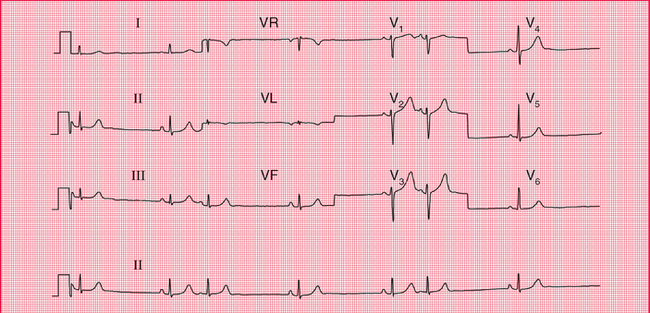
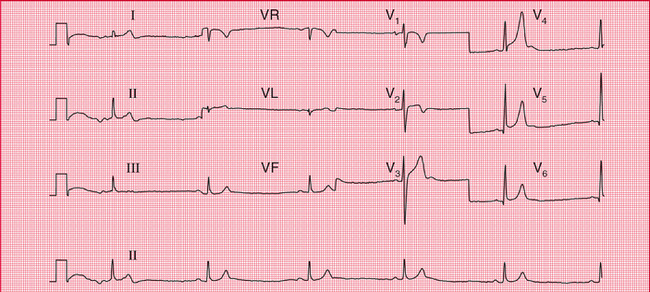
The ECG in Figure 5.8 was recorded from a healthy, asymptomatic individual at a screening examination. Nevertheless, PR interval prolongation to this extent is probably evidence of disease of the conducting tissue.
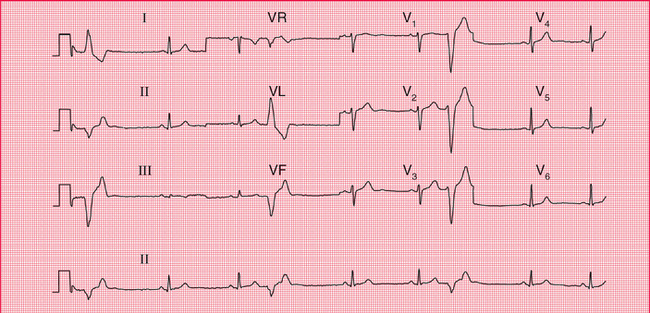
A QRS complex that is predominantly downward (that is, the S wave is greater than the R wave) in leads II and III indicates left axis deviation, and a downward QRS complex in lead II, still within the normal limit of 120 ms, indicates left anterior hemiblock ( Fig. 5.9).
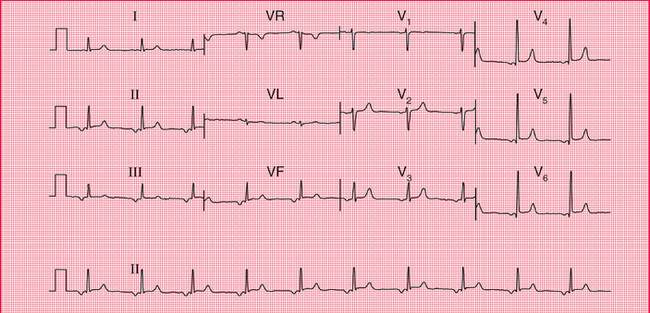
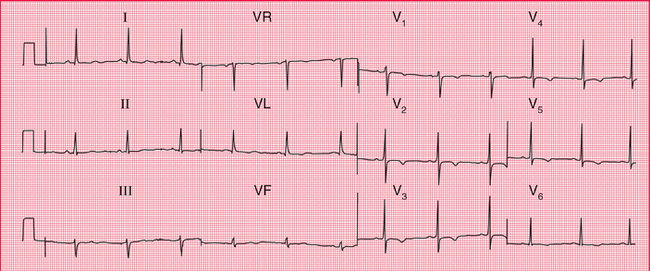
Right axis deviation is indicated if the QRS complexes are predominantly downward in lead I. It is common in healthy subjects, particularly if they are tall, as with the ECG in Figure 5.10, and under these circumstances is unimportant unless there is some other evidence of right ventricular hypertrophy, or the patient has had a myocardial infarction, raising the possibility of left posterior hemiblock.
THE QRS COMPLEX
Depolarization of the whole ventricular muscle mass should occur within 120 ms, so this represents the maximum width of the normal QRS complex. Any widening indicates conduction delay or failure within the bundle branch system, pre-excitation (see below), or a ventricular origin of depolarization – any of which may be seen in healthy subjects.
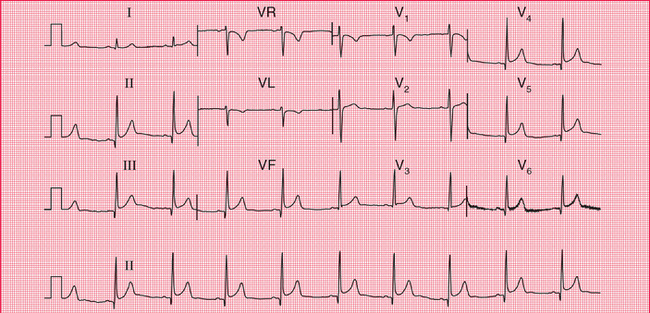
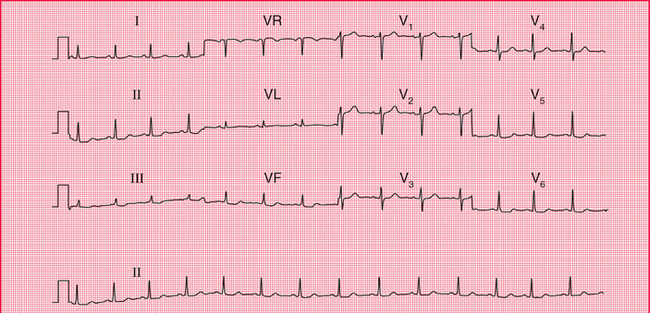
Left bundle branch block is always a sign of heart disease. Right bundle branch block with a QRS complex duration greater than 120 ms is sometimes seen in healthy subjects, but should be taken as a warning of things like an atrial septal defect. Partial (incomplete) right bundle branch block (RSR1 pattern in lead V1, but with a QRS complex duration less than 120 ms; Fig. 5.11) is very common and of no significance ( Box 5.2).
The height of the QRS complex is related to the thickness of heart muscle, but is actually a poor indicator of ventricular hypertrophy.
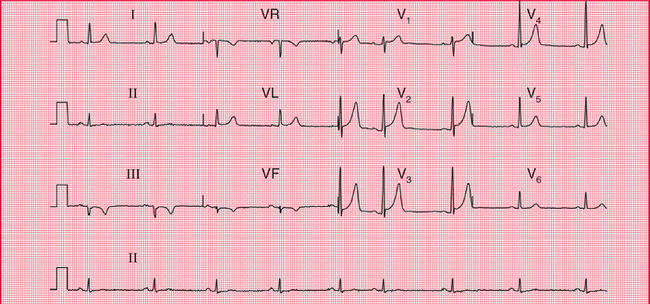
Right ventricular hypertrophy causes a dominant R wave in lead Vj, but unless there are other significant ECG signs (right axis deviation, or T wave inversion in leads V2-V3), this can be a normal variant ( Fig. 5.12).
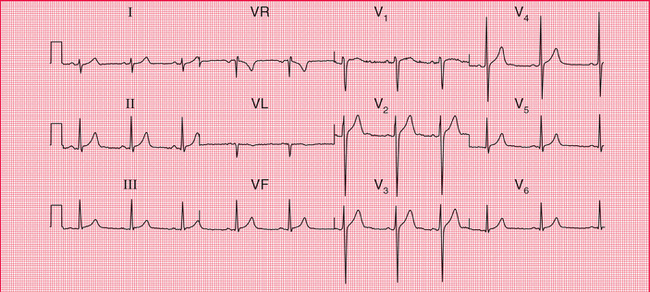
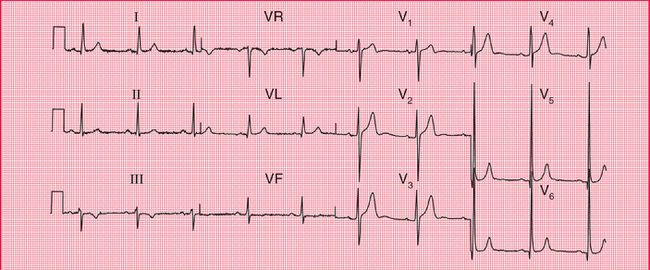
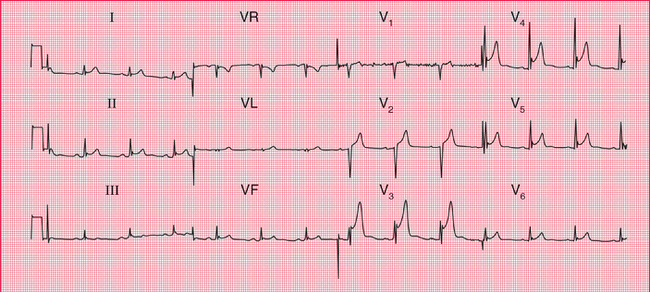
One ECG feature of left ventricular hypertrophy is the increased height of the QRS complex in the leads that ‘look at’ the left ventricle ( Fig. 5.13), the generally accepted upper limit of normality being a QRS complex height of 25 mm in lead V5 or V6. The Sokolow-Lyon criteria define left ventricular hypertrophy as being present when the sum of the R wave height in lead V5 or V6 plus the depth of the S wave in lead V1 exceeds 35 mm. In fact these criteria are unreliable, and a QRS complex height greater than 25 mm is often seen in fit young men. Left ventricular hypertrophy can only be diagnosed with confidence when tall QRS complexes are associated with inverted T waves in the lateral leads (see Ch. 4). This is sometimes referred to as a ‘strain’ pattern, but this term is essentially meaningless.
 For more on left ventricular hypertrophy, see pp. 295–302
Q waves are the hallmark of the fully developed changes of an ST segment elevation myocardial infarction, but they also result from septal depolarization (see p. 17). Narrow Q waves in the inferior and lateral leads ( Fig. 5.14), and sometimes even quite deep ones, may also be perfectly normal.
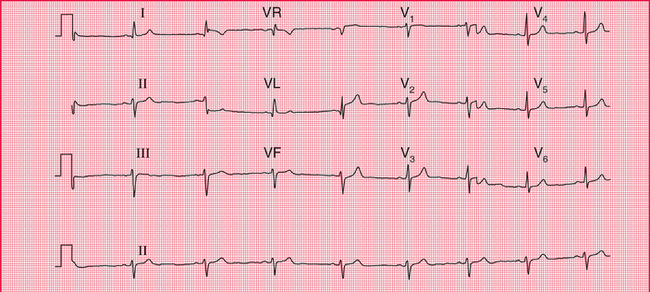
A Q wave in lead III but not in lead VF is likely to be normal, even when associated with an inverted T wave ( Fig. 5.15). These features often disappear if the ECG is repeated with the subject taking and holding in a deep breath.
THE ST SEGMENT
If the ST segment is raised following an S wave it is described as ‘high take-off’, and is a normal variant ( Fig. 5.16); this pattern is typically seen in the anterior leads. It is important to differentiate this from the raised ST segment of an ST segment elevation myocardial infarction.
Horizontal ST segment depression is a sign of ischaemia (see Ch. 4), but minor degrees of depression, often downward-sloping, are seen in the ECGs of normal people, and are best described as ‘nonspecific’ ( Fig. 5.17).
THE T WAVE
The T wave is almost always inverted in lead VR, usually in lead V1 and sometimes in lead III. Occasionally, a normal heart may be associated with an inverted T wave in lead V2, and in black people there may be T wave inversion in leads V3 and V4 as well ( Fig. 5.18). This can lead to an incorrect diagnosis of a non-ST segment elevation myocardial infarction (non-Q wave infarction).
Tall and peaked T waves ( Fig. 5.19) are sometimes seen in the early stages of a myocardial infarction, when they may be described as ‘hyperacute’ changes. Peaked T waves are also associated with hyperkalaemia, but in fact some of the tallest and most peaked T waves are seen in perfectly normal ECGs.
U WAVES
Flat U waves following flat T waves, together with a prolonged QT interval, may be a sign of hypokalaemia. However, the best examples of prominent U waves come from normal people ( Fig. 5.20).
 For more on hypokalaemia, see pp. 331–334
THE ECG IN ATHLETES
Athletes’ ECGs can show a wide variety of changes that could be considered ‘abnormal’ (see Box 5.3).
REMINDERS
THE NORMAL ECG
Limits of normal durations
Rhythm
The cardiac axis
• Normal axis: QRS complexes predominantly upward in leads I, II and III; still normal if the QRS complex is downward in lead III.
• Minor degrees of right and left axis deviation are within the normal range.
QRS complex
• Small Q waves are normal in leads I, VL and V6 (septal Q waves).
• RSR1 pattern in lead V, is normal if the duration is less than 120 ms (partial right bundle branch block).
• R wave is smaller than S wave in lead V1.
• R wave in lead V6 is less than 25 mm.
• R wave in lead V6 plus S wave in lead V1 is less than 35 mm.
ST segment
T wave