[level-membership-for-cardiovascular-category]1
The ECG in Healthy People
For the purposes of this chapter, we shall assume that the subject from whom the ECG was recorded is asymptomatic, and that physical examination has revealed no abnormalities. We need to consider the range of normality of the ECG, but of course we cannot escape from the fact that not all disease causes symptoms or abnormal signs, and a subject who appears healthy may not be so and may therefore have an abnormal ECG. In particular, individuals who present for screening may well have symptoms about which they have not consulted a doctor, so it cannot be assumed that an ECG obtained through a screening programme has come from a healthy subject.
THE ‘NORMAL’ ECG
THE NORMAL CARDIAC RHYTHM
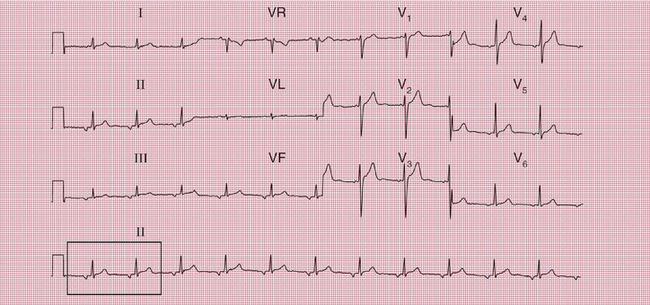
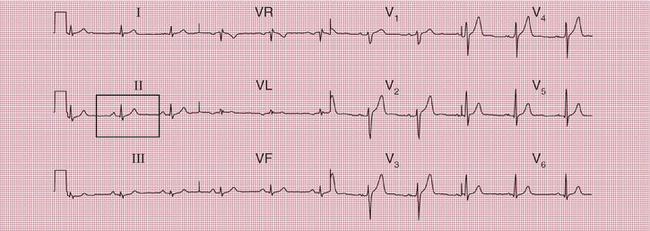
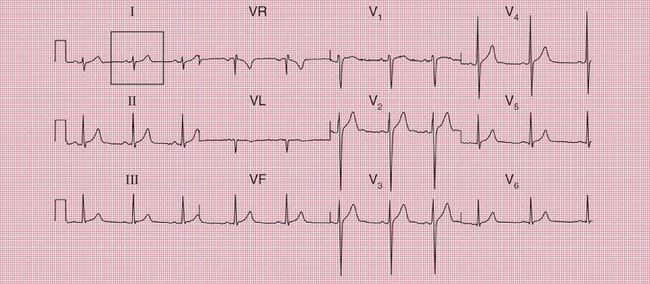
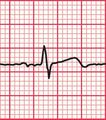
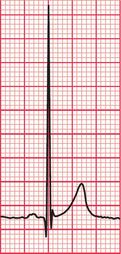
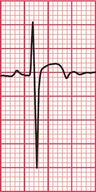
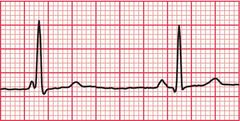
Sinus rhythm is the only normal sustained rhythm. In young people the R-R interval is reduced (i.e. the heartrate is increased) during inspiration, and this is called sinus arrhythmia ( Fig. 1.1). When sinus arrhythmia is marked, it may mimic an atrial arrhythmia. However, in sinus arrhythmia each P-QRS-T complex is normal, and it is only the interval between them that changes.
THE HEART RATE
There is no such thing as a normal heart rate, and the terms ‘tachycardia’ and ‘bradycardia’ should be used with care. There is no point at which a high heart rate in sinus rhythm has to be called ‘sinus tachycardia’ and there is no upper limit for ‘sinus bradycardia’. Nevertheless, unexpectedly fast or slow rates do need an explanation.
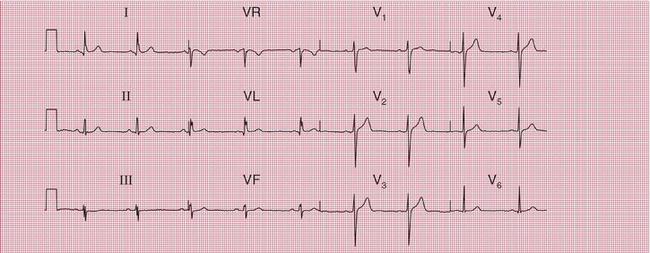
SINUS TACHYCARDIA
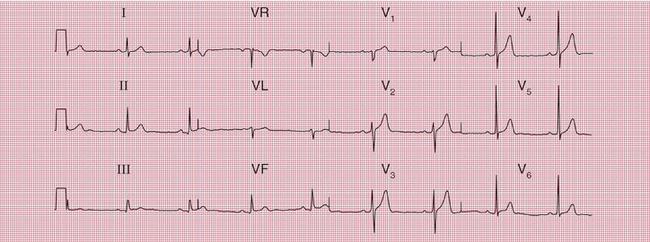
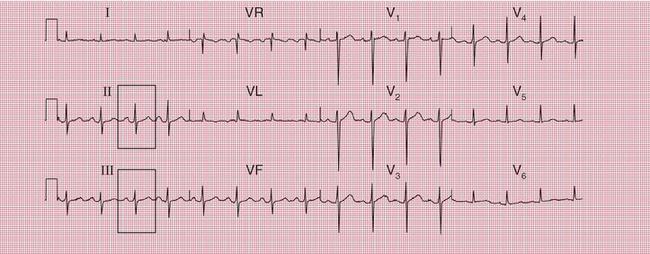
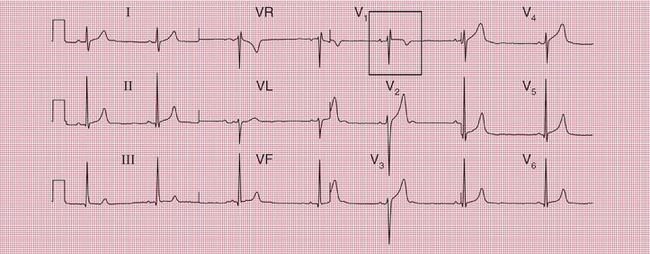
The ECG in Figure 1.2 was recorded from a young woman who complained of a fast heart rate. She had no other symptoms, but was anxious. There were no other abnormalities on examination, and her blood count and thyroid function tests were normal.
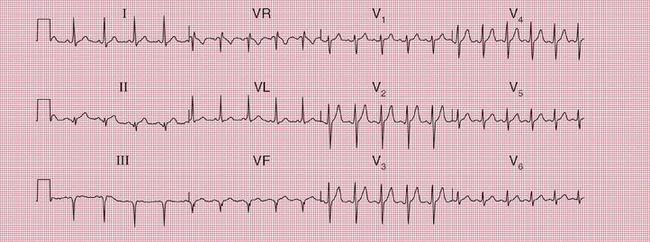
Box 1.1 shows possible causes of sinus rhythm with a fast heart rate.
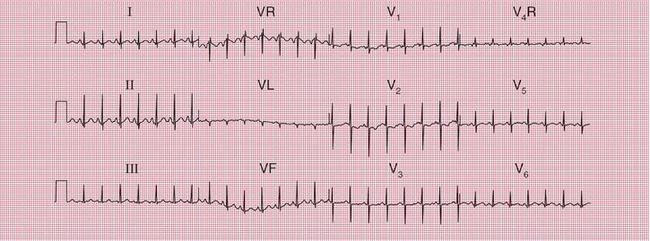
SINUS BRADYCARDIA
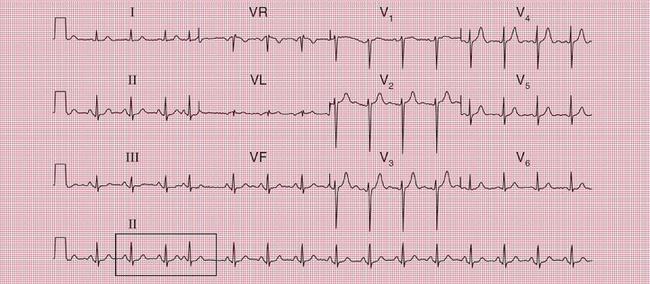
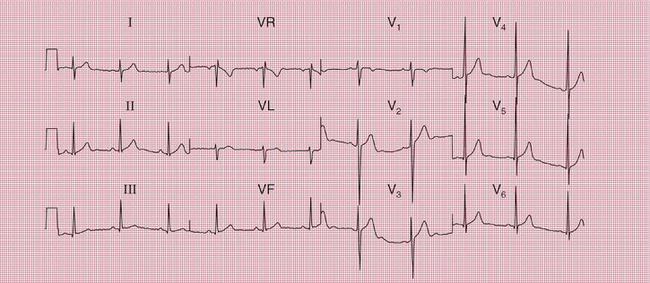
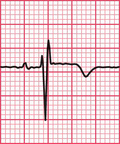
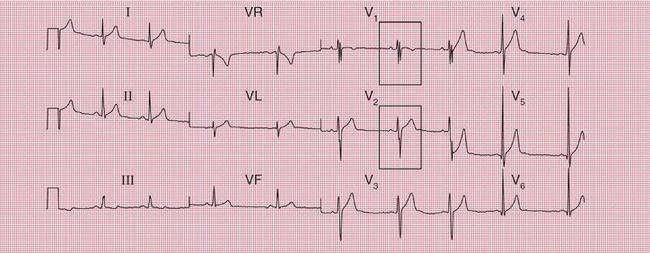
The ECG in Figure 1.3 was recorded from a young professional footballer. His heart rate was 44/min, and at one point the sinus rate became so slow that a junctional escape beat appeared.
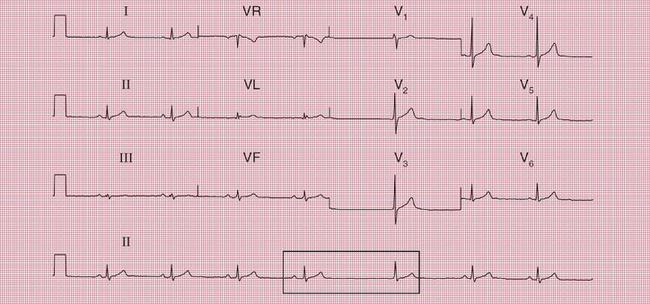
The possible causes of sinus rhythm with a slow heart rate are summarized in Box 1.2.
EXTRASYSTOLES
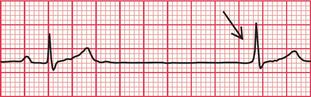
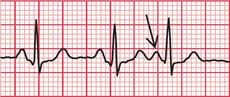
Supraventricular extrasystoles, either atrial or junctional (AV nodal), occur commonly in normal people and are of no significance. Atrial extrasystoles ( Fig. 1.4) have an abnormal P wave; in junctional extra-systoles either there is no P wave or the P wave may follow the QRS complex.
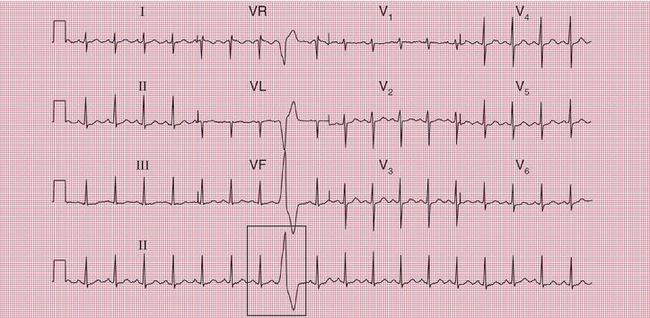
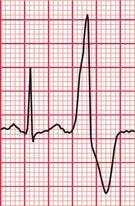
Ventricular extrasystoles are also commonly seen in normal ECGs ( Fig. 1.5).
In healthy people, normal sinus rhythm may be replaced by what are, in effect, repeated atrial extra-systoles. This is sometimes called an ‘ectopic atrial rhythm’ and it is of no particular significance ( Fig. 1.6).
THE P WAVE
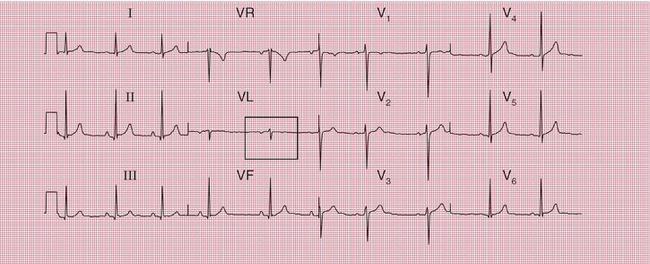
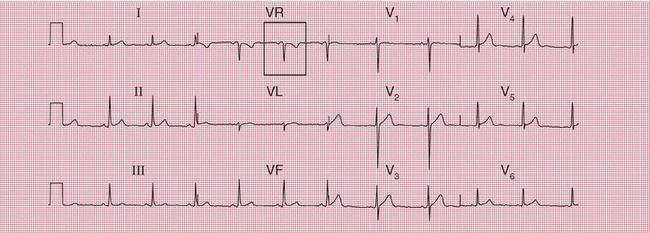
In sinus rhythm, the P wave is normally upright in all leads except VR. When the QRS complex is predominantly downward in lead VL, the P wave may also be inverted ( Fig. 1.7).
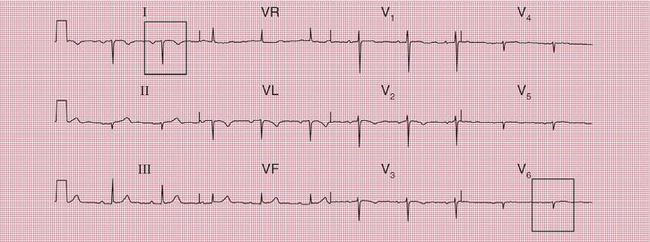
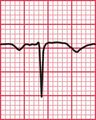
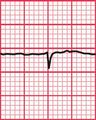
In patients with dextrocardia the P wave is inverted in lead I ( Fig. 1.8). In practice this is more often seen if the limb leads have been wrongly attached, but dextrocardia can be recognized if leads V5 and V6, which normally ‘look at’ the left ventricle, show a predominantly downward QRS complex.
If the ECG of a patient with dextrocardia is repeated with the limb leads reversed, and the chest leads are placed on the right side of the chest instead of the left, in corresponding positions, the ECG becomes like that of a normal patient ( Fig. 1.9).
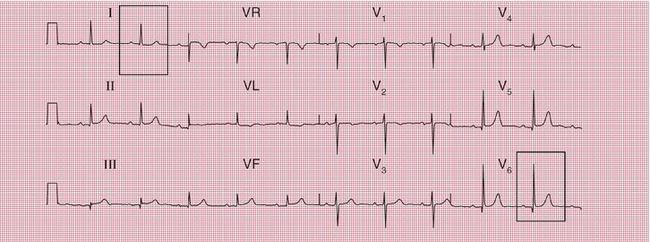
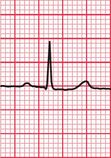
Fig. 1.9 Dextrocardia, leads reversed
Note
A notched or bifid P wave is the hallmark of left atrial hypertrophy, and peaked P waves indicate right atrial hypertrophy – but bifid or peaked P waves can also be seen with normal hearts ( Fig. 1.10).
THE PR INTERVAL
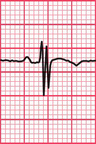
In sinus rhythm, the PR interval is constant and its normal range is 120-200 ms (3-5 small squares of ECG paper) ( Fig. 1.11). In atrial extrasystoles, or ectopic atrial rhythms, the PR interval may be short, and a PR interval of less than 120 ms suggests pre-excitation.
PR interval ‘abnormalities’ will be discussed further in the context of normal people in Chapter 2.
THE QRS COMPLE
THE CARDIAC AXIS
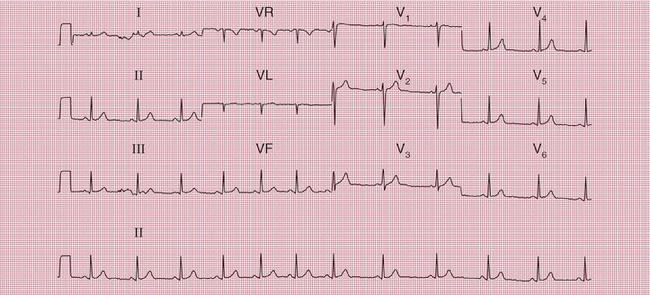
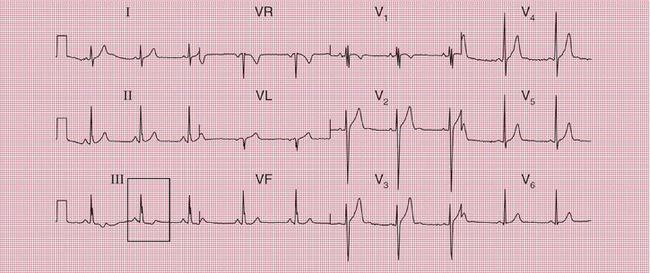
There is a fairly wide range of normality in the direction of the cardiac axis. In most people the QRS complex is tallest in lead II, but in leads I and III the QRS complex is also predominantly upright (i.e. the R wave is greater than the S wave) ( Fig. 1.12).
The cardiac axis is still perfectly normal when the R wave and S wave are equal in lead I: this is common in tall people ( Fig. 1.13).
When the S wave is greater than the R wave in lead I, right axis deviation is present. However, this is very common in perfectly normal people. The ECG in Figure 1.14 is from a professional footballer.
It is common for the S wave to be greater than the R wave in lead III, and the cardiac axis can still be considered normal when the S wave equals the R wave in lead II ( Fig. 1.15). These patterns are common in fat people and during pregnancy.
When the depth of the S wave exceeds the height of the R wave in lead II, left axis deviation is present (see Figs 2.25 and 2.26).
THE SIZE OF R AND S WAVES IN THE CHEST LEADS
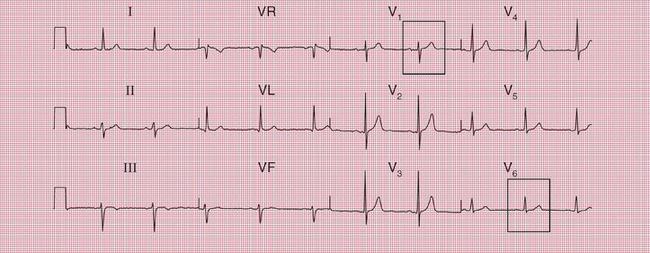
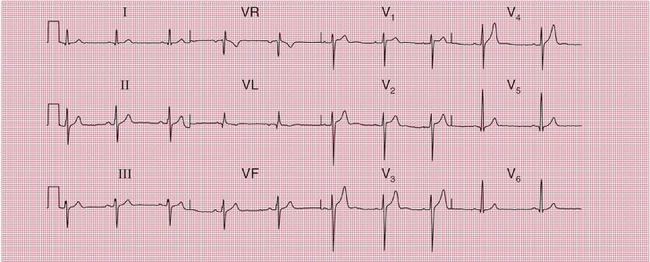
In lead V1 there should be a small R wave and a deep S wave, and the balance between the two should change progressively from V1 to V6. In lead V6 there should be a tall R wave and no S wave ( Fig. 1.16).
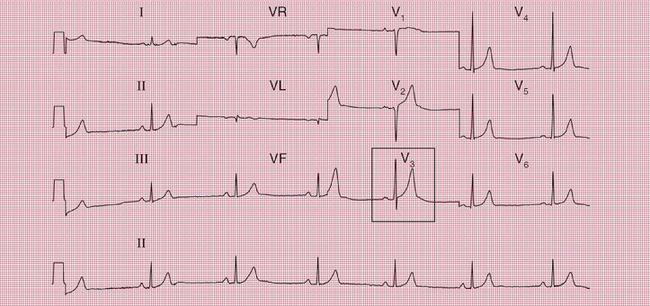
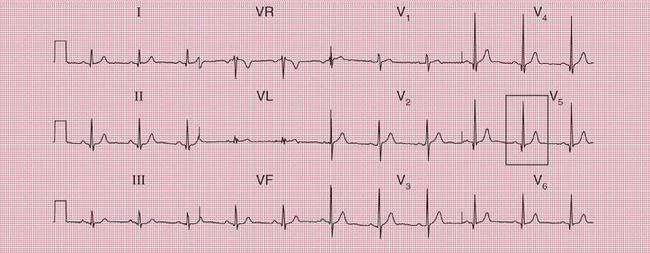
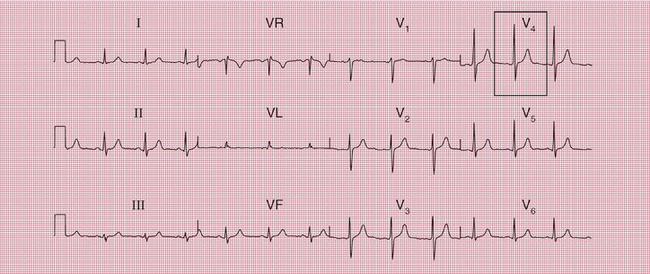
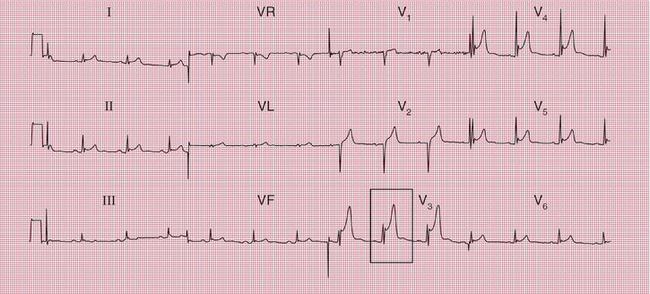
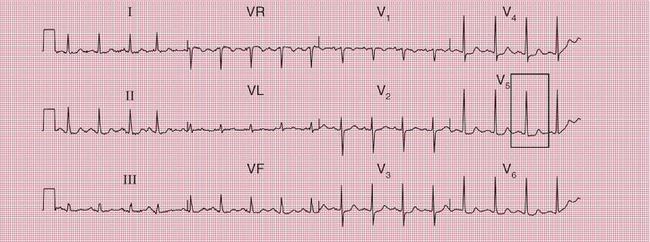
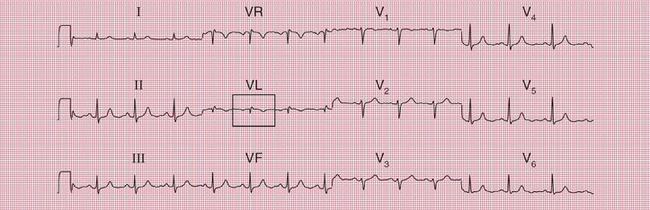
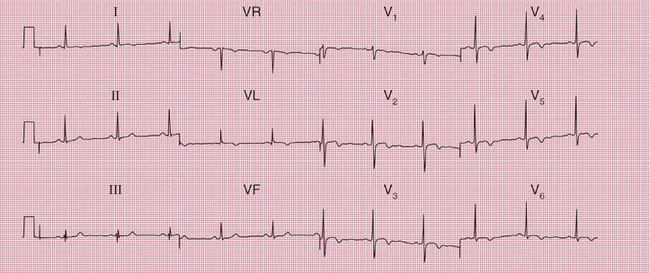
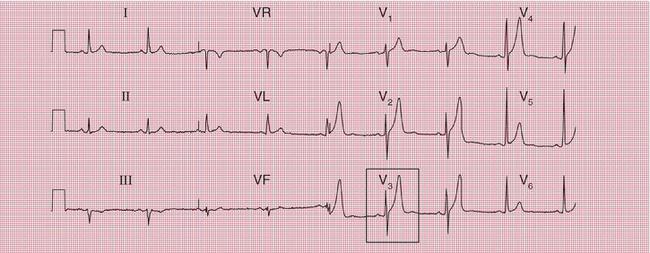
Typically the ‘transition point’, when the R and S waves are equal, is seen in lead V3 or V4 but there is quite a lot of variation. Figure 1.17 shows an ECG in which the transition point is somewhere between leads V3 and V4.
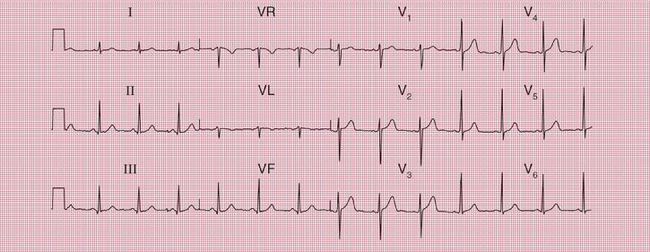
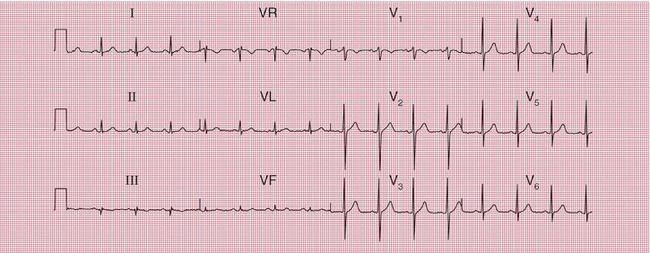
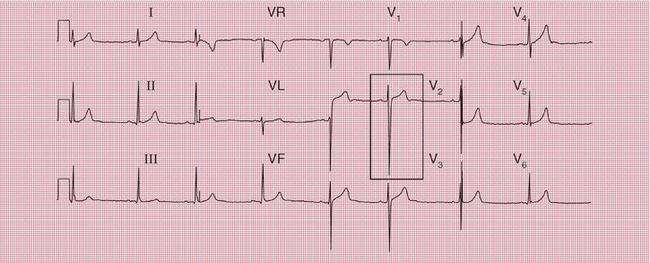
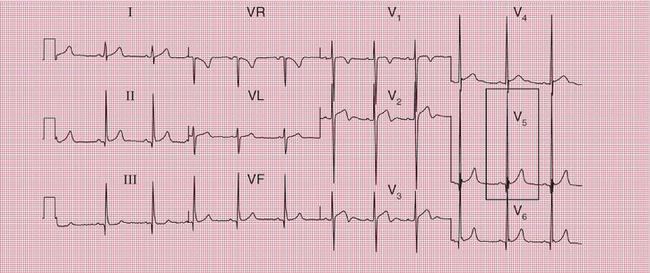
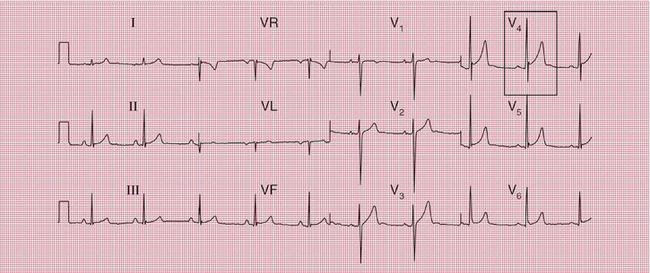
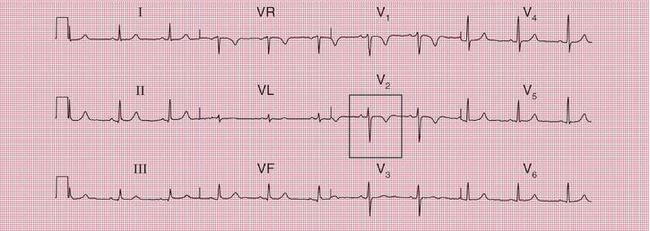
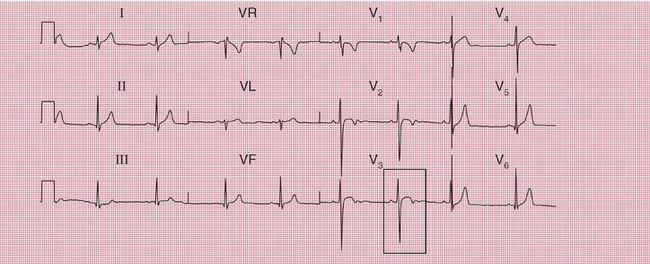
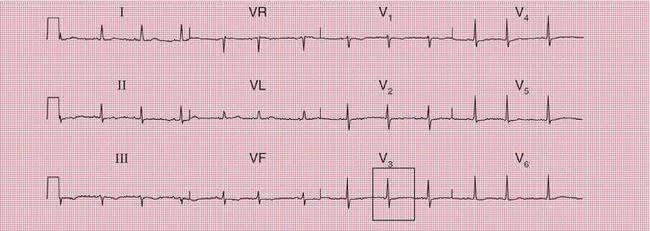
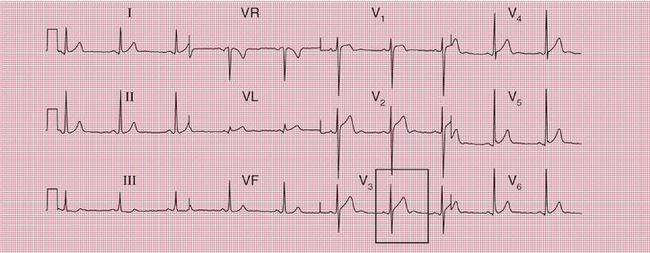
Figure 1.18 shows an ECG with a transition point between leads V4 and V5, and Figure 1.19 shows an ECG with a transition point between leads V2 and V3.
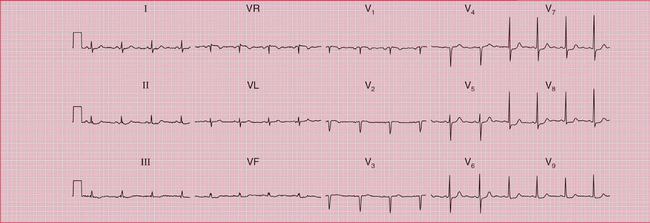
The transition point is typically seen in lead V5 or even V6 in patients with chronic lung disease (see Ch. 6), and this is called ‘clockwise rotation’. In extreme cases, the chest lead needs to be placed in the posterior axillary line, or even further round to the back (leads V7-V9) before the transition point is demonstrated. A similar ECG pattern may be seen in patients with an abnormal chest shape, particularly when depression of the sternum shifts the mediastinum to the left, although in this case the term ‘clockwise rotation’ is not used. The patient from whom the ECG in Figure 1.20 was recorded had mediastinal shift.
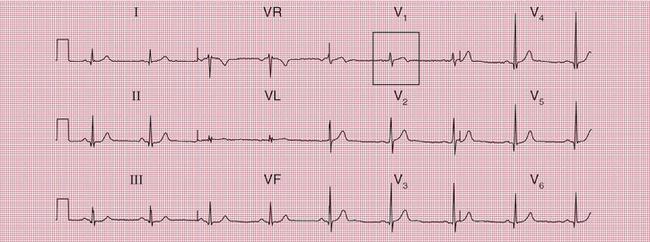
Occasionally the ECG of a totally normal subject will show a ‘dominant’ R wave (i.e. the height of the R wave exceeds the depth of the S wave) in lead V1. There will thus, effectively, be no transition point, and this is called ‘counterclockwise rotation’. The ECG in Figure 1.21 was recorded from a healthy footballer with a normal heart. However, a dominant R wave in lead V1 is usually due to either right ventricular hypertrophy (see Ch. 6) or a true posterior infarction (see Ch. 5).
Although the balance between the height of the R wave and the depth of the S wave is significant for the identification of cardiac axis deviation, or right ventricular hypertrophy, the absolute height of the R wave provides little useful information. Provided that the ECG is properly calibrated (1 mV causes 1 cm of vertical deflection on the ECG), the limits for the sizes of the R and S waves in normal subjects are usually said to be:
• 25 mm for the R wave in lead V5 or V6
• 25 mm for the S wave in lead V1 or V2
• Sum of R wave in lead V5 or V6 plus S wave in lead V1 or V2 should be less than 35 mm.
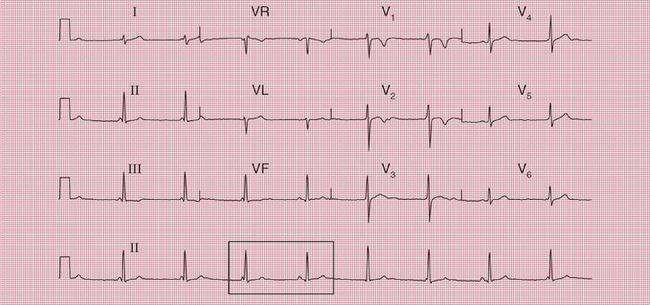
However, R waves taller than 25 mm are commonly seen in leads V5-V6 in fit and thin young people, and are perfectly normal. Thus, these ‘limits’ are not helpful. The ECGs in Figures 1.22 and 1.23 were both recorded from fit young men with normal hearts.
THE WIDTH OF THE QRS COMPLE
The QRS complex should be less than 120 ms in duration (i.e. less than 3 small squares) in all leads. If it is longer than this, then either the ventricles have been depolarized from a ventricular rather than a supraventricular focus (i.e. a ventricular rhythm is present), or there is an abnormality of conduction within the ventricles. The latter is most commonly due to bundle branch block. An RSR1 pattern, resembling that of right bundle branch block but with a narrow QRS complex, is sometimes called ‘partial right bundle branch block’ and is a normal variant ( Fig. 1.24). An RSRV pattern is also a normal variant ( Fig. 1.25), and is sometimes called a ‘splintered’ complex.
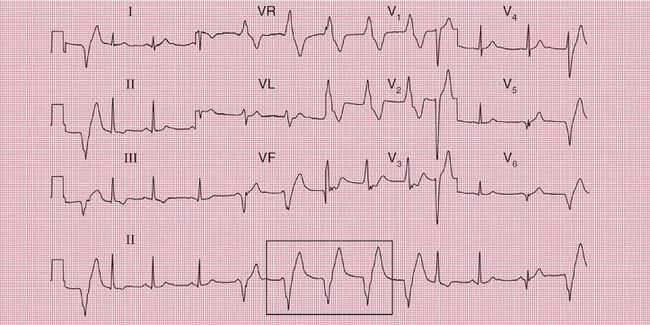
In perfectly normal hearts the normal rhythm may be replaced by an accelerated idioventricular rhythm, which looks like a run of regular ventricular extra-systoles, with wide QRS complexes ( Fig. 1.26).
Q WAVES
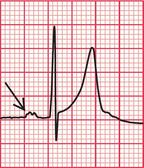
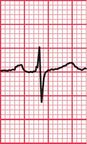
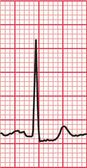
The normal depolarization of the interventricular septum from left to right causes a small ‘septal’ Q wave in any of leads II, VL or V5-V6. Septal Q waves are usually less than 3 mm deep and less than 1 mm across ( Fig. 1.27).
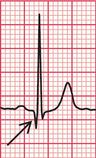
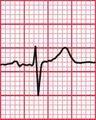
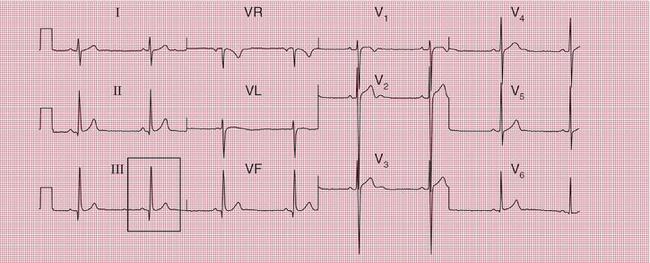
A small Q wave is also common in lead III in normal people, in which case it is always narrow but can be more than 3 mm deep. Occasionally there will be a similar Q wave in lead VF ( Fig. 1.28). These ‘normal’ Q waves become much less deep, and may disappear altogether, on deep inspiration (see Fig. 1.36).
THE ST SEGMENT
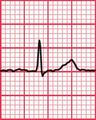
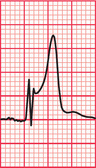
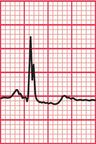
The ST segment (the part of the ECG between the S wave and the T wave) should be horizontal and ‘isoelectric’, which means that it should be at the same level as the baseline of the record between the end of the T wave and the next P wave. However, in the chest leads the ST segment often slopes upwards and is not easy to define ( Fig. 1.29).
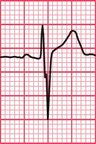
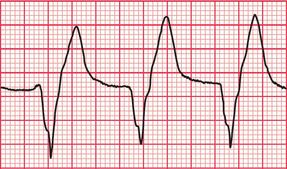
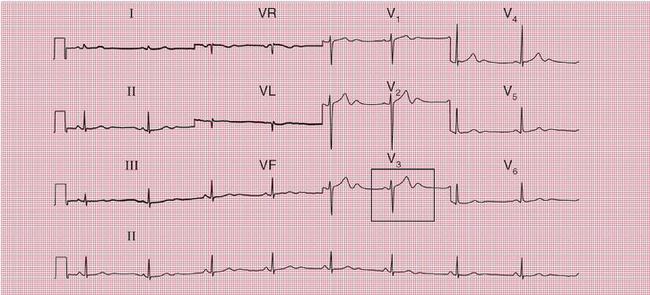
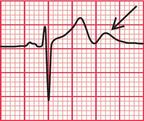
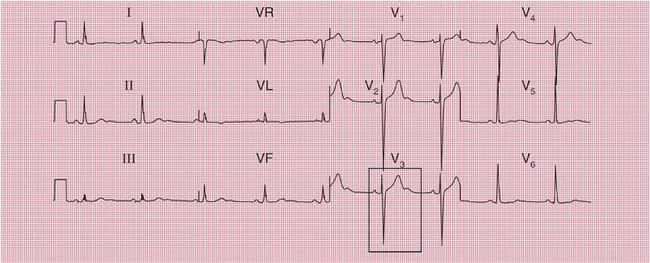
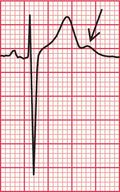
An elevation of the ST segment is the hallmark of an acute myocardial infarction (see Ch. 5), and depression of the ST segment can indicate ischaemia or the effect of digoxin. However, it is perfectly normal for the ST segment to be elevated following an S wave in leads V2-V5. This is sometimes called a ‘high take-off ST segment’. The ECGs in Figures 1.30 and 1.31 were recorded from perfectly healthy young men.
The ST segment is apparently raised when there is ‘early repolarization’, which causes the ST segment to be arched, and is usually only seen in the anterior leads, not the limb leads (see Fig. 1.39).
Box 1.3 shows the possible causes of ST segment elevation, other than myocardial infarction.
ST segment depression is measured relative to the baseline (between the T and P waves), 60-80 ms after the ‘J’ point, which is the point of inflection at the junction of the S wave and the ST segment. Minor depression of the ST segment is not uncommon in normal people, and is then called ‘nonspecific’; theadvantage of using this word is that it leaves the way open for a later change of diagnosis. ST segment depression in lead III but not VF is likely to be nonspecific ( Fig. 1.32). Nonspecific ST segment depression should not be more than 2 mm ( Fig. 1.33), and the segment often slopes upwards. Horizontal ST segment depression of more than 2 mm indicates ischaemia (see Ch. 5).
THE T WAVE
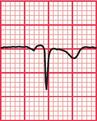
In a normal ECG the T wave is always inverted in lead VR, and often in lead V1, but is usually upright in all the other leads ( Fig. 1.34).
The T wave is also often inverted in lead III but not VF. However, its inversion in lead III may be reversed on deep inspiration ( Figs 1.35 and 1.36).
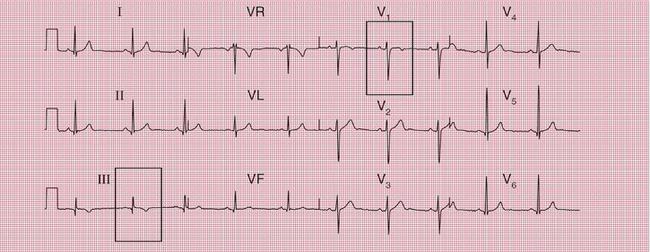
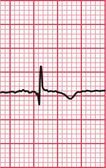
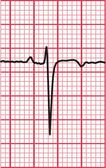
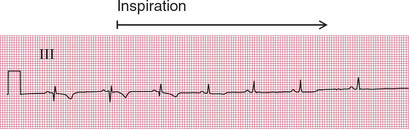
Fig 1.36 Normal ECG during inspiration
Note
• ECG recorded from same patient as in Figure 1.35, but during deep inspiration
T wave inversion in lead VL as well as in VR can be normal, particularly if the P wave in lead VL is inverted. The ECG in Figure 1.37 was recorded from a completely healthy young woman.

T wave inversion in leads V2-V3 as well as in V1 occurs in pulmonary embolism and in right ventricular hypertrophy (see Chs 5 and 6) but it can be a normal variant. This is particularly true in black people. The ECG in Figure 1.38 was recorded from a healthy young white man, and that shown in Figure 1.39 from a young black professional footballer. The ECG in Figure 1.40 was recorded from a middle-aged black woman with rather nonspecific chest pain, whose coronary arteries and left ventricle were shown to be entirely normal on catheterization.
Box 1.4 summarizes the situations in which T wave inversion is seen.
Generalized flattening of the T waves with a normal QT interval is best described as ‘nonspecific’. In a patient without symptoms and whose heart is clinically normal, the finding has little prognostic significance. This was the case with the patient whose ECG is shown in Figure 1.41. In patients with symptoms suggestive of cardiovascular disease, however, such an ECG would require further investigation.
Peaked T waves are one of the features of hyper-kalaemia, but they can also be very prominent in healthy people ( Fig. 1.42). Tall and peaked T waves are sometimes seen in the early stages of a myocardial infarction, when they are described as ‘hyperacute’. They are, however, an extremely unreliable sign of infarction.
An extra hump on the end of the T wave, a ‘U’ wave, is characteristic of hypokalemia. However, U waves are commonly seen in the anterior chest leads of normal ECGs ( Fig. 1.43), where they can be remarkably prominent ( Fig. 1.44). It is thought that they represent repolarization of the papillary muscles. A U wave is probably only important if it follows a flat T wave.
THE QT INTERVAL
The QT interval (from the Q wave to the end of the T wave) varies with the heart rate, gender and time of day. There are several different ways of correcting the QT interval for heart rate, but the simplest is Bazett’s formula. In this, the corrected QT interval (QTC) is calculated by:
THE ECG IN ATHLETES
Any of the normal variations discussed above can be found in athletes. There can be changes in rhythm and/or ECG pattern, and the ECGs of athletes mayalso show some features that might be considered abnormal in non-athletic subjects, but are normal in athletes (see Box 1.5). Figure 1.45 shows the short and varying PR interval of an ‘accelerated idionodal rhythm’ (also known as a ‘wandering atrial pacemaker’). Here the sinus node rate has slowed, and the heart rate is controlled by the AV node, which is discharging faster than the SA node.
The ECGs in Figures 1.45, 1.46 and 1.47 were all recorded during the screening examinations of healthy young footballers.
THE ECG IN PREGNANCY
Minor changes in the ECG are commonly seen in pregnancy (see Box 1.6). Ventricular extrasystoles are almost universal.
THE ECG IN CHILDREN
At birth, the muscle of the right ventricle is as thick as that of the left ventricle. The ECG of a normal child in the first year of life has a pattern that would indicate right ventricular hypertrophy in an adult. The ECG in Figure 1.48 was recorded from a normal 1-month-old child.
The ECG changes associated with childhood are summarized in Box 1.7.
WHAT TO DO
1. Does the ECG really come from that individual? If so, is he or she really asymptomatic and are the findings of the physical examination really normal?
2. Is the ECG really abnormal or is it within the normal range?
3. If the ECG is indeed abnormal, what are the implications for the patient?
THE RANGE OF NORMALITY
Box 1.8 lists some of the ECG patterns that can be accepted as normal in healthy patients, and some that must be regarded with suspicion.
THE PROGNOSIS OF PATIENTS WITH AN ABNORMAL ECG
CONDUCTION DEFECTS
Left anterior hemiblock has a good prognosis, as does right bundle branch block (RBBB). The presence of left bundle branch block (LBBB) in the absence of other manifestations of cardiac disease is associated with about a 30% increase in the risk of death compared with that of individuals with a normal ECG. The risk of death doubles if a subject known to have a normal ECG suddenly develops LBBB, even if there are no symptoms – the ECG change presumably indicates progressive cardiac disease, probably most often ischaemia. Bifascicular block seldom progresses to complete block, but is always an indication of underlying heart disease – the prognosis is therefore relatively poor compared to that of patients with LBBB alone.
FURTHER INVESTIGATIONS
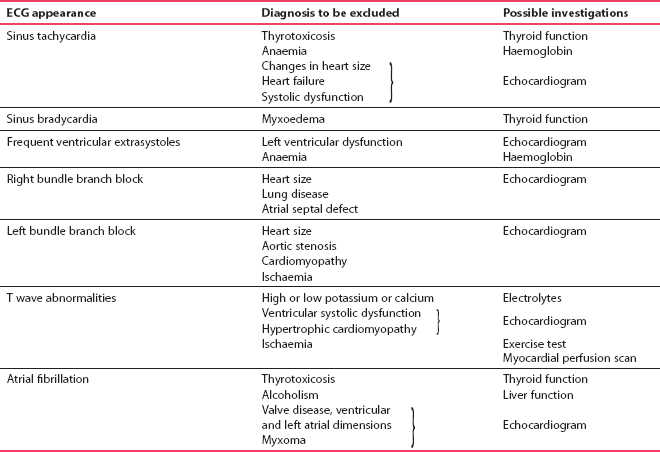
Complex and expensive investigations are seldom justified in asymptomatic patients whose hearts are clinically normal, but who have been found to have an abnormal ECG.
Table 1.1 shows investigations that should be considered in the case of various cardiac rhythms and indicates which underlying diseases may be present.
[/level-membership-for-cardiovascular-category][not-level-membership-for-cardiovascular-category]1
The ECG in Healthy People
For the purposes of this chapter, we shall assume that the subject from whom the ECG was recorded is asymptomatic, and that physical examination has revealed no abnormalities. We need to consider the range of normality of the ECG, but of course we cannot escape from the fact that not all disease causes symptoms or abnormal signs, and a subject who appears healthy may not be so and may therefore have an abnormal ECG. In particular, individuals who present for screening may well have symptoms about which they have not consulted a doctor, so it cannot be assumed that an ECG obtained through a screening programme has come from a healthy subject.
THE ‘NORMAL’ ECG
THE NORMAL CARDIAC RHYTHM
Sinus rhythm is the only normal sustained rhythm. In young people the R-R interval is reduced (i.e. the heartrate is increased) during inspiration, and this is called sinus arrhythmia ( Fig. 1.1). When sinus arrhythmia is marked, it may mimic an atrial arrhythmia. However, in sinus arrhythmia each P-QRS-T complex is normal, and it is only the interval between them that changes.
THE HEART RATE
There is no such thing as a normal heart rate, and the terms ‘tachycardia’ and ‘bradycardia’ should be used with care. There is no point at which a high heart rate in sinus rhythm has to be called ‘sinus tachycardia’ and there is no upper limit for ‘sinus bradycardia’. Nevertheless, unexpectedly fast or slow rates do need an explanation.
SINUS TACHYCARDIA
The ECG in Figure 1.2 was recorded from a young woman who complained of a fast heart rate. She had no other symptoms, but was anxious. There were no other abnormalities on examination, and her blood count and thyroid function tests were normal.
Box 1.1 shows possible causes of sinus rhythm with a fast heart rate.
SINUS BRADYCARDIA
The ECG in Figure 1.3 was recorded from a young professional footballer. His heart rate was 44/min, and at one point the sinus rate became so slow that a junctional escape beat appeared.
The possible causes of sinus rhythm with a slow heart rate are summarized in Box 1.2.
EXTRASYSTOLES
Supraventricular extrasystoles, either atrial or junctional (AV nodal), occur commonly in normal people and are of no significance. Atrial extrasystoles ( Fig. 1.4) have an abnormal P wave; in junctional extra-systoles either there is no P wave or the P wave may follow the QRS complex.
Ventricular extrasystoles are also commonly seen in normal ECGs ( Fig. 1.5).
In healthy people, normal sinus rhythm may be replaced by what are, in effect, repeated atrial extra-systoles. This is sometimes called an ‘ectopic atrial rhythm’ and it is of no particular significance ( Fig. 1.6).
THE P WAVE
In sinus rhythm, the P wave is normally upright in all leads except VR. When the QRS complex is predominantly downward in lead VL, the P wave may also be inverted ( Fig. 1.7).
In patients with dextrocardia the P wave is inverted in lead I ( Fig. 1.8). In practice this is more often seen if the limb leads have been wrongly attached, but dextrocardia can be recognized if leads V5 and V6, which normally ‘look at’ the left ventricle, show a predominantly downward QRS complex.
If the ECG of a patient with dextrocardia is repeated with the limb leads reversed, and the chest leads are placed on the right side of the chest instead of the left, in corresponding positions, the ECG becomes like that of a normal patient ( Fig. 1.9).
Fig. 1.9 Dextrocardia, leads reversed
Note
A notched or bifid P wave is the hallmark of left atrial hypertrophy, and peaked P waves indicate right atrial hypertrophy – but bifid or peaked P waves can also be seen with normal hearts ( Fig. 1.10).
THE PR INTERVAL
In sinus rhythm, the PR interval is constant and its normal range is 120-200 ms (3-5 small squares of ECG paper) ( Fig. 1.11). In atrial extrasystoles, or ectopic atrial rhythms, the PR interval may be short, and a PR interval of less than 120 ms suggests pre-excitation.
PR interval ‘abnormalities’ will be discussed further in the context of normal people in Chapter 2.
THE QRS COMPLE
THE CARDIAC AXIS
There is a fairly wide range of normality in the direction of the cardiac axis. In most people the QRS complex is tallest in lead II, but in leads I and III the QRS complex is also predominantly upright (i.e. the R wave is greater than the S wave) ( Fig. 1.12).
The cardiac axis is still perfectly normal when the R wave and S wave are equal in lead I: this is common in tall people ( Fig. 1.13).
When the S wave is greater than the R wave in lead I, right axis deviation is present. However, this is very common in perfectly normal people. The ECG in Figure 1.14 is from a professional footballer.
It is common for the S wave to be greater than the R wave in lead III, and the cardiac axis can still be considered normal when the S wave equals the R wave in lead II ( Fig. 1.15). These patterns are common in fat people and during pregnancy.
When the depth of the S wave exceeds the height of the R wave in lead II, left axis deviation is present (see Figs 2.25 and 2.26).
THE SIZE OF R AND S WAVES IN THE CHEST LEADS
In lead V1 there should be a small R wave and a deep S wave, and the balance between the two should change progressively from V1 to V6. In lead V6 there should be a tall R wave and no S wave ( Fig. 1.16).
Typically the ‘transition point’, when the R and S waves are equal, is seen in lead V3 or V4 but there is quite a lot of variation. Figure 1.17 shows an ECG in which the transition point is somewhere between leads V3 and V4.
Figure 1.18 shows an ECG with a transition point between leads V4 and V5, and Figure 1.19 shows an ECG with a transition point between leads V2 and V3.
[/not-level-membership-for-cardiovascular-category]
