Chapter 12. The cardiovascular system and the ECG
Blood
The normal circulating blood volume is variable, but in a 70 kg adult it is about 5 L (equivalent to about 70 mL/kg body weight).
Cardiac cycle
• The adult human heart beats about 70 times/min at rest
• One heartbeat within a single cardiac cycle therefore lasts about 0.8 seconds or 800 milliseconds (ms)
• The phase of contraction is called systole, the phase of relaxation is called diastole.
Cardiac output
Cardiac output is defined as the volume of blood ejected by each ventricle per minute. Cardiac output is calculated by multiplying the heart rate by the stroke volume (volume ejected per heart beat).
Cardiac output = stroke volume × heart rate
Stroke volume
Three factors determine stroke volume:
1. Preload – the filling of the heart during diastole
2. Afterload – the resistance in the arterial circulation against which the heart has to pump
3. Contractility – the intrinsic performance of the heart muscle at a given preload and afterload.
Regulation of heart rate
• Heart rate <60 bradycardia
• Heart rate >100 tachycardia.
The parasympathetic system, via the vagus nerve, slows the heart rate down. Atropine blocks the vagus nerve thereby increasing the heart rate.
The sympathetic nervous system tends to speed heart rate up and β-blocking drugs (e.g. propranolol or atenolol) prevent tachycardia by blocking the sympathetic nerves.
Adrenaline and noradrenaline are released from the adrenal glands and increase both heart rate and contractility.
Blood pressure
Blood pressure is determined by the cardiac output and the peripheral vascular resistance. The vascular resistance will fall in conditions such as severe anaphylaxis.
Electrocardiography
The ECG gives information about the electrical activity of the heart and can predict problems such as myocardial infarction. It does not enable any conclusions to be made about mechanical activity of the heart such as force of contraction or blood pressure.
Electrocardiograms are conventionally recorded from 12 leads. This is achieved by placing electrodes on the right arm, left arm and left leg, as well as six electrodes in predefined locations on the chest and a ground reference on the right leg. The position of these leads is described in degrees clockwise from lead I (0°); thus lead aVF is 90°, lead III is 120° and lead aVR is 210°. It is apparent, therefore, that leads II, III and aVF ‘look at’ the undersurface of the heart – these are the inferior leads. Lead aVL ‘looks at’ the heart from ‘above’ (i.e. from the left shoulder).
ECG recording paper
• The ECG machine, or the printer of a defibrillator or ECG monitor, runs with a paper speed of 25 mm per second
• The graph paper is divided into small squares of side 1 mm. A large square consists of five small squares and measures 5 mm × 5 mm
• At the standard paper speed, each small square (1 mm) represents 0.04 seconds and each large square (5 mm) represents 0.20 seconds
• The amplitude of the electrical impulse is indicated along the vertical axis. A 10 mm deflection (two large squares) represents a 1 mV electrical signal provided that the ECG machine is properly calibrated.
• The horizontal axis of the ECG trace is time
• One small square equals 0.04 seconds
• One large square equals 0.20 seconds.
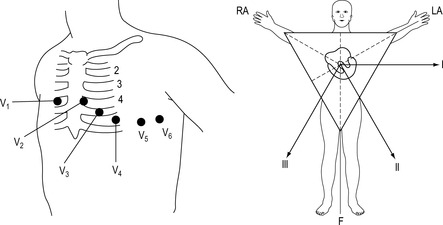 |
| Figure 12.1. |
| Chest and limb lead placement. |
Components of the ECG
P. wave
The P wave represents depolarisation of the atria and in lead II is a small positive (upward) deflection which precedes each QRS complex.
QRS complex
The QRS complex represents depolarisation of the ventricles. It consists of one or more waves.
• R wave: any positive deflection
• Q wave: any negative deflection preceding an R wave
• S wave: any negative deflection following an R wave.
The duration of a normal QRS complex is less than 0.12 seconds (less than three small squares) in adults. The height or amplitude is variable from 2 mm to 15 mm. The QRS complex in lead II usually shows a large positive (upward) R wave.
T. wave
The T wave represents repolarisation of the ventricles and is positive (upright) in lead II. Its duration is variable (0.10–0.25 second) and its amplitude is less than 5 mm.
PR interval
The PR interval represents the time it takes for an electrical impulse generated in the SA node to reach the ventricles via the AV node and bundle branches. The PR interval begins with the onset of the P wave and terminates at the onset of the QRS complex. The duration of the PR interval is normally 0.12–0.20 seconds (3–5 small squares). A normal PR interval indicates that no conduction delay has occurred between the SA node through the AV node and bundle of His.
ST segment
The ST segment represents the interval between ventricular depolarisation and repolarisation of the ventricles. It stretches from the end of the S wave or QRS complex to the beginning of the T wave. Normally, the ST segment is flat or identical with the isoelectric line.
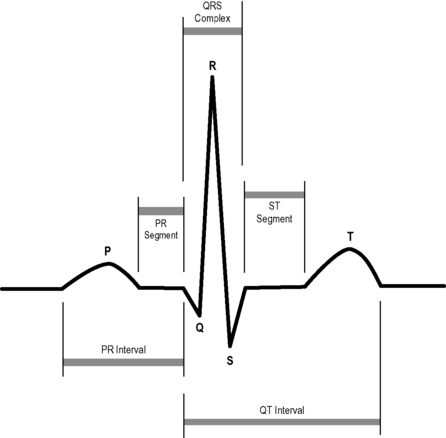 |
| Figure 12.2. |
| The P wave and QRS complexes and the PR interval. |
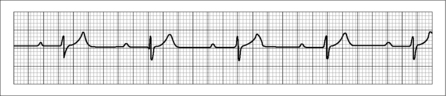
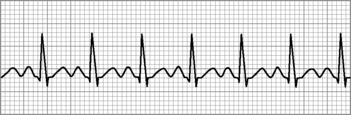 |
| Figure 12.3. |
| Sinus tachycardia. |
Systematic analysis of the ECG
Step 1: Determine the heart rate
The heart rate is most easily calculated by dividing 300 by the number of large squares between two consecutive R waves of QRS complexes, the RR interval.
Step 2: Determine the heart rhythm
The heart rhythm is determined by comparing the length of several RR intervals on a sufficiently long strip of the ECG trace. The heart rhythm is regular if the distances between R waves counted in large or small squares are equal. Irregular rhythms can be either ‘regularly irregular’ or ‘irregularly irregular’. The latter describes a rhythm where the QRS complexes occur in totally haphazard fashion.
Step 3: Analyse the P waves
In sinus rhythm, there is a P wave before each QRS complex. In atrial fibrillation, P waves are absent. In atrial flutter the P wave rate is about 300/min and appears as a ‘saw-tooth’ pattern. If there are more P waves than QRS complexes, an atrioventricular block may be present.
Step 4: Analyse the QRS complex
The QRS complex may exhibit up to three waveforms (see above) and normally lasts less than three small squares or 0.12 second. If the QRS duration is greater than this, conduction through the ventricle is abnormally slow, either because one of the bundles of His is not functioning or because the origin of depolarisation is within the ventricle.
Step 5: Measure the PR interval
If the PR interval is less than 0.12 seconds (three small squares), the electrical impulse has not progressed from the atria to the ventricles via the normal conduction pathway. A prolonged PR interval, greater than 0.2 seconds (five small squares), occurs in ‘first-degree’ heart block.
Step 6: Analyse the T wave
A normal T wave is upright and oriented in the same direction as the R wave of the QRS complex in that lead. Inversion of the T wave may indicate that an acute myocardial infarction has occurred in the past or that the myocardium is currently ischaemic. The T wave appears tall and symmetrically peaked if the patient has a high serum potassium level (hyperkalaemia).
Step 7: Analyse the ST segment
ST segment abnormalities are seen in acute coronary syndromes, pericarditis, ventricular hypertrophy and as an effect of some drugs (e.g. digoxin). Elevation of the ST segment can signify an acute myocardial infarction, especially if it is greater than two small squares above the isoelectric line. An ST segment depression can occur in acute cardiac ischaemia but should only confidently be diagnosed on a 12-lead ECG. In terms of treatment, ST segment elevation is particularly important because it is an indication for administration of thrombolytic therapy or conveying for primary angioplasty in cases of suspected acute myocardial infarction.
Analysis of rhythm
Heart rhythms can be divided into three groups:
1. Normal sinus rhythm
2. Slow rhythms (bradyarrhythmias)
3. Fast rhythms (tachyarrhythmias).
Sinus rhythm
Sinus rhythm is defined as a rhythm where each P wave is followed by a QRS complex, with an equal number of P waves and QRS complexes.
Tachycardias
Any rhythm with a rate exceeding 100 beats/min is a tachycardia. Such rhythms can be simply described in terms of their regularity and the width of the QRS complex. The warning signs of an immediately life-threatening tachycardia include:
• Chest pain
• Systolic blood pressure <90 mmHg
• Unconsciousness
• Signs of heart failure.
If these warning signs are seen, apply advanced life support treatment and consider the need for defibrillation.
Narrow complex and regular (supraventricular tachycardia – SVT)
• Sinus tachycardia (causes: anxiety, blood loss, fever, pain)
• True atrial tachycardia
• AV nodal reentrant (junctional) tachycardia
• Atrial flutter with fixed AV relationship (e.g. 2:1, 3:1 conduction)
• AV re-entrant tachycardia (accessory pathway).
Narrow complex and irregular
• Atrial fibrillation (no P waves, increasingly common with age)
• Atrial flutter with variable conduction (saw-tooth appearance of P waves)
• Frequent atrial ectopic beats.
Broad complex and regular
• Any cause of SVT with co-existing bundle branch block
• Ventricular tachycardia (check your patient!).
Broad and irregular
• Atrial fibrillation with bundle branch block
• Polymorphic ventricular tachycardia (torsades de pointes).
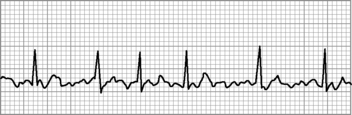 |
| Figure 12.4. |
| Atrial fibrillation. |
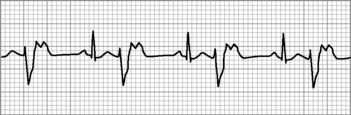 |
| Figure 12.5. |
| Ventricular ectopic beats. |
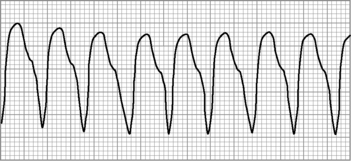 |
| Figure 12.6. |
| Ventricular tachycardia. |
 |
| Figure 12.7. |
| First-degree heart block. |
Bradycardia and heart block
• Sinus bradycardia occurs when the pulse is less than 60 bpm, but the ECG is otherwise normal
• When sinus rhythm is present but the PR interval is longer than 0.2 seconds, it is termed first-degree heart block. Treatment is rarely required
• If some waves of atrial depolarisation fail to be transmitted to the ventricles, second-degree heart block has occurred. Because atrial depolarisation has occurred normally, the P wave is normal whether or not it is followed by a QRS complex
• Second-degree (Mobitz) type I heart block (also known as the Wenckebach phenomenon) occurs when there is progressive prolongation of the PR interval, until a P wave occurs without a following QRS complex
• Alternatively, the PR interval may remain constant with occasional depolarisations failing to transmit to the ventricles. The missed (or dropped) beat may be regular (e.g. every third or fourth beat) or irregular (random). This is (Mobitz) type II second-degree heart block. This is a more significant abnormality and may progress to complete heart block or ventricular standstill. Causes include ischaemia, fibrosis of the AV node, connective tissue disorders and some drugs
• The most serious form of heart block is third-degree or complete heart block. The ventricular rhythm and pulse, are slow and usually regular. P waves and QRS complexes appear independently on the ECG, with some P waves hidden by QRS complexes. Because there is no relationship between the electrical activity of the atria and the ventricles, this is also known as complete atrioventricular dissociation.
For further information, see Ch. 12 in Emergency Care: A Textbook for Paramedics.