[level-membership-for-internal-medicine-category]
PART 17: Neurologic Disorders
SECTION 1 |
DIAGNOSIS OF NEUROLOGIC DISORDERS |
437 |
Approach to the Patient with Neurologic Disease |
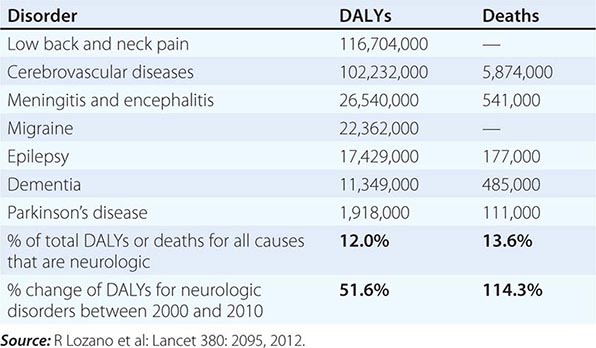
Neurologic diseases are common and costly. According to estimates by the World Health Organization, neurologic disorders affect over 1 billion people worldwide, constitute 12% of the global burden of disease, and cause 14% of global deaths (Table 437-1). These numbers are only expected to increase as the world’s population ages. Most patients with neurologic symptoms seek care from internists and other generalists rather than from neurologists. Because therapies now exist for many neurologic disorders, a skillful approach to diagnosis is essential. Errors commonly result from an overreliance on costly neuroimaging procedures and laboratory tests, which, while useful, do not substitute for an adequate history and examination. The proper approach to the patient with a neurologic illness begins with the patient and focuses the clinical problem first in anatomic and then in pathophysiologic terms; only then should a specific diagnosis be entertained. This method ensures that technology is judiciously applied, a correct diagnosis is established in an efficient manner, and treatment is promptly initiated.
|
GLOBAL DISABILITY-ADJUSTED LIFE-YEARS (DALYs) AND NUMBER OF ANNUAL DEATHS FOR SELECTED NEUROLOGIC DISORDERS IN 2010 |
THE NEUROLOGIC METHOD
DEFINE THE ANATOMY
The first priority is to identify the region of the nervous system that is likely to be responsible for the symptoms. Can the disorder be mapped to one specific location, is it multifocal, or is a diffuse process present? Are the symptoms restricted to the nervous system, or do they arise in the context of a systemic illness? Is the problem in the central nervous system (CNS), the peripheral nervous system (PNS), or both? If in the CNS, is the cerebral cortex, basal ganglia, brainstem, cerebellum, or spinal cord responsible? Are the pain-sensitive meninges involved? If in the PNS, could the disorder be located in peripheral nerves and, if so, are motor or sensory nerves primarily affected, or is a lesion in the neuromuscular junction or muscle more likely?
The first clues to defining the anatomic area of involvement appear in the history, and the examination is then directed to confirm or rule out these impressions and to clarify uncertainties. A more detailed examination of a particular region of the CNS or PNS is often indicated. For example, the examination of a patient who presents with a history of ascending paresthesias and weakness should be directed toward deciding, among other things, if the location of the lesion is in the spinal cord or peripheral nerves. Focal back pain, a spinal cord sensory level, and incontinence suggest a spinal cord origin, whereas a stocking-glove pattern of sensory loss suggests peripheral nerve disease; areflexia usually indicates peripheral neuropathy but may also be present with spinal shock in acute spinal cord disorders.
Deciding “where the lesion is” accomplishes the task of limiting the possible etiologies to a manageable, finite number. In addition, this strategy safeguards against making serious errors. Symptoms of recurrent vertigo, diplopia, and nystagmus should not trigger “multiple sclerosis” as an answer (etiology) but “brainstem” or “pons” (location); then a diagnosis of brainstem arteriovenous malformation will not be missed for lack of consideration. Similarly, the combination of optic neuritis and spastic ataxic paraparesis suggests optic nerve and spinal cord disease; multiple sclerosis (MS), CNS syphilis, and vitamin B12 deficiency are treatable disorders that can produce this syndrome. Once the question, “Where is the lesion?” is answered, then the question, “What is the lesion?” can be addressed.
IDENTIFY THE PATHOPHYSIOLOGY
Clues to the pathophysiology of the disease process may also be present in the history. Primary neuronal (gray matter) disorders may present as early cognitive disturbances, movement disorders, or seizures, whereas white matter involvement produces predominantly “long tract” disorders of motor, sensory, visual, and cerebellar pathways. Progressive and symmetric symptoms often have a metabolic or degenerative origin; in such cases lesions are usually not sharply circumscribed. Thus, a patient with paraparesis and a clear spinal cord sensory level is unlikely to have vitamin B12 deficiency as the explanation. A Lhermitte symptom (electric shock–like sensations evoked by neck flexion) is due to ectopic impulse generation in white matter pathways and occurs with demyelination in the cervical spinal cord; among many possible causes, this symptom may indicate MS in a young adult or compressive cervical spondylosis in an older person. Symptoms that worsen after exposure to heat or exercise may indicate conduction block in demyelinated axons, as occurs in MS. A patient with recurrent episodes of diplopia and dysarthria associated with exercise or fatigue may have a disorder of neuromuscular transmission such as myasthenia gravis. Slowly advancing visual scotoma with luminous edges, termed fortification spectra, indicates spreading cortical depression, typically with migraine.
THE NEUROLOGIC HISTORY
Attention to the description of the symptoms experienced by the patient and substantiated by family members and others often permits an accurate localization and determination of the probable cause of the complaints, even before the neurologic examination is performed. The history also helps to bring a focus to the neurologic examination that follows. Each complaint should be pursued as far as possible to elucidate the location of the lesion, the likely underlying pathophysiology, and potential etiologies. For example, a patient complains of weakness of the right arm. What are the associated features? Does the patient have difficulty with brushing hair or reaching upward (proximal) or buttoning buttons or opening a twist-top bottle (distal)? Negative associations may also be crucial. A patient with a right hemiparesis without a language deficit likely has a lesion (internal capsule, brainstem, or spinal cord) different from that of a patient with a right hemiparesis and aphasia (left hemisphere). Other pertinent features of the history include the following:
1. Temporal course of the illness. It is important to determine the precise time of appearance and rate of progression of the symptoms experienced by the patient. The rapid onset of a neurologic complaint, occurring within seconds or minutes, usually indicates a vascular event, a seizure, or migraine. The onset of sensory symptoms located in one extremity that spread over a few seconds to adjacent portions of that extremity and then to the other regions of the body suggests a seizure. A more gradual onset and less well-localized symptoms point to the possibility of a transient ischemic attack (TIA). A similar but slower temporal march of symptoms accompanied by headache, nausea, or visual disturbance suggests migraine. The presence of “positive” sensory symptoms (e.g., tingling or sensations that are difficult to describe) or involuntary motor movements suggests a seizure; in contrast, transient loss of function (negative symptoms) suggests a TIA. A stuttering onset where symptoms appear, stabilize, and then progress over hours or days also suggests cerebrovascular disease; an additional history of transient remission or regression indicates that the process is more likely due to ischemia rather than hemorrhage. A gradual evolution of symptoms over hours or days suggests a toxic, metabolic, infectious, or inflammatory process. Progressing symptoms associated with the systemic manifestations of fever, stiff neck, and altered level of consciousness imply an infectious process. Relapsing and remitting symptoms involving different levels of the nervous system suggest MS or other inflammatory processes. Slowly progressive symptoms without remissions are characteristic of neurodegenerative disorders, chronic infections, gradual intoxications, and neoplasms.
2. Patients’ descriptions of the complaint. The same words often mean different things to different patients. “Dizziness” may imply impending syncope, a sense of disequilibrium, or true spinning vertigo. “Numbness” may mean a complete loss of feeling, a positive sensation such as tingling, or even weakness. “Blurred vision” may be used to describe unilateral visual loss, as in transient monocular blindness, or diplopia. The interpretation of the true meaning of the words used by patients to describe symptoms obviously becomes even more complex when there are differences in primary languages and cultures.
3. Corroboration of the history by others. It is almost always helpful to obtain additional information from family, friends, or other observers to corroborate or expand the patient’s description. Memory loss, aphasia, loss of insight, intoxication, and other factors may impair the patient’s capacity to communicate normally with the examiner or prevent openness about factors that have contributed to the illness. Episodes of loss of consciousness necessitate that details be sought from observers to ascertain precisely what has happened during the event.
4. Family history. Many neurologic disorders have an underlying genetic component. The presence of a Mendelian disorder, such as Huntington’s disease or Charcot-Marie-Tooth neuropathy, is often obvious if family data are available. More detailed questions about family history are often necessary in polygenic disorders such as MS, migraine, and many types of epilepsy. It is important to elicit family history about all illnesses, in addition to neurologic and psychiatric disorders. A familial propensity to hypertension or heart disease is relevant in a patient who presents with a stroke. There are numerous inherited neurologic diseases that are associated with multisystem manifestations that may provide clues to the correct diagnosis (e.g., neurofibromatosis, Wilson’s disease, mitochondrial disorders).
5. Medical illnesses. Many neurologic diseases occur in the context of systemic disorders. Diabetes mellitus, hypertension, and abnormalities of blood lipids predispose to cerebrovascular disease. A solitary mass lesion in the brain may be an abscess in a patient with valvular heart disease, a primary hemorrhage in a patient with a coagulopathy, a lymphoma or toxoplasmosis in a patient with AIDS, or a metastasis in a patient with underlying cancer. Patients with malignancy may also present with a neurologic paraneoplastic syndrome (Chap. 122) or complications from chemotherapy or radiotherapy. Marfan’s syndrome and related collagen disorders predispose to dissection of the cranial arteries and aneurysmal subarachnoid hemorrhage; the latter may also occur with polycystic kidney disease. Various neurologic disorders occur with dysthyroid states or other endocrinopathies. It is especially important to look for the presence of systemic diseases in patients with peripheral neuropathy. Most patients with coma in a hospital setting have a metabolic, toxic, or infectious cause.
6. Drug use and abuse and toxin exposure. It is essential to inquire about the history of drug use, both prescribed and illicit. Sedatives, antidepressants, and other psychoactive medications are frequently associated with acute confusional states, especially in the elderly. Aminoglycoside antibiotics may exacerbate symptoms of weakness in patients with disorders of neuromuscular transmission, such as myasthenia gravis, and may cause dizziness secondary to ototoxicity. Vincristine and other antineoplastic drugs can cause peripheral neuropathy, and immunosuppressive agents such as cyclosporine can produce encephalopathy. Excessive vitamin ingestion can lead to disease; examples include vitamin A and pseudotumor cerebri or pyridoxine and peripheral neuropathy. Many patients are unaware that over-the-counter sleeping pills, cold preparations, and diet pills are actually drugs. Alcohol, the most prevalent neurotoxin, is often not recognized as such by patients, and other drugs of abuse such as cocaine and heroin can cause a wide range of neurologic abnormalities. A history of environmental or industrial exposure to neurotoxins may provide an essential clue; consultation with the patient’s coworkers or employer may be required.
7. Formulating an impression of the patient. Use the opportunity while taking the history to form an impression of the patient. Is the information forthcoming, or does it take a circuitous course? Is there evidence of anxiety, depression, or hypochondriasis? Are there any clues to problems with language, memory, insight, comportment, or behavior? The neurologic assessment begins as soon as the patient comes into the room and the first introduction is made.
THE NEUROLOGIC EXAMINATION
The neurologic examination is challenging and complex; it has many components and includes a number of skills that can be mastered only through repeated use of the same techniques on a large number of individuals with and without neurologic disease. Mastery of the complete neurologic examination is usually important only for physicians in neurology and associated specialties. However, knowledge of the basics of the examination, especially those components that are effective in screening for neurologic dysfunction, is essential for all clinicians, especially generalists.
There is no single, universally accepted sequence of the examination that must be followed, but most clinicians begin with assessment of mental status followed by the cranial nerves, motor system, reflexes, sensory system, coordination, and gait. Whether the examination is basic or comprehensive, it is essential that it be performed in an orderly and systematic fashion to avoid errors and serious omissions. Thus, the best way to learn and gain expertise in the examination is to choose one’s own approach and practice it frequently and do it in the same exact sequence each time.
The detailed description that follows describes the more commonly used parts of the neurologic examination, with a particular emphasis on the components that are considered most helpful for the assessment of common neurologic problems. Each section also includes a brief description of the minimal examination necessary to adequately screen for abnormalities in a patient who has no symptoms suggesting neurologic dysfunction. A screening examination done in this way can be completed in 3–5 min.
Several additional points about the examination are worth noting. First, in recording observations, it is important to describe what is found rather than to apply a poorly defined medical term (e.g., “patient groans to sternal rub” rather than “obtunded”). Second, subtle CNS abnormalities are best detected by carefully comparing a patient’s performance on tasks that require simultaneous activation of both cerebral hemispheres (e.g., eliciting a pronator drift of an outstretched arm with the eyes closed; extinction on one side of bilaterally applied light touch, also with eyes closed; or decreased arm swing or a slight asymmetry when walking). Third, if the patient’s complaint is brought on by some activity, reproduce the activity in the office. If the complaint is of dizziness when the head is turned in one direction, have the patient do this and also look for associated signs on examination (e.g., nystagmus or dysmetria). If pain occurs after walking two blocks, have the patient leave the office and walk this distance and immediately return, and repeat the relevant parts of the examination. Finally, the use of tests that are individually tailored to the patient’s problem can be of value in assessing changes over time. Tests of walking a 7.5-m (25-ft) distance (normal, 5–6 s; note assistance, if any), repetitive finger or toe tapping (normal, 20–25 taps in 5 s), or handwriting are examples.
MENTAL STATUS EXAMINATION
• The bare minimum: During the interview, look for difficulties with communication and determine whether the patient has recall and insight into recent and past events.
The mental status examination is under way as soon as the physician begins observing and speaking with the patient. If the history raises any concern for abnormalities of higher cortical function or if cognitive problems are observed during the interview, then detailed testing of the mental status is indicated. The patient’s ability to understand the language used for the examination, cultural background, educational experience, sensory or motor problems, or comorbid conditions need to be factored into the applicability of the tests and interpretation of results.
The Folstein mini-mental status examination (MMSE) is a standardized screening examination of cognitive function that is extremely easy to administer and takes <10 min to complete. Using age-adjusted values for defining normal performance, the test is ~85% sensitive and 85% specific for making the diagnosis of dementia that is moderate or severe, especially in educated patients. When there is sufficient time available, the MMSE is one of the best methods for documenting the current mental status of the patient, and this is especially useful as a baseline assessment to which future scores of the MMSE can be compared.
Individual elements of the mental status examination can be subdivided into level of consciousness, orientation, speech and language, memory, fund of information, insight and judgment, abstract thought, and calculations.
Level of consciousness is the patient’s relative state of awareness of the self and the environment, and ranges from fully awake to comatose. When the patient is not fully awake, the examiner should describe the responses to the minimum stimulus necessary to elicit a reaction, ranging from verbal commands to a brief, painful stimulus such as a squeeze of the trapezius muscle. Responses that are directed toward the stimulus and signify some degree of intact cerebral function (e.g., opening the eyes and looking at the examiner or reaching to push away a painful stimulus) must be distinguished from reflex responses of a spinal origin (e.g., triple flexion response—flexion at the ankle, knee, and hip in response to a painful stimulus to the foot).
Orientation is tested by asking the person to state his or her name, location, and time (day of the week and date); time is usually the first to be affected in a variety of conditions.
Speech is assessed by observing articulation, rate, rhythm, and prosody (i.e., the changes in pitch and accentuation of syllables and words).
Language is assessed by observing the content of the patient’s verbal and written output, response to spoken commands, and ability to read. A typical testing sequence is to ask the patient to name successively more detailed components of clothing, a watch, or a pen; repeat the phrase “No ifs, ands, or buts”; follow a three-step, verbal command; write a sentence; and read and respond to a written command.
Memory should be analyzed according to three main time scales: (1) immediate memory is assessed by saying a list of three items and having the patient repeat the list immediately; (2) short-term memory is tested by asking the patient to recall the same three items 5 and 15 min later; and (3) long-term memory is evaluated by determining how well the patient is able to provide a coherent chronologic history of his or her illness or personal events.
Fund of information is assessed by asking questions about major historic or current events, with special attention to educational level and life experiences.
Abnormalities of insight and judgment are usually detected during the patient interview; a more detailed assessment can be elicited by asking the patient to describe how he or she would respond to situations having a variety of potential outcomes (e.g., “What would you do if you found a wallet on the sidewalk?”).
Abstract thought can be tested by asking the patient to describe similarities between various objects or concepts (e.g., apple and orange, desk and chair, poetry and sculpture) or to list items having the same attributes (e.g., a list of four-legged animals).
Calculation ability is assessed by having the patient carry out a computation that is appropriate to the patient’s age and education (e.g., serial subtraction of 7 from 100 or 3 from 20; or word problems involving simple arithmetic).
CRANIAL NERVE EXAMINATION
• The bare minimum: Check the fundi, visual fields, pupil size and reactivity, extraocular movements, and facial movements.
The cranial nerves (CN) are best examined in numerical order, except for grouping together CN III, IV, and VI because of their similar function.
CN I (Olfactory) Testing is often omitted unless there is suspicion for inferior frontal lobe disease (e.g., meningioma). With eyes closed, ask the patient to sniff a mild stimulus such as toothpaste or coffee and identify the odorant.
CN II (Optic) Check visual acuity (with eyeglasses or contact lens correction) using a Snellen chart or similar tool. Test the visual fields by confrontation, i.e., by comparing the patient’s visual fields to your own. As a screening test, it is usually sufficient to examine the visual fields of both eyes simultaneously; individual eye fields should be tested if there is any reason to suspect a problem of vision by the history or other elements of the examination, or if the screening test reveals an abnormality. Face the patient at a distance of approximately 0.6–1.0 m (2–3 ft) and place your hands at the periphery of your visual fields in the plane that is equidistant between you and the patient. Instruct the patient to look directly at the center of your face and to indicate when and where he or she sees one of your fingers moving. Beginning with the two inferior quadrants and then the two superior quadrants, move your index finger of the right hand, left hand, or both hands simultaneously and observe whether the patient detects the movements. A single small-amplitude movement of the finger is sufficient for a normal response. Focal perimetry and tangent screen examinations should be used to map out visual field defects fully or to search for subtle abnormalities. Optic fundi should be examined with an ophthalmoscope, and the color, size, and degree of swelling or elevation of the optic disc noted, as well as the color and texture of the retina. The retinal vessels should be checked for size, regularity, arteriovenous nicking at crossing points, hemorrhage, exudates, etc.
CN III, IV, VI (Oculomotor, Trochlear, Abducens) Describe the size and shape of pupils and reaction to light and accommodation (i.e., as the eyes converge while following your finger as it moves toward the bridge of the nose). To check extraocular movements, ask the patient to keep his or her head still while tracking the movement of the tip of your finger. Move the target slowly in the horizontal and vertical planes; observe any paresis, nystagmus, or abnormalities of smooth pursuit (saccades, oculomotor ataxia, etc.). If necessary, the relative position of the two eyes, both in primary and multidirectional gaze, can be assessed by comparing the reflections of a bright light off both pupils. However, in practice it is typically more useful to determine whether the patient describes diplopia in any direction of gaze; true diplopia should almost always resolve with one eye closed. Horizontal nystagmus is best assessed at 45° and not at extreme lateral gaze (which is uncomfortable for the patient); the target must often be held at the lateral position for at least a few seconds to detect an abnormality.
CN V (Trigeminal) Examine sensation within the three territories of the branches of the trigeminal nerve (ophthalmic, maxillary, and mandibular) on each side of the face. As with other parts of the sensory examination, testing of two sensory modalities derived from different anatomic pathways (e.g., light touch and temperature) is sufficient for a screening examination. Testing of other modalities, the corneal reflex, and the motor component of CN V (jaw clench—masseter muscle) is indicated when suggested by the history.
CN VII (Facial) Look for facial asymmetry at rest and with spontaneous movements. Test eyebrow elevation, forehead wrinkling, eye closure, smiling, and cheek puff. Look in particular for differences in the lower versus upper facial muscles; weakness of the lower two-thirds of the face with preservation of the upper third suggests an upper motor neuron lesion, whereas weakness of an entire side suggests a lower motor neuron lesion.
CN VIII (Vestibulocochlear) Check the patient’s ability to hear a finger rub or whispered voice with each ear. Further testing for air versus mastoid bone conduction (Rinne) and lateralization of a 512-Hz tuning fork placed at the center of the forehead (Weber) should be done if an abnormality is detected by history or examination. Any suspected problem should be followed up with formal audiometry. For further discussion of assessing vestibular nerve function in the setting of dizziness, hearing loss, or coma, see Chaps. 28, 43, and 328, respectively.
CN IX, × (Glossopharyngeal, Vagus) Observe the position and symmetry of the palate and uvula at rest and with phonation (“aah”). The pharyngeal (“gag”) reflex is evaluated by stimulating the posterior pharyngeal wall on each side with a sterile, blunt object (e.g., tongue blade), but the reflex is often absent in normal individuals.
CN XI (Spinal Accessory) Check shoulder shrug (trapezius muscle) and head rotation to each side (sternocleidomastoid) against resistance.
CN XII (Hypoglossal) Inspect the tongue for atrophy or fasciculations, position with protrusion, and strength when extended against the inner surface of the cheeks on each side.
MOTOR EXAMINATION
• The bare minimum: Look for muscle atrophy and check extremity tone. Assess upper extremity strength by checking for pronator drift and strength of wrist or finger extensors. Assess lower extremity strength by checking strength of the toe extensors and having the patient walk normally and on heels and toes.
The motor examination includes observations of muscle appearance, tone, and strength. Although gait is in part a test of motor function, it is usually evaluated separately at the end of the examination.
Appearance Inspect and palpate muscle groups under good light and with the patient in a comfortable and symmetric position. Check for muscle fasciculations, tenderness, and atrophy or hypertrophy. Involuntary movements may be present at rest (e.g., tics, myoclonus, choreoathetosis), during maintained posture (pill-rolling tremor of Parkinson’s disease), or with voluntary movements (intention tremor of cerebellar disease or familial tremor).
Tone Muscle tone is tested by measuring the resistance to passive movement of a relaxed limb. Patients often have difficulty relaxing during this procedure, so it is useful to distract the patient to minimize active movements. In the upper limbs, tone is assessed by rapid pronation and supination of the forearm and flexion and extension at the wrist. In the lower limbs, while the patient is supine the examiner’s hands are placed behind the knees and rapidly raised; with normal tone, the ankles drag along the table surface for a variable distance before rising, whereas increased tone results in an immediate lift of the heel off the surface. Decreased tone is most commonly due to lower motor neuron or peripheral nerve disorders. Increased tone may be evident as spasticity (resistance determined by the angle and velocity of motion; corticospinal tract disease), rigidity (similar resistance in all angles of motion; extrapyramidal disease), or paratonia (fluctuating changes in resistance; frontal lobe pathways or normal difficulty in relaxing). Cogwheel rigidity, in which passive motion elicits jerky interruptions in resistance, is seen in parkinsonism.
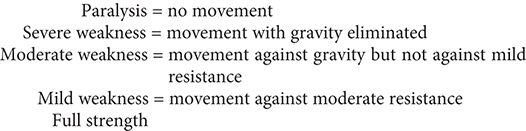
Strength Testing for pronator drift is an extremely useful method for screening upper limb weakness. The patient is asked to hold both arms fully extended and parallel to the ground with eyes closed. This position should be maintained for ~10 s; any flexion at the elbow or fingers or pronation of the forearm, especially if asymmetric, is a sign of potential weakness. Muscle strength is further assessed by having the patient exert maximal effort for the particular muscle or muscle group being tested. It is important to isolate the muscles as much as possible, i.e., hold the limb so that only the muscles of interest are active. It is also helpful to palpate accessible muscles as they contract. Grading muscle strength and evaluating the patient’s effort is an art that takes time and practice. Muscle strength is traditionally graded using the following scale:
0 = no movement
1 = flicker or trace of contraction but no associated movement at a joint
2 = movement with gravity eliminated
3 = movement against gravity but not against resistance
4– = movement against a mild degree of resistance
4 = movement against moderate resistance
4+ = movement against strong resistance
5 = full power
However, in many cases, it is more practical to use the following terms:
Noting the pattern of weakness is as important as assessing the magnitude of weakness. Unilateral or bilateral weakness of the upper limb extensors and lower limb flexors (“pyramidal weakness”) suggests a lesion of the pyramidal tract, bilateral proximal weakness suggests myopathy, and bilateral distal weakness suggests peripheral neuropathy.
REFLEX EXAMINATION
• The bare minimum: Check the biceps, patellar, and Achilles reflexes.
Muscle Stretch Reflexes Those that are typically assessed include the biceps (C5, C6), brachioradialis (C5, C6), and triceps (C7, C8) reflexes in the upper limbs and the patellar or quadriceps (L3, L4) and Achilles (S1, S2) reflexes in the lower limbs. The patient should be relaxed and the muscle positioned midway between full contraction and extension. Reflexes may be enhanced by asking the patient to voluntarily contract other, distant muscle groups (Jendrassik maneuver). For example, upper limb reflexes may be reinforced by voluntary teeth-clenching, and the Achilles reflex by hooking the flexed fingers of the two hands together and attempting to pull them apart. For each reflex tested, the two sides should be tested sequentially, and it is important to determine the smallest stimulus required to elicit a reflex rather than the maximum response. Reflexes are graded according to the following scale:
0 = absent
1 = present but diminished
2 = normoactive
3 = exaggerated
4 = clonus
Cutaneous Reflexes The plantar reflex is elicited by stroking, with a noxious stimulus such as a tongue blade, the lateral surface of the sole of the foot beginning near the heel and moving across the ball of the foot to the great toe. The normal reflex consists of plantar flexion of the toes. With upper motor neuron lesions above the S1 level of the spinal cord, a paradoxical extension of the toe is observed, associated with fanning and extension of the other toes (termed an extensor plantar response, or Babinski sign). However, despite its popularity, the reliability and validity of the Babinski sign for identifying upper motor neuron weakness is limited—it is far more useful to rely on tests of tone, strength, stretch reflexes, and coordination. Superficial abdominal reflexes are elicited by gently stroking the abdominal surface near the umbilicus in a diagonal fashion with a sharp object (e.g., the wooden end of a cotton-tipped swab) and observing the movement of the umbilicus. Normally, the umbilicus will pull toward the stimulated quadrant. With upper motor neuron lesions, these reflexes are absent. They are most helpful when there is preservation of the upper (spinal cord level T9) but not lower (T12) abdominal reflexes, indicating a spinal lesion between T9 and T12, or when the response is asymmetric. Other useful cutaneous reflexes include the cremasteric (ipsilateral elevation of the testicle following stroking of the medial thigh; mediated by L1 and L2) and anal (contraction of the anal sphincter when the perianal skin is scratched; mediated by S2, S3, S4) reflexes. It is particularly important to test for these reflexes in any patient with suspected injury to the spinal cord or lumbosacral roots.
Primitive Reflexes With disease of the frontal lobe pathways, several primitive reflexes not normally present in the adult may appear. The suck response is elicited by lightly touching with a tongue blade the center of the lips, and the root response the corner of the lips; the patient will move the lips to suck or root in the direction of the stimulus. The grasp reflex is elicited by touching the palm between the thumb and index finger with the examiner’s fingers; a positive response is a forced grasp of the examiner’s hand. In many instances, stroking the back of the hand will lead to its release. The palmomental response is contraction of the mentalis muscle (chin) ipsilateral to a scratch stimulus diagonally applied to the palm.
SENSORY EXAMINATION
• The bare minimum: Ask whether the patient can feel light touch and the temperature of a cool object in each distal extremity. Check double simultaneous stimulation using light touch on the hands. Perform the Romberg maneuver.
Evaluating sensation is usually the most unreliable part of the examination because it is subjective and is difficult to quantify. In the compliant and discerning patient, the sensory examination can be extremely helpful for the precise localization of a lesion. With patients who are uncooperative or lack an understanding of the tests, it may be useless. The examination should be focused on the suspected lesion. For example, in spinal cord, spinal root, or peripheral nerve abnormalities, all major sensory modalities should be tested while looking for a pattern consistent with a spinal level and dermatomal or nerve distribution. In patients with lesions at or above the brainstem, screening the primary sensory modalities in the distal extremities along with tests of “cortical” sensation is usually sufficient.
The five primary sensory modalities—light touch, pain, temperature, vibration, and joint position—are tested in each limb. Light touch is assessed by stimulating the skin with single, very gentle touches of the examiner’s finger or a wisp of cotton. Pain is tested using a new pin, and temperature is assessed using a metal object (e.g., tuning fork) that has been immersed in cold and warm water. Vibration is tested using a 128-Hz tuning fork applied to the distal phalanx of the great toe or index finger just below the nail bed. By placing a finger on the opposite side of the joint being tested, the examiner compares the patient’s threshold of vibration perception with his or her own. For joint position testing, the examiner grasps the digit or limb laterally and distal to the joint being assessed; small 1- to 2-mm excursions can usually be sensed. The Romberg maneuver is primarily a test of proprioception. The patient is asked to stand with the feet as close together as necessary to maintain balance while the eyes are open, and the eyes are then closed. A loss of balance with the eyes closed is an abnormal response.
“Cortical” sensation is mediated by the parietal lobes and represents an integration of the primary sensory modalities; testing cortical sensation is only meaningful when primary sensation is intact. Double simultaneous stimulation is especially useful as a screening test for cortical function; with the patient’s eyes closed, the examiner lightly touches one or both hands and asks the patient to identify the stimuli. With a parietal lobe lesion, the patient may be unable to identify the stimulus on the contralateral side when both hands are touched. Other modalities relying on the parietal cortex include the discrimination of two closely placed stimuli as separate (two-point discrimination), identification of an object by touch and manipulation alone (stereognosis), and the identification of numbers or letters written on the skin surface (graphesthesia).
COORDINATION EXAMINATION
• The bare minimum: Observe the patient at rest and during spontaneous movements. Test rapid alternating movements of the hands and feet and finger to nose.
Coordination refers to the orchestration and fluidity of movements. Even simple acts require cooperation of agonist and antagonist muscles, maintenance of posture, and complex servomechanisms to control the rate and range of movements. Part of this integration relies on normal function of the cerebellar and basal ganglia systems. However, coordination also requires intact muscle strength and kinesthetic and proprioceptive information. Thus, if the examination has disclosed abnormalities of the motor or sensory systems, the patient’s coordination should be assessed with these limitations in mind.
Rapid alternating movements in the upper limbs are tested separately on each side by having the patient make a fist, partially extend the index finger, and then tap the index finger on the distal thumb as quickly as possible. In the lower limb, the patient rapidly taps the foot against the floor or the examiner’s hand. Finger-to-nose testing is primarily a test of cerebellar function; the patient is asked to touch his or her index finger repetitively to the nose and then to the examiner’s outstretched finger, which moves with each repetition. A similar test in the lower extremity is to have the patient raise the leg and touch the examiner’s finger with the great toe. Another cerebellar test in the lower limbs is the heel-knee-shin maneuver; in the supine position the patient is asked to slide the heel of each foot from the knee down the shin of the other leg. For all these movements, the accuracy, speed, and rhythm are noted.
GAIT EXAMINATION
• The bare minimum: Observe the patient while walking normally, on the heels and toes, and along a straight line.
Watching the patient walk is the most important part of the neurologic examination. Normal gait requires that multiple systems—including strength, sensation, and coordination—function in a highly integrated fashion. Unexpected abnormalities may be detected that prompt the examiner to return in more detail to other aspects of the examination. The patient should be observed while walking and turning normally, walking on the heels, walking on the toes, and walking heel-to-toe along a straight line. The examination may reveal decreased arm swing on one side (corticospinal tract disease), a stooped posture and short-stepped gait (parkinsonism), a broad-based unstable gait (ataxia), scissoring (spasticity), or a high-stepped, slapping gait (posterior column or peripheral nerve disease), or the patient may appear to be stuck in place (apraxia with frontal lobe disease).
NEUROLOGIC DIAGNOSIS
The clinical data obtained from the history and examination are interpreted to arrive at an anatomic localization that best explains the clinical findings (Table 437-2), to narrow the list of diagnostic possibilities, and to select the laboratory tests most likely to be informative. The laboratory assessment may include (1) serum electrolytes; complete blood count; and renal, hepatic, endocrine, and immune studies; (2) cerebrospinal fluid examination; (3) focused neuroimaging studies (Chap. 440e); or (4) electrophysiologic studies (Chap. 442e). The anatomic localization, mode of onset and course of illness, other medical data, and laboratory findings are then integrated to establish an etiologic diagnosis.
|
FINDINGS HELPFUL FOR LOCALIZATIONS WITHIN THE NERVOUS SYSTEM |
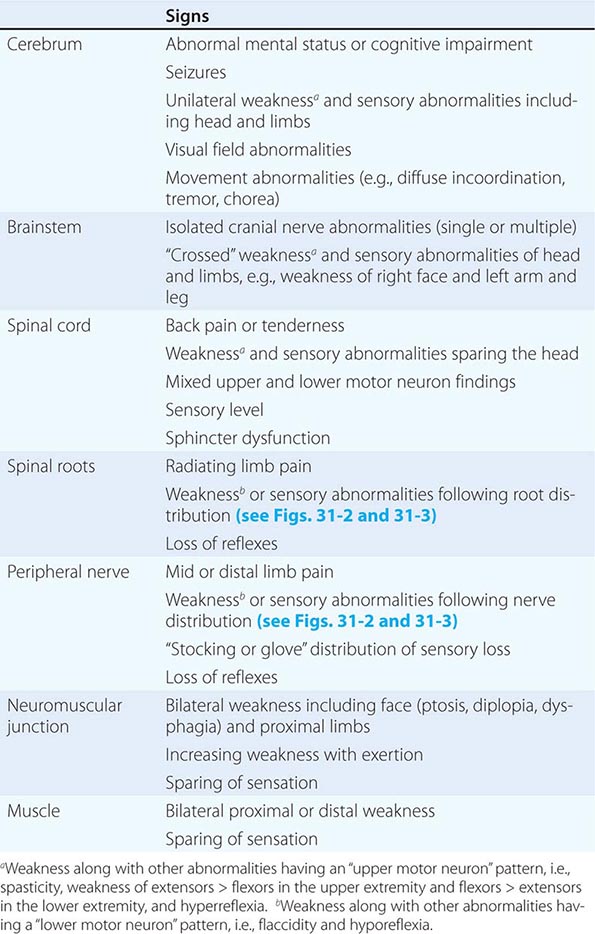
The neurologic examination may be normal even in patients with a serious neurologic disease, such as seizures, chronic meningitis, or a TIA. A comatose patient may arrive with no available history, and in such cases, the approach is as described in Chap. 328. In other patients, an inadequate history may be overcome by a succession of examinations from which the course of the illness can be inferred. In perplexing cases it is useful to remember that uncommon presentations of common diseases are more likely than rare etiologies. Thus, even in tertiary care settings, multiple strokes are usually due to emboli and not vasculitis, and dementia with myoclonus is usually Alzheimer’s disease and not a prion disorder or a paraneoplastic illness. Finally, the most important task of a primary care physician faced with a patient who has a new neurologic complaint is to assess the urgency of referral to a specialist. Here, the imperative is to rapidly identify patients likely to have nervous system infections, acute strokes, and spinal cord compression or other treatable mass lesions and arrange for immediate care.
438e |
The Neurologic Screening Exam |
Knowledge of the basic neurologic examination is an essential clinical skill. A simple neurologic screening examination—assessment of mental status, cranial nerves, motor system, sensory system, coordination, and gait—can be reliably performed in 3–5 min. Although the components of the examination may appear daunting at first, skills usually improve rapidly with repetition and practice. In this video, the technique of performing a simple and efficient screening examination is presented.
439e |
Video Atlas of the Detailed Neurologic Examination |
The comprehensive neurologic examination is an irreplaceable tool for the efficient diagnosis of neurologic disorders. Mastery of its details requires knowledge of normal nervous system anatomy and physiology combined with personal experience performing orderly and systematic examinations on large numbers of patients and healthy individuals. In the hands of a great clinician, the neurologic examination also becomes a thing of beauty—the pinnacle of the art of medicine. In this video, the most commonly used components of the examination are presented in detail, with a particular emphasis on those elements that are most helpful for assessment of common neurologic problems.
440e |
Neuroimaging in Neurologic Disorders |
The clinician caring for patients with neurologic symptoms is faced with myriad imaging options, including computed tomography (CT), CT angiography (CTA), perfusion CT (pCT), magnetic resonance (MR) imaging (MRI), MR angiography (MRA), functional MRI (fMRI), MR spectroscopy (MRS), MR neurography (MRN), diffusion and diffusion tensor imaging, susceptibility-weighted MR imaging (SWI), arterial spin label MRI (ASL) and perfusion MRI (pMRI). In addition, an increasing number of interventional neuroradiologic techniques are available, including angiography catheter embolization, coiling, and stenting of vascular structures, and spine diagnostic and interventional techniques, such as diskography, transforaminal and translaminar epidural and nerve root injections, and blood patches. Multidetector CTA (MDCTA) and gadolinium-enhanced MRA have narrowed the indications for conventional angiography, which is now reserved for patients in whom small-vessel detail is essential for diagnosis or for whom concurrent interventional therapy is planned (Table 440e-1).
|
GUIDELINES FOR THE USE OF CT, ULTRASOUND, AND MRI |
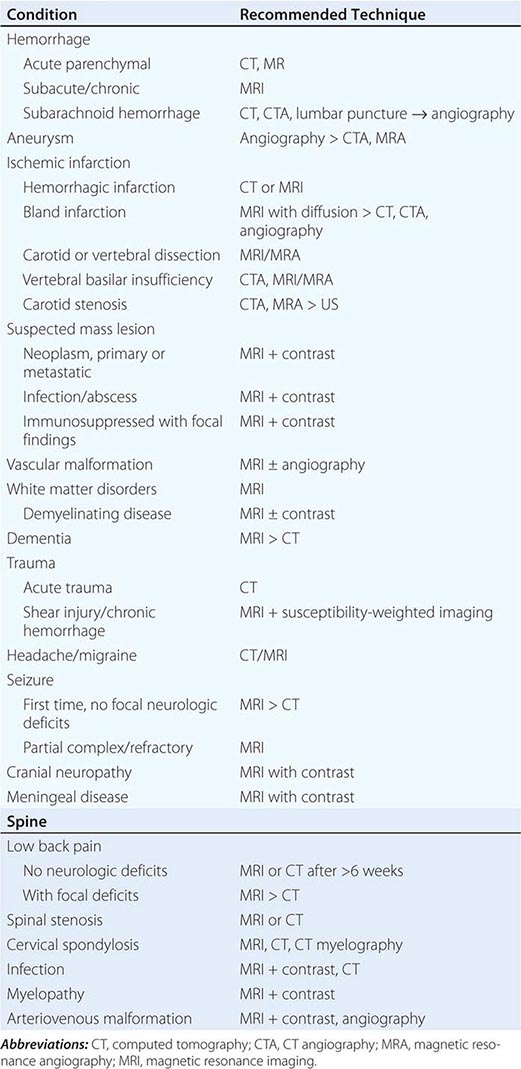
In general, MRI is more sensitive than CT for the detection of lesions affecting the central nervous system (CNS), particularly those of the spinal cord, cranial nerves, and posterior fossa structures. Diffusion MR, a sequence sensitive to the microscopic motion of water, is the most sensitive technique for detecting acute ischemic stroke of the brain or spinal cord, and it is also useful in the detection of encephalitis, abscesses, and prion diseases. CT, however, is quickly acquired and is widely available, making it a pragmatic choice for the initial evaluation of patients with acute changes in mental status, suspected acute stroke, hemorrhage, and intracranial or spinal trauma. CT is also more sensitive than MRI for visualizing fine osseous detail and is indicated in the initial imaging evaluation of conductive hearing loss as well as lesions affecting the skull base and calvarium. MR may, however, add important diagnostic information regarding bone marrow infiltrative processes that are difficult to detect on CT.
COMPUTED TOMOGRAPHY
TECHNIQUE
The CT image is a cross-sectional representation of anatomy created by a computer-generated analysis of the attenuation of x-ray beams passed through a section of the body. As the x-ray beam, collimated to the desired slice width, rotates around the patient, it passes through selected regions in the body. X-rays that are not attenuated by body structures are detected by sensitive x-ray detectors aligned 180° from the x-ray tube. A computer calculates a “back projection” image from the 360° x-ray attenuation profile. Greater x-ray attenuation (e.g., as caused by bone), results in areas of high “density” (whiter) on the scan, whereas soft tissue structures that have poor attenuation of x-rays, such as organs and air-filled cavities, are lower (blacker) in density. The resolution of an image depends on the radiation dose, the detector size, collimation (slice thickness), the field of view, and the matrix size of the display. A modern CT scanner is capable of obtaining sections as thin as 0.5–1 mm with 0.4-mm in-plane resolution at a speed of 0.3 s per rotation; complete studies of the brain can be completed in 1–10 s.
Multidetector CT (MDCT) is now standard in most radiology departments. Single or multiple (from 4 to 320) solid-state detectors positioned opposite to the x-ray source result in multiple slices per revolution of the beam around the patient. The table moves continuously through the rotating x-ray beam, generating a continuous “helix” of information that can be reformatted into various slice thicknesses and planes. Advantages of MDCT include shorter scan times, reduced patient and organ motion, and the ability to acquire images dynamically during the infusion of intravenous contrast, which can be used to construct CT angiograms of vascular structures and perfusion images (Figs. 440e-1B and C). CTA can be displayed in three dimensions to yield angiogram-like images (Figs. 440e-1C, 440e-2E and F, and see Fig. 446-4). CTA has proved useful in assessing the cervical and intracranial arterial and venous anatomy.
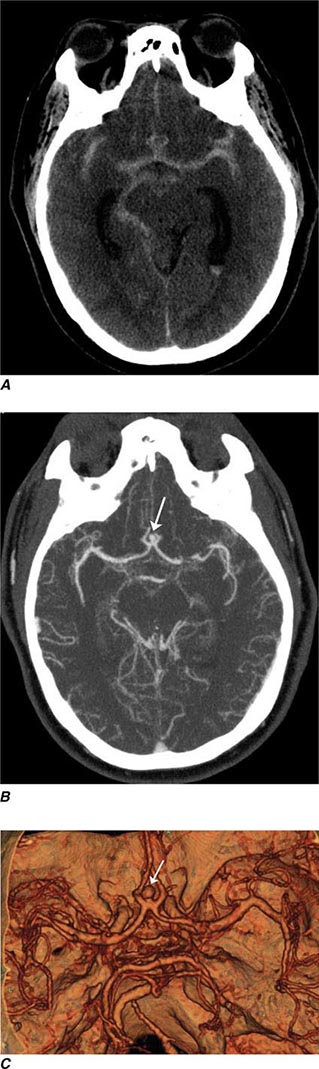
FIGURE 440e-1 Computed tomography (CT) angiography (CTA) of ruptured anterior cerebral artery aneurysm in a patient presenting with acute headache. A. Noncontrast CT demonstrates subarachnoid hemorrhage and mild obstructive hydrocephalus. B. Axial maximum-intensity projection from CTA demonstrates enlargement of the anterior cerebral artery (arrow). C. Three-dimensional surface reconstruction using a workstation confirms the anterior cerebral aneurysm and demonstrates its orientation and relationship to nearby vessels (arrow). CTA image is produced by 0.5- to 1-mm helical CT scans performed during a rapid bolus infusion of intravenous contrast medium.
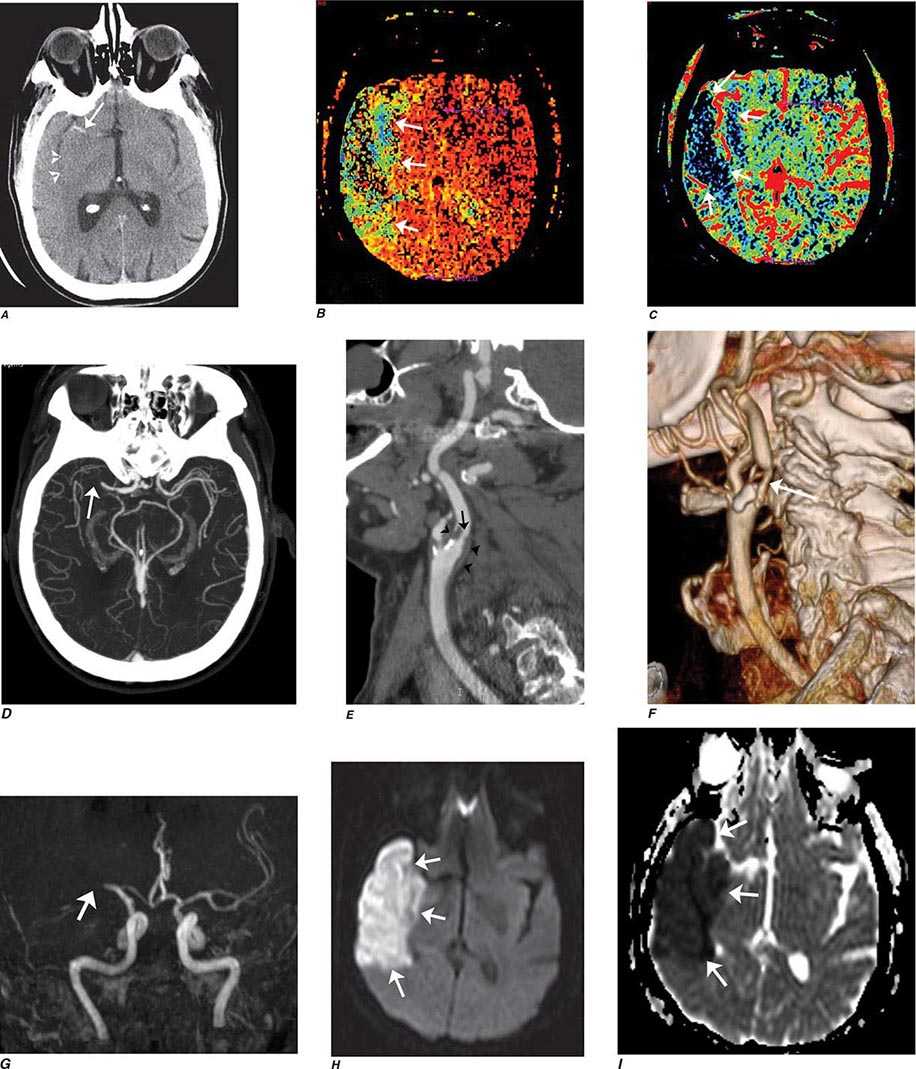
FIGURE 440e-2 Acute left hemiparesis due to middle cerebral artery occlusion. A. Axial noncontrast computed tomography (CT) scan demonstrates high density within the right middle cerebral artery (arrowheads). B. Mean transit time CT perfusion parametric map indicating prolonged mean transit time involving the right middle cerebral territory (arrows). C. Cerebral blood volume (CBV) map shows reduced CBV involving an area within the defect shown in B, indicating a high likelihood of infarction (arrows). D. Axial maximum-intensity projection from a CT angiography (CTA) study through the circle of Willis demonstrates an abrupt occlusion of the proximal right middle cerebral artery (arrow). E. Sagittal reformation through the right internal carotid artery demonstrates a low-density lipid-laden plaque (arrowheads) narrowing the lumen (black arrow). F. Three-dimensional surface-rendered CTA image demonstrates calcification and narrowing of the right internal carotid artery (arrow), consistent with atherosclerotic disease. G. Coronal maximum-intensity projection from magnetic resonance angiography shows right middle cerebral artery (MCA) occlusion (arrow). H. and I. Axial diffusion-weighted image (H) and apparent diffusion coefficient image (I) documents the presence of a right middle cerebral artery infarction.
Intravenous iodinated contrast is often administered to identify both vascular structures and to detect defects in the blood-brain barrier (BBB) that are caused by tumors, infarcts, and infections. In the normal CNS, only vessels and structures lacking a BBB (e.g., the pituitary gland, choroid plexus, and dura) enhance after contrast administration. The use of iodinated contrast agents carries a small risk of allergic reaction and adds additional expense. While helpful in characterizing mass lesions as well as essential for the acquisition of CTA studies, the decision to use contrast material should always be considered carefully.
INDICATIONS
CT is the primary study of choice in the evaluation of an acute change in mental status, focal neurologic findings, acute trauma to the brain and spine, suspected subarachnoid hemorrhage, and conductive hearing loss (Table 440e-1). CT is complementary to MR in the evaluation of the skull base, orbit, and osseous structures of the spine. In the spine, CT is useful in evaluating patients with osseous spinal stenosis and spondylosis, but MRI is often preferred in those with neurologic deficits. CT can also be obtained following intrathecal contrast injection to evaluate the intracranial cisterns (CT cisternography) for cerebrospinal fluid (CSF) fistula, as well as the spinal subarachnoid space (CT myelography), although intrathecal administration of gadolinium combined with MR may also be complementary.
COMPLICATIONS
CT is safe, fast, and reliable. Radiation exposure depends on the dose used but is normally between 2 and 5 mSv (millisievert) for a routine brain CT study. Care must be taken to reduce exposure when imaging children. With the advent of MDCT, CTA, and CT perfusion, the benefit must be weighed against the increased radiation doses associated with these techniques. Advanced noise reduction software now permits acceptable diagnostic CT scans at 30–40% lower radiation doses.
The most frequent complications are those associated with use of intravenous contrast agents. While two broad categories of contrast media, ionic and nonionic, are in use, ionic agents have been largely replaced by safer nonionic compounds.
Contrast nephropathy may result from hemodynamic changes, renal tubular obstruction and cell damage, or immunologic reactions to contrast agents. A rise in serum creatinine of at least 85 μmol/L (1 mg/dL) within 48 h of contrast administration is often used as a definition of contrast nephropathy, although other causes of acute renal failure must be excluded. The prognosis is usually favorable, with serum creatinine levels returning to baseline within 1–2 weeks. Risk factors for contrast nephropathy include advanced age (>80 years), preexisting renal disease (serum creatinine exceeding 2 mg/dL), solitary kidney, diabetes mellitus, dehydration, paraproteinemia, concurrent use of nephrotoxic medication or chemotherapeutic agents, and high contrast dose. Patients with diabetes and those with mild renal failure should be well hydrated prior to the administration of contrast agents, although careful consideration should be given to alternative imaging techniques such as MRI, noncontrast CT, or ultrasound (US). Nonionic, low-osmolar media produce fewer abnormalities in renal blood flow and less endothelial cell damage but should still be used carefully in patients at risk for allergic reaction. Estimated glomerular filtration rate (eGFR) is a more reliable indicator of renal function compared to creatinine alone because it takes into account age, race, and sex. In one study, 15% of outpatients with a normal serum creatinine had an estimated creatinine clearance of 50 mL/min/1.73 m2 or less (normal is ≥90 mL/min/1.73 m2). The exact eGFR threshold, below which withholding intravenous contrast should be considered, is controversial. The risk of contrast nephropathy increases in patients with an eGFR <60 mL/min/1.73 m2; however, the majority of these patients will only have a temporary rise in creatinine. The risk of dialysis after receiving contrast significantly increases in patients with eGFR <30 mL/min/1.73 m2. Thus, an eGFR threshold between 60 and 30 mL/min/1.73 m2 is appropriate; however, the exact number is somewhat arbitrary. A creatinine of 1.6 in a 70-year-old, non-African-American male corresponds to an eGFR of approximately 45 mL/min/1.73 m2. The American College of Radiology suggests using an eGFR of 45 mL/min/1.73 m2 as a threshold below which iodinated contrast should not be given without serious consideration of the potential for contrast nephropathy. If contrast must be administered to a patient with an eGFR below 45 mL/min/1.73 m2, the patient should be well hydrated, and a reduction in the dose of contrast should be considered. Use of other agents such as bicarbonate and acetylcysteine may reduce the incidence of contrast nephropathy.
Allergy Immediate reactions following intravenous contrast media can occur through several mechanisms. The most severe reactions are related to allergic hypersensitivity (anaphylaxis) and range from mild hives to bronchospasm and death. The pathogenesis of allergic hypersensitivity reactions is thought to include the release of mediators such as histamine, antibody-antigen reactions, and complement activation. Severe allergic reactions occur in ~0.04% of patients receiving nonionic media, sixfold lower than with ionic media. Risk factors include a history of prior contrast reaction (fivefold increased likelihood), food and or drug allergies, and atopy (asthma and hay fever). The predictive value of specific allergies, such as those to shellfish, once thought important, actually is now recognized to be unreliable. Nonetheless, in patients with a history worrisome for potential allergic reaction, a noncontrast CT or MRI procedure should be considered as an alternative to contrast administration. If iodinated contrast is absolutely required, a nonionic agent should be used in conjunction with pretreatment with glucocorticoids and antihistamines (Table 440e-2); however, pretreatment does not guarantee safety. Patients with allergic reactions to iodinated contrast material do not usually react to gadolinium-based MR contrast material, although such reactions can occur. It would be wise to pretreat patients with a prior allergic history to MR contrast administration in a similar fashion. Nonimmediate (>1 h after injection) reactions are frequent and probably related to T cell–mediated immune reactions. These are typically urticarial but can occasionally be more severe. Drug provocation and skin testing may be required to determine the culprit agent involved as well as determine a safe alternative.
|
GUIDELINES FOR PREMEDICATION OF PATIENTS WITH PRIOR CONTRAST ALLERGY |
Other side effects of CT scanning are rare but include a sensation of warmth throughout the body and a metallic taste during intravenous administration of iodinated contrast media. Extravasation of contrast media, although rare, can be painful and lead to compartment syndrome. When this occurs, consultation with plastic surgery is indicated. Patients with significant cardiac disease may be at increased risk for contrast reactions, and in these patients, limits to the volume and osmolality of the contrast media should be considered. Patients who may undergo systemic radioactive iodine therapy for thyroid disease or cancer should not receive iodinated contrast media if possible, because this will decrease the uptake of the radioisotope into the tumor or thyroid (see the American College of Radiology Manual on Contrast Media, Version 9, 2013; http://www.acr.org/~/media/ACR/Documents/PDF/QualitySafety/Resources/Contrast%20Manual/2013_Contrast_Media.pdf).
MAGNETIC RESONANCE IMAGING
TECHNIQUE
MRI is a complex interaction between hydrogen protons in biologic tissues, a static magnetic field (the magnet), and energy in the form of radiofrequency (Rf) waves of a specific frequency introduced by coils placed next to the body part of interest. Images are made by computerized processing of resonance information received from protons in the body. Field strength of the magnet is directly related to signal-to-noise ratio. While 1.5-T magnets have become the standard high-field MRI units, 3-T magnets are now widely available and have distinct advantages in the brain and musculoskeletal systems. Even higher field magnets (7-T) and positron emission tomography (PET) MR machines promise increased resolution and anatomic-functional information on a variety of disorders. Spatial localization is achieved by magnetic gradients surrounding the main magnet, which impart slight changes in magnetic field throughout the imaging volume. Rf pulses transiently excite the energy state of the hydrogen protons in the body. Rf is administered at a frequency specific for the field strength of the magnet. The subsequent return to equilibrium energy state (relaxation) of the hydrogen protons results in a release of Rf energy (the echo), which is detected by the coils that delivered the Rf pulses. Fourier analysis is used to transform the echo into the information used to form an MR image. The MR image thus consists of a map of the distribution of hydrogen protons, with signal intensity imparted by both density of hydrogen protons and differences in the relaxation times (see below) of hydrogen protons on different molecules. Although clinical MRI currently makes use of the ubiquitous hydrogen proton, research into sodium and carbon imaging and spectroscopy appears promising.
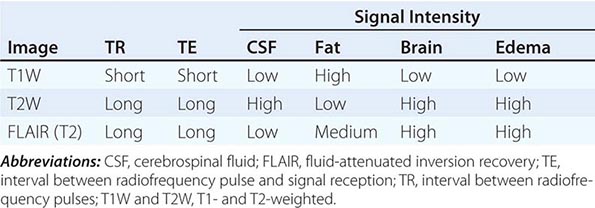
T1 and T2 Relaxation Times The rate of return to equilibrium of perturbed protons is called the relaxation rate. The relaxation rate varies among normal and pathologic tissues. The relaxation rate of a hydrogen proton in a tissue is influenced by local interactions with surrounding molecules and atomic neighbors. Two relaxation rates, T1 and T2, influence the signal intensity of the image. The T1 relaxation time is the time, measured in milliseconds, for 63% of the hydrogen protons to return to their normal equilibrium state, whereas the T2 relaxation is the time for 63% of the protons to become dephased owing to interactions among nearby protons. The intensity and image contrast of the signal within various tissues can be modulated by altering acquisition parameters such as the interval between Rf pulses (TR) and the time between the Rf pulse and the signal reception (TE). T1-weighted (T1W) images are produced by keeping the TR and TE relatively short, whereas using longer TR and TE times produces T2-weighted (T2W) images. Fat and subacute hemorrhage have relatively shorter T1 relaxation rates and thus higher signal intensity than brain on T1W images. Structures containing more water, such as CSF and edema, have long T1 and T2 relaxation rates, resulting in relatively lower signal intensity on T1W images and higher signal intensity on T2W images (Table 440e-3). Gray matter contains 10–15% more water than white matter, which accounts for much of the intrinsic contrast between the two on MRI (Fig. 440e-6B). T2W images are more sensitive than T1W images to edema, demyelination, infarction, and chronic hemorrhage, whereas T1W imaging is more sensitive to subacute hemorrhage and fat-containing structures.
|
SOME COMMON INTENSITIES ON T1- AND T2-WEIGHTED MRI SEQUENCES |
Many different MR pulse sequences exist, and each can be obtained in various planes (Figs. 440e-2, 440e-3, and 440e-4). The selection of a proper protocol that will best answer a clinical question depends on an accurate clinical history and indication for the examination. Fluid-attenuated inversion recovery (FLAIR) is a useful pulse sequence that produces T2W images in which the normally high signal intensity of CSF is suppressed (Fig. 440e-6B). FLAIR images are more sensitive than standard spin echo images for any water-containing lesions or edema. Susceptibility-weighted imaging, such as gradient echo imaging, is very sensitive to magnetic susceptibility generated by blood, calcium, and air and routinely obtained in patients suspected of pathology that might result in microhemorrhages, such as amyloid, hemorrhagic metastases, and thrombotic states (Fig. 440e-5C). MR images can be generated in any plane without changing the patient’s position. Each sequence, however, must be obtained separately and takes 1–10 min on average to complete. Three-dimensional volumetric imaging is also possible with MRI, resulting in a three-dimensional volume of data that can be reformatted in any orientation to highlight certain disease processes.
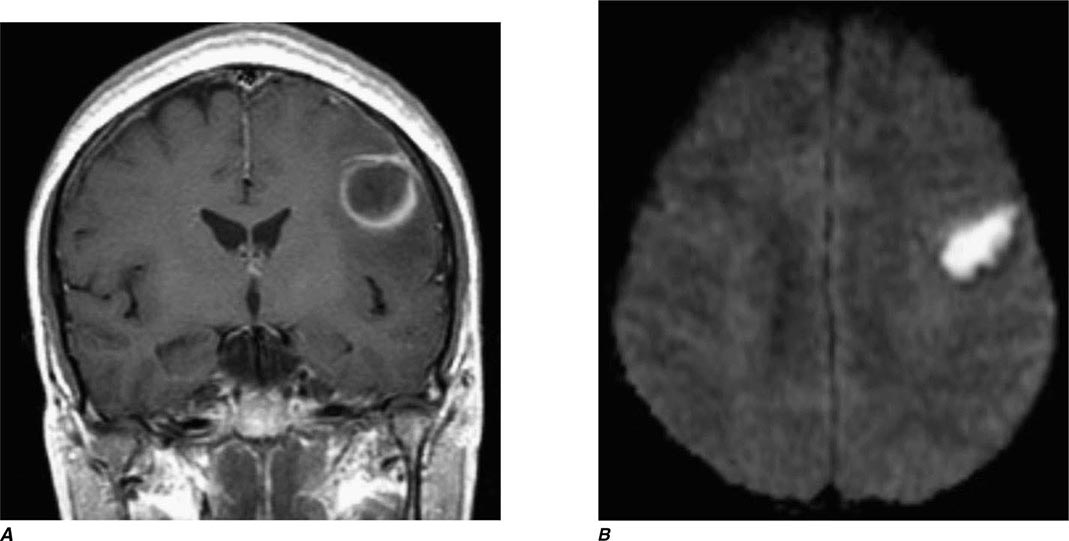
FIGURE 440e-3 Cerebral abscess in a patient with fever and a right hemiparesis. A. Coronal postcontrast T1-weighted image demonstrates a ring-enhancing mass in the left frontal lobe. B. Axial diffusion-weighted image demonstrates restricted diffusion (high signal intensity) within the lesion, which in this setting is highly suggestive of cerebral abscess.
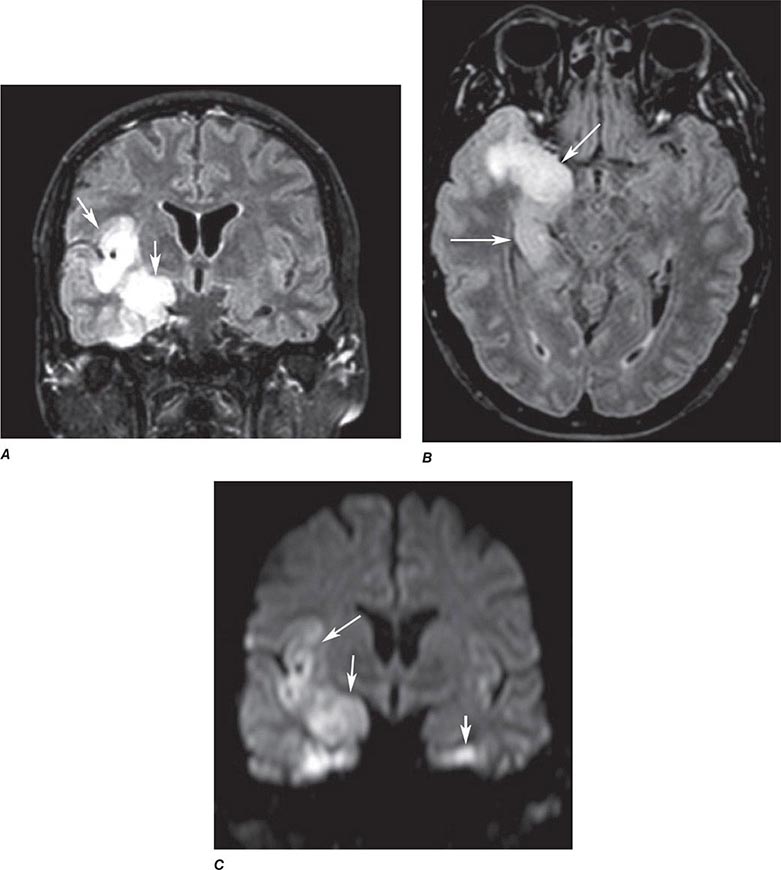
FIGURE 440e-4 Herpes simplex encephalitis in a patient presenting with altered mental status and fever. A. and B. Coronal (A) and axial (B) T2-weighted fluid-attenuated inversion recovery images demonstrate expansion and high signal intensity involving the right medial temporal lobe and insular cortex (arrows). C. Coronal diffusion-weighted image demonstrates high signal intensity indicating restricted diffusion involving the right medial temporal lobe and hippocampus (arrows) as well as subtle involvement of the left inferior temporal lobe (arrowhead). This is most consistent with neuronal death and can be seen in acute infarction as well as encephalitis and other inflammatory conditions. The suspected diagnosis of herpes simplex encephalitis was confirmed by cerebrospinal fluid polymerase chain reaction analysis.
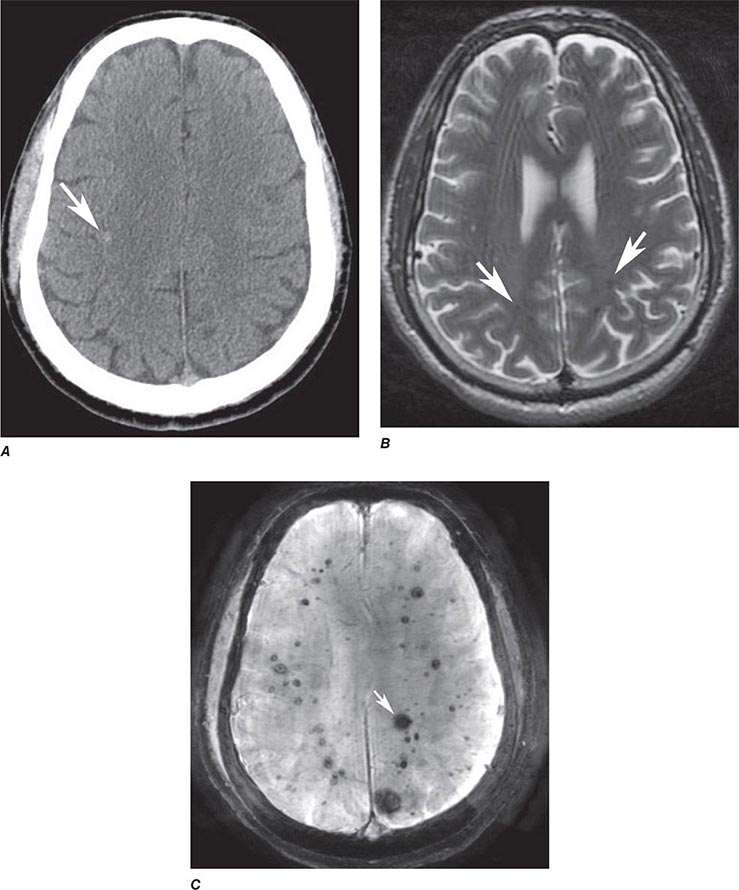
FIGURE 440e-5 Susceptibility-weighted imaging in a patient with familial cavernous malformations. A. Noncontrast computed tomography scan shows one hyperdense lesion in the right hemisphere (arrow). B. T2-weighted fast spin echo image shows subtle low-intensity lesions (arrows). C. Susceptibility-weighted image shows numerous low-intensity lesions consistent with hemosiderin-laden cavernous malformations (arrow).
MR Contrast Material The heavy-metal element gadolinium forms the basis of all currently approved intravenous MR contrast agents. Gadolinium is a paramagnetic substance, which means that it reduces the T1 and T2 relaxation times of nearby water protons, resulting in a high signal on T1W images and a low signal on T2W images (the latter requires a sufficient local concentration, usually in the form of an intravenous bolus). Unlike iodinated contrast agents, the effect of MR contrast agents depends on the presence of local hydrogen protons on which it must act to achieve the desired effect. There are nine different gadolinium agents approved in the United States for use with MRI. These differ according the attached chelated moiety, which also affects the strength of chelation of the otherwise toxic gadolinium element. The chelating carrier molecule for gadolinium can be classified by whether it is macrocyclic or has linear geometry and whether it is ionic or nonionic. Most of these are excreted by the renal system. Cyclical agents are less likely to release the gadolinium element, and thus are considered the safest category.
ALLERGIC HYPERSENSITIVITY Gadolinium-DTPA (diethylenetriaminepentaacetic acid) does not normally cross the intact BBB immediately but will enhance lesions lacking a BBB (Fig. 440e-3A) as well as areas of the brain that normally are devoid of the BBB (pituitary, dura, choroid plexus). However, gadolinium contrast has been noted to slowly cross an intact BBB over time and especially in the setting of reduced renal clearance or inflamed meninges. The agents are generally well tolerated; overall adverse events after injection range from 0.07–2.4%. True allergic reactions are rare (0.004–0.7%) but have been reported. Severe life-threatening reactions are exceedingly rare; in one report, only 55 reactions out of 20 million doses occurred. However, the adverse reaction rate in patients with a prior history of reaction to gadolinium is eight times higher than normal. Other risk factors include atopy or asthma (3.7%); although there is no cross-reactivity to iodinated contrast material, those with a prior allergic response to iodine should be considered at higher risk. Gadolinium contrast material can be administered safely to children as well as adults, although these agents are generally avoided in those under 6 months of age.
NEPHROTOXICITY Contrast-induced renal failure does not occur with gadolinium agents. A rare complication, nephrogenic systemic fibrosis (NSF), has occurred in patients with severe renal insufficiency who have been exposed to gadolinium contrast agents. The onset of NSF has been reported between 5 and 75 days following exposure; histologic features include thickened collagen bundles with surrounding clefts, mucin deposition, and increased numbers of fibrocytes and elastic fibers in skin. In addition to dermatologic symptoms, other manifestations include widespread fibrosis of the skeletal muscle, bone, lungs, pleura, pericardium, myocardium, kidney, muscle, bone, testes, and dura. The American College of Radiology recommends that a glomerular filtration rate (GFR) assessment be obtained within 6 weeks prior to elective gadolinium-based MR contrast agent administration in patients with:
1. A history of renal disease (including solitary kidney, renal transplant, renal tumor)
2. Age >60 years
3. History of hypertension
4. History of diabetes
5. History of severe hepatic disease, liver transplant, or pending liver transplant; for these patients, it is recommended that the patient’s GFR assessment be nearly contemporaneous with the MR examination
The incidence of NSF in patients with severe renal dysfunction (GFR <30) varies from 0.19 to 4%. Other risk factors for NSF include acute kidney injury, the use of nonmacrocyclic agents, and repeated or high-dose exposure to gadolinium. The American College of Radiology Committee on Drugs and Contrast Media states that patients receiving any gadolinium-containing agent should be considered at risk of NSF if they are on dialysis (of any form); have severe or end-stage chronic renal disease (eGFR <30 mL/min/1.73 m2) without dialysis; eGFR of 30–40 mL/min/1.73 m2 without dialysis (as the GFR may fluctuate); or have acute renal insufficiency.
COMPLICATIONS AND CONTRAINDICATIONS
From the patient’s perspective, an MRI examination can be intimidating, and a higher level of cooperation is required than with CT. The patient lies on a table that is moved into a long, narrow gap within the magnet. Approximately 5% of the population experiences severe claustrophobia in the MR environment. This can be reduced by mild sedation but remains a problem for some. Because it takes between 3 and 10 min per sequence, movement of the patient during an MR exam distorts all of the images; therefore, uncooperative patients should either be sedated for the MR study or scanned with CT. Generally, children under the age of 8 years usually require conscious sedation in order to complete the MR examination without motion degradation.
MRI is considered safe for patients, even at very high field strengths. Serious injuries have been caused, however, by attraction of ferromagnetic objects into the magnet, which act as missiles if brought too close to the magnet. Likewise, ferromagnetic implants, such as aneurysm clips, may torque within the magnet, causing damage to vessels and even death. Metallic foreign bodies in the eye have moved and caused intraocular hemorrhage; screening for ocular metallic fragments is indicated in those with a history of metal work or ocular metallic foreign bodies. Implanted cardiac pacemakers are generally a contraindication to MRI owing to the risk of induced arrhythmias; however, some newer pacemakers have been shown to be safe. All health care personnel and patients must be screened and educated thoroughly to prevent such disasters because the magnet is always “on.” Table 440e-4 lists common contraindications for MRI.
|
COMMON CONTRAINDICATIONS TO MAGNETIC RESONANCE IMAGING |
Note: See also http://www.mrisafety.com.
MAGNETIC RESONANCE ANGIOGRAPHY
MR angiography is a general term describing several MR techniques that result in vascular-weighted images. These provide a vascular flow map rather than the anatomic map shown by conventional angiography. On routine spin echo MR sequences, moving protons (e.g., flowing blood, CSF) exhibit complex MR signals that range from high- to low-signal intensity relative to background stationary tissue. Fast-flowing blood returns no signal (flow void) on routine T1W or T2W spin echo MR images. Slower-flowing blood, as occurs in veins or distal to arterial stenosis, may appear high in signal. However, using special pulse sequences called gradient echo sequences, it is possible to increase the signal intensity of moving protons in contrast to the low signal background intensity of stationary tissue. This creates angiography-like images, which can be manipulated in three dimensions to highlight vascular anatomy and relationships.
So called time-of-flight (TOF) MRA relies on the suppression of nonmoving tissue to provide a low-intensity background for the high signal intensity of flowing blood entering the section; arterial or venous structures may be highlighted. A typical TOF MRA sequence results in a series of contiguous, thin MR sections (0.6–0.9 mm thick), which can be viewed as a stack and manipulated to create an angiographic image data set that can be reformatted and viewed in various planes and angles, much like that seen with conventional angiography (Fig. 440e-2G).
Phase-contrast MRA has a longer acquisition time than TOF MRA, but in addition to providing anatomic information similar to that of TOF imaging, it can be used to reveal the velocity and direction of blood flow in a given vessel. Through the selection of different imaging parameters, differing blood velocities can be highlighted; selective venous and arterial MRA images can thus be obtained. One advantage of phase-contrast MRA is the excellent suppression of high-signal-intensity background structures.
MRA can also be acquired during infusion of contrast material. Advantages include faster imaging times (1–2 min vs 10 min), fewer flow-related artifacts, and higher resolution images. Recently, contrast-enhanced MRA has become the standard for extracranial vascular MRA. This technique entails rapid imaging using coronal three-dimensional TOF sequences during a bolus infusion of gadolinium contrast agent. Proper technique and timing of acquisition relative to bolus arrival are critical for success.
MRA has lower spatial resolution compared with conventional film-based angiography, and therefore the detection of small-vessel abnormalities, such as vasculitis and distal vasospasm, is problematic. MRA is also less sensitive to slowly flowing blood and thus may not reliably differentiate complete from near-complete occlusions. Motion, either by the patient or by anatomic structures, may distort the MRA images, creating artifacts. These limitations notwithstanding, MRA has proved useful in evaluation of the extracranial carotid and vertebral circulation as well as of larger-caliber intracranial arteries and dural sinuses. It has also proved useful in the noninvasive detection of intracranial aneurysms and vascular malformations.
ECHO-PLANAR MRI
Recent improvements in gradients, software, and high-speed computer processors now permit extremely rapid MRI of the brain. With echo-planar MRI (EPI), fast gradients are switched on and off at high speeds to create the information used to form an image. In routine spin echo imaging, images of the brain can be obtained in 5–10 min. With EPI, all of the information required for processing an image is accumulated in milliseconds, and the information for the entire brain can be obtained in less than 1–2 min, depending on the degree of resolution required or desired. Fast MRI reduces patient and organ motion and is the basis of perfusion imaging during contrast infusion and kinematic motion studies. EPI is also the sequence used to obtain diffusion imaging and tractography, as well as fMRI and arterial spin-labeled studies (Figs. 440e-2H, 440e-3, 440e-4C, and 440e-6; and see Fig. 446-16).
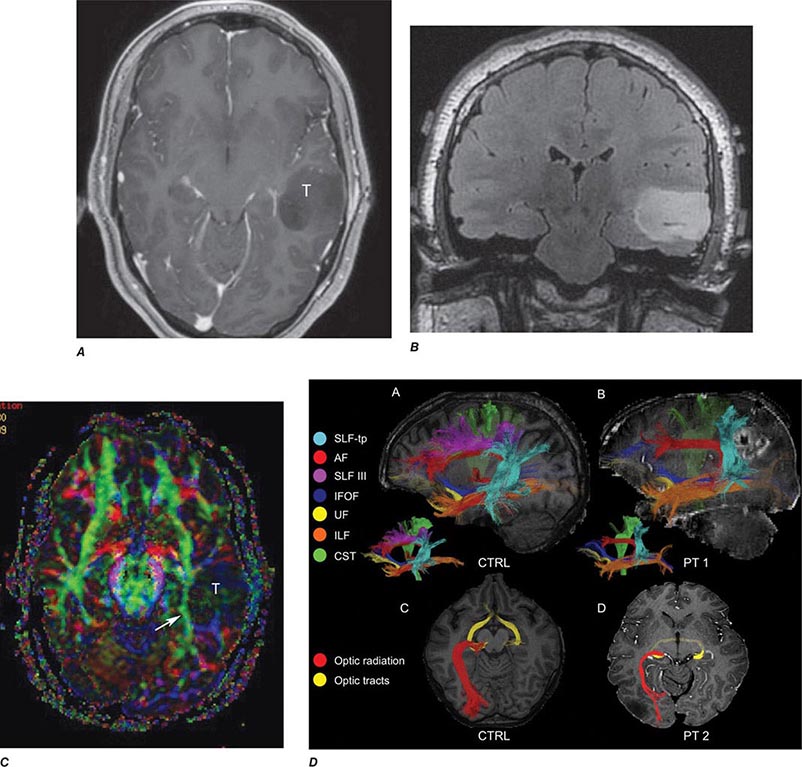
FIGURE 440e-6 Diffusion tractography in cerebral glioma. Associative and descending pathways in a healthy subject (A) and in a patient with parietal lobe glioblastoma (B) presenting with a language deficit: the mass causes a disruption of the arcuate-SLF complex, in particular of its anterior portion (SLF III). Also shown are bilateral optic tract and left optic radiation pathways in a healthy subject (C) and in a patient with left occipital grade II oligoastrocytoma (D): the mass causes a disruption of the left optic radiation. Shown in neurologic orientation, i.e., the left brain appears on the left side of the image. AF, long segment of the arcuate fascicle; CST, corticospinal tract; IFOF: inferior fronto-occipital fascicle; ILF, inferior longitudinal fascicle; SLF III, superior longitudinal fascicle III or anterior segment of the arcuate fascicle; SLF-tp, temporo-parietal portion of the superior longitudinal fascicle or posterior segment of the arcuate fascicle; T, tumor; UF, uncinated fascicle. (Part D courtesy of Eduardo Caverzasi and Roland Henry.)
Perfusion and diffusion imaging are EPI techniques that are useful in early detection of ischemic injury of the brain and may be useful together to demonstrate infarcted tissue as well as ischemic but potentially viable tissue at risk of infarction (e.g., the ischemic penumbra). Diffusion-weighted imaging (DWI) assesses microscopic motion of water; abnormal restriction of motion appears as relative high-signal intensity on diffusion-weighted images. Infarcted tissue reduces the water motion within cells and in the interstitial tissues, resulting in high signal on DWI. DWI is the most sensitive technique for detection of acute cerebral infarction of <7 days in duration (Fig. 440e-2H). It is also quite sensitive for detecting dying or dead brain tissue secondary to encephalitis, as well as abscess formation (Fig. 440e-3B).
Perfusion MRI involves the acquisition of fast echo planar gradient images during a rapid intravenous bolus of gadolinium contrast material. Relative cerebral blood volume, mean transit time, and cerebral blood flow maps are then derived. Delay in mean transit time and reduction in cerebral blood volume and cerebral blood flow are typical of infarction. In the setting of reduced blood flow, a prolonged mean transit time of contrast but normal or elevated cerebral blood volume may indicate tissue supplied by collateral flow that is at risk of infarction. Perfusion MRI imaging can also be used in the assessment of brain tumors to differentiate intraaxial primary tumors, whose BBB is relatively intact, from extraaxial tumors or metastases, which demonstrate a relatively more permeable BBB.
Diffusion tensor imaging is derived from diffusion MRI imaging sequences, which assesses the direction of microscopic motion of water along white matter tracts. This technique has great potential in the assessment of brain maturation as well as disease entities that undermine the integrity of the white matter architecture. It has proven valuable in preoperative assessment of subcortical white matter tract anatomy prior to brain tumor surgery (Fig. 440e-6).
fMRI of the brain is an EPI technique that localizes regions of activity in the brain following task activation. Neuronal activity elicits a slight increase in the delivery of oxygenated blood flow to a specific region of activated brain. This results in an alteration in the balance of oxyhemoglobin and deoxyhemoglobin, which yields a 2–3% increase in signal intensity within veins and local capillaries. Further studies will determine whether these techniques are cost effective or clinically useful, but currently, preoperative somatosensory and auditory cortex localization is possible. This technique has proved useful to neuroscientists interested in interrogating the localization of certain brain functions.
ARTERIAL SPIN LABELING
ASL is a quantitative noninvasive MR technique that measures cerebral blood flow. Blood traversing in the neck is labeled by an MR pulse and then imaged in the brain after a short delay. The signal in the brain is reflective of blood flow. ASL is an especially important technique for patients with kidney failure and for pediatric patients in whom the use of radioactive tracers or exogenous contrast agents is contraindicated. Increased cerebral flow is more easily identified than slow flow, which can be sometimes difficult to quantify. This technique has also been shown useful in detecting arterial venous shunting in arteriovenous malformations and arteriovenous fistulas.
MAGNETIC RESONANCE NEUROGRAPHY
MRN is a T2W MR technique that shows promise in detecting increased signal in irritated, inflamed, or infiltrated peripheral nerves. Images are obtained with fat-suppressed fast spin echo imaging or short inversion recovery sequences. Irritated or infiltrated nerves will demonstrate high signal on T2W imaging. This is indicated in patients with radiculopathy whose conventional MR studies of the spine are normal, or in those suspected of peripheral nerve entrapment or trauma.
POSITRON EMISSION TOMOGRAPHY
PET relies on the detection of positrons emitted during the decay of a radionuclide that has been injected into a patient. The most frequently used moiety is 2-[18F]fluoro-2-deoxy-D-glucose (FDG), which is an analogue of glucose and is taken up by cells competitively with 2-deoxyglucose. Multiple images of glucose uptake activity are formed after 45–60 min. Images reveal differences in regional glucose activity among normal and pathologic brain structures. FDG-PET is used primarily for the detection of extracranial metastatic disease; however, a lower activity of FDG in the parietal lobes is associated with Alzheimer’s disease, a finding that may simply reflect atrophy that occurs in the later stages of the disease. Combination PET-CT scanners, in which both CT and PET are obtained at one sitting, have largely replaced PET scans alone for most clinical indications. MR-PET scanners have also been developed and may prove useful for imaging the brain and other organs without the radiation exposure of CT. More recent PET ligand developments include amyloid tracers, such as Pittsburgh compound B (PIB) and 18-F AV-45 (florbetapir), and tau PET tracers, such as 18F-T807 and T808. Studies have shown an increased percentage of amyloid deposition in patients with Alzheimer’s disease compared with mild cognitive impairment and healthy controls; however, up to 25% of cognitively “normal” patients show abnormalities on amyloid PET imaging. This may either reflect subclinical disease processes or variation of normal. Tau imaging may be more specific for Alzheimer’s disease, and clinical studies are under way.
MYELOGRAPHY
TECHNIQUE
Myelography involves the intrathecal instillation of specially formulated water-soluble iodinated contrast medium into the lumbar or cervical subarachnoid space. CT scanning is typically performed after myelography (CT myelography) to better demonstrate the spinal cord and roots, which appear as filling defects in the opacified subarachnoid space. Low-dose CT myelography, in which CT is performed after the subarachnoid injection of a small amount of relatively dilute contrast material, has replaced conventional myelography for many indications, thereby reducing exposure to radiation and contrast media. Newer multidetector scanners now obtain CT studies quickly so that reformations in sagittal and coronal planes, equivalent to traditional myelography projections, are now routine.
INDICATIONS
Myelography has been largely replaced by CT myelography and MRI for diagnosis of diseases of the spinal canal and cord (Table 440e-1). Remaining indications for conventional plain-film myelography include the evaluation of suspected meningeal or arachnoid cysts and the localization of CSF fistulas. Conventional myelography and CT myelography provide the most precise information in patients with prior spinal fusion and spinal fixation hardware.
CONTRAINDICATIONS
Myelography is relatively safe; however, it should be performed with caution in any patient with elevated intracranial pressure, evidence of a spinal block, or a history of allergic reaction to intrathecal contrast media. In patients with a suspected spinal block, MR is the preferred technique. If myelography is necessary, only a small amount of contrast medium should be instilled below the lesion in order to minimize the risk of neurologic deterioration. Lumbar puncture is to be avoided in patients with bleeding disorders, including patients receiving anticoagulant therapy, as well as in those with infections of the overlying soft tissues (Chap. 443e).
COMPLICATIONS
Headache is the most frequent complication of myelography and is reported to occur in 5–30% of patients. Nausea and vomiting may also occur rarely. Postural headache (post–lumbar puncture headache) is generally due to leakage of CSF from the puncture site, resulting in CSF hypotension. A higher incidence is noted among younger women and with the use of larger gauge cutting-type spinal needles. If significant headache persists for longer than 48 h, placement of an epidural blood patch should be considered. Management of lumbar puncture headache is discussed in Chap. 21. Vasovagal syncope may occur during lumbar puncture; it is accentuated by the upright position used during lumbar myelography. Adequate hydration before and after myelography will reduce the incidence of this complication.
Hearing loss is a rare complication of myelography. It may result from a direct toxic effect of the contrast medium or from an alteration of the pressure equilibrium between CSF and perilymph in the inner ear. Puncture of the spinal cord is a rare but serious complication of cervical (C1–2) or high lumbar puncture. The risk of cord puncture is greatest in patients with spinal stenosis, Chiari malformations, or conditions that reduce CSF volume. In these settings, a low-dose lumbar injection followed by thin-section CT or MRI is a safer alternative to cervical puncture. Intrathecal contrast reactions are rare, but aseptic meningitis and encephalopathy are reported complications. The latter is usually dose related and associated with contrast entering the intracranial subarachnoid space. Seizures occur following myelography in 0.1–0.3% of patients. Risk factors include a preexisting seizure disorder and the use of a total iodine dose of >4500 mg. Other reported complications include hyperthermia, hallucinations, depression, and anxiety states. These side effects have been reduced by the development of nonionic, water-soluble contrast agents as well as by head elevation and generous hydration following myelography.
SPINE INTERVENTIONS
DISKOGRAPHY
The evaluation of back pain and radiculopathy may require diagnostic procedures that attempt either to reproduce the patient’s pain or relieve it, indicating its correct source prior to lumbar fusion. Diskography is performed by fluoroscopic placement of a 22- to 25-gauge needle into the intervertebral disk and subsequent injection of 1–3 mL of contrast media. The intradiskal pressure is recorded, as is an assessment of the patient’s response to the injection of contrast material. Typically little or no pain is felt during injection of a normal disk, which does not accept much more than 1 mL of contrast material, even at pressures as high as 415–690 kPa (60–100 lb/in2). CT and plain films are obtained following the procedure. Concerns have been raised that diskography may contribute to an accelerated rate of disk degeneration.
SELECTIVE NERVE ROOT AND EPIDURAL SPINAL INJECTIONS
Percutaneous selective nerve root and epidural blocks with glucocorticoid and anesthetic mixtures may be both therapeutic and diagnostic, especially if a patient’s pain is relieved. Typically, 1–2 mL of an equal mixture of a long-acting glucocorticoid such as betamethasone and a long-acting anesthetic such as bupivacaine 0.75% is instilled under CT or fluoroscopic guidance in the intraspinal epidural space or adjacent to an existing nerve root.
ANGIOGRAPHY
Catheter angiography is indicated for evaluating intracranial small-vessel pathology (such as vasculitis), for assessing vascular malformations and aneurysms, and in endovascular therapeutic procedures (Table 440e-1). Angiography has been replaced for many indications by CT/CTA or MRI/MRA.
Angiography carries the greatest risk of morbidity of all diagnostic imaging procedures, owing to the necessity of inserting a catheter into a blood vessel, directing the catheter to the required location, injecting contrast material to visualize the vessel, and removing the catheter while maintaining hemostasis. Therapeutic transcatheter procedures (see below) have become important options for the treatment of some cerebrovascular diseases. The decision to undertake a diagnostic or therapeutic angiographic procedure requires careful assessment of the goals of the investigation and its attendant risks.
To improve tolerance to contrast agents, patients undergoing angiography should be well hydrated before and after the procedure. Because the femoral route is used most commonly, the femoral artery must be compressed after the procedure to prevent a hematoma from developing. The puncture site and distal pulses should be evaluated carefully after the procedure; complications can include thigh hematoma or lower extremity emboli.
COMPLICATIONS
A common femoral arterial puncture provides retrograde access via the aorta to the aortic arch and great vessels. The most feared complication of cerebral angiography is stroke. Thrombus can form on or inside the tip of the catheter, and atherosclerotic thrombus or plaque can be dislodged by the catheter or guide wire or by the force of injection and can embolize distally in the cerebral circulation. Risk factors for ischemic complications include limited experience on the part of the angiographer, atherosclerosis, vasospasm, low cardiac output, decreased oxygen-carrying capacity, advanced age, and prior history of migraine. The risk of a neurologic complication varies but is ~4% for transient ischemic attack and stroke, 1% for permanent deficit, and <0.1% for death.
Ionic contrast material injected into the cerebral vasculature can be neurotoxic if the BBB is breached, either by an underlying disease or by the injection of hyperosmolar contrast agent. Ionic contrast media are less well tolerated than nonionic media, probably because they can induce changes in cell membrane electrical potentials. Patients with dolichoectasia of the basilar artery can suffer reversible brainstem dysfunction and acute short-term memory loss during angiography, owing to the slow percolation of the contrast material and the consequent prolonged exposure of the brain. Rarely, an intracranial aneurysm ruptures during an angiographic contrast injection, causing subarachnoid hemorrhage, perhaps as a result of injection under high pressure.
SPINAL ANGIOGRAPHY
Spinal angiography may be indicated to evaluate vascular malformations and tumors and to identify the artery of Adamkiewicz (Chap. 456) prior to aortic aneurysm repair. The procedure is lengthy and requires the use of relatively large volumes of contrast; the incidence of serious complications, including paraparesis, subjective visual blurring, and altered speech, is ~2%. Gadolinium-enhanced MRA has been used successfully in this setting, as has iodinated contrast CTA, which has promise for replacing diagnostic spinal angiography for some indications.
INTERVENTIONAL NEURORADIOLOGY
This rapidly developing field is providing new therapeutic options for patients with challenging neurovascular problems. Available procedures include detachable coil therapy for aneurysms, particulate or liquid adhesive embolization of arteriovenous malformations, stent retrieval systems for embolectomy, balloon angioplasty and stenting of arterial stenosis or vasospasm, transarterial or transvenous embolization of dural arteriovenous fistulas, balloon occlusion of carotid-cavernous and vertebral fistulas, endovascular treatment of vein-of-Galen malformations, preoperative embolization of tumors, and thrombolysis of acute arterial or venous thrombosis. Many of these disorders place the patient at high risk of cerebral hemorrhage, stroke, or death.
The highest complication rates are found with the therapies designed to treat the highest risk diseases. The advent of electrolytically detachable coils has ushered in a new era in the treatment of cerebral aneurysms. Two randomized trials found reductions of morbidity and mortality at 1 year among those treated for aneurysm with detachable coils compared with neurosurgical clipping. It remains to be determined what the role of coils will be relative to surgical options, but in many centers, coiling has become standard therapy for many aneurysms.
441e |
Atlas of Neuroimaging |
This atlas comprises 48 cases to assist the clinician caring for patients with neurologic symptoms. The majority of the images shown are magnetic resonance imaging (MRI) scans; other techniques illustrated include magnetic resonance (MR) and conventional angiography and computed tomography (CT) scans. Many different categories of neurologic disease are illustrated, including numerous examples of ischemic, inflammatory, inherited, vascular, and neoplastic etiologies.
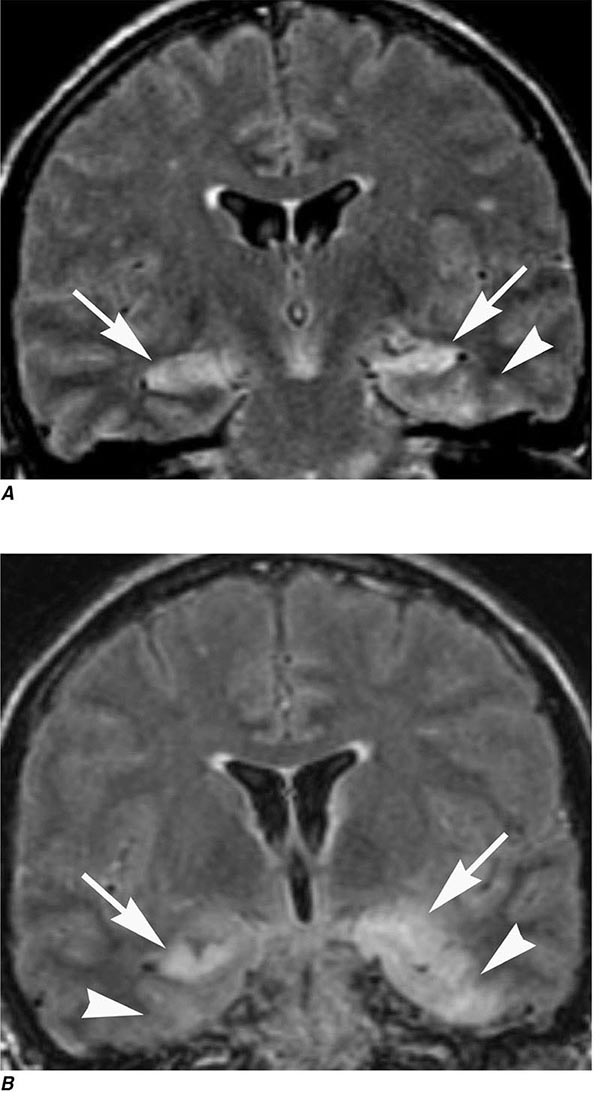
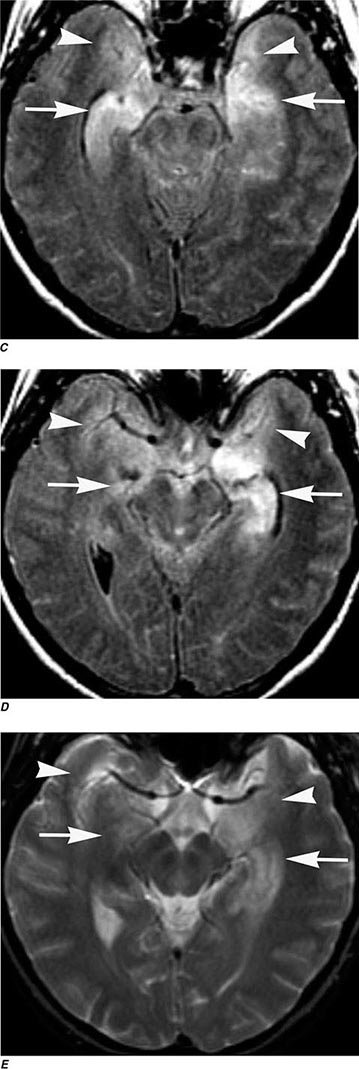
FIGURE 441e-1 Limbic encephalitis (Chap. 122). Coronal (A, B), axial fluid-attenuated inversion recovery (FLAIR) (C, D), and axial T2-weighted (E) MR images demonstrate abnormal high signal involving the bilateral mesial temporal lobes (arrowheads) including the hippocampi (left greater than right) without significant mass effect (arrows). There was no enhancement on postgadolinium images (not shown).
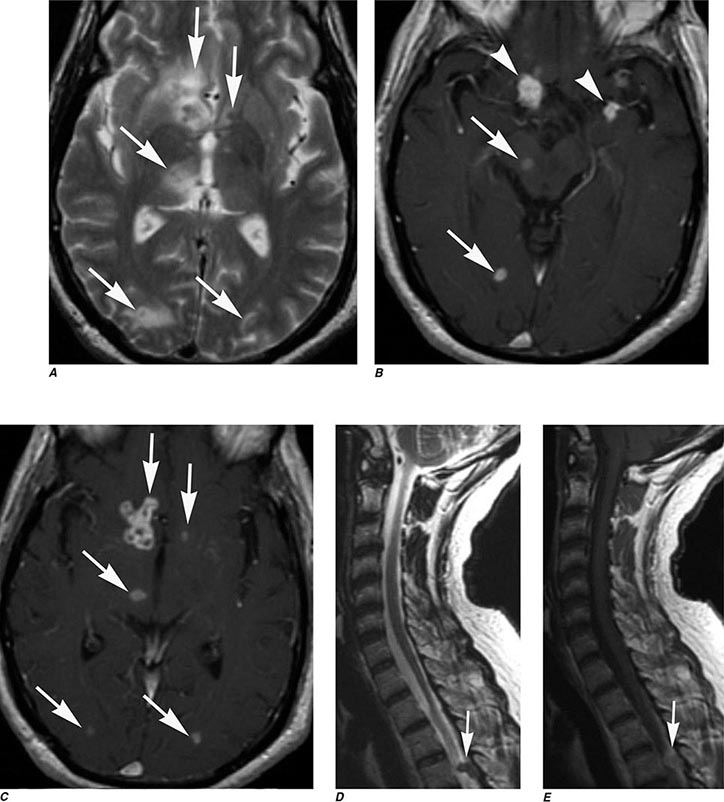
FIGURE 441e-2 Central nervous system tuberculosis (Chap. 202). Axial T2-weighted MRI (A) demonstrates multiple lesions (arrows) with peripheral high signal and central low signal, located predominantly in the cortex and subcortical white matter, as well as in the basal ganglia. Axial T1-weighted MR images postgadolinium (B, C) demonstrate ring enhancement of the lesions (arrows) and additional lesions in the subarachnoid space (arrowheads). Sagittal T2-weighted MR image of the cervical spine (D) demonstrates a hypointense lesion in the subarachnoid space at the level of T5 (arrow). Sagittal T1-weighted postgadolinium MRI of the cervical spine (E) demonstrates enhancement of the lesion in the subarachnoid space at the level of T5 (arrow).
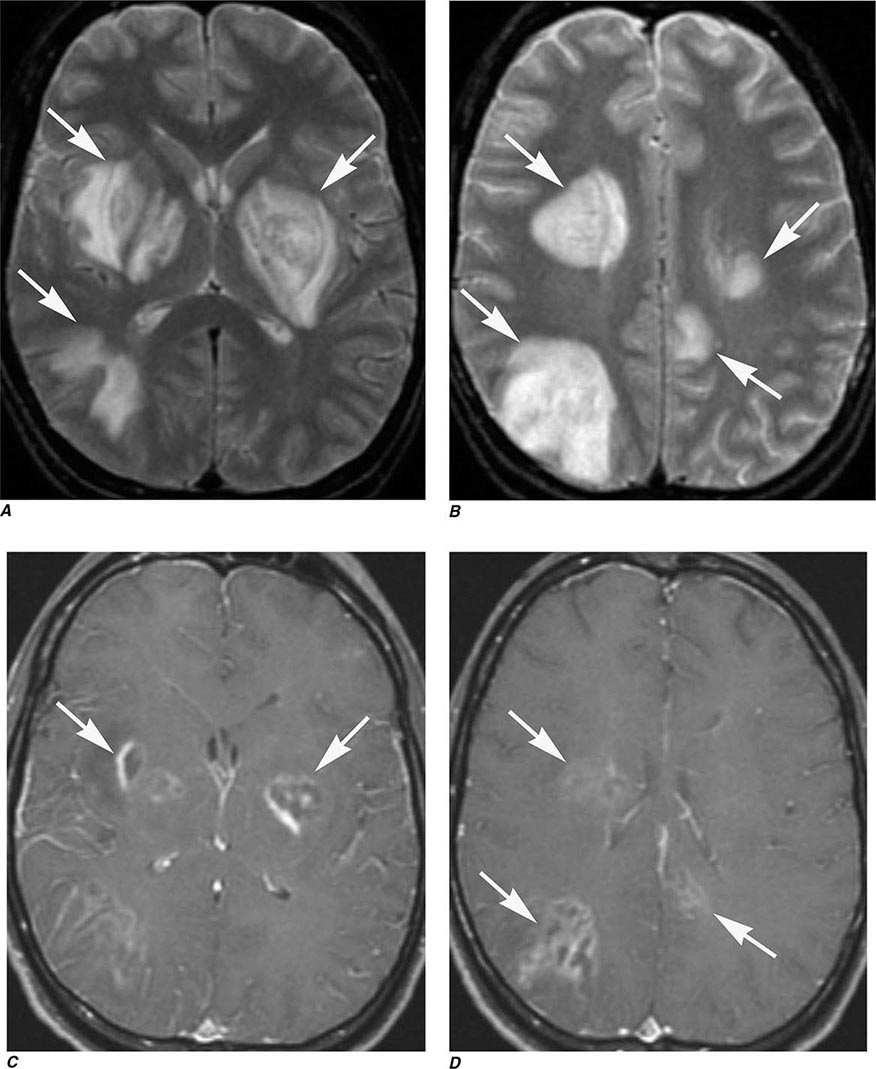
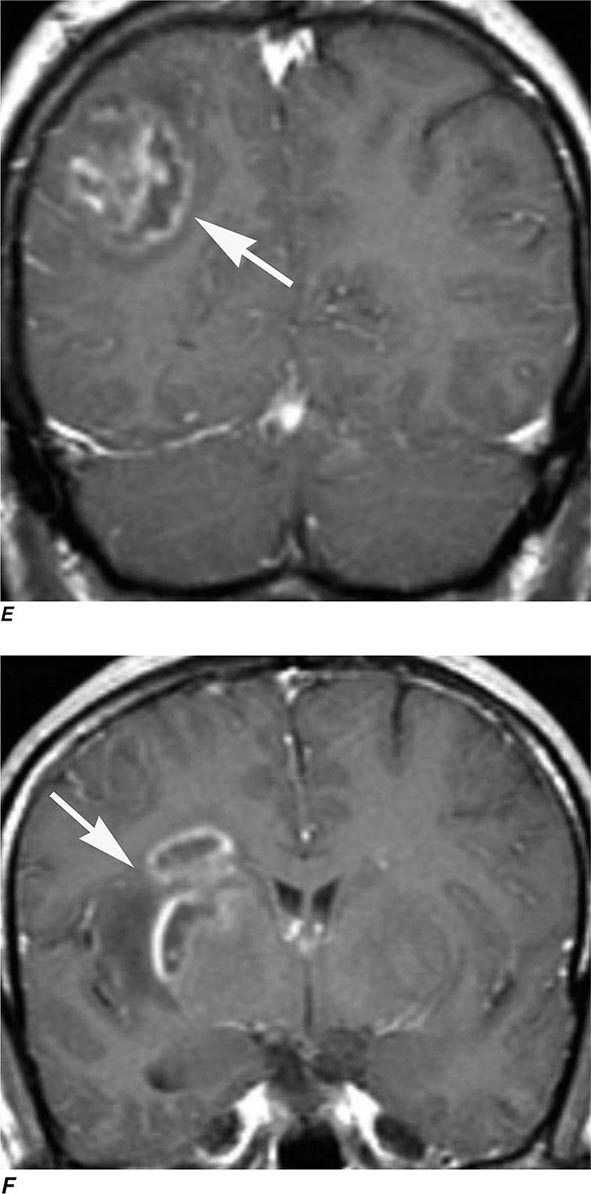
FIGURE 441e-3 Neurosyphilis (Chap. 206): Case I. Axial T2-weighted MRIs (A, B) demonstrate well-defined areas of abnormal high signal in the basal ganglia bilaterally and in a wedge-shaped distribution in the right parietal lobe (arrows). Axial (C, D) T1-weighted images postgadolinium. Coronal (E, F) T1-weighted images postgadolinium demonstrate irregular ring enhancement of the lesions (arrows).
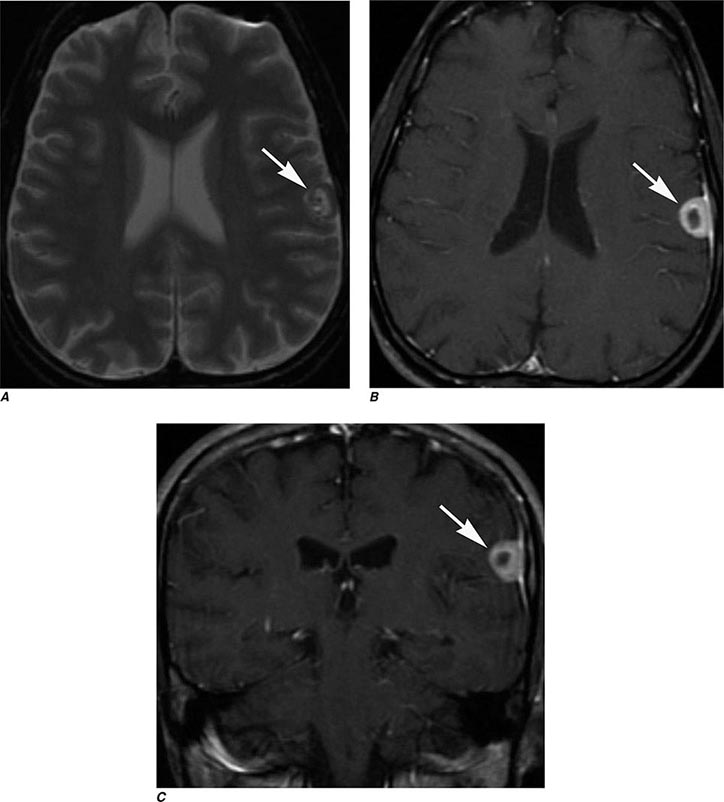
FIGURE 441e-4 Neurosyphilis (Chap. 206): Case II. Axial T2-weighted MRI (A) demonstrates a dural-based, peripherally hyperintense and centrally hypointense lesion located lateral to the left frontal lobe (arrow). Axial (B) and coronal (C) T1-weighted MRIs postgadolinium demonstrate peripheral enhancement of the lesion (arrows).
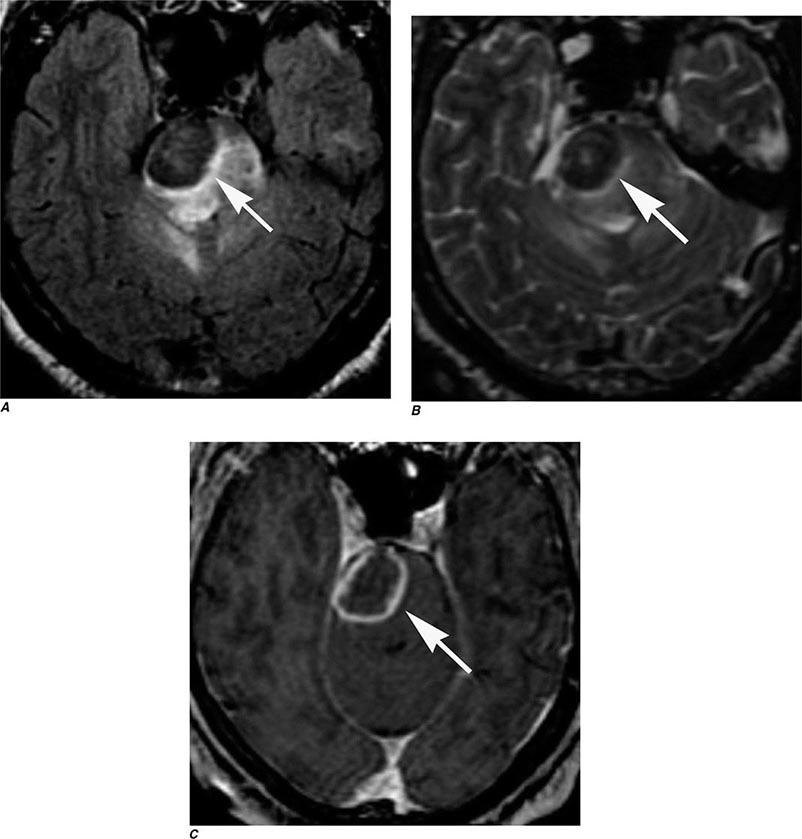
FIGURE 441e-5 Histoplasmosis of the pons (Chap. 236). Axial FLAIR (A) and T2-weighted (B) MRIs demonstrate a low signal mass in the right pons (arrows) with surrounding vasogenic edema. Axial T1-weighted MRI postgadolinium (C) demonstrates ring enhancement of the lesion in the right pons (arrow). Of note, there was no evidence of restricted diffusion (not shown).
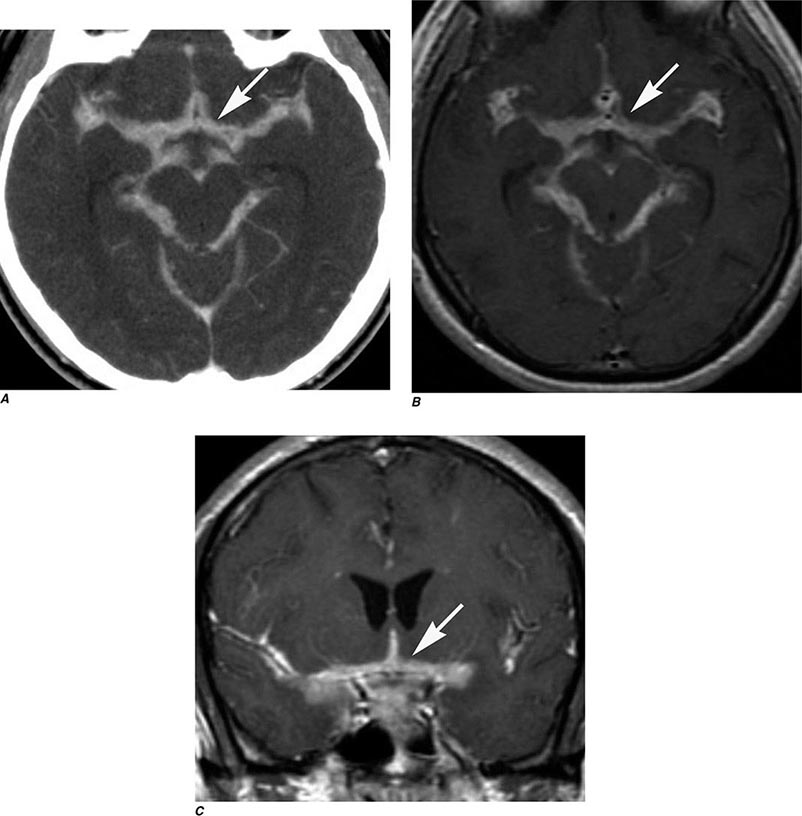
FIGURE 441e-6 Coccidiomycosis meningitis (Chap. 237). Axial postcontrast CT (A) and axial (B) and coronal (C) T1-weighted MRIs postgadolinium demonstrate enhancement of the perimesencephalic cisterns (arrows), as well as the sylvian and interhemispheric fissures.
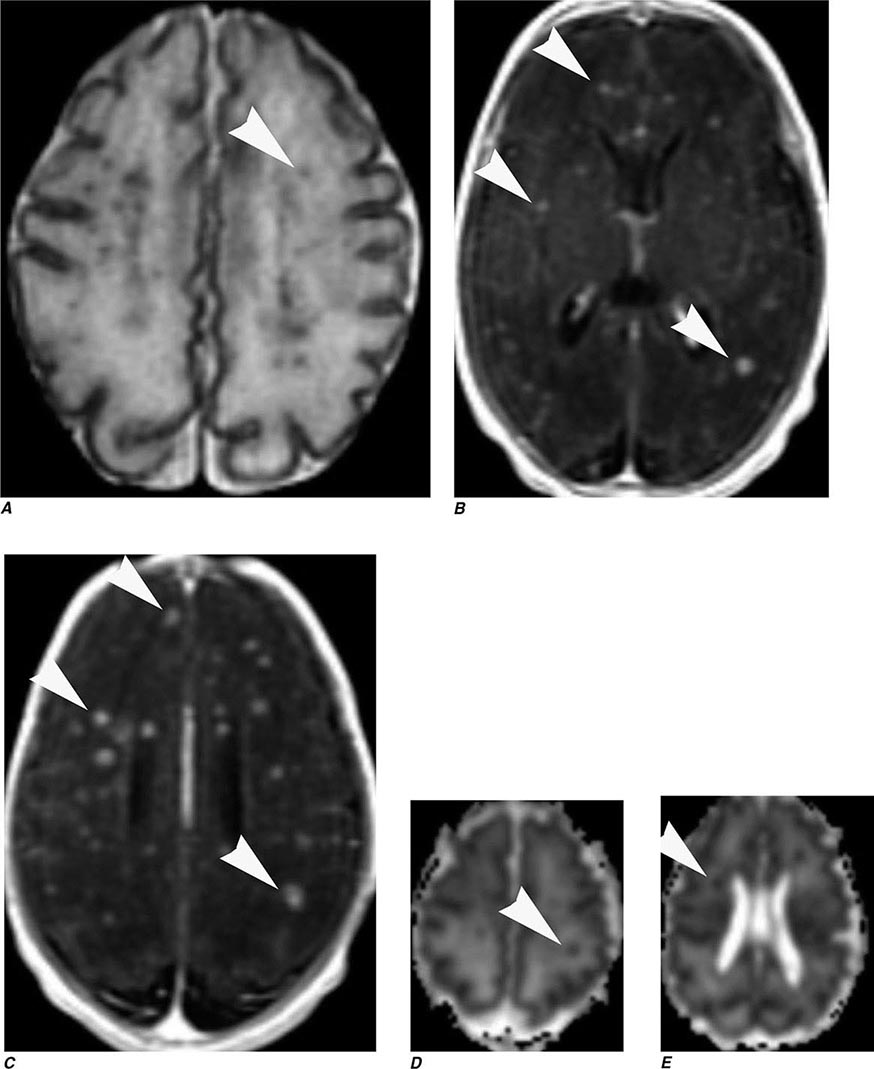
FIGURE 441e-7 Candidiasis in a newborn (Chap. 240). Axial T2-weighted MRI (A) demonstrates multiple punctate foci of low signal diffusely distributed in the brain parenchyma (arrowhead). Axial T1-weighted MRIs postgadolinium (B, C) demonstrate marked enhancement of the lesions (arrowheads). Apparent diffusion coefficient (ADC) map (D, E) demonstrates restricted diffusion of water molecules in the lesions (arrowheads).
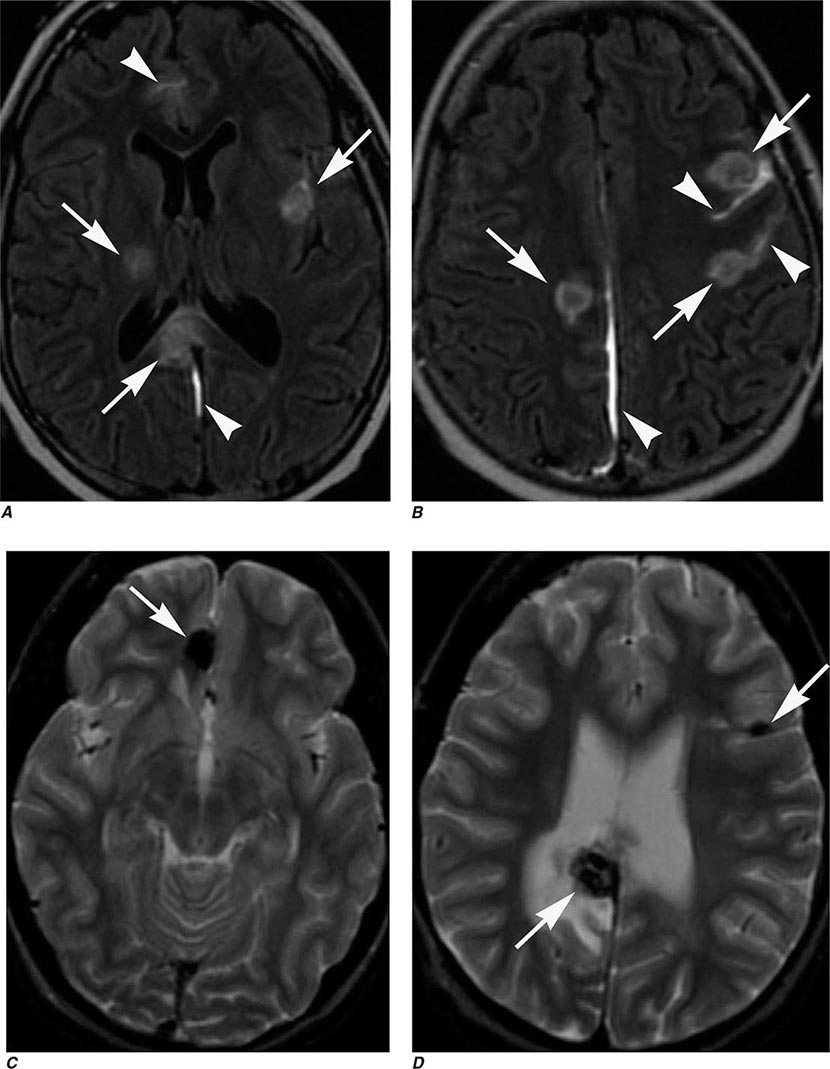
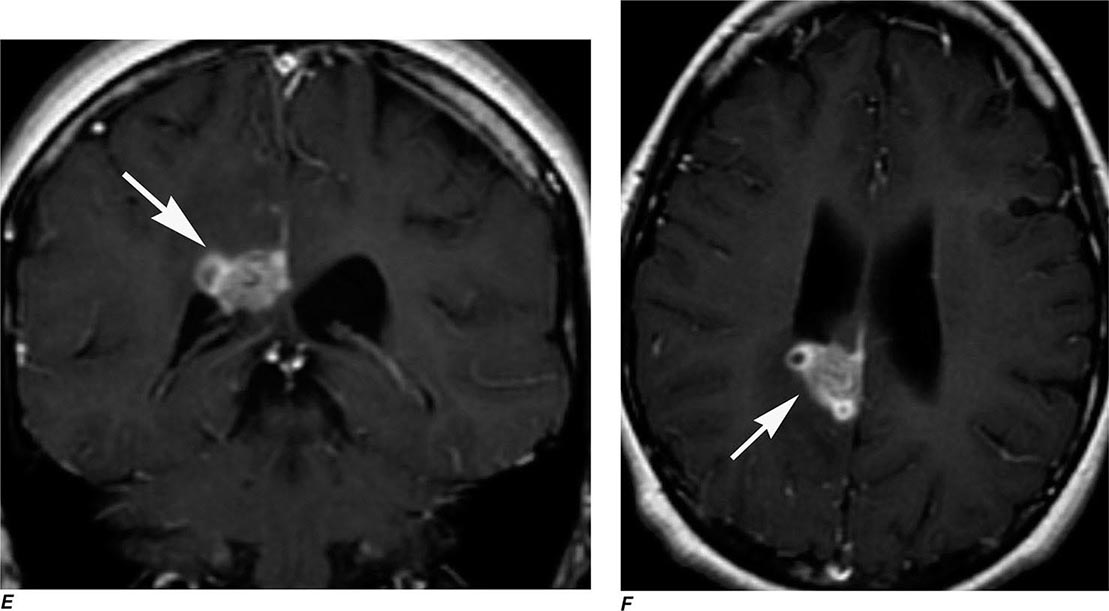
FIGURE 441e-8 Central nervous system (CNS) aspergillosis (Chap. 241). Axial FLAIR MRIs (A, B) demonstrate multiple areas of abnormal high signal in the basal ganglia as well as cortex and subcortical white matter (arrows). There is also abnormal high signal in the subarachnoid space adjacent to the lesions (arrowheads) that can correspond to blood or high protein content. Axial T2-weighted MRIs (C, D) demonstrate intrinsic low signal in the lesions (arrows), suggesting the presence of blood products. Some of the lesions also show vasogenic edema. Coronal (E) and axial (F) T1-weighted MRIs postgadolinium demonstrate peripheral enhancement of the lesions (arrows).
FIGURE 441e-9 Invasive sinonasal aspergillosis (Chap. 241). Axial T2-weighted MRI (A) demonstrates an irregularly shaped low signal lesion involving the left orbital apex (arrow). B. T1-weighted image pregadolinium demonstrates low signal in left anterior clinoid process (arrow). C. T1-weighted image postgadolinium demonstrates enhancement of lesion (arrow).
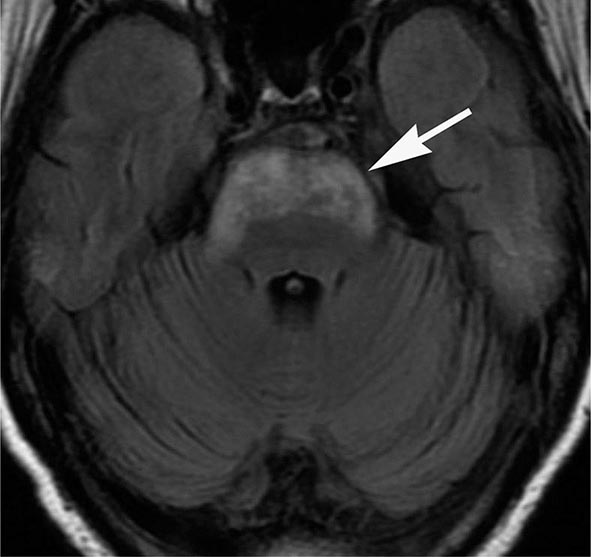
FIGURE 441e-10 Behçet’s disease (Chap. 387). Axial FLAIR MRI demonstrates abnormal high signal involving the anterior pons (arrow); following gadolinium administration, the lesion was nonenhancing (not shown). Brainstem lesions are typical of Behçet’s disease, caused primarily by vasculitis and in some cases demyelinating lesions.
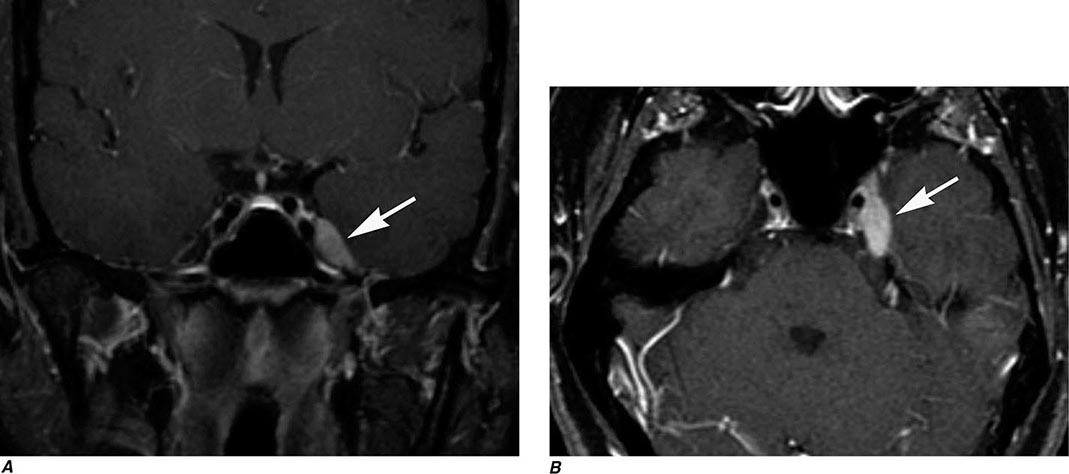
FIGURE 441e-11 Neurosarcoid (Chap. 390): Case I. Coronal (A) and axial (B) T1-weighted images postgadolinium with fat suppression demonstrate a homogeneously enhancing well-circumscribed mass centered in the left Meckel’s cave (arrows).
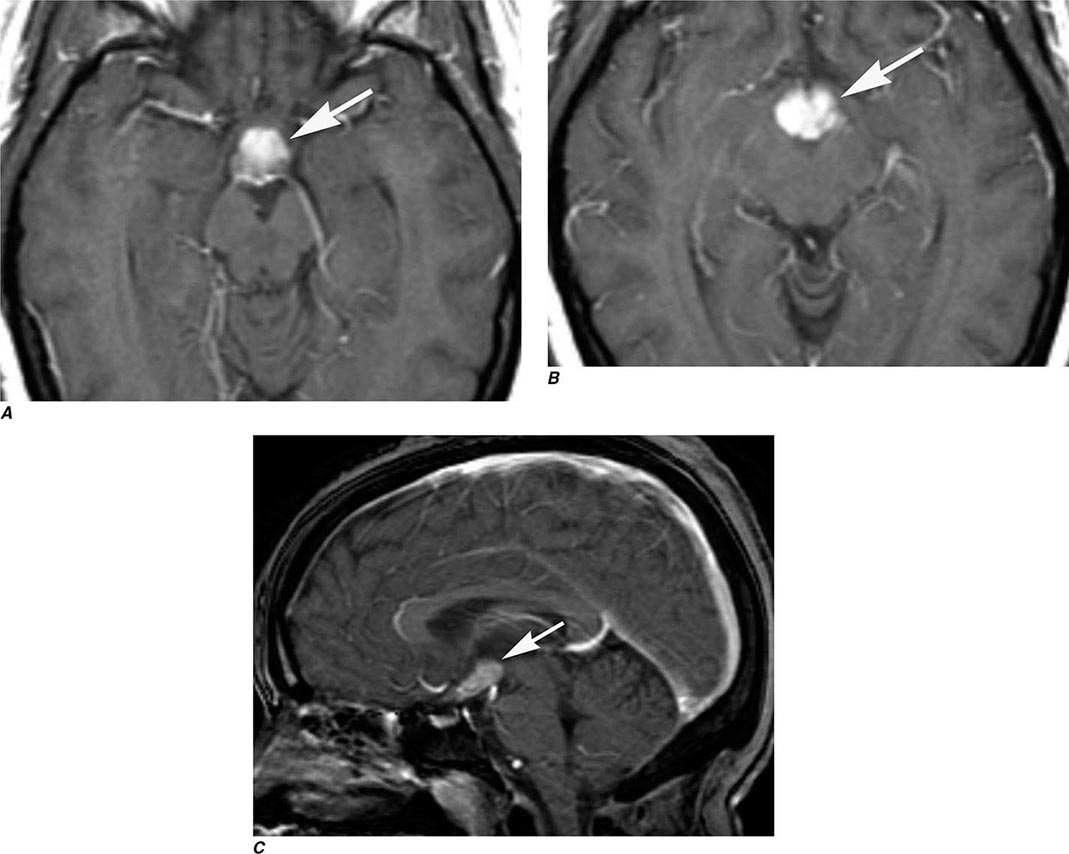
FIGURE 441e-12 Neurosarcoid (Chap. 390): Case II. Axial (A, B) and sagittal (C) T1-weighted images postgadolinium with fat suppression demonstrate a homogeneously enhancing mass involving the hypothalamus and the pituitary stalk (arrows).
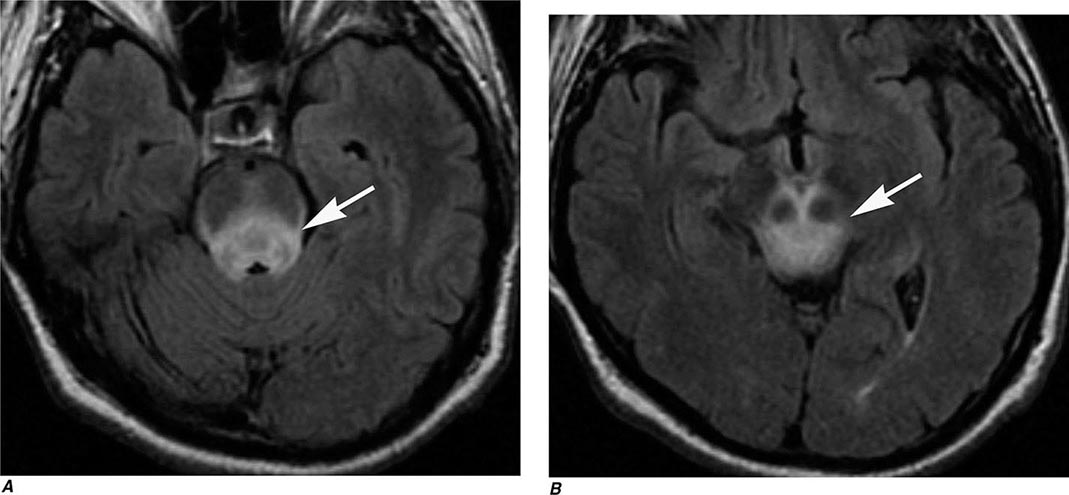
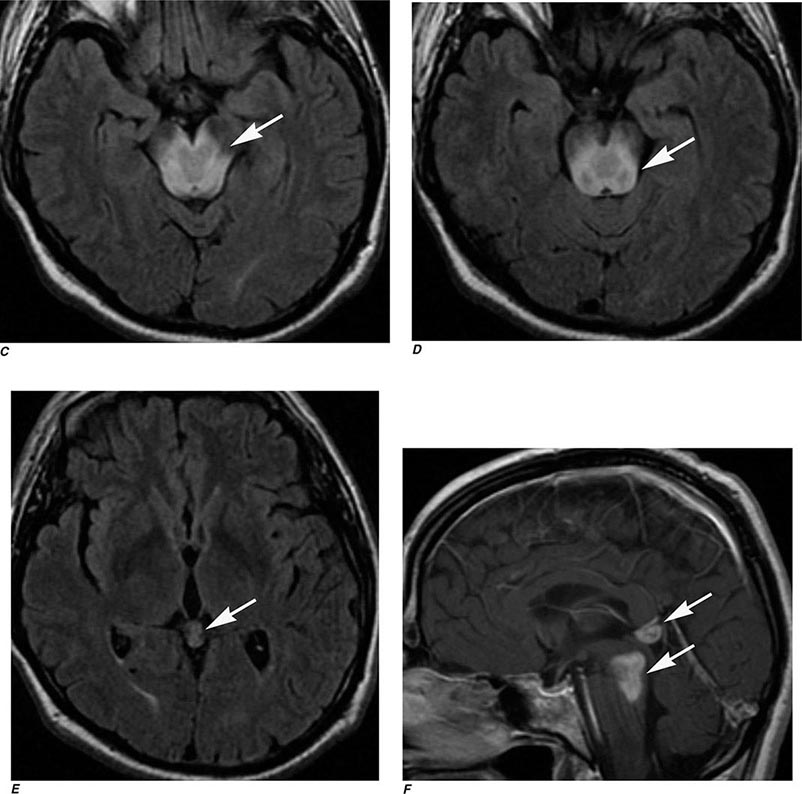
FIGURE 441e-13 Neurosarcoid (Chap. 390): Case III. Axial FLAIR images (A–E) demonstrate abnormal high signal and slight expansion in the midbrain, dorsal pons, and pineal region (arrows) without significant mass effect. Sagittal T1-weighted images postgadolinium (F) with fat suppression demonstrate abnormal enhancement in the midbrain, dorsal pons, and pineal region (arrows).
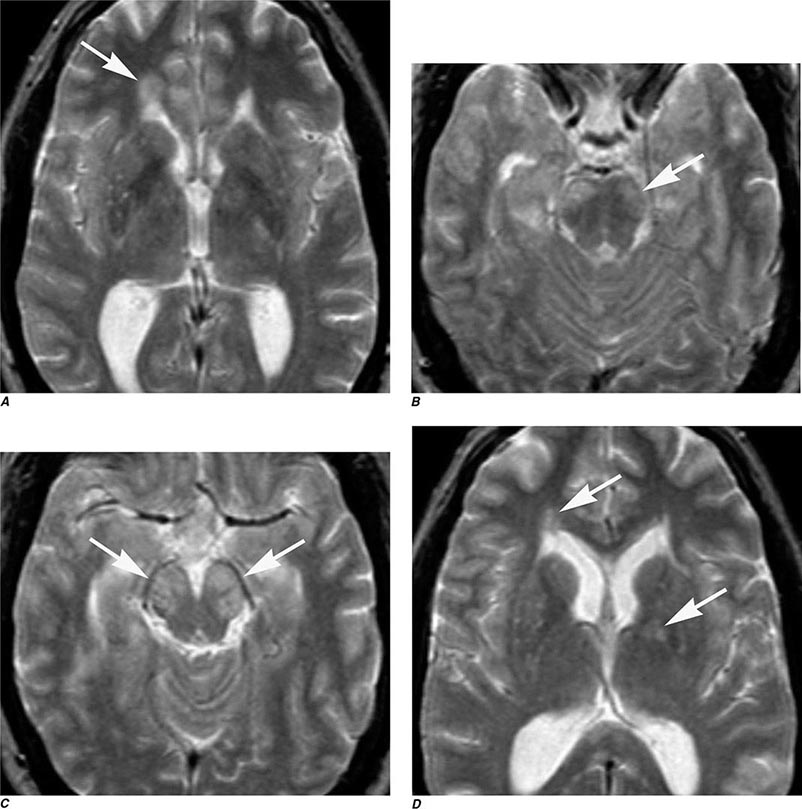
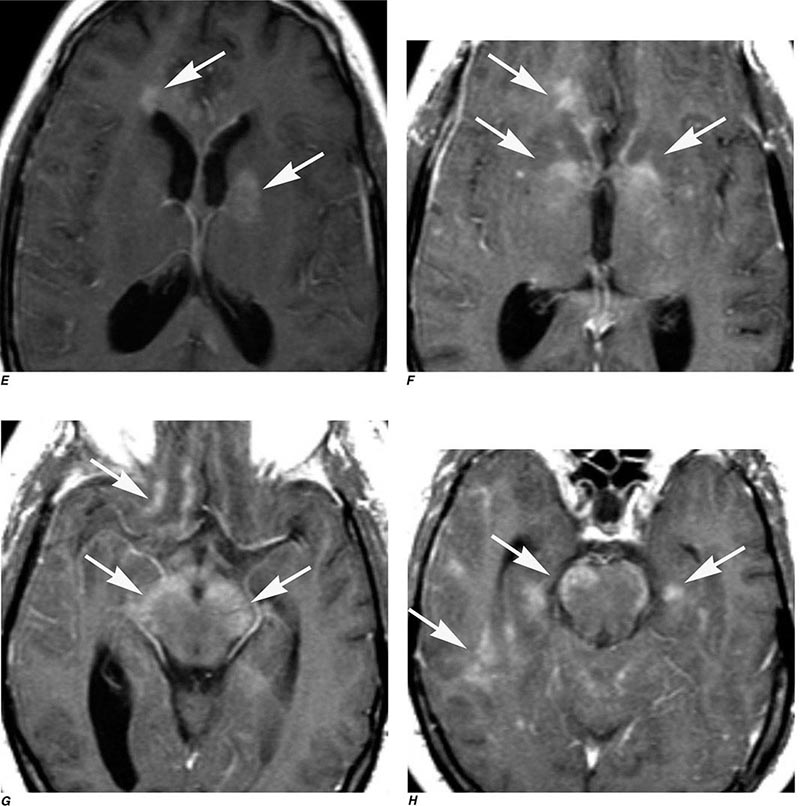
FIGURE 441e-14 Neurosarcoid (Chap. 390): Case IV. Axial T2-weighted images (A–D) demonstrate numerous areas of abnormal hyperintensity involving the corpus callosum, left internal capsule and globus pallidus, bilateral cerebral peduncles, bilateral gyrus rectus, right frontal lobe periventricular white matter, and patchy areas in bilateral temporal lobes. T1-weighted images postgadolinium (E–H) demonstrate abnormal enhancement of those areas with high T2 signal.
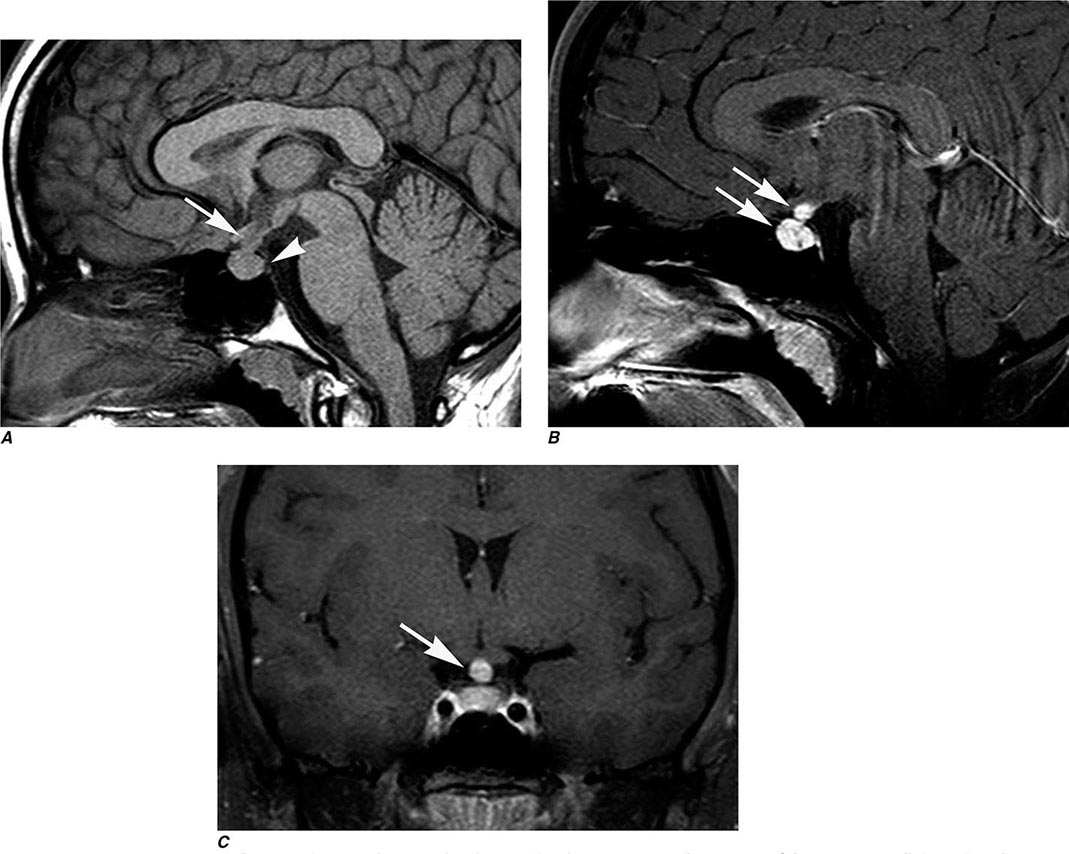
FIGURE 441e-15 Histiocytosis (Chap. 404). Sagittal T1-weighted image (A) demonstrates enlargement of the pituitary stalk (arrow) and absence of the posterior pituitary intrinsic T1 hyperintensity (arrowhead). Sagittal and coronal T1-weighted images postgadolinium (B, C) demonstrate enhancement of the pituitary stalk and infundibulum (arrows).
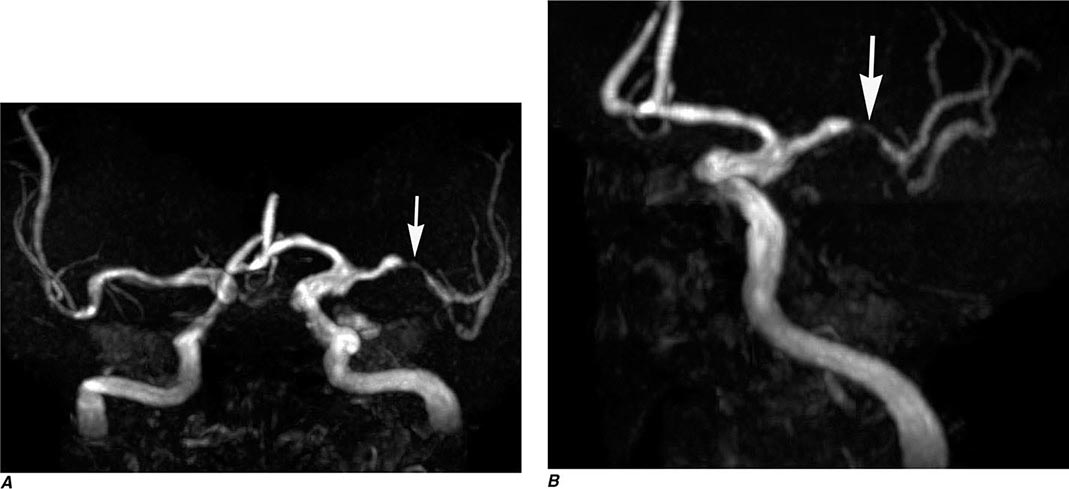
FIGURE 441e-16 Middle cerebral artery stenosis (Chap. 446). Time-of-flight (TOF) MR angiography (MRA) (A, B) reveals narrowing within the left M1 segment that is likely secondary to atherosclerosis (arrows).
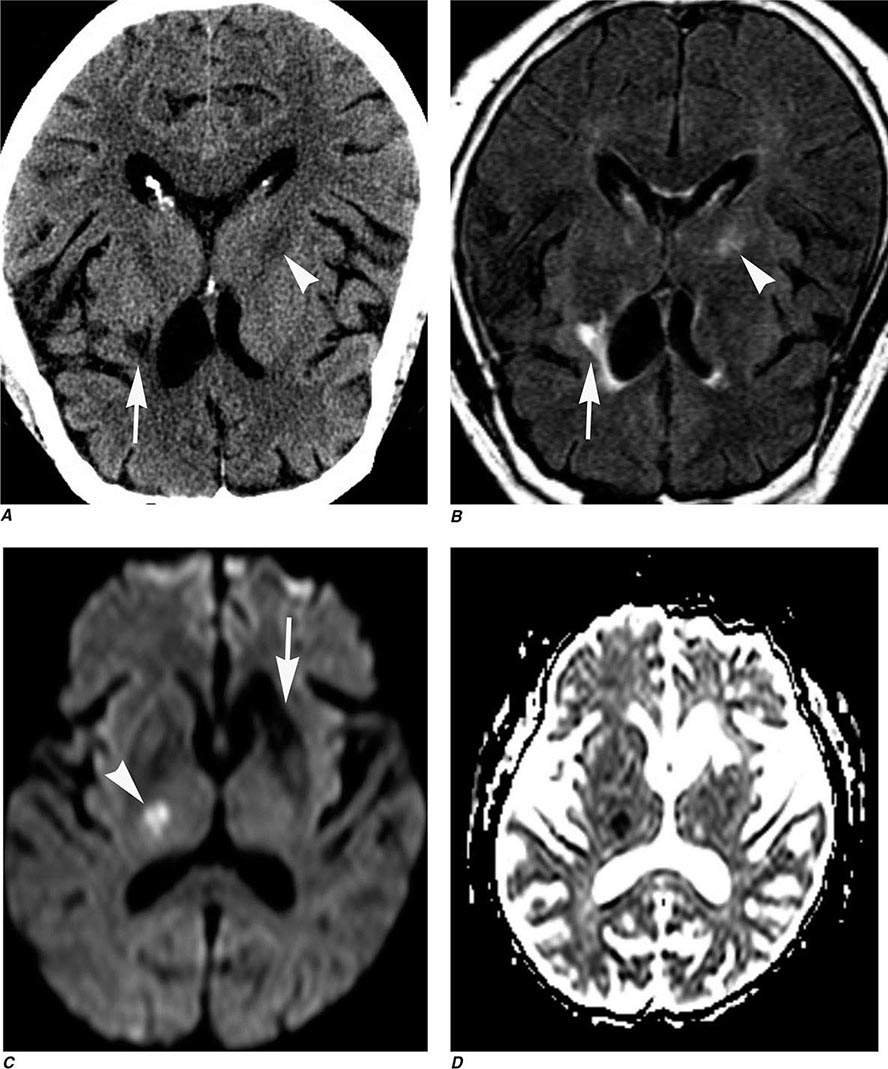
FIGURE 441e-17 Lacunar infarction (Chap. 446). Axial noncontrast CT (A) demonstrates abnormal hypodensity involving the left anterior putamen and anterior limb of internal capsule with ex-vacuo dilatation of the adjacent frontal horn of the left lateral ventricle, suggestive of an old infarction (arrow). A small area of slight hypodensity is also seen in the posterior limb of the right internal capsule that can correspond to an acute infarct (arrowhead). Axial FLAIR MRI (B) demonstrates abnormal high signal involving the left anterior putamen and anterior limb of internal capsule with ex-vacuo dilatation of the adjacent frontal horn of the left lateral ventricle, suggestive of an old infarction (arrow). A small area of slight hyperintensity is also seen in the posterior limb of the right internal capsule that can correspond to an acute lacunar infarct (arrowhead). Diffusion-weighted image (C) and apparent diffusion coefficient (ADC) map (D) demonstrate restricted water motion in the lesion of the posterior limb of the right internal capsule, strongly suggestive for an acute lacunar infarct (arrowhead). There is no evidence of restricted diffusion in the old infarct (arrow).
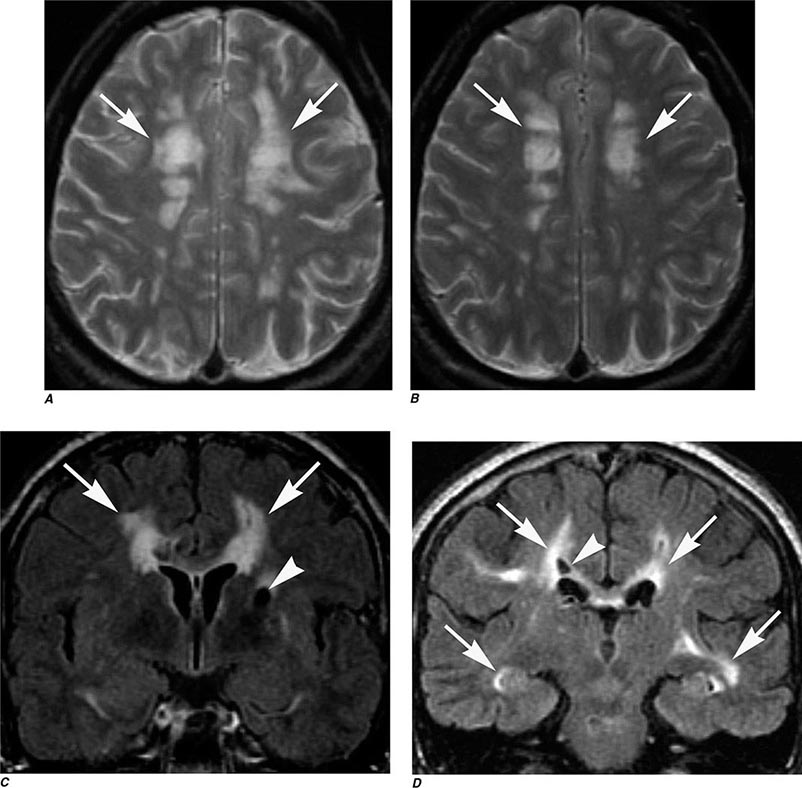
FIGURE 441e-18 Cerebral autosomal dominant arteriopathy with subcortical infarcts and leukoencephalopathy (CADASIL) (Chap. 446). Axial T2-weighted MRIs (A, B) demonstrate multiple patchy areas of abnormal high signal in the periventricular white matter (arrows). Coronal FLAIR MRI (C, D) demonstrates multiple patchy areas of abnormal high signal in the periventricular white matter bilaterally, including the temporal lobes (arrows). In some of these areas, there are small areas of tissue loss (encephalomalacia) (arrowheads).
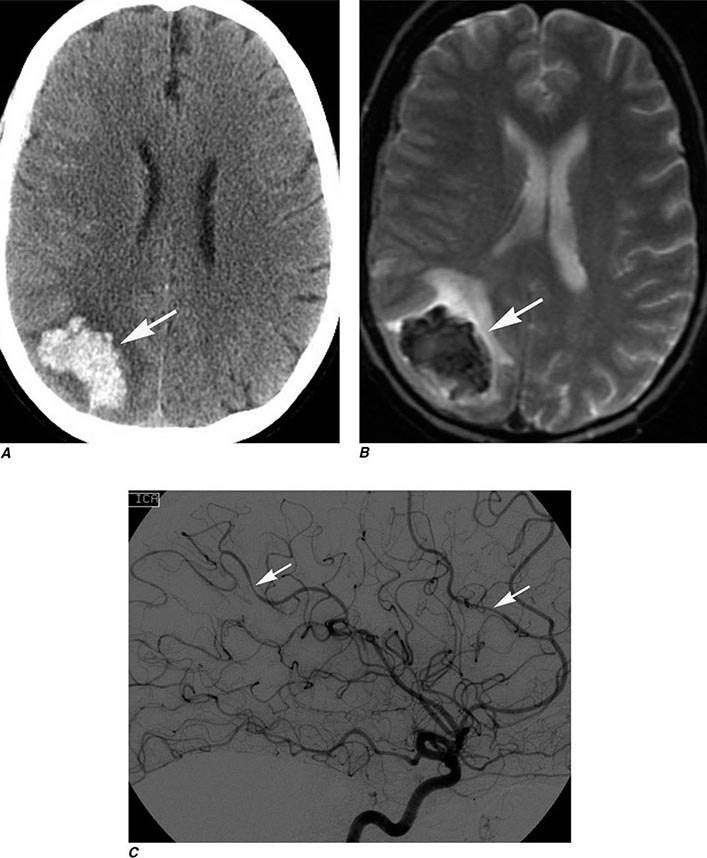
FIGURE 441e-19 CNS vasculitis (Chap. 446). Axial noncontrast CT (A) demonstrates a large hyperdense intraparenchymal hematoma surrounded by hypodense vasogenic edema in the right parietal lobe. Axial T2-weighted MRI (B) demonstrates a large hypointense intraparenchymal hematoma surrounded by hyperintense vasogenic edema in the right parietal lobe. Conventional angiography (C) demonstrates multiple segments of intracranial arterial narrowing, some of which have associated adjacent areas of focal arterial dilatation. These abnormalities are suggestive of vasculitis.
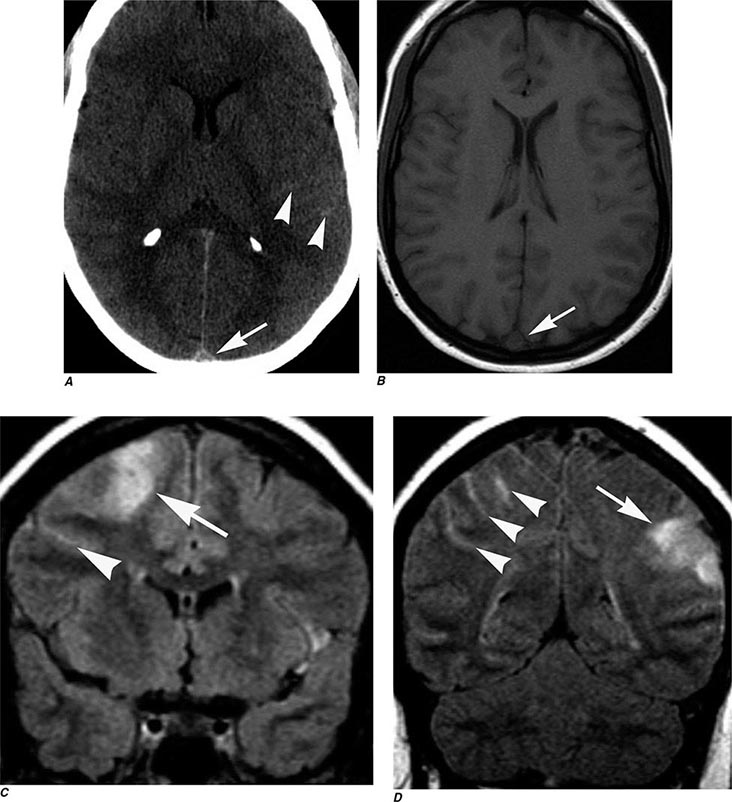
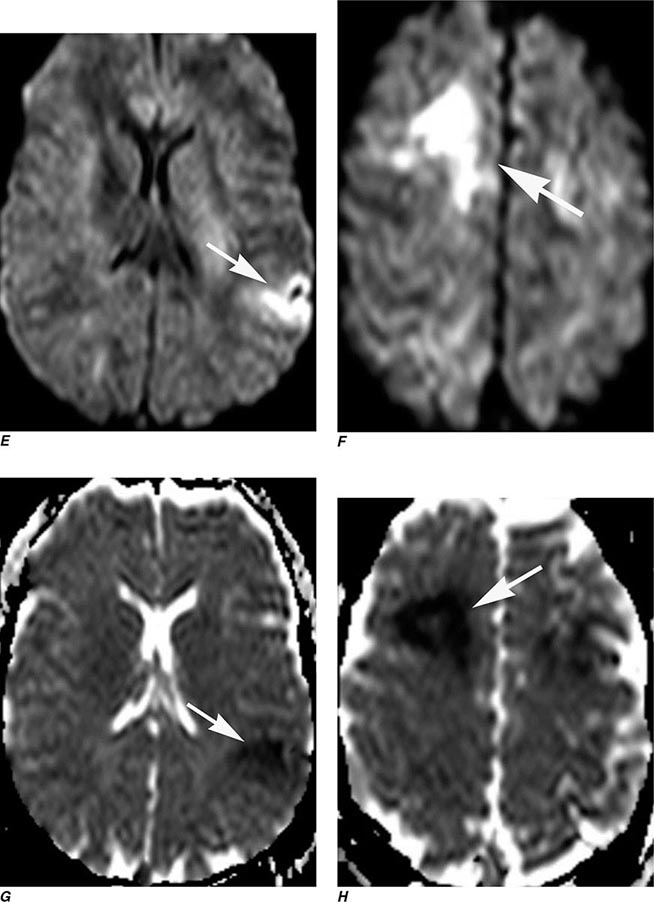
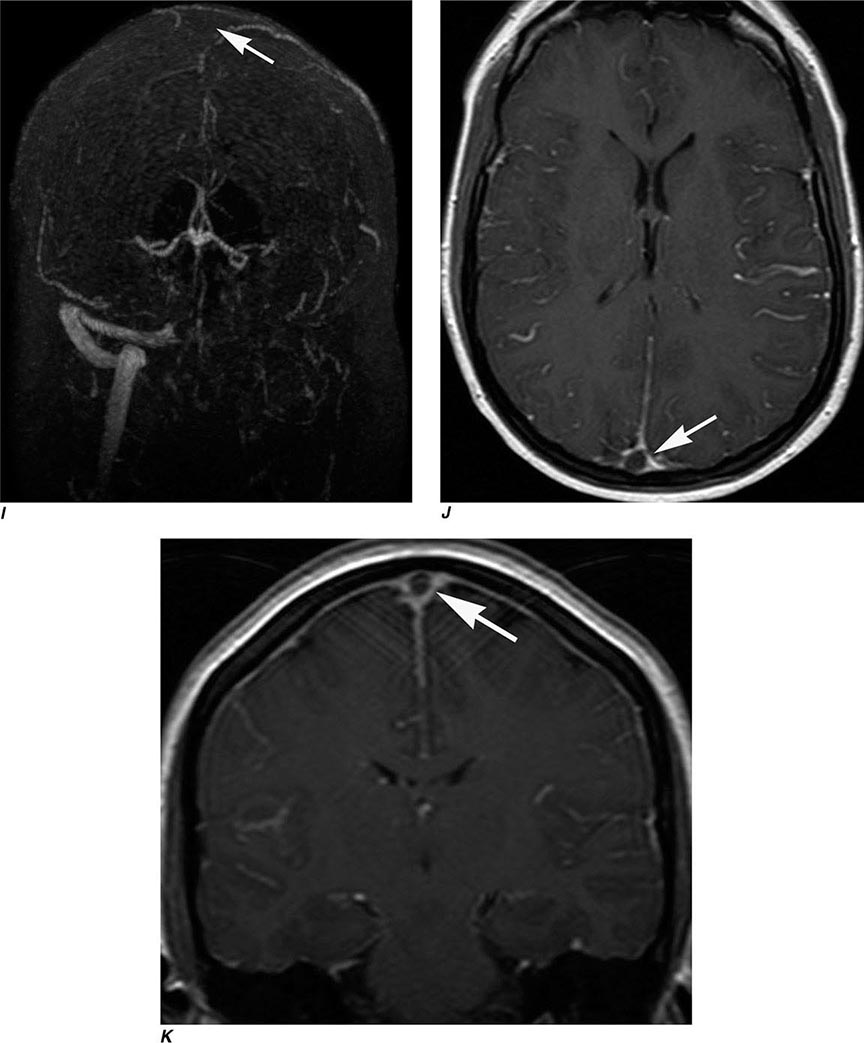
FIGURE 441e-20 Superior sagittal sinus thrombosis (Chap. 446). Noncontrast CT of the head (A) demonstrates increased density in the superior sagittal sinus, suggestive of thrombosis (arrow), and small linear hyperdensities in some temporal lobe sulci, suggestive of subarachnoid hemorrhage (arrowheads). Axial T1-weighted MRI (B) demonstrates absence of flow void in the superior sagittal sinus, suggestive of thrombosis. Coronal FLAIR images (C, D) demonstrate areas of abnormal high signal involving the gray and the subcortical white matter of the right frontal and left parietal lobes, as well as the adjacent sulci. These findings are suggestive of vasogenic edema with subarachnoid hemorrhage (arrowheads). Diffusion-weighted images (E, F) and ADC maps (G, H) demonstrate restricted diffusion of the abnormal areas on FLAIR, suggestive of infarct. Phase-contrast venography of the brain (I) demonstrates absence of signal in the superior sagittal sinus down to the torcular herophili, and left transverse sinus and jugular vein. Axial (J) and coronal (K) T1-weighted images postgadolinium demonstrate a filling defect in the superior sagittal sinus, suggestive of thrombosis.
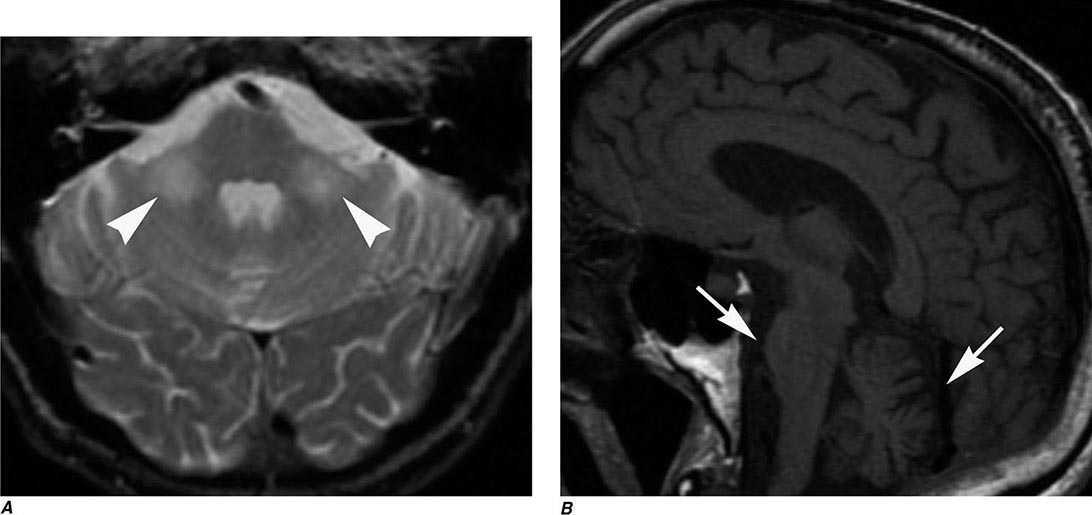
FIGURE 441e-21 Multiple system atrophy (Chap. 449). Axial T2-weighted MRI (A) reveals symmetric poorly circumscribed abnormal high signal in the middle cerebellar peduncles bilaterally (arrowheads). Sagittal T1-weighted MRI (B) demonstrates pontine atrophy and enlarged cerebellar fissures as a result of cerebellar atrophy (arrows).
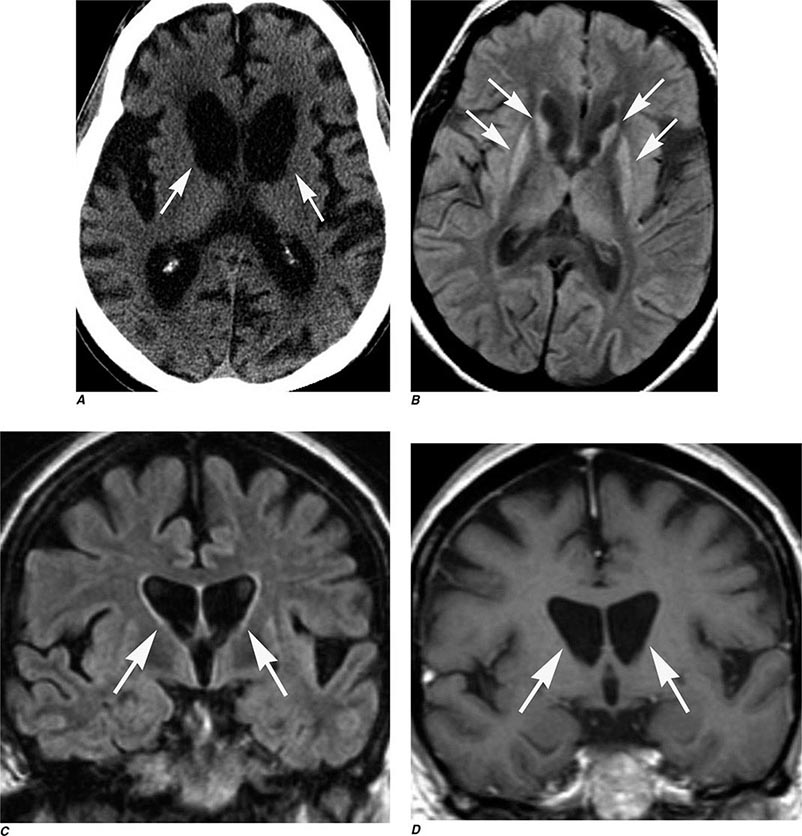
FIGURE 441e-22 Huntington’s disease (Chap. 449). Axial noncontrast CT (A) demonstrates symmetric bilateral severe atrophy involving the caudate nuclei, putamen, and globus pallidi bilaterally with consequent enlargement of the frontal horns of the lateral ventricles (arrows). There is also diffuse prominence of the sulci indicating generalized cortical atrophy. Axial (B) and coronal (C) FLAIR images demonstrate bilateral symmetric abnormal high signal in the caudate and putamen. Coronal T1-weighted image (D) demonstrates enlarged frontal horns with abnormal configuration. Also note diffusely decreased marrow signal, which could represent anemia or myeloproliferative disease.
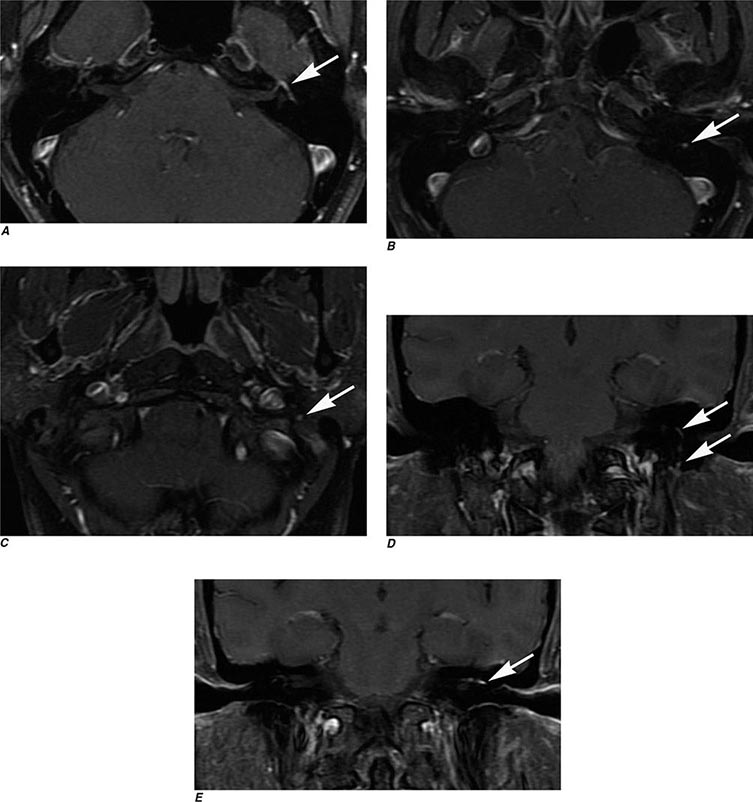
FIGURE 441e-23 Bell’s palsy (Chap. 455). Axial T1-weighted images postgadolinium with fat suppression (A–C) demonstrate diffuse smooth linear enhancement along the left facial nerve, involving the second and third segments (genu, tympanic, and mastoid) within the temporal bone (arrows). Note that there is no evidence of a mass lesion. A potential pitfall for facial nerve enhancement in the stylomastoid foramen is the enhancement of the stylomastoid artery that enters the foramen and supplies the tympanic cavity, the tympanic antrum, mastoid cells, and the semicircular canals. Coronal T1-weighted images postgadolinium with fat suppression (D, E) demonstrate the course of the enhancing facial nerve (arrows). Although these findings are highly suggestive of Bell’s palsy, the diagnosis is established on clinical grounds.
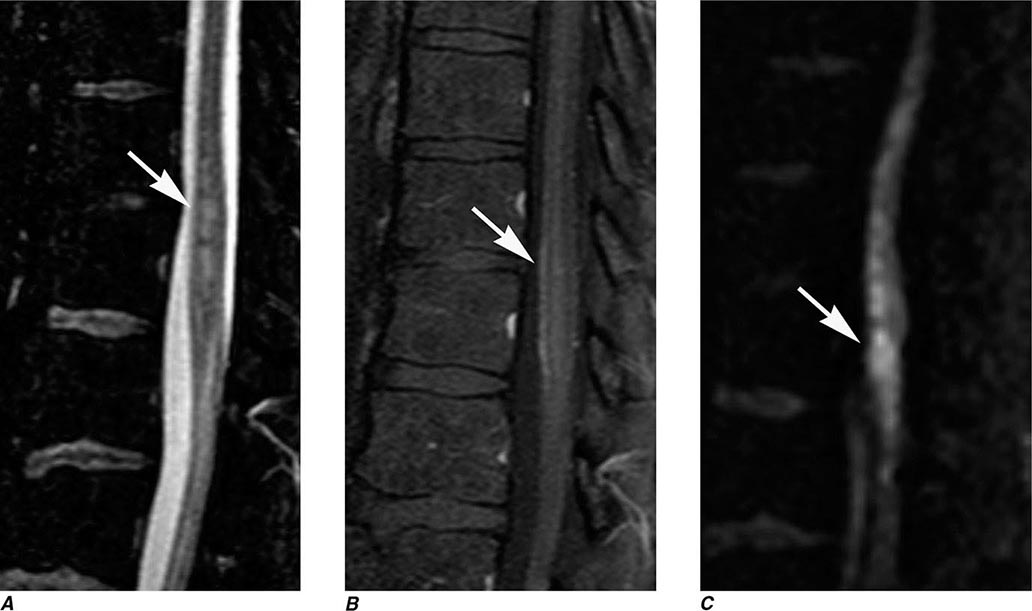
FIGURE 441e-24 Spinal cord infarction (Chap. 456). Sagittal T2-weighted MRI of the lumbar spine (A) demonstrates poorly defined areas of abnormal high signal in the conus medullaris and mild cord expansion (arrow). T1-weighted MRI of the lumbar spine postgadolinium (B) demonstrates mild enhancement (arrow). Sagittal diffusion-weighted MRI of the lumbar spine (C) demonstrates restricted diffusion (arrow) in the areas of abnormal high signal on the T2-weighted image (A).
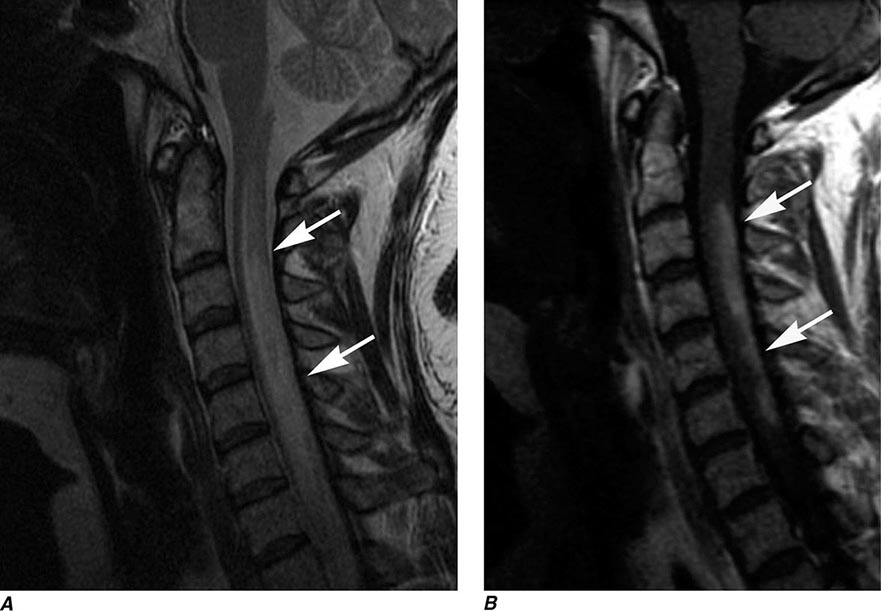
FIGURE 441e-25 Acute transverse myelitis (Chap. 456). Sagittal T2-weighted MRI (A) demonstrates abnormal high signal in the cervical cord extending from C1 to T1 with associated cord expansion (arrows). Sagittal T1-weighted MRI postgadolinium (B) demonstrates abnormal enhancement in the posterior half of the cord from C2 to T1 (arrows).
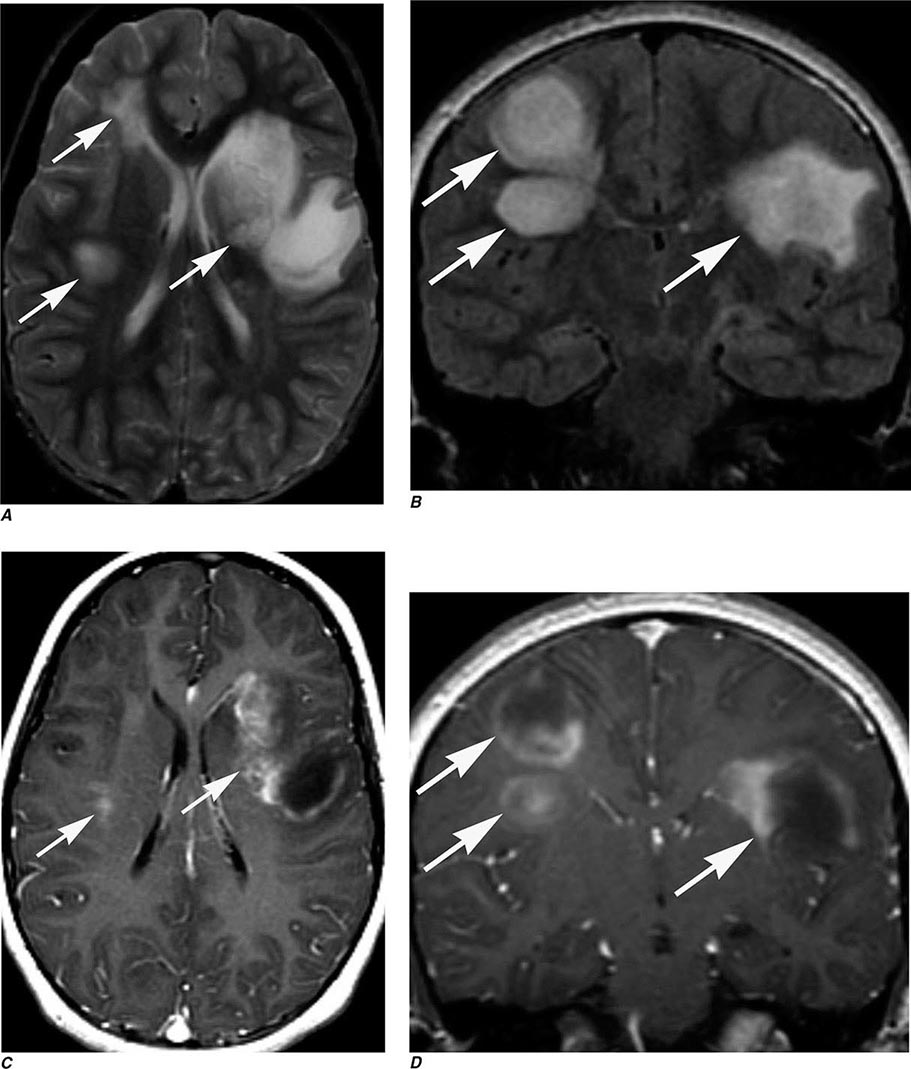
FIGURE 441e-26 Acute disseminated encephalomyelitis (ADEM) (Chap. 458). Axial T2-weighted (A) and coronal FLAIR (B) images demonstrate abnormal areas of high signal involving predominantly the subcortical white matter of the frontal lobe bilaterally and left caudate head. Following administration of gadolinium, corresponding axial (C) and coronal (D) T1-weighted images demonstrate irregular enhancement consistent with blood-brain barrier breakdown and inflammation; some lesions show incomplete rim enhancement, typical for demyelination.
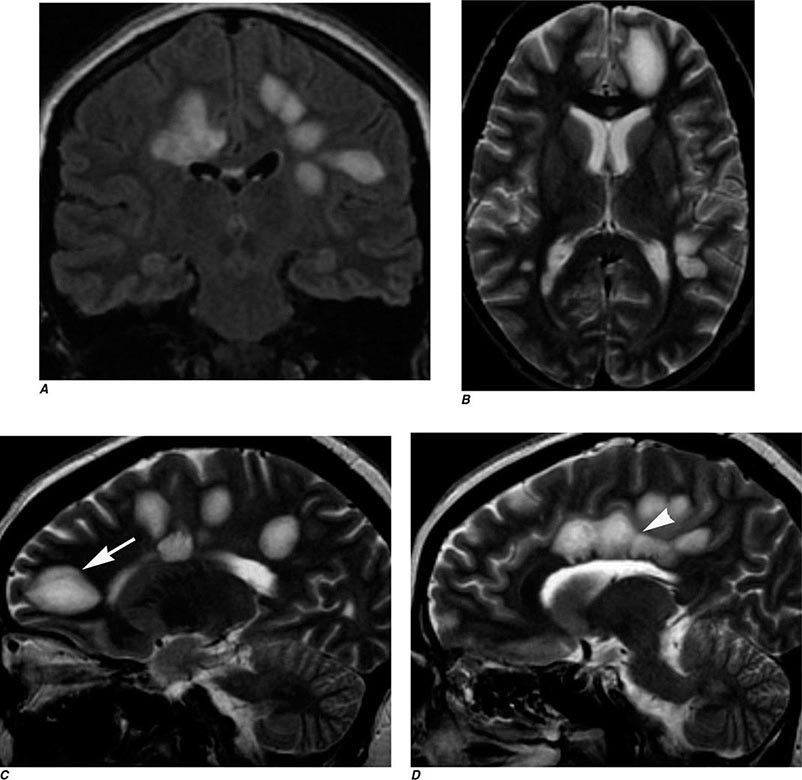
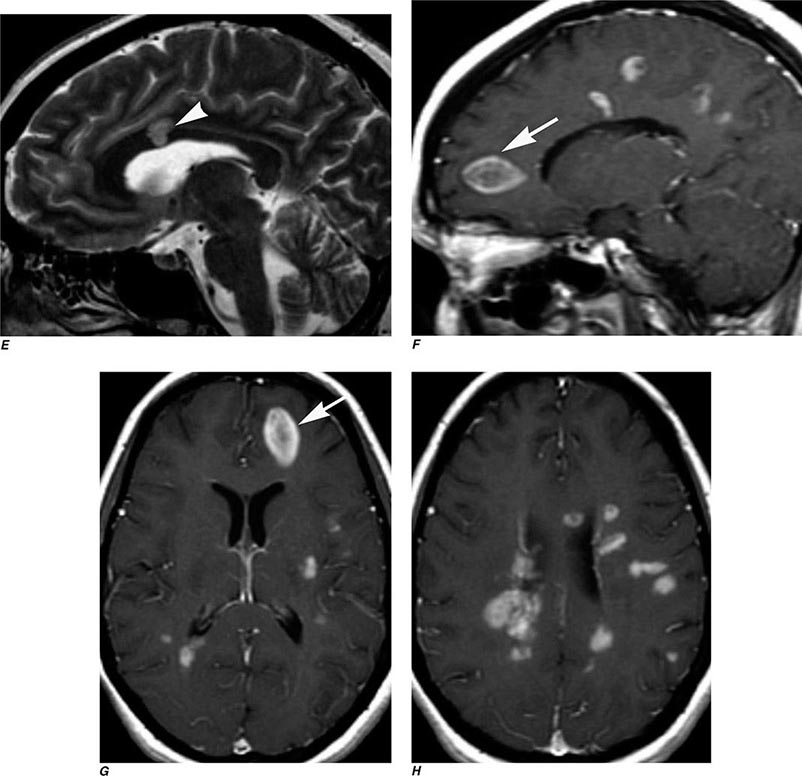
FIGURE 441e-27 Baló’s concentric sclerosis (a variant of multiple sclerosis) (Chap. 458). Coronal FLAIR MRI (A) demonstrates multiple areas of abnormal high signal in the supratentorial white matter bilaterally. The lesions are ovoid in shape, perpendicular to the orientation of the lateral ventricles, and with little mass effect. Axial (B) and sagittal (C–E) T2-weighted MRIs demonstrate multiple areas of abnormal high signal in the supratentorial white matter bilaterally, as well as the involvement of the body and splenium of the corpus callosum and the callosal-septal interface (arrowhead). Some of the lesions reveal concentric layers, typical of Baló’s concentric sclerosis (arrows). Sagittal (F) and axial (G, H) T1-weighted MRIs postgadolinium demonstrate abnormal enhancement of all lesions with some of the lesions demonstrating concentric ring enhancement (arrows).
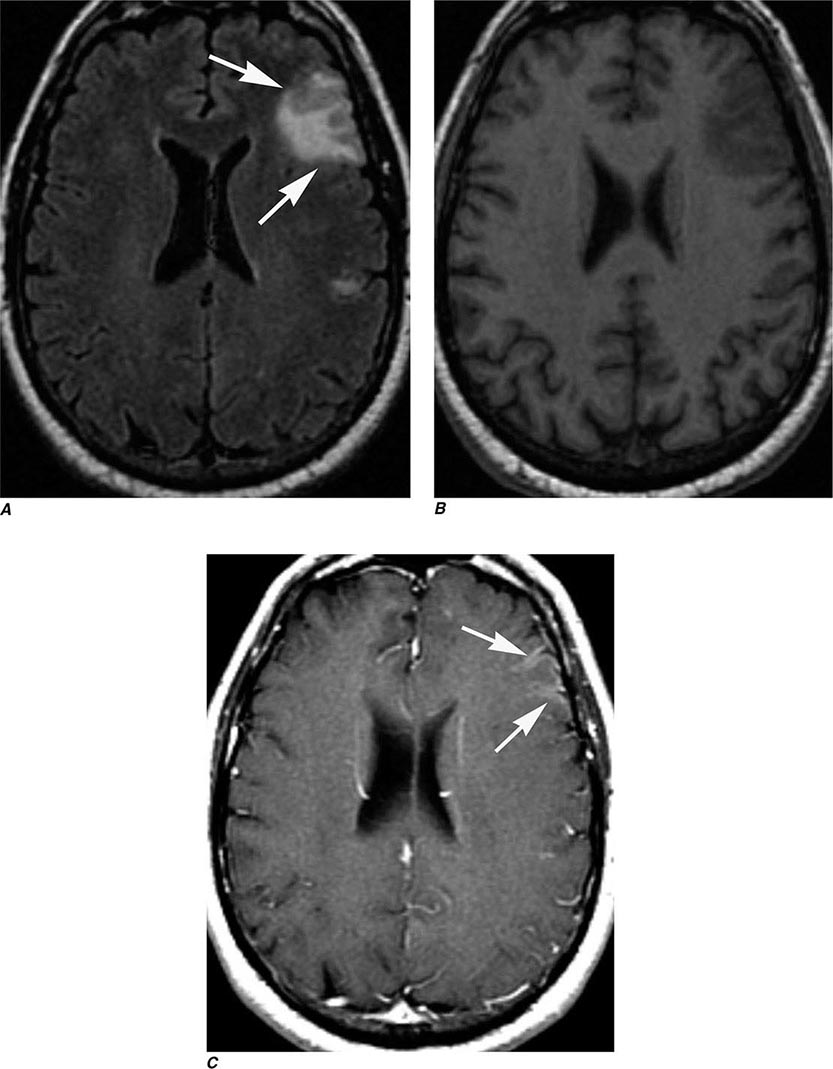
FIGURE 441e-28 Hashimoto’s encephalopathy (Chap. 164). Axial FLAIR (A) demonstrates focal area of abnormal high signal involving the gray and white matter in the left frontal lobe. There is also a small area of abnormal high signal in the precentral gyrus. Axial T1-weighted images (B, C) pre and postgadolinium demonstrate cortical/pial enhancement in the region of high signal on FLAIR.
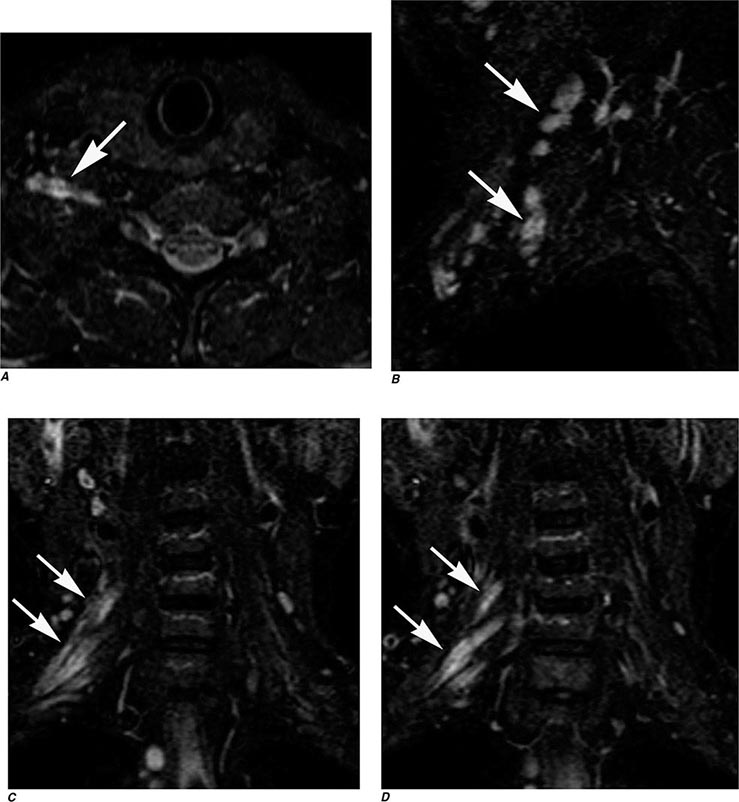
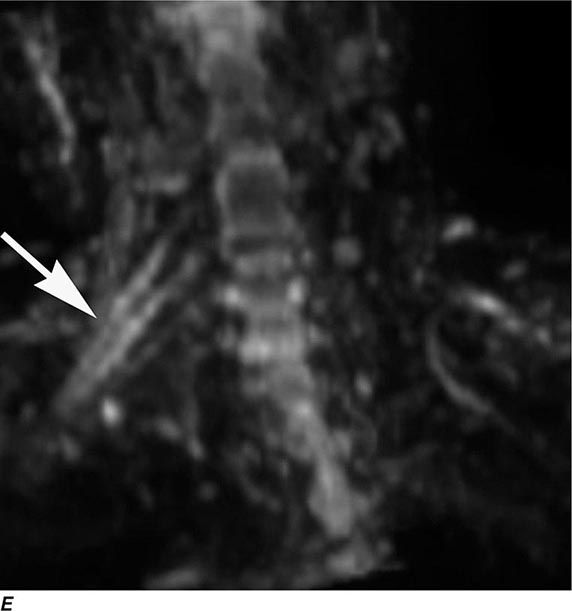
FIGURE 441e-29 Brachial plexopathy (Chap. 459). Axial (A), sagittal (B), and coronal (C, D) short tau inversion recovery (STIR) MRIs demonstrate abnormal enlargement and abnormal high signal involving the right C6, C7, and C8 nerve roots, and the trunks and divisions that originate from these roots (arrows). Diffusion-weighted MRI (E) demonstrates abnormal reduced diffusion within the right C6, C7, and C8 nerve roots and their corresponding trunks and divisions (arrow). These findings are compatible with radiation-induced brachial plexopathy.
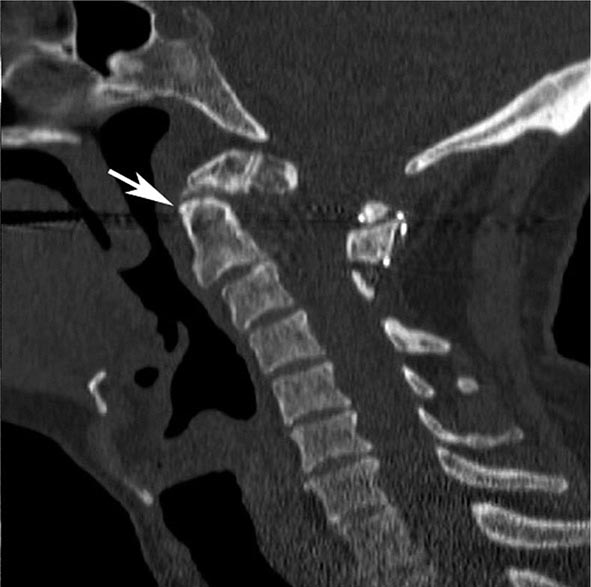
FIGURE 441e-30 Anterior dens dislocation. Sagittal CT demonstrates the tip of the dens below the anterior arch of C2 (arrow), indicating anterior dislocation.
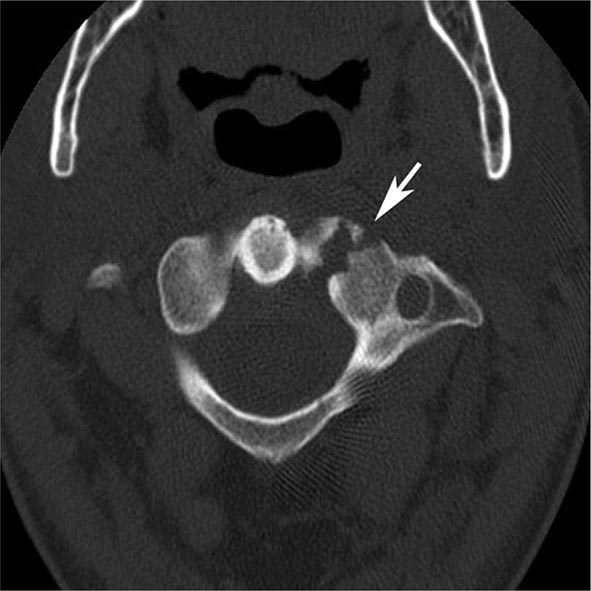
FIGURE 441e-31 CT facet fracture. Axial CT demonstrates fracture line along the C2 facet (arrow).
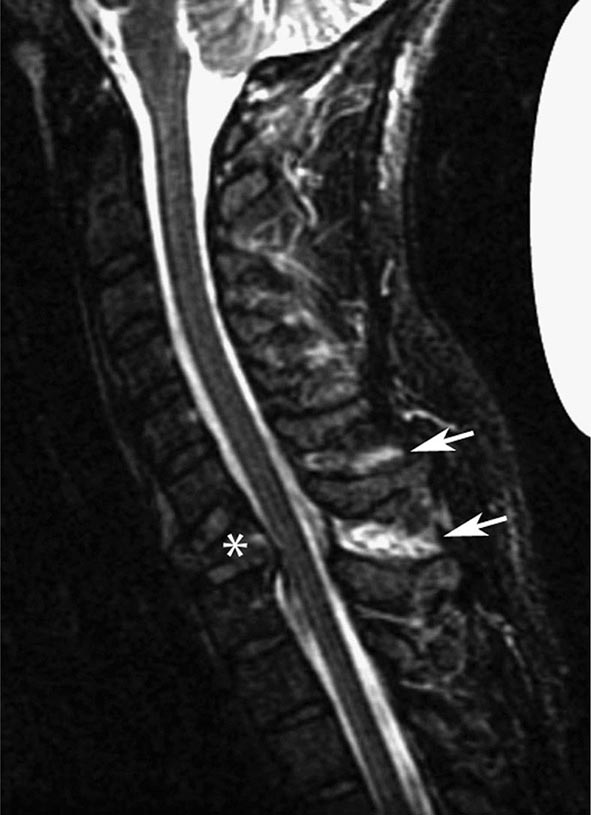
FIGURE 441e-32 Compression fracture. Sagittal T2-weighted MRI demonstrates compression fracture of C7 (∗) and high signal within the spinous processes of C6-C7 (arrows) and to lesser degree C5-C6. This is suggestive of interspinous ligament injury. Note the pad under the patient’s neck to maintain neck alignment during the scanning time.
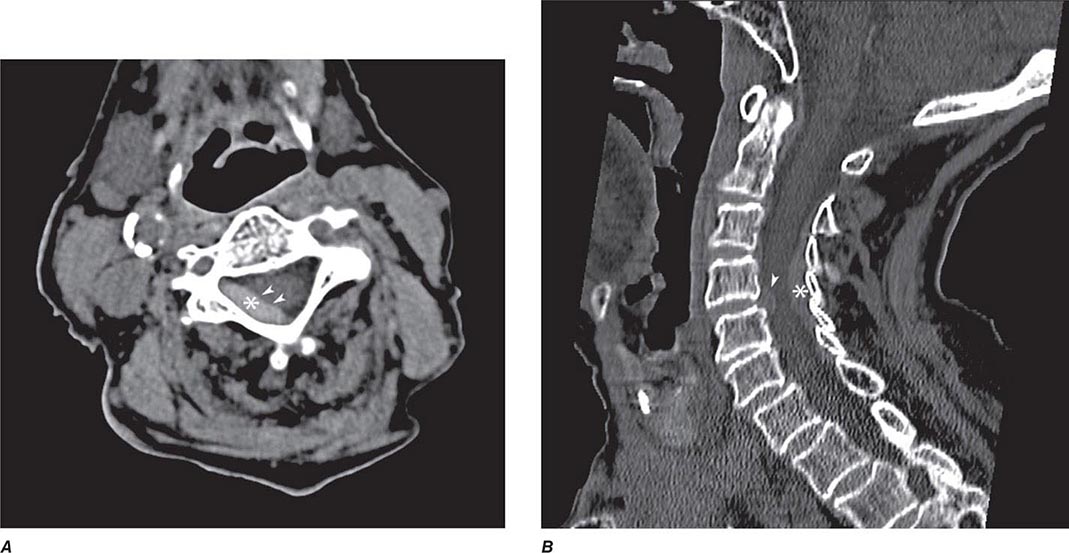
FIGURE 441e-33 Epidural hematoma. Axial noncontrast CT (A) demonstrates a high-density epidural collection in the cervical spine (∗), which is consistent with acute hemorrhage. Also noted is mass effect on the spinal cord (arrowheads). Sagittal reformatted CT image (B) demonstrates the extension of the acute epidural hematoma (∗) and a disk bulge (arrowhead), which further contributes to spinal canal narrowing. CT is the imaging procedure of choice to detect acute hematoma.
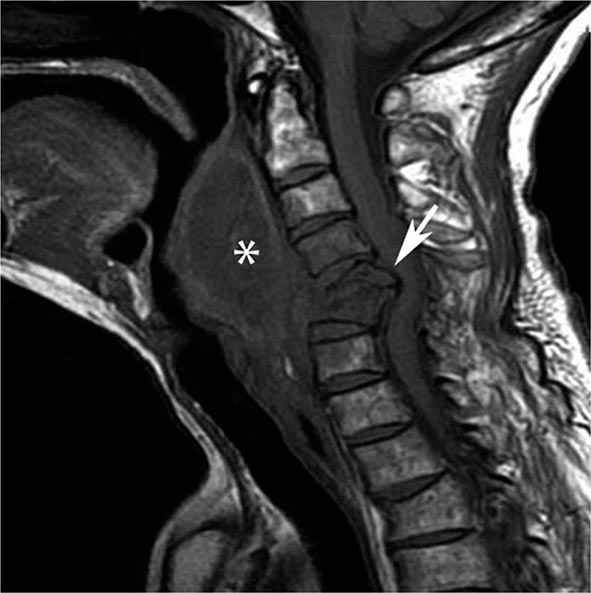
FIGURE 441e-34 Retropharyngeal soft tissue mass. Sagittal T1-weighted MRI demonstrates a hyperflexion fracture with retropulsion of the posterior wall in the canal at C5 and C6 (arrow). There is also a large retropharyngeal hematoma (∗). The distance from the posterior wall of the airway to the anterior wall of the vertebral body should not measure more than 6 mm at C2 or more than 20 mm at C6 (mnemonic “6 at 2 and 20 at 6”).
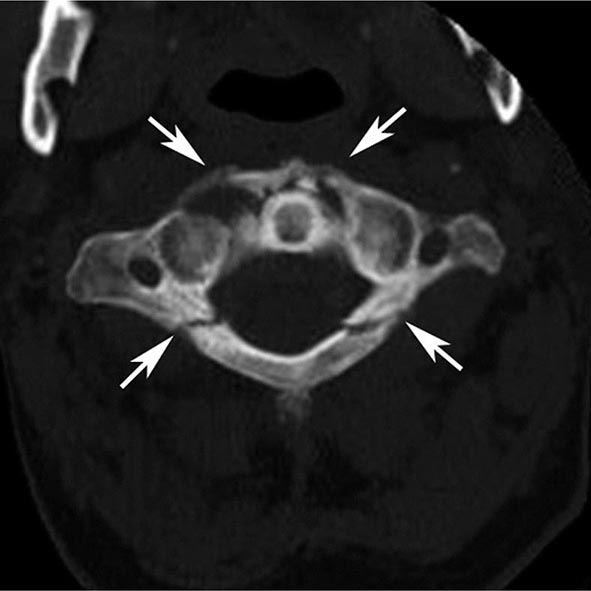
FIGURE 441e-35 Jefferson fracture. Axial CT demonstrates four fracture lines (arrows) separating C1 in four parts. Jefferson fracture is usually caused by axial impact to the head such as diving in shallow water.
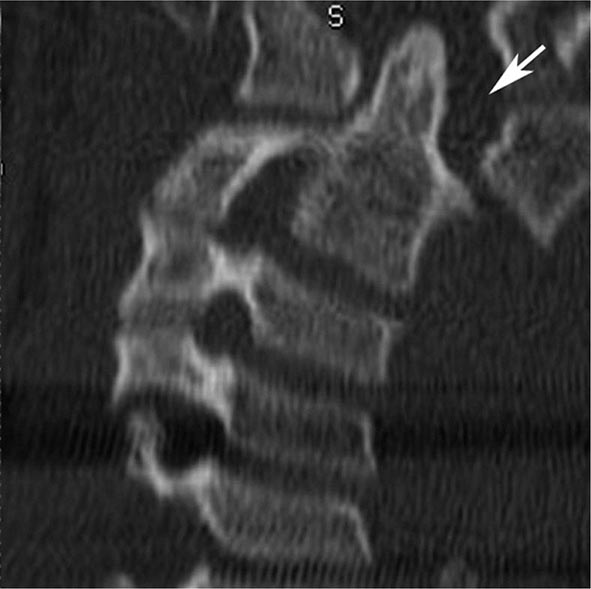
FIGURE 441e-36 Ligament injury after trauma. Coronal CT reconstruction demonstrates abnormal asymmetry between the dens and the lateral masses of C1 indicating transverse ligament rupture.
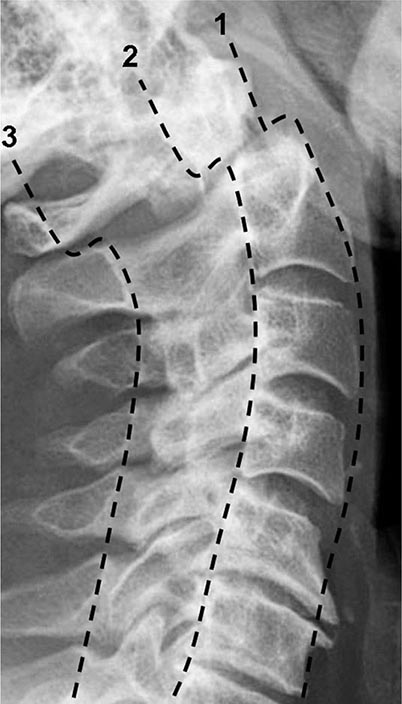
FIGURE 441e-37 Odontoid fracture. Sagittal CT demonstrates disruption of the main reference cervical lines. 1: Anterior vertebral body line; 2: Posterior vertebral body line; 3: Spinolaminar line.
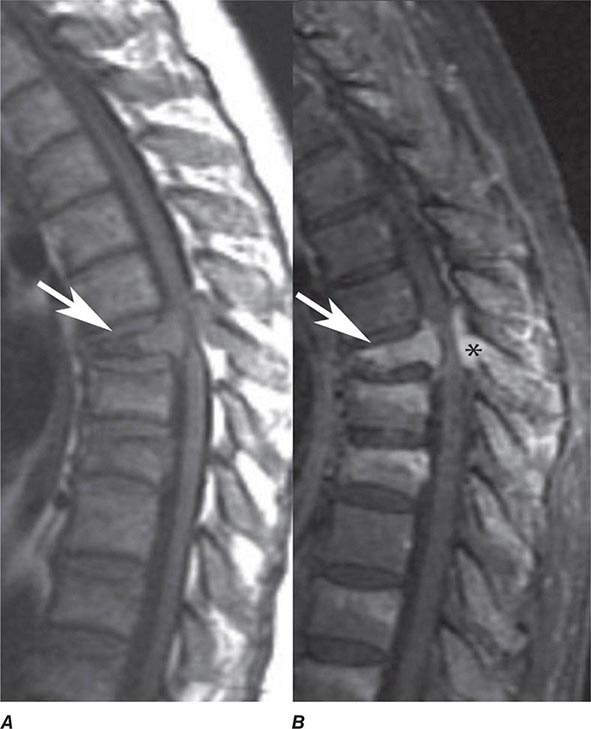
FIGURE 441e-38 Pathologic fracture. Sagittal T1-weighted MRI (A) demonstrates wedge-shaped T6 vertebral body (arrow). Sagittal postcontrast T1-weighted MRI (B) depicts tumor extension into the epidural space and the involvement of the posterior arch (∗), which are highly suggestive of metastatic or primary bone tumor.
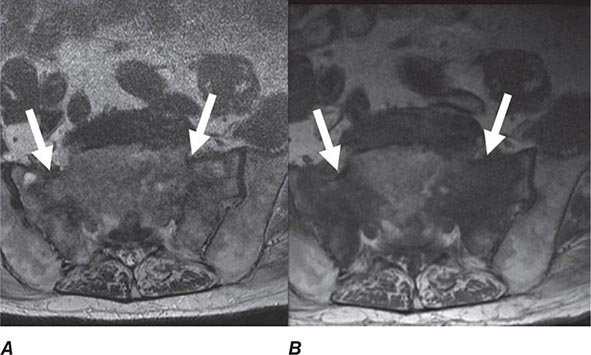
FIGURE 441e-39 Sacral insufficiency fracture. Axial T2-weighted MRI (A) and T1-weighted MRI (B) demonstrate symmetric high T2 and low T1 signal involving the sacral alae longitudinally (arrows).
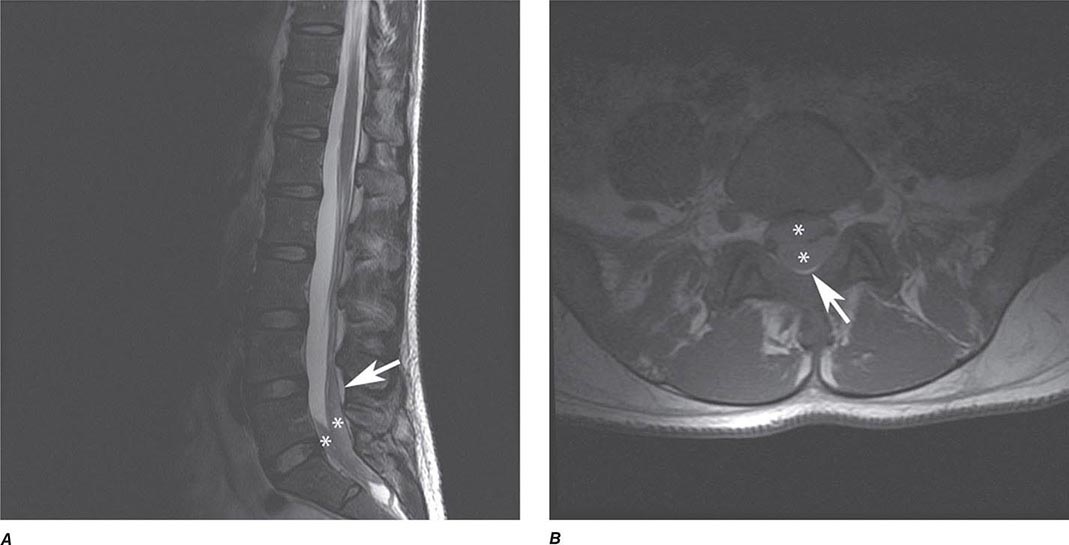
FIGURE 441e-40 Subdural hematoma. Sagittal T2-weighted MRI (A) and axial noncontrast T1-weighted MRI (B) demonstrate subdural collection in the lumbosacral region (∗∗). Note that the epidural fat is compressed but not involved (arrow).
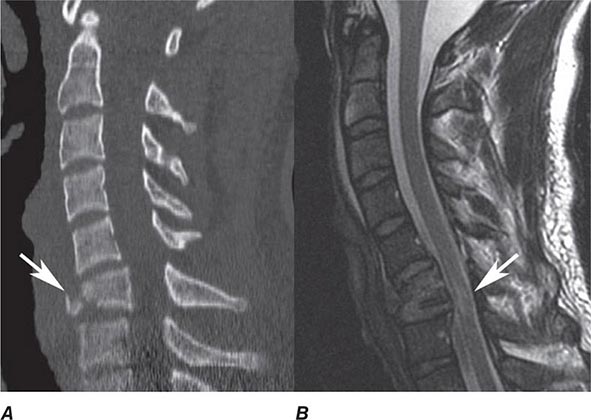
FIGURE 441e-41 Teardrop fracture. Sagittal CT (A) demonstrates fracture line separating the anteroinferior corner of C6 (arrow). Sagittal T2-weighted MRI (B) displays cord injury (arrow).
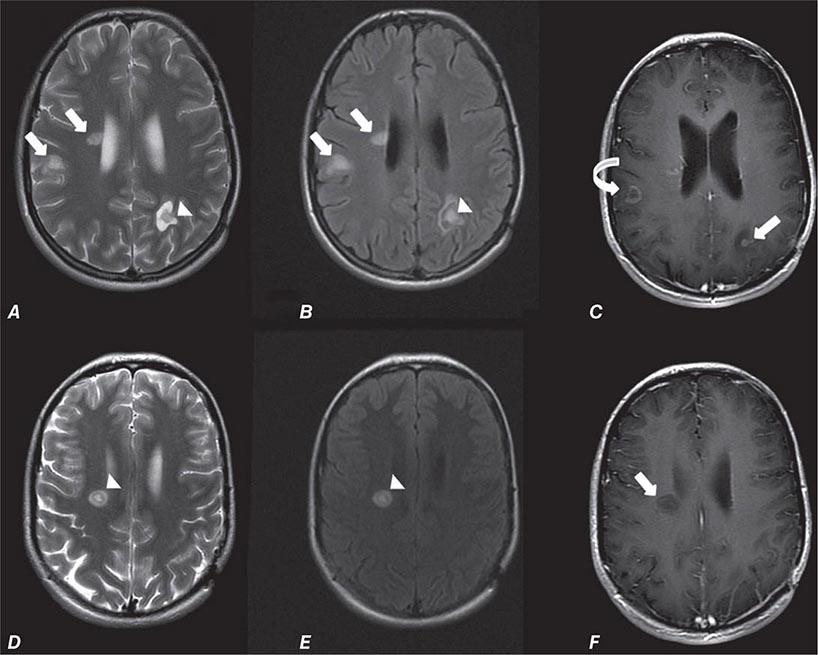
FIGURE 441e-42 Demyelinating disease (multiple sclerosis, Chap. 458). Axial T2-weighted MRI (A, D) and axial T2 FLAIR MRI (B, E) demonstrate multiple hyperintense lesions involving the periventricular and subcortical white matter (arrows). Although not always present, the appearance of a “lesion within and lesion” (arrowheads) is typical of demyelinating disease. Axial T1-weighted postcontrast MRI (C, F) shows partial enhancement of the lesion (arrows), which is often peripheral, incomplete, and “C-shaped” (curved arrow).
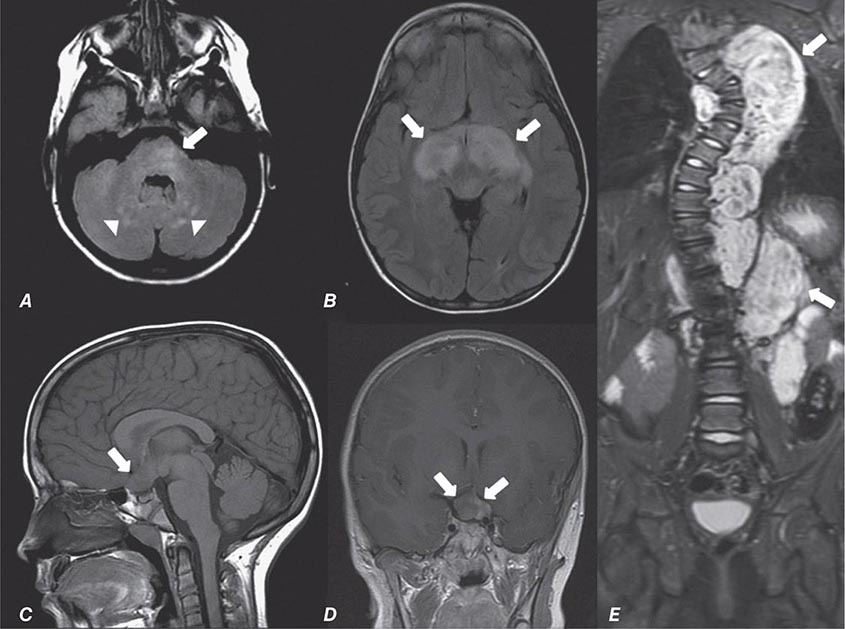
FIGURE 441e-43 Neurofibromatosis type 1 (Chap. 118). Axial T2 FLAIR MRI (A, B) demonstrates multiple hyperintense lesions involving the brainstem and basal ganglia (arrows) as well as deep cerebellar hemispheres (arrowheads). Sagittal and corona T1-weighted postcontrast MRI (C, D) shows enlargement of the optic chiasm with an area of enhancement on the left, representing an optic pathway glioma (arrows). Coronal STIR MRI (E) shows thoracolumbar scoliosis and a large paravertebral plexiform neurofibroma (arrows).
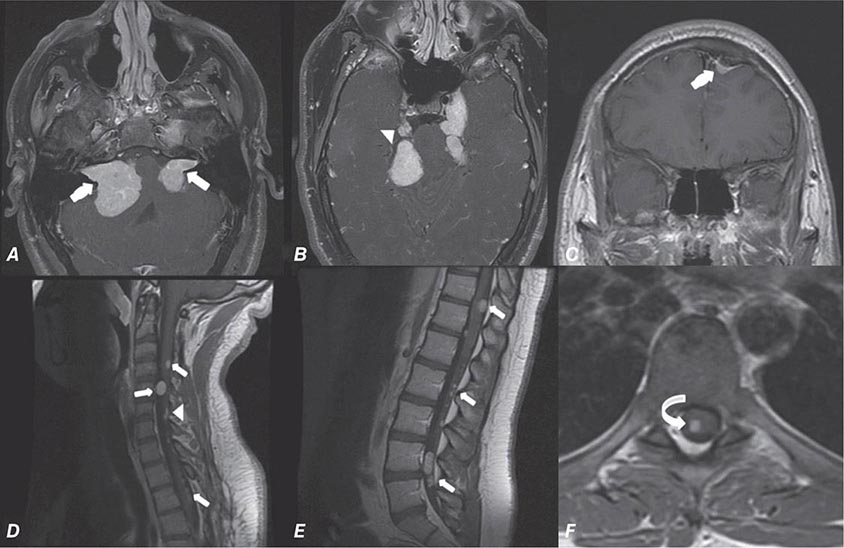
FIGURE 441e-44 Neurofibromatosis type 2 (Chap. 118). Axial T1-weighted postcontrast MRI (A, B) shows enhancing expansible lesions in the bilateral cerebellopontine cisterns extending in the internal auditory canals, consistent with vestibular schwannomas (arrows), as well as in the bilateral prepontine cistern, consistent with trigeminal schwannomas (arrowheads). Coronal axial T1-weighted image postgadolinium (C) demonstrates an intensely enhancing dural-based lesion typical for a small meningioma (arrows). Sagittal (D, E) T1-weighted images postgadolinium show intradural, extramedullary lesions, suggestive of multiple spinal schwannomas (small arrows). The flat dural-based lesion may represent a spinal meningioma (arrowhead). Axial T1-weighted image postgadolinium (F) shows an enhancing intramedullary lesion, most consistent with an ependymoma. (curved arrow).
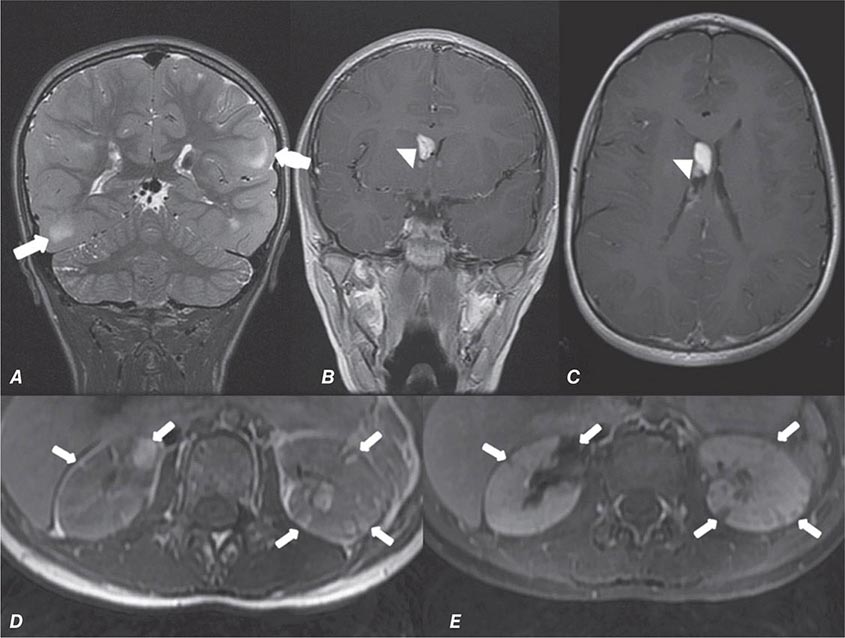
FIGURE 441e-45 Tuberous sclerosis (Chap. 118). Coronal T2-weighted MRI (A) shows multiple T2 hyperintense lesions in a cortical and subcortical distribution (arrows). Coronal and axial postcontrast T1-weighted image (B, C) demonstrates an expanding nodule with intense enhancement in the proximity of the right foramen of Monro, consistent with a subependymal giant-cell astrocytoma (SEGA) (arrowheads). Surveillance T1-weighted image (D) and postcontrast T1-weighted image with fat saturation (E) show multiple bilateral renal lesions with signal intensity of fat, consistent with angiomyolipomas (small arrows).
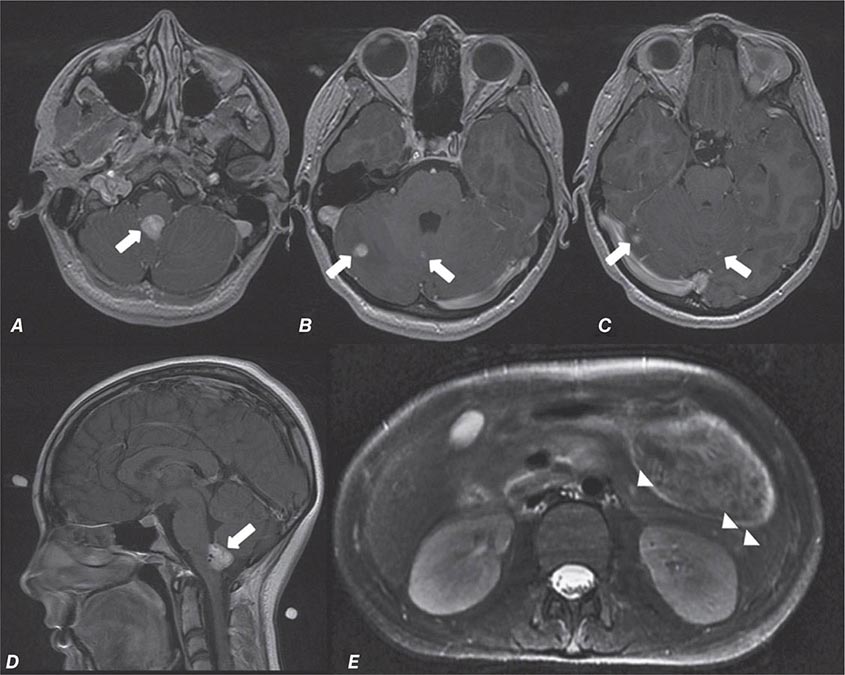
FIGURE 441e-46 Von Hippel–Lindau (VHL) (Chap. 408). Axial postcontrast T1 weighted images (A–C) demonstrates multiple enhancing nodules in the posterior fossa (arrows). Sagittal postcontrast T1-weighted image (D) shows vascular flow voids within the enhancing nodule in the region of the foramen of Magendie (arrow), indicating increased vascularity. Surveillance axial T2-weighted MRI of the abdomen (E) shows multiple small pancreatic cysts (arrowheads). This patient did not have an endolymphatic sac tumor, renal cell carcinoma, neuroendocrine pancreatic tumor, or pheochromocytoma, all of which may also occur in von Hippel–Lindau disease.
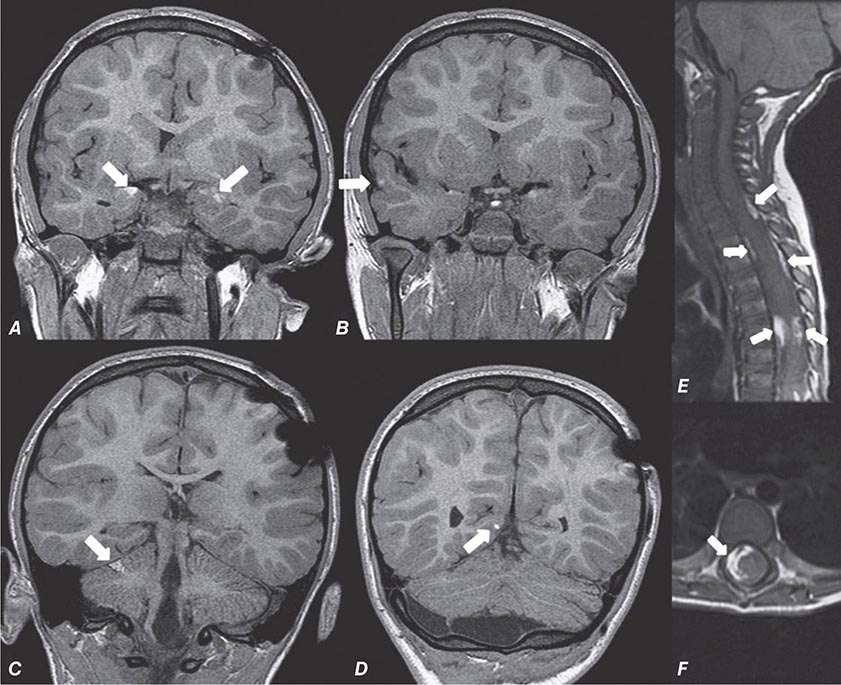
FIGURE 441e-47 Neurocutaneous melanosis. Coronal T1 weighted MRI (A–D) shows multiple lesions with intrinsic increased T1 signal in the bilateral amygdalae, right superior temporal gyrus, right cerebellar hemisphere, and right medial occipital cortex (arrows). Sagittal and axial T1-weighted images of the spine (E, F) show intradural, extramedullary lesions, also with intrinsic increased T1 signal, due to malignant melanoma (arrows).
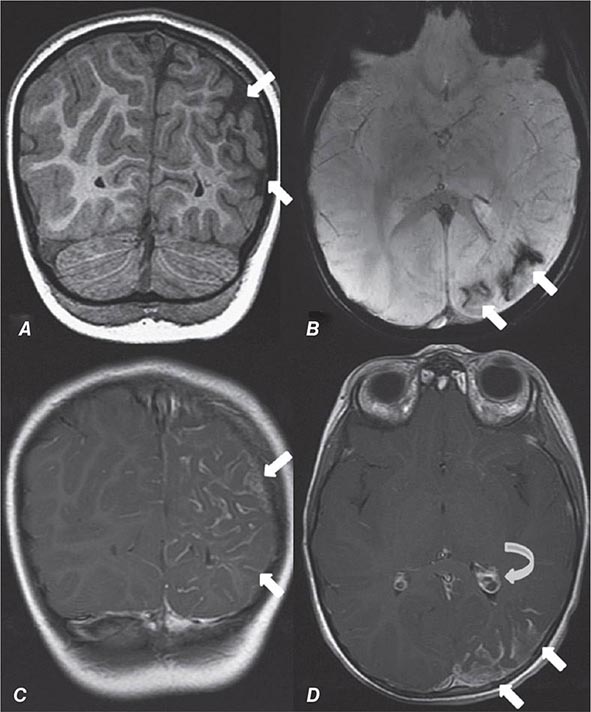
FIGURE 441e-48 Sturge-Weber syndrome. Coronal T1-weighted MRI (A) shows enlargement of the sulci in the left parietal lobe, consistent with brain parenchymal volume loss (arrows). Axial susceptibility weighted imaging shows susceptibility effect in this region, consistent with calcifications (arrows). Coronal and axial T1-weighted images postgadolinium (C, D) show increased leptomeningeal enhancement (arrows) and enlargement of the left choroid plexus (curved arrow).
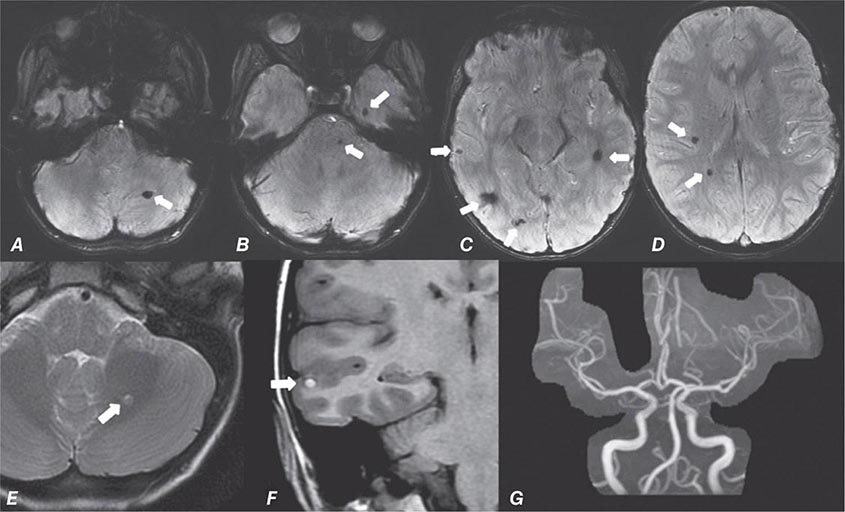
FIGURE 441e-49 Multiple cavernomas (Chap. 446). Axial susceptibility weighted images (A–D) show multiple foci of susceptibility involving the bilateral cerebral hemispheres, pons, and left cerebellum, which in a young patient most likely represents multiple cavernomas (arrows). These lesions have variable signal intensity on T2-weighted (E) and T1-weighted MRI (F), related to the different stages of hemoglobin degradation (arrows). Cavernomas are not seen on the time-of-flight MR angiography (G); thus these are designated as angiographically occult vascular malformations. Of note, in elderly patients, amyloid angiopathy may have a similar appearance.
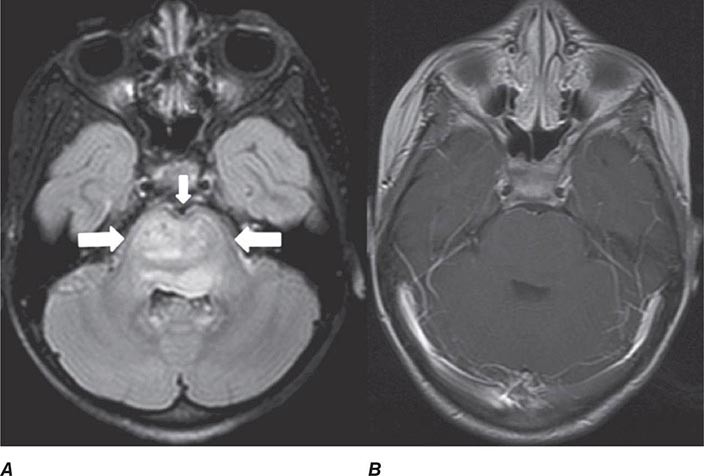
FIGURE 441e-50 Brainstem glioma (Chap. 118). Axial T2 FLAIR MRI (A) demonstrates increased T2 signal and marked enlargement of the pons (large arrows), which engulfs the basilar artery (small arrow). These findings are characteristic of brainstem glioma. At the time of diagnosis, these lesions are typically low grade without abnormal enhancement, as shown by axial postcontrast T1-weighted image (B).
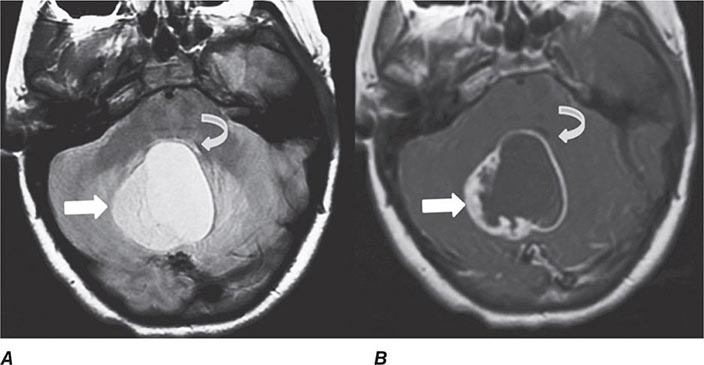
FIGURE 441e-51 Pilocytic astrocytoma (Chap. 118). Axial T2-weighted and T1-weighted postgadolinium images (A, B) show a cystic lesion with peripheral enhancement and an enhancing solid component located in the posterior fossa (arrows). These findings are suggestive of a pilocytic astrocytoma. Note that the lesion exerts mass effect on the fourth ventricle, which is compressed (curved arrows).
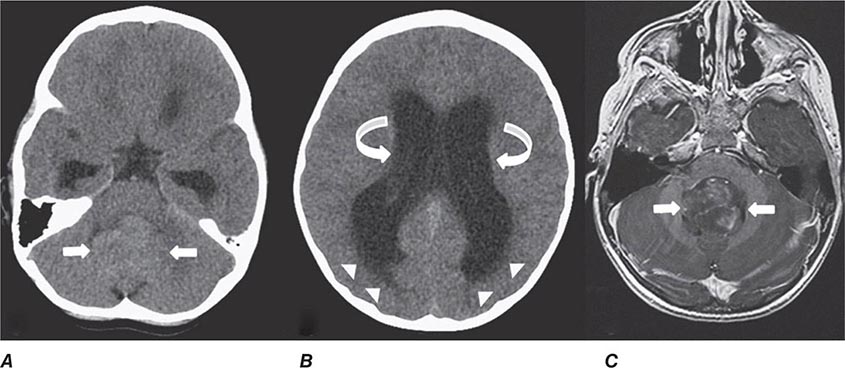
FIGURE 441e-52 Fourth ventricle ependymoma causing hydrocephalus (Chap. 118). Unenhanced axial CT images (A, B) demonstrate an expansile mass lesion, isodense with brain parenchyma, filling the fourth ventricle (arrows) and causing obstruction of cerebrospinal fluid flow, dilation of the lateral ventricles, and hydrocephalus (curved arrows). The hypoattenuation within periventricular white matter bilaterally represents transependymal flow (arrowheads). Axial T1-weighted postgadolinium MRI confirms the presence of a heterogeneously enhancing mass filling the fourth ventricle (arrow), which is suggestive of ependymoma.
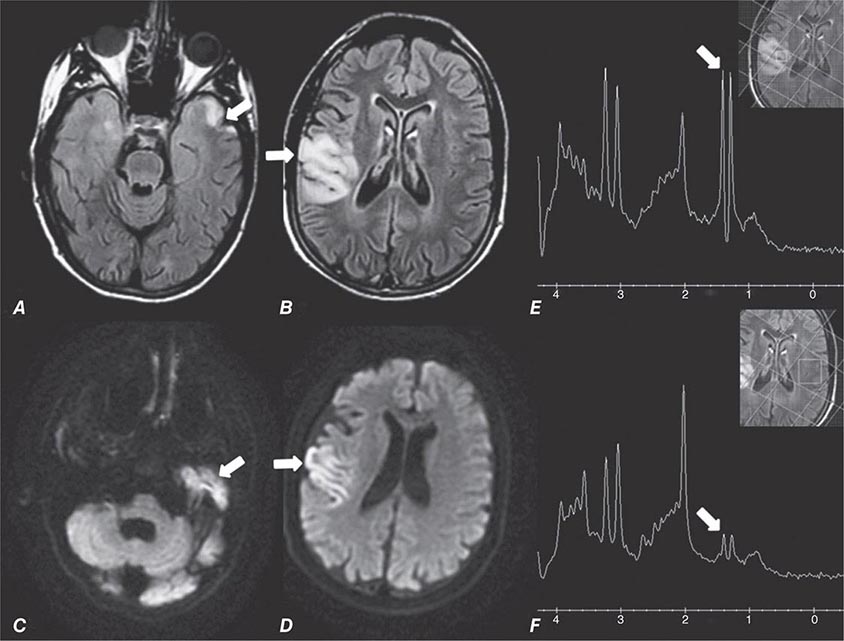
FIGURE 441e-53 Mitochondrial encephalopathy, lactic acidosis, and stroke-like episodes (MELAS) (Chap. 462e). Axial T2 FLAIR MRI (A, B) shows areas of increased T2 signal involving the cortex and subcortical white matter in the posterior right frontal lobe and anterior left temporal lobe, consistent with edema (arrows). Axial diffusion-weighted images (C, D) show reduced diffusion from cytotoxic edema, consistent with infarcts (arrows). MR spectroscopy of the right frontal lesion (E) demonstrates markedly increased lactate (arrow), an expected finding in infarction regardless of etiology. However, MR spectroscopy of the normal-appearing contralateral brain parenchyma (F) shows mildly elevated lactate (arrow), which is suggestive of a mitochondrial disorder.
FIGURE 441e-54 Leigh’s disease (subacute necrotizing encephalomyelopathy) (Chap. 85e). Axial T2-weighted MRI (A, B) demonstrates increased T2 signal involving the substantia nigra (white arrows) and dorsal midbrain (black arrows), as well as the putamin bilaterally (curved arrows). This is a common pattern for the mitochondrial disorder Leigh’s disease secondary to cytochrome oxidase (CO IV) deficiency.
FIGURE 441e-55 Krabbe’s disease (Chap. 432e). Axial and coronal T2-weighted MRIs (A, B) show increased T2 signal involving predominantly the posterior white matter bilaterally (arrows) with sparing of the subcortical U-fibers (arrowheads). MR spectroscopy of the left parietal white matter (C) shows markedly decreased N-acetylaspartate (large arrow) and increased lactate/lipids (small arrow), consistent with severe neuronal injury.
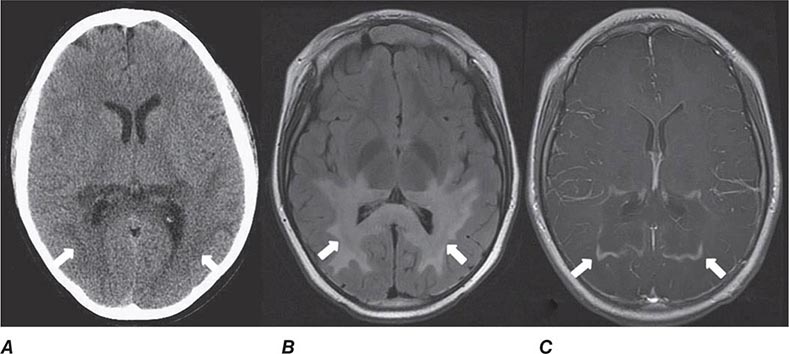
FIGURE 441e-56 X-linked adrenoleukodystrophy (Chap. 459). Axial unenhanced CT (A) demonstrates areas of attenuation involving the posterior white matter bilaterally (arrows). Axial T2 FLAIR MRI (B) displays increased T2 signal consistent with edema (arrows). Axial T1-weighted image postgadolinium (C) shows peripheral enhancement of the parietal lesions bilaterally (arrows). These findings are typical of adrenoleukodystrophy.
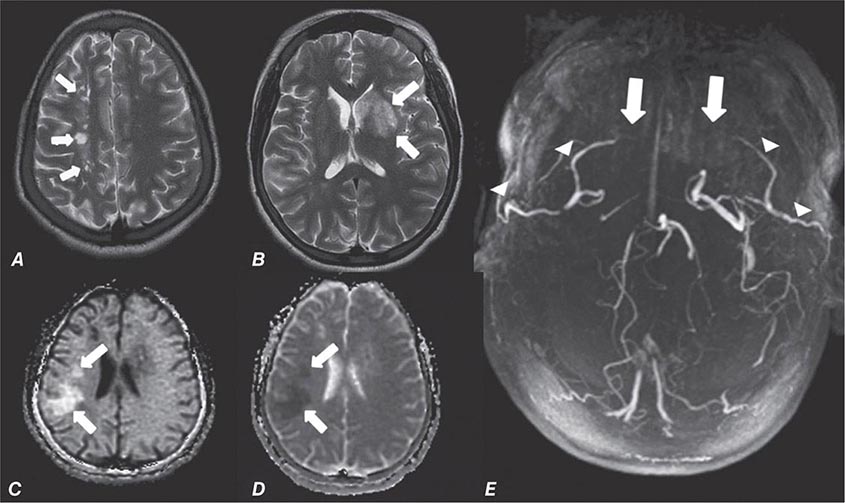
FIGURE 441e-57 Sickle cell disease and moyamoya disease (Chap. 446). Axial T2-weighted MRI (A, B) shows multiple small areas of encephalomalacia from prior infarcts in the watershed zones between the anterior and middle cerebral artery territories (small arrows). There is also an area of edema involving the left basal ganglia from an evolving subacute infarct (arrow). An axial diffusion-weighted image (C) with corresponding ADC map (D) shows an area of restricted diffusion in the right frontoparietal region, consistent with an acute infarct (arrows). Time-of-flight MR angiography (E) shows absence of flow in the distal internal carotid arteries and proximal middle cerebral arteries (arrows) due to moyamoya disease. Also note that this patient is status post–bilateral encephalo-duro-arterio-synangiosis (EDAS) (arrowheads), a surgical procedure to create indirect anastomosis between branches of the external carotid artery with distal branches of the middle cerebral artery.
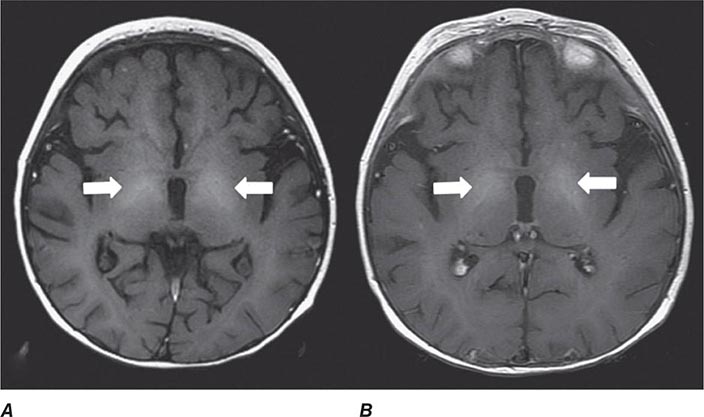
FIGURE 441e-58 Hepatic encephalopathy (Chap. 330). Axial T1-weighted MRI (A, B) shows increased intrinsic T1 signal involving the basal ganglia bilaterally, particularly the globus pallidus (arrows).
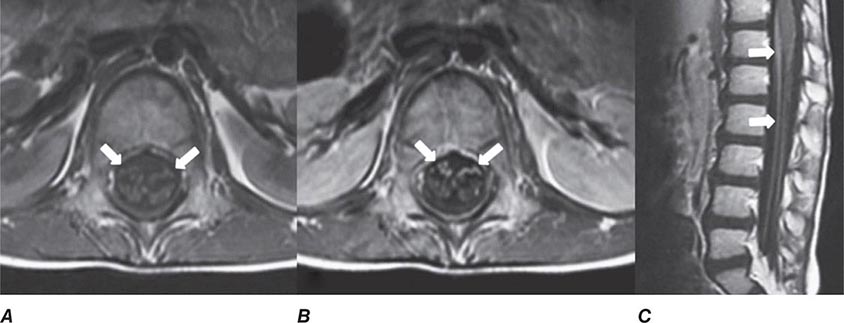
FIGURE 441e-59 Guillain-Barré syndrome (Chap. 460). Axial precontrast T1-weighted MRI (A) and axial and sagittal T1-weighted postgadolinium (B, C) images show thickening and increased enhancement of the anterior roots of the cauda equina (arrows).
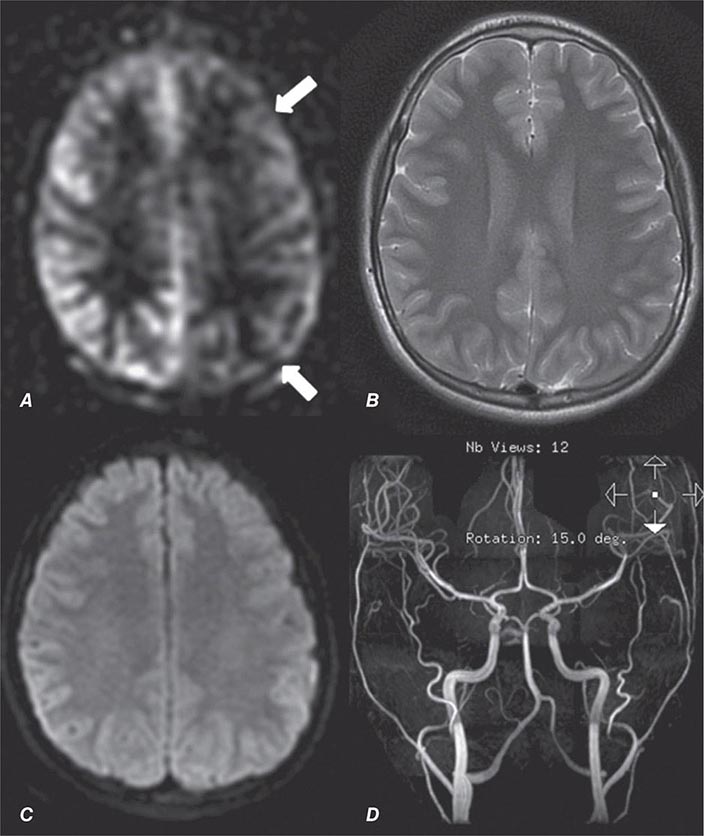
FIGURE 441e-60 Hemiplegic migraine (Chap. 447). Axial noncontrast perfusion MRI using an arterial spin labeling technique (A) demonstrates decreased cerebral blood flow to the left hemisphere (arrows) in a patient with right hemiparesis associated with migraine symptoms. No abnormality was seen on T2-weighted images, diffusion-weighted images, or time-of-flight MR angiography (B–D) to suggest stroke.
442e |
Electrodiagnostic Studies of Nervous System Disorders: EEG, Evoked Potentials, and EMG |
ELECTROENCEPHALOGRAPHY
The electrical activity of the brain (the electroencephalogram [EEG]) is easily recorded from electrodes placed on the scalp. The potential difference between pairs of electrodes on the scalp (bipolar derivation) or between individual scalp electrodes and a relatively inactive common reference point (referential derivation) is amplified and displayed on a computer monitor, oscilloscope, or paper. Digital systems allow the EEG to be reconstructed and displayed with any desired format and to be manipulated for more detailed analysis and also permit computerized techniques to be used to detect certain abnormalities. The characteristics of the normal EEG depend on the patient’s age and level of arousal. The rhythmic activity normally recorded represents the postsynaptic potentials of vertically oriented pyramidal cells of the cerebral cortex and is characterized by its frequency. In normal awake adults lying quietly with the eyes closed, an 8- to 13-Hz alpha rhythm is seen posteriorly in the EEG, intermixed with a variable amount of generalized faster (beta) activity (>13 Hz); the alpha rhythm is attenuated when the eyes are opened (Fig. 442e-1). During drowsiness, the alpha rhythm is also attenuated; with light sleep, slower activity in the theta (4–7 Hz) and delta (<4 Hz) ranges becomes more conspicuous.
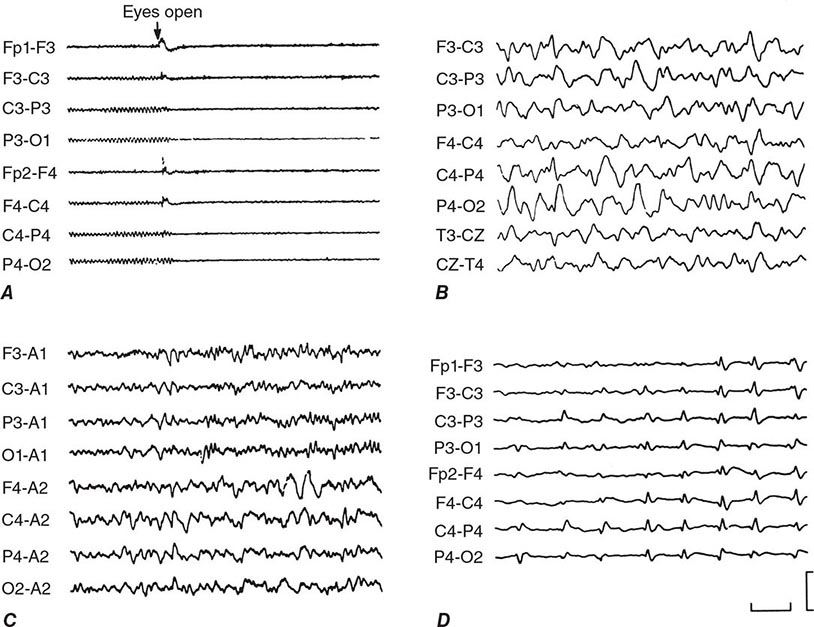
FIGURE 442e-1 A. Normal electroencephalogram (EEG) showing a posteriorly situated 9-Hz alpha rhythm that attenuates with eye opening. B. Abnormal EEG showing irregular diffuse slow activity in an obtunded patient with encephalitis. C. Irregular slow activity in the right central region, on a diffusely slowed background, in a patient with a right parietal glioma. D. Periodic complexes occurring once every second in a patient with Creutzfeldt-Jakob disease. Horizontal calibration: 1 s; vertical calibration: 200 μV in A, 300 μV in other panels. In this and the following figure, electrode placements are indicated at the left of each panel and accord with the international 10:20 system. A, earlobe; C, central; F, frontal; Fp, frontal polar; P, parietal; T, temporal; O, occipital. Right-sided placements are indicated by even numbers, left-sided placements by odd numbers, and midline placements by Z. (From MJ Aminoff [ed]: Aminoff’s Electrodiagnosis in Clinical Neurology, 6th ed. Oxford, Elsevier Saunders, 2012.)
Activating procedures are generally undertaken while the EEG is recorded in an attempt to provoke abnormalities. Such procedures commonly include hyperventilation (for 3 or 4 min), photic stimulation, sleep, and sleep deprivation on the night prior to the recording.
Electroencephalography is relatively inexpensive and may aid clinical management in several different contexts.
THE EEG AND EPILEPSY
The EEG is most useful in evaluating patients with suspected epilepsy. The presence of electrographic seizure activity—i.e., of abnormal, repetitive, rhythmic activity having an abrupt onset and termination and a characteristic evolution—clearly establishes the diagnosis. The absence of such electrocerebral accompaniment to an episodic behavioral disturbance does not exclude a seizure disorder, however, because there may be no changes in the scalp-recorded EEG during certain focal seizures. With generalized tonic-clonic seizures, the EEG is always abnormal during the episode. It is often not possible to obtain an EEG during clinical events that may represent seizures, especially when such events occur unpredictably or infrequently. Continuous monitoring for prolonged periods in video-EEG telemetry units has made it easier to capture the electrocerebral accompaniments of such clinical episodes. Monitoring by these means is sometimes helpful in confirming that seizures are occurring, characterizing the nature of clinically equivocal episodes, and determining the frequency of epileptic events.
The EEG findings in the interictal period may show certain abnormalities that are strongly supportive of a diagnosis of epilepsy. Such epileptiform activity consists of bursts of abnormal discharges containing spikes or sharp waves. The presence of epileptiform activity is not specific for epilepsy, but it has a much greater prevalence in epileptic patients than in normal individuals. However, even in individuals with epilepsy, the initial routine interictal EEG may be normal up to 60% of the time. Thus, the EEG cannot establish the diagnosis of epilepsy in many cases.
The EEG findings have been used in classifying seizure disorders and selecting appropriate anticonvulsant medication for individual patients (Fig. 442e-2). The episodic generalized spike-wave activity that occurs during and between seizures in patients with typical absence epilepsy contrasts with focal interictal epileptiform discharges or ictal patterns found in patients with focal seizures. These latter seizures may have no correlates in the scalp-recorded EEG or may be associated with abnormal rhythmic activity of variable frequency, a localized or generalized distribution, and a stereotyped pattern that varies with the patient. Focal or lateralized epileptogenic lesions are important to recognize, especially if surgical treatment is contemplated. Intensive long-term monitoring of clinical behavior and the EEG is required for operative candidates, however, and this generally also involves recording from intracranial (subdural, extradural, or intracerebral) electrodes.
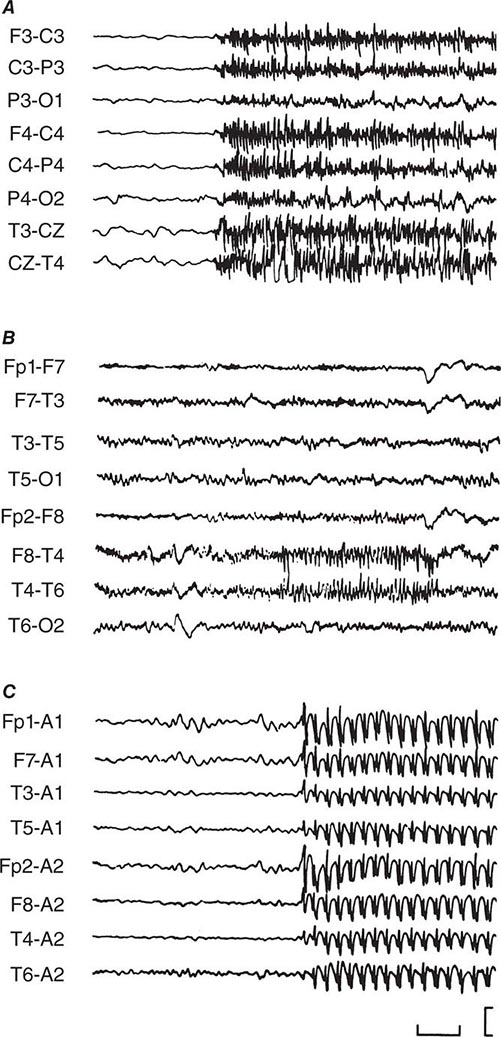
FIGURE 442e-2 Electrographic seizures. A. Onset of a tonic seizure showing generalized repetitive sharp activity with synchronous onset over both hemispheres. B. Burst of repetitive spikes occurring with sudden onset in the right temporal region during a clinical spell characterized by transient impairment of external awareness. C. Generalized 3-Hz spike-wave activity occurring synchronously over both hemispheres during an absence (petit mal) attack. Horizontal calibration: 1 s; vertical calibration: 400 µV in A, 200 µV in B, and 750 µV in C. (From MJ Aminoff [ed]: Aminoff’s Electrodiagnosis in Clinical Neurology, 6th ed. Oxford, Elsevier Saunders, 2012.)
The EEG findings may indicate the prognosis of seizure disorders: In general, a normal EEG implies a better prognosis than otherwise, whereas an abnormal background or profuse epileptiform activity suggests a poor outlook. The EEG findings are not helpful in determining which patients with head injuries, stroke, or brain tumors will go on to develop seizures, because in such circumstances epileptiform activity is commonly encountered regardless of whether seizures occur. The EEG findings are of limited utility in determining whether anticonvulsant medication can be discontinued after several seizure-free years. Further seizures may occur after withdrawal of anticonvulsant medication despite a normal EEG or, conversely, may not occur despite a continuing EEG abnormality. The decision to discontinue anticonvulsant medication is made on clinical grounds, and the EEG is helpful only for providing guidance when there is clinical ambiguity or the patient requires reassurance about a particular course of action.
The EEG has no role in the management of tonic-clonic status epilepticus except when there is clinical uncertainty about whether seizures are continuing in a comatose patient. In patients treated by drug-induced coma for refractory status epilepticus, the EEG findings indicate the level of anesthesia and whether seizures are occurring. During status epilepticus, the EEG shows repeated electrographic seizures or continuous spike-wave discharges. In nonconvulsive status epilepticus, a disorder that may not be recognized unless an EEG is performed, the EEG may also show continuous spike-wave activity (“spike-wave stupor”) or, less commonly, repetitive electrographic seizures (focal status epilepticus).
THE EEG AND COMA
The EEG tends to become slower as consciousness is depressed, regardless of the underlying cause (Fig. 442e-1). Other findings may suggest diagnostic possibilities, as when electrographic seizures are found or a focal abnormality indicates a structural lesion. The EEG generally slows in metabolic encephalopathies, and triphasic waves may be present. The findings do not permit differentiation of the underlying metabolic disturbance but help to exclude other encephalopathic processes by indicating the diffuse extent of cerebral dysfunction. An EEG responsive to external stimulation is helpful prognostically because electrocerebral responsiveness implies a lighter level of coma than a nonreactive EEG, and thus a better prognosis. Serial records provide a better guide to prognosis than a single record and supplement the clinical examination in following the course of events. As the depth of coma increases, the EEG becomes nonreactive and may show a burst-suppression pattern, with bursts of mixed-frequency activity separated by intervals of relative cerebral inactivity. In other instances there is a reduction in amplitude of the EEG until eventually activity cannot be detected. Such electrocerebral silence does not necessarily reflect irreversible brain damage, because it may occur reversibly in hypothermic patients or with drug overdose. The prognosis of electrocerebral silence, when recorded using an adequate technique, therefore depends on the clinical context in which it is found. In patients with severe cerebral anoxia, for example, electrocerebral silence in a technically satisfactory record implies that useful cognitive recovery will not occur.
In patients with clinically suspected brain death, an EEG recorded using appropriate technical standards may be confirmatory by showing electrocerebral silence, but disorders that may produce a similar but reversible EEG appearance must be excluded. The presence of residual EEG activity in suspected brain death fails to confirm the diagnosis but does not exclude it. The EEG is usually normal in patients with locked-in syndrome (Chap. 446), and helps in distinguishing this disorder from the comatose state with which it is sometimes confused clinically.
THE EEG IN OTHER NEUROLOGIC DISORDERS
In developed countries, computed tomography (CT) scanning and magnetic resonance imaging (MRI) are used as a noninvasive means of screening for focal structural abnormalities of the brain, such as tumors, infarcts, or hematomas (Fig. 442e-1). The EEG is still used for this purpose in many parts of the world, however, although infratentorial or slowly expanding lesions may not be recognized. Focal slow-wave disturbances, a localized loss of electrocerebral activity, or more generalized electrocerebral disturbances are common findings but do not indicate the nature of the underlying pathology.
In patients with an acute encephalopathy, focal or lateralized periodic slow-wave complexes, sometimes with a sharpened outline, suggest a diagnosis of herpes simplex encephalitis, and periodic lateralizing epileptiform discharges (PLEDs) are commonly found with acute hemispheric pathology such as a hematoma, abscess, or rapidly expanding tumor. The EEG findings in dementia are usually nonspecific and do not distinguish reliably between different underlying causes except in rare instances when the presence of complexes occurring with a regular repetition rate (“periodic complexes”) supports a diagnosis of Creutzfeldt-Jakob disease (Fig. 442e-1) or subacute sclerosing panencephalitis. In most patients with dementia, the EEG is normal or diffusely slowed, and the findings alone cannot indicate whether a patient is demented or distinguish between dementia and pseudodementia.
CONTINUOUS EEG MONITORING
The brief EEG obtained routinely in the laboratory often fails to reveal abnormalities that are transient and infrequent. Continuous monitoring over 12 or 24 hours or longer may detect abnormalities or capture clinical events that otherwise would be missed. The EEG is often recorded continuously in critically ill patients to detect early changes in neurologic status. Continuous EEG recording in this context has been used to detect acute events such as from nonconvulsive seizures or developing cerebral ischemia, to monitor cerebral function in patients with metabolic disorders such as liver failure, and to manage the level of anesthesia in pharmacologically induced coma.
MAGNETOENCEPHALOGRAPHY AND MAGNETIC SOURCE IMAGING
Recording the magnetic field of the electrical activity of the brain (magnetoencephalography [MEG]) provides a means of examining cerebral activity that is less subject to distortion by other biologic tissues than the EEG. MEG is used in only a few specialized centers because of the complexity and expense of the necessary equipment. It permits the source of activity to be localized and coregistered with the MRI in a technique that is known as magnetic source imaging. In patients with focal epilepsy, MEG is useful in localizing epileptogenic foci for surgery and for guiding the placement of intracranial electrodes for electrophysiologic monitoring. MEG has also been used for mapping brain tumors, identifying the central fissure preoperatively, and localizing functionally eloquent cortical areas such as those concerned with language.
EVOKED POTENTIALS
SENSORY EVOKED POTENTIALS
The noninvasive recording of spinal or cerebral potentials elicited by stimulation of specific afferent pathways allows the functional integrity of these pathways to be monitored but does not indicate the pathologic basis of lesions involving them. Such evoked potentials (EPs) are small compared to the background EEG activity, and the responses to a number of stimuli are therefore recorded and averaged with a computer to permit their recognition and definition. The background EEG activity, which has no fixed temporal relationship to the stimulus, is averaged out by this procedure.
Visual evoked potentials (VEPs) are elicited by monocular stimulation with a reversing checkerboard pattern and are recorded from the occipital region in the midline and on either side of the scalp. The component of major clinical importance is the so-called P100 response, a positive peak having a latency of approximately 100 ms. Its presence, latency, and symmetry over the two sides of the scalp are noted. Amplitude changes are less helpful for the recognition of pathology. VEPs are most useful in detecting dysfunction of the visual pathways anterior to the optic chiasm. In acute severe optic neuritis, the P100 is frequently lost or grossly attenuated; as clinical recovery occurs, it is restored but with an increased latency that generally remains abnormal indefinitely. The VEP findings are therefore helpful in indicating previous or subclinical optic neuritis. They may also be abnormal with ocular abnormalities and with other causes of optic nerve disease, such as ischemia or compression by a tumor. Flash-elicited VEPs may be normal in patients with cortical blindness.
Routine VEPs record a mass response over a relatively large cortical area and thus may be insensitive to localized waveform abnormalities. A newer technique, multifocal VEP, measures responses from 120 individual sectors within each affected eye and is more sensitive than routine VEP.
Brainstem auditory evoked potentials (BAEPs) are elicited by monaural stimulation with repetitive clicks and are recorded between the vertex of the scalp and the mastoid process or earlobe. A series of potentials, designated by roman numerals, occurs in the first 10 ms after the stimulus and represents in part the sequential activation of different structures in the pathway between the auditory nerve (wave I) and the inferior colliculus (wave V) in the midbrain. The presence, latency, and interpeak latency of the first five positive potentials recorded at the vertex are evaluated. The findings are helpful in screening for acoustic neuromas, detecting brainstem pathology, and evaluating comatose patients. The BAEPs are often normal in coma due to metabolic/toxic disorders or bihemispheric disease but are typically abnormal in the presence of brainstem pathology.
Somatosensory evoked potentials (SSEPs) are recorded over the scalp and spine in response to electrical stimulation of a peripheral (mixed or cutaneous) nerve. The configuration, polarity, and latency of the responses depend on the nerve that is stimulated and on the recording arrangements. SSEPs are used to evaluate proximal (otherwise inaccessible) portions of the peripheral nervous system and the integrity of the central somatosensory pathways, especially in patients who are comatose or suspected to be brain dead.
Clinical Utility of EPs EP studies may detect and localize lesions in afferent pathways in the central nervous system (CNS). They have been used particularly to investigate patients with suspected multiple sclerosis (MS), the diagnosis of which requires the recognition of multifocal white-matter lesions. In patients with clinical evidence of a single lesion, the electrophysiologic recognition of abnormalities in other sites helps to support the diagnosis but does not establish it unequivocally. Multimodality EP abnormalities are not specific for MS; they may occur in AIDS, Lyme disease, systemic lupus erythematosus, neurosyphilis, spinocerebellar degenerations, familial spastic paraplegia, and deficiency of vitamin E or B12, among other disorders. The diagnostic utility of the EP findings therefore depends on the circumstances in which they are found. Abnormalities may aid in the localization of lesions to broad areas of the CNS, but attempts at precise localization may be misleading because the generators of many components are unknown.
The EP findings are sometimes of prognostic relevance. Bilateral loss of cortically generated SSEP components implies that cognition may not be regained in posttraumatic or postanoxic coma, and EP studies may also be useful in evaluating patients with suspected brain death. In patients who are comatose for uncertain reasons, preserved BAEPs suggest either a metabolic-toxic etiology or bihemispheric disease. In patients with spinal cord injuries, SSEPs have been used to indicate the completeness of the lesion. The presence or early return of a cortically generated response to stimulation of a nerve below the injured segment of the cord indicates an incomplete lesion and thus a better prognosis for functional recovery than otherwise. In surgery, intraoperative EP monitoring of neural structures placed at risk by the procedure may permit the early recognition of dysfunction and thereby permit a neurologic complication to be averted or minimized.
Visual and auditory acuity may be determined using EP techniques in patients whose age or mental state precludes traditional ophthalmologic or audiologic examinations.
COGNITIVE EVOKED POTENTIALS
Certain EP components depend on the mental attention of the subject and the setting in which the stimulus occurs, rather than simply on the physical characteristics of the stimulus. Such “event-related” potentials (ERPs) or “endogenous” potentials are related in some manner to the cognitive aspects of distinguishing an infrequently occurring target stimulus from other stimuli occurring more frequently. For clinical purposes, attention has been directed particularly at the so-called P3 component of the ERP, which is also designated the P300 component because of its positive polarity and latency of approximately 300–400 ms after onset of an auditory target stimulus. The P3 component is prolonged in latency in many patients with dementia, whereas it is generally normal in patients with depression or other disorders simulating dementia. ERPs are, therefore, sometimes helpful in making this distinction when there is clinical uncertainty, although a response of normal latency does not exclude dementia.
MOTOR EVOKED POTENTIALS
The electrical potentials recorded from muscle or the spinal cord following stimulation of the motor cortex or central motor pathways are referred to as motor evoked potentials. For clinical purposes, such responses are recorded most often as the compound muscle action potentials elicited by transcutaneous magnetic stimulation of the motor cortex. A strong but brief magnetic field is produced by passing a current through a coil, and this induces stimulating currents in the subjacent neural tissue. The procedure is painless and apparently safe. Abnormalities have been described in several neurologic disorders with clinical or subclinical involvement of central motor pathways, including MS and motor neuron disease. In addition to a possible role in diagnosis or evaluating the extent of pathologic involvement, the technique provides information of prognostic relevance (e.g., in suggesting the likelihood of recovery of motor function after stroke) and provides a means of monitoring intraoperatively the functional integrity of central motor tracts. Nevertheless, it is not used widely for clinical purposes.
ELECTROPHYSIOLOGIC STUDIES OF MUSCLE AND NERVE
The motor unit is the basic element subserving motor function. It is defined as an anterior horn cell, its axon and neuromuscular junctions, and all the muscle fibers innervated by the axon. The number of motor units in a muscle ranges from approximately 10 in the extraocular muscles to several thousand in the large muscles of the legs. There is considerable variation in the average number of muscle fibers within the motor units of an individual muscle, i.e., in the innervation ratio of different muscles. Thus the innervation ratio is <25 in the human external rectus or platysma muscle and between 1600 and 1700 in the medial head of the gastrocnemius muscle. The muscle fibers of individual motor units are divided into two general types by distinctive contractile properties, histochemical stains, and characteristic responses to fatigue. Within each motor unit, all of the muscle fibers are of the same type.
ELECTROMYOGRAPHY
The pattern of electrical activity in muscle, i.e., the electromyogram (EMG), may be recorded both at rest and during activity from a needle electrode inserted into the muscle. The nature and pattern of abnormalities relate to disorders at different levels of the motor unit.
Relaxed muscle normally is electrically silent except in the end-plate region, but abnormal spontaneous activity (Fig. 442e-3) occurs in various neuromuscular disorders, especially those associated with denervation or inflammatory changes in affected muscle. Fibrillation potentials and positive sharp waves (which reflect muscle fiber irritability) and complex repetitive discharges are most often—but not always—found in denervated muscle and may also occur after muscle injury and in certain myopathic disorders, especially inflammatory disorders such as polymyositis. After an acute neuropathic lesion, they occur earlier in proximal than distal muscles and sometimes do not develop distally in the extremities for 4–6 weeks; once present, they may persist indefinitely unless reinnervation occurs or the muscle degenerates so completely that no viable tissue remains. Fasciculation potentials (which reflect the spontaneous activity of individual motor units) are characteristic of slowly progressive neuropathic disorders, especially those with degeneration of anterior horn cells (such as amyotrophic lateral sclerosis). Myotonic discharges—high-frequency discharges of potentials derived from single muscle fibers that wax and wane in amplitude and frequency—are the signature of myotonic disorders such as myotonic dystrophy or myotonia congenita but occur occasionally in polymyositis or other, rarer, disorders.
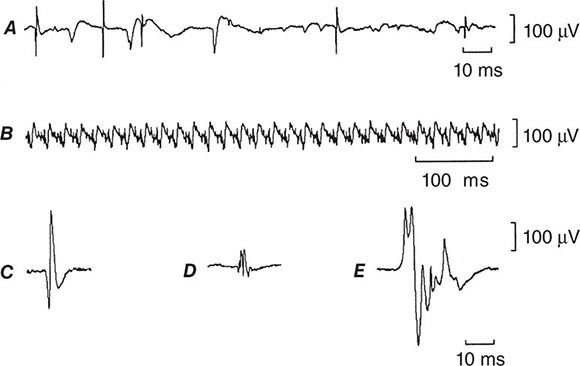
FIGURE 442e-3 Activity recorded during electromyography (EMG). A. Spontaneous fibrillation potentials and positive sharp waves. B. Complex repetitive discharges recorded in partially denervated muscle at rest. C. Normal triphasic motor unit action potential. D. Small, short-duration, polyphasic motor unit action potential such as is commonly encountered in myopathic disorders. E. Long-duration polyphasic motor unit action potential such as may be seen in chronic neuropathic disorders.
Slight voluntary contraction of a muscle leads to activation of a small number of motor units. The potentials generated by muscle fibers of these units that are within the pickup range of the needle electrode will be recorded (Fig. 442e-3). The parameters of normal motor unit action potentials depend on the muscle under study and age of the patient, but their duration is normally between 5 and 15 ms, amplitude is between 200 μV and 2 mV, and most are bi- or triphasic. The number of units activated depends on the degree of voluntary activity. An increase in muscle contraction is associated with an increase in the number of motor units that are activated (recruited) and in the frequency of discharge. With a full contraction, so many motor units are normally activated that individual motor unit action potentials can no longer be distinguished, and a complete interference pattern is said to have been produced.
The incidence of small, short-duration, polyphasic motor unit action potentials (i.e., having more than four phases) is usually increased in myopathic muscle, and an excessive number of units is activated for a specified degree of voluntary activity. By contrast, the loss of motor units that occurs in neuropathic disorders leads to a reduction in number of units activated during a maximal contraction and an increase in their firing rate, i.e., there is an incomplete or reduced interference pattern. The configuration and dimensions of the potentials may also be abnormal, depending on the duration of the neuropathic process. The surviving motor units are initially normal in configuration but, as reinnervation occurs, they increase in amplitude and duration and become polyphasic (Fig. 442e-3).
Action potentials from the same motor unit sometimes fire with a consistent temporal relationship to each other, so that double, triple, or multiple discharges are recorded, especially in tetany, hemifacial spasm, or myokymia.
Electrical silence characterizes the involuntary, sustained muscle contraction that occurs in phosphorylase deficiency, which is designated a contracture.
EMG enables disorders of the motor units to be detected and characterized as either neurogenic or myopathic. In neurogenic disorders, the pattern of affected muscles may localize the lesion to the anterior horn cells or to a specific site as the axons traverse a nerve root, limb plexus, and peripheral nerve to their terminal arborizations. The findings do not enable a specific etiologic diagnosis to be made, however, except in conjunction with the clinical findings and results of other laboratory studies.
The findings may provide a guide to the severity of an acute disorder of a peripheral or cranial nerve (by indicating whether denervation has occurred and the completeness of the lesion) and whether the pathologic process is active or progressive in chronic or degenerative disorders such as amyotrophic lateral sclerosis. Such information is important for prognostic purposes.
Various quantitative EMG approaches have been developed. The most common is to determine the mean duration and amplitude of 20 motor unit action potentials using a standardized technique. The technique of macro-EMG provides information about the number and size of muscle fibers in a larger volume of the motor unit territory and has also been used to estimate the number of motor units in a muscle. Scanning EMG is a computer-based technique that has been used to study the topography of motor unit action potentials and, in particular, the spatial and temporal distribution of activity in individual units. The technique of single-fiber EMG is discussed separately below.
NERVE CONDUCTION STUDIES
Recording of the electrical response of a muscle to stimulation of its motor nerve at two or more points along its course (Fig. 442e-4) permits conduction velocity to be determined in the fastest conducting motor fibers between the points of stimulation. The latency and amplitude of the electrical response of muscle (i.e., of the compound muscle action potential) to stimulation of its motor nerve at a distal site are also compared with values defined in normal subjects. Sensory nerve conduction studies are performed by determining the conduction velocity and amplitude of action potentials in sensory fibers when these fibers are stimulated at one point and the responses are recorded at another point along the course of the nerve. In adults, conduction velocity in the arms is normally between 50 and 70 m/s, and in the legs is between 40 and 60 m/s.
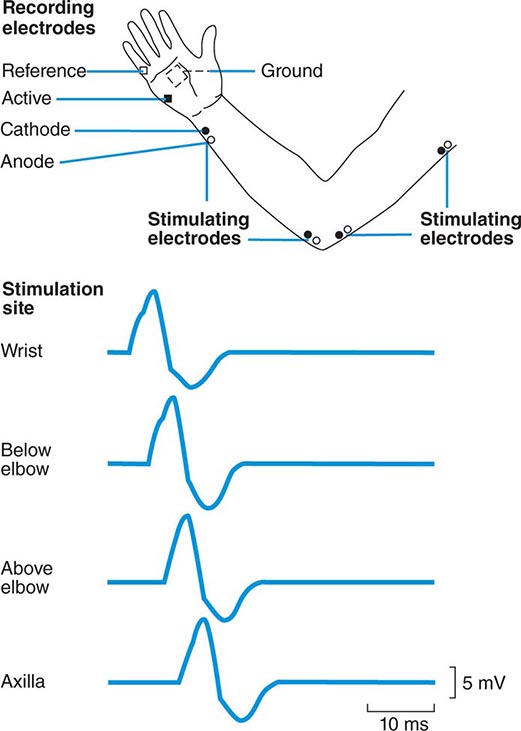
FIGURE 442e-4 Arrangement for motor conduction studies of the ulnar nerve. Responses are recorded with a surface electrode from the abductor digiti minimi muscle to supramaximal stimulation of the nerve at different sites, and are shown in the lower panel. (From MJ Aminoff: Electromyography in Clinical Practice: Electrodiagnostic Aspects of Neuromuscular Disease, 3rd ed. New York, Churchill Livingstone, 1998.)
Nerve conduction studies complement the EMG examination, enabling the presence and extent of peripheral nerve pathology to be determined. They are particularly helpful in determining whether sensory symptoms are arising from pathology proximal or distal to the dorsal root ganglia (in the former instance, peripheral sensory conduction studies is normal) and whether neuromuscular dysfunction relates to peripheral nerve disease. In patients with a mononeuropathy, they are invaluable as a means of localizing a focal nerve lesion, determining the extent and severity of the underlying pathology, providing a guide to prognosis, and detecting subclinical involvement of other nerves. They enable a polyneuropathy to be distinguished from a mononeuropathy multiplex, which has important etiologic implications. Nerve conduction studies provide a means of following the progression and therapeutic response of peripheral nerve disorders and are used widely for this purpose in clinical trials. They may suggest the underlying pathologic basis in individual cases. Conduction velocity is often markedly slowed, terminal motor latencies are prolonged, and compound motor and sensory nerve action potentials may be dispersed in the demyelinative neuropathies (such as in Guillain-Barré syndrome, chronic inflammatory polyneuropathy, metachromatic leukodystrophy, or certain hereditary neuropathies); conduction block is frequent in acquired varieties of these neuropathies. By contrast, conduction velocity is normal or slowed only mildly, sensory nerve action potentials are small or absent, and there is EMG evidence of denervation in axonal neuropathies such as occur in association with metabolic or toxic disorders.
The utility and complementary role of EMG and nerve conduction studies are best illustrated by reference to a common clinical problem. Numbness and paresthesias of the little finger and associated wasting of the intrinsic muscles of the hand may result from a spinal cord lesion, C8/T1 radiculopathy, brachial plexopathy (lower trunk or medial cord), or a lesion of the ulnar nerve. If sensory nerve action potentials can be recorded normally at the wrist following stimulation of the digital fibers in the affected finger, the pathology is probably proximal to the dorsal root ganglia (i.e., there is a radiculopathy or more central lesion); absence of the sensory potentials, by contrast, suggests distal pathology. EMG examination will indicate whether the pattern of affected muscles conforms to radicular or ulnar nerve territory or is more extensive (thereby favoring a plexopathy). Ulnar motor conduction studies will generally also distinguish between a radiculopathy (normal findings) and ulnar neuropathy (abnormal findings) and will often identify the site of an ulnar nerve lesion. The nerve is stimulated at several points along its course to determine whether the compound action potential recorded from a distal muscle that it supplies shows a marked alteration in size or area or a disproportionate change in latency, with stimulation at a particular site. The electrophysiologic findings thus permit a definitive diagnosis to be made and specific treatment instituted in circumstances where there is clinical ambiguity.
F-WAVE STUDIES
Stimulation of a motor nerve causes impulses to travel antidromically (i.e., toward the spinal cord) as well as orthodromically (to the nerve terminals). Such antidromic impulses cause a few of the anterior horn cells to discharge, producing a small motor response that occurs considerably later than the direct response elicited by nerve stimulation. The F wave so elicited is sometimes abnormal (absent or delayed) with proximal pathology of the peripheral nervous system, such as a radiculopathy, and may therefore be helpful in detecting abnormalities when conventional nerve conduction studies are normal. In general, however, the clinical utility of F-wave studies has been disappointing, except perhaps in Guillain-Barré syndrome, where they are often absent or delayed.
H-REFLEX STUDIES
The H reflex is easily recorded only from the soleus muscle (S1) in normal adults. It is elicited by low-intensity stimulation of the tibial nerve and represents a monosynaptic reflex in which spindle (Ia) afferent fibers constitute the afferent arc and alpha motor axons the efferent pathway. The H reflexes are often absent bilaterally in elderly patients or with polyneuropathies and may be lost unilaterally in S1 radiculopathies.
MUSCLE RESPONSE TO REPETITIVE NERVE STIMULATION
The size of the electrical response of a muscle to supramaximal electrical stimulation of its motor nerve relates to the number of muscle fibers that are activated. Neuromuscular transmission can be tested by several different protocols, but the most helpful is to record with surface electrodes the electrical response of a muscle to supramaximal stimulation of its motor nerve by repetitive (2–3 Hz) shocks delivered before and at selected intervals after a maximal voluntary contraction.
There is normally little or no change in size of the muscle response to repetitive stimulation of a motor nerve at 2–3 Hz with stimuli delivered at intervals after voluntary contraction of the muscle for about 20–30 s, even though preceding activity in the junctional region influences the release of acetylcholine and thus the size of the end-plate potentials elicited by a test stimulus. This is because more acetylcholine is normally released than is required to bring the motor end-plate potentials to the threshold for generating muscle fiber action potentials. In disorders of neuromuscular transmission this safety factor is reduced. Thus in myasthenia gravis, repetitive stimulation, particularly at a rate of between 2 and 5 Hz, may lead to a depression of neuromuscular transmission, with a decrement in size of the response recorded from affected muscles. Similarly, immediately after a period of maximal voluntary activity, single or repetitive stimuli of the motor nerve may elicit larger muscle responses than before, indicating that more muscle fibers are responding. This postactivation facilitation of neuromuscular transmission is followed by a longer-lasting period of depression, maximal between 2 and 4 min after the conditioning period and lasting for as long as 10 min or so, during which responses are reduced in size.
Decrementing responses to repetitive stimulation at 2–5 Hz are common in myasthenia gravis but may also occur in the congenital myasthenic syndromes (Chap. 461). In Lambert-Eaton myasthenic syndrome, in which there is defective release of acetylcholine at the neuromuscular junction, the compound muscle action potential elicited by a single stimulus is generally very small. With repetitive stimulation at rates of up to 10 Hz, the first few responses may decline in size, but subsequent responses increase. If faster rates of stimulation are used (20–50 Hz), the increment may be dramatic so that the amplitude of compound muscle action potentials eventually reaches a size that is several times larger than the initial response. In patients with botulism, the response to repetitive stimulation is similar to that in Lambert-Eaton myasthenic syndrome, although the findings are somewhat more variable and not all muscles are affected.
SINGLE-FIBER ELECTROMYOGRAPHY
This technique is particularly helpful in detecting disorders of neuromuscular transmission. A special needle electrode is placed within a muscle and positioned to record action potentials from two muscle fibers belonging to the same motor unit. The time interval between the two potentials will vary in consecutive discharges; this is called the neuromuscular jitter. The jitter can be quantified as the mean difference between consecutive interpotential intervals and is normally between 10 and 50 μs. This value is increased when neuromuscular transmission is disturbed for any reason, and in some instances impulses in individual muscle fibers may fail to occur because of impulse blocking at the neuromuscular junction. Single-fiber EMG is more sensitive than repetitive nerve stimulation or determination of acetylcholine receptor antibody levels in diagnosing myasthenia gravis.
Single-fiber EMG can also be used to determine the mean fiber density of motor units (i.e., mean number of muscle fibers per motor unit within the recording area) and to estimate the number of motor units in a muscle, but this is of less immediate clinical relevance.
BLINK REFLEXES
Electrical or mechanical stimulation of the supraorbital nerve on one side leads to two separate reflex responses of the orbicularis oculi—an ipsilateral R1 response having a latency of approximately 10 ms and a bilateral R2 response with a latency in the order of 30 ms. The trigeminal and facial nerves constitute the afferent and efferent arcs of the reflex, respectively. Abnormalities of either nerve or intrinsic lesions of the medulla or pons may lead to uni- or bilateral loss of the response, and the findings may therefore be helpful in identifying or localizing such pathology.
443e |
Technique of Lumbar Puncture |
In experienced hands, lumbar puncture (LP) is usually a safe procedure. Major complications are extremely uncommon but can include cerebral herniation, injury to the spinal cord or nerve roots, hemorrhage (spinal hematoma), or infection. Minor complications occur with greater frequency and can include backache, post-LP headache, and radicular pain or numbness.
IMAGING AND LABORATORY STUDIES PRIOR TO LP
Patients with an altered level of consciousness, a focal neurologic deficit, new-onset seizure, papilledema, or an immunocompromised state are at increased risk for potentially fatal cerebellar or tentorial herniation following LP. Neuroimaging should be obtained in these patients prior to LP to exclude a focal mass lesion or diffuse swelling. Imaging studies should include the spine in patients with symptoms suggesting spinal cord compression, such as back pain, leg weakness, urinary retention, or incontinence. In patients with suspected meningitis who require neuroimaging prior to diagnostic LP, administration of antibiotics, preferably following blood culture, should precede the neuroimaging study.
LP should not be performed through infected skin, as organisms can be introduced into the subarachnoid space (SAS).
Patients with coagulation defects including thrombocytopenia are at increased risk of post-LP spinal subdural or epidural hematomas, either of which can produce permanent nerve injury and/or paralysis. If a bleeding disorder is suspected, the platelet count, international normalized ratio (INR), and partial thromboplastin time should be checked prior to LP. There are no data available to assess the safety of LP in patients with low platelet counts; a count of <20,000/μL is considered to be a contraindication to LP. Bleeding complications rarely occur in patients with platelet counts ≥50,000/μL and an INR ≤1.5. Some institutions recommend that the platelet count be >40,000 prior to LP.
GUIDELINES FOR PATIENTS RECEIVING ANTICOAGULANT OR ANTIPLATELT MEDICATIONS
There is an increased risk of bleeding complications if an LP is performed in a patient receiving antiplatelet or anticoagulant medications. The risk is further increased when multiple anticoagulant medications are used or when the level of anticoagulation is high. The most common site of bleeding is the epidural space. Symptoms of bleeding following an LP can include a sensory or motor deficit and/or bowel/bladder dysfunction; back pain occurs less commonly. For serious deficits such as paraparesis, immediate surgical intervention, ideally within 8 h of onset of weakness, is important to minimize permanent disability; surgical intervention after 24 h is associated with a poor outcome.
Only limited data are available to guide decisions about performing LPs in patients receiving anticoagulant drugs. Information about managing antiplatelet and anticoagulation drugs during invasive surgical procedures is often available from the prescribing information provided by the drug manufacturer. Evidence-based guidelines for management of regional anesthetic procedures including spinal and epidural blocks in patients receiving anticoagulation have been developed by the American Society of Regional Anesthesia and Pain (ASRA); these guidelines can help guide decisions by physicians considering LP in patients receiving anticoagulation. Management of these patients can be complex and needs to consider both the risk of LP-related hemorrhage as well as the risk of reversing therapeutic anticoagulation prior to LP. Guidelines for some commonly used anticoagulants are summarized below.
Unfractionated Heparin, Therapeutic Dosing The ASRA 2010 Practice Advisory recommends discontinuing unfractionated heparin (UFH) 2–4 h prior to removal of spinal or epidural catheters to minimize risk of hematoma. Similar guidelines are reasonable for patients undergoing LP: discontinue UFH 2–4 h prior to LP; document normal partial thromboplastin time (PTT) prior to the procedure; and document a normal platelet count in patients who have received heparin for 4 days or longer because of the risk of heparin-induced thrombocytopenia (HIT). The half-life of heparin is 60–90 min.
Unfractionated Heparin, Prophylactic Dosing There are only a few case reports of spinal hematoma resulting from spinal or epidural anesthetic procedures in patients receiving low-dose subcutaneous UFH; ASRA guidelines state that there is no contraindication to the use of these techniques for anesthesia in patients receiving prophylactic UFH at a dose of 5000 U subcutaneously twice daily. Similarly, LP in patients receiving 5000 U of UFH subcutaneously twice daily is unlikely to cause spinal hematoma. Precautions to minimize risk include the following: document a normal PTT prior to the LP; document a normal platelet count in patients who have received heparin for 4 days or longer; and perform the LP 1–2 h prior to the next heparin dose, when the heparin effect should be minimal.
Low-Molecular-Weight Heparin, Therapeutic Dose (e.g., Enoxaparin 1 mg/kg Subcutaneously q12h) Patients receiving low-molecular-weight heparin (LMWH) are at increased risk of post-LP spinal or epidural hematoma. LMWH dose should be held for at least 24 h before the procedure.
Low-Molecular-Weight Heparin, Prophylactic Dose (e.g., Enoxaparin 0.5 mg/kg Subcutaneously q12h) Patients receiving prophylactic-dose LMWH have altered coagulation. ASRA guidelines recommend waiting at least 10–12 h after a prophylactic dose of LMWH before inserting a spinal or epidural catheter to minimize the risk of spinal or epidural hematoma. Similar guidelines are reasonable for patients undergoing LP.
Warfarin Spinal puncture is contraindicated during warfarin therapy.
Aspirin and Nonsteroidal Anti-inflammatory Drugs (NSAIDs) ASRA guidelines conclude that use of these drugs does not appear to be associated with an added significant risk of spinal bleeding in patients having spinal or epidural anesthesia. Similarly, LP in patients receiving one of these drugs is unlikely to cause bleeding. Reversal of drug effect on platelet function requires stopping the drug for approximately 10 days for aspirin and for 48 h for NSAIDs.
Ticlopidine/Clopidogrel The actual risk of spinal hematoma with these drugs is unknown. Based on drug prescribing information and surgical reviews, ASRA guidelines suggest discontinuing ticlopidine 14 days prior to a spinal or epidural procedure and discontinuing clopidogrel 7 days prior to the procedure. Similar guidelines are reasonable for performing LP.
Abciximab, Eptifibatide, and Other Platelet Glycoprotein IIb/IIIa Inhibitors The actual risk of spinal hematoma with these drugs is unknown. Platelet aggregation remains abnormal for 24–48 h following discontinuation of abciximab and 4–8 h following discontinuation of eptifibatide. ASRA guidelines recommend avoiding spinal or epidural procedures until platelet function is normal. Similar guidelines are reasonable for performing LP.
Direct Thrombin Inhibitors (e.g., Argatroban, Bivalirudin) ASRA guidelines recommend against performing spinal or epidural anesthesia in patients receiving thrombin inhibitors.
Oral Factor Xa Inhibitor (e.g., Rivaroxaban) Rivaroxaban prescribing information includes a black box warning that epidural or spinal hematomas have occurred in patients treated with rivaroxaban who are receiving spinal or epidural anesthesia or undergoing LP. LP should be avoided in patients receiving this drug.
ANALGESIA
Anxiety and pain can be minimized prior to beginning the procedure. Anxiety can be allayed by the use of lorazepam, 1–2 mg given PO 30 min prior to the procedure or IV 5 min prior to the procedure. Topical anesthesia can be achieved by the application of a lidocaine-based cream. Lidocaine 4% is effective when applied 30 min prior to the procedure; lidocaine/prilocaine requires 60–120 min. The cream should be applied in a thick layer so that it completely covers the skin; an occlusive dressing is used to keep the cream in place.
POSITIONING
Proper positioning of the patient is essential. The procedure should be performed on a firm surface; if the procedure is to be performed at the bedside, the patient should be positioned at the edge of the bed and not in the middle. The patient is asked to lie on his or her side, facing away from the examiner, and to “roll up into a ball.” The neck is gently ante-flexed and the thighs pulled up toward the abdomen; the shoulders and pelvis should be vertically aligned without forward or backward tilt (Fig. 443e-1). The spinal cord terminates at approximately the L1 vertebral level in 94% of individuals. In the remaining 6%, the conus extends to the L2–L3 interspace. LP is therefore performed at or below the L3–L4 interspace. A useful anatomic guide is a line drawn between the posterior superior iliac crests, which corresponds closely to the level of the L3–L4 interspace. The interspace is chosen following gentle palpation to identify the spinous processes at each lumbar level.
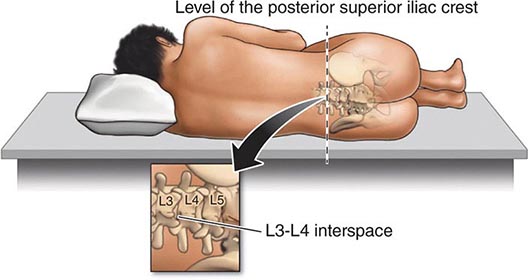
FIGURE 443e-1 Proper positioning of a patient in the lateral decubitus position. Note that the shoulders and hips are in a vertical plane; the torso is perpendicular to the bed. (From RP Simon et al [eds]: Clinical Neurology, 7th ed. New York, McGraw-Hill, 2009.)
An alternative to the lateral recumbent position is the seated position. The patient sits at the side of the bed, with feet supported on a chair. The patient is instructed to curl forward, trying to touch the nose to the umbilicus. It is important that the patient not simply lean forward onto a bedside tabletop, as this is not an optimal position for opening up the spinous processes. LP is sometimes more easily performed in obese patients if they are sitting. A disadvantage of the seated position is that measurement of opening pressure is not accurate. In situations in which LP is difficult using palpable spinal landmarks, bedside ultrasound to guide needle placement may be used. In some particularly difficult situations, a computed tomography (CT)-guided needle placement may be necessary.
TECHNIQUE
Once the desired site for needle insertion has been identified, the examiner should put on sterile gloves. A mask is worn if the clinician will be injecting material into the spinal or epidural space to prevent droplet spread of oral flora during the procedure. After cleansing the skin with povidone-iodine or similar disinfectant, the area is draped with a sterile cloth; the needle insertion site is blotted dry using a sterile gauze pad. Proper local disinfection reduces the risk of introducing skin bacteria into the SAS or other sites. Local anesthetic, typically 1% lidocaine, 3–5 mL total, is injected into the subcutaneous tissue; in nonemergency situations, a topical anesthetic cream can be applied (see above). When time permits, pain associated with the injection of lidocaine can be minimized by slow, serial injections, each one progressively deeper than the last, over a period of ~5 min. Approximately 0.5–1 mL of lidocaine is injected at a time; the needle is not usually withdrawn between injections. A pause of ~15 s between injections helps to minimize the pain of the subsequent injection. The goal is to inject each mini-bolus of anesthetic into an area of skin that has become numb from the preceding injection. Approximately 5–10 mini-boluses are injected, using a total of ~5 mL of lidocaine.
If possible, the LP should be delayed for 10–15 min following the completion of the injection of anesthetic; this significantly decreases and can even eliminate pain from the procedure. Even a delay of 5 min will help to reduce pain.
The LP needle (typically 20- to 22-gauge) is inserted in the midline, midway between two spinous processes, and slowly advanced. The bevel of the needle should be maintained in a horizontal position, parallel to the direction of the dural fibers and with the flat portion of the bevel pointed upward; this minimizes injury to the fibers as the dura is penetrated. When LP is performed in patients who are sitting, the bevel should be maintained in the vertical position. In most adults, the needle is advanced 4–5 cm (1–2 in.) before the SAS is reached; the examiner usually recognizes entry as a sudden release of resistance, a “pop.” If no fluid appears despite apparently correct needle placement, then the needle may be rotated 90°–180°. If there is still no fluid, the stylet is reinserted and the needle is advanced slightly. Some examiners halt needle advancement periodically to remove the stylet and check for flow of cerebrospinal fluid (CSF). If the needle cannot be advanced because it hits bone, if the patient experiences sharp radiating pain down one leg, or if no fluid appears (“dry tap”), the needle is partially withdrawn and reinserted at a different angle. If on the second attempt the needle still hits bone (indicating lack of success in introducing it between the spinous processes), then the needle should be completely withdrawn and the patient should be repositioned. The second attempt is sometimes more successful if the patient straightens the spine completely prior to repositioning. The needle can then be reinserted at the same level or at an adjacent one.
Once the SAS is reached, a manometer is attached to the needle and the opening pressure measured. The examiner should look for normal oscillations in CSF pressure associated with pulse and respirations. The upper limit of normal opening pressure with the patient supine is 180 mmH2O in adults but may be as high as 200–250 mmH2O in obese adults.
CSF is allowed to drip into collection tubes; it should not be withdrawn with a syringe. Depending on the clinical indication, fluid is obtained for studies including: (1) cell count with differential; (2) protein and glucose concentrations; (3) culture (bacterial, fungal, mycobacterial, viral); (4) smears (e.g., Gram’s and acid-fast stained smears); (5) antigen tests (e.g., latex agglutination); (6) polymerase chain reaction (PCR) amplification of DNA or RNA of microorganisms (e.g., herpes simplex virus, enteroviruses); (7) antibody levels against microorganisms; (8) immunoelectrophoresis for determination of γ-globulin level and oligoclonal banding; and (9) cytology. Although 15 mL of CSF is sufficient to obtain all of the listed studies, the yield of fungal and mycobacterial cultures and cytology increases when larger volumes are sampled. In general 20–30 mL may be safely removed from adults.
A bloody tap due to penetration of a meningeal vessel (a “traumatic tap”) may result in confusion with subarachnoid hemorrhage (SAH). In these situations a specimen of CSF should be centrifuged immediately after it is obtained; clear supernatant following CSF centrifugation supports the diagnosis of a bloody tap, whereas xanthochromic supernatant suggests SAH. In general, bloody CSF due to the penetration of a meningeal vessel clears gradually in successive tubes, whereas blood due to SAH does not. In addition to SAH, xanthochromic CSF may also be present in patients with liver disease and when the CSF protein concentration is markedly elevated (>1.5–2 g/L [150–200 mg/dL]).
Prior to removing the LP needle, the stylet is reinserted to avoid the possibility of entrapment of a nerve root in the dura as the needle is being withdrawn; entrapment could result in a dural CSF leak, causing headache. Some practitioners question the safety of this maneuver, with its potential risk of causing a needle-stick injury to the examiner. Injury is unlikely, however, given the flexibility of the small-diameter stylet, which tends to bend, rather than penetrate, on contact. Following LP, the patient is customarily positioned in a comfortable, recumbent position for 30–60 min before rising, although this may be unnecessary because it does not appear to affect the development of headache (see below).
POST-LP HEADACHE
The principal complication of LP is headache, occurring in 10–30% of patients. Younger age and female gender are associated with an increased risk of post-LP headache. Headache usually begins within 48 h but may be delayed for up to 12 days. Head pain is dramatically positional; it begins when the patient sits or stands upright; there is relief upon reclining or with abdominal compression. The longer the patient is upright, the longer the latency before head pain subsides. The pain is usually a dull ache but may be throbbing; its location is occipitofrontal. Nausea and stiff neck often accompany headache, and occasionally, patients report blurred vision, photophobia, tinnitus, and vertigo. In more than three-quarters of patients, symptoms completely resolve within a week, but in a minority they can persist for weeks or even months.
Post-LP headache is caused by a drop in CSF pressure related to persistent leakage of CSF at the site where the needle entered the SAS. Loss of CSF volume decreases the brain’s supportive cushion, so that when a patient is upright there is probably dilation and tension placed on the brain’s anchoring structures, the pain-sensitive dural sinuses, resulting in pain. Although intracranial hypotension is the usual explanation for severe LP headache, the syndrome can occur in patients with normal CSF pressure.
Because post-LP headache usually resolves without specific treatment, care is largely supportive with oral analgesics (acetaminophen, NSAIDs, opioids [Chap. 18]) and antiemetics. Patients may obtain relief by lying in a comfortable (especially a recumbent or head-down Trendelenburg) position. For some patients, beverages with caffeine can provide temporary pain relief.
For patients with persistent pain, treatment with IV caffeine (500 mg in 500 mL saline administered over 2 h) may be effective; atrial fibrillation is a rare side effect. Alternatively, an epidural blood patch accomplished by injection of 15 mL of autologous whole blood is usually effective; the injection is directed at the epidural space at the level of the initial LP. This procedure is most often performed by a pain specialist or anesthesiologist. The blood patch has an immediate effect, making it unlikely that sealing off a dural hole with blood clot is its sole mechanism of action. The acute benefit may be due to compression of the CSF space by the clot, increasing CSF pressure. Some clinicians reserve epidural blood patch for patients who do not respond to caffeine, while others prefer to use blood patch as initial management for unremitting post-LP symptoms.
Strategies to decrease the incidence of post-LP headache are listed in Table 443e-1. Use of a smaller caliber needle is associated with a lower risk: in one study, the risk of headache following use of a 24- to 27-gauge standard (Quincke) needle was 5–12%, compared to 20–40% when a 20- or 22-gauge needle was used. The smallest gauge needles usually require the use of an introducer needle and are associated with a slower CSF flow rate. Use of an “atraumatic” (Sprotte, “pencil point,” or “noncutting”) needle also reduces the incidence of moderate to severe headache compared with standard LP (Quincke, or “traumatic”) needles (Fig. 443e-2). However, because atraumatic needles are more difficult to use, more attempts may be required to perform the LP, particularly in overweight patients. It may also be necessary to use an introducer with the atraumatic needle, which does not have the customary cutting, beveled tip. There is a low risk of needle damage, e.g., breakage, with the Sprotte atraumatic needle. Another strategy to decrease the incidence of headache is to replace the stylet before removing the LP needle.
|
REDUCING THE INCIDENCE OF POST-LP HEADACHE |
Abbreviation: LP, lumbar puncture.
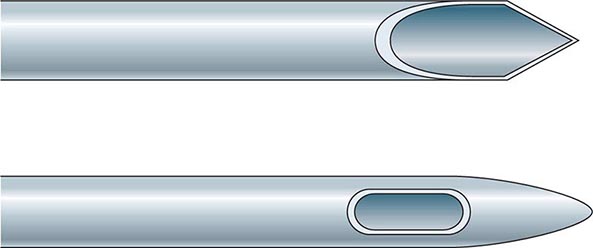
FIGURE 443e-2 Comparison of the standard (“cutting” or Quincke) lumbar puncture (LP) needle with the “atraumatic” (Sprotte). The “atraumatic” needle has its opening on the top surface of the needle, a design intended to reduce the chance of cutting dural fibers that, by protruding through the dura, could be responsible for subsequent cerebrospinal fluid leak and post-LP headache. (From SR Thomas et al: BMJ 321:986, 2000.)
Patients are often advised to remain in a recumbent position for up to an hour following LP. However, studies comparing mobilization immediately following LP with bed rest for periods up to 4 h show no significant differences in the incidence of headache, suggesting that the customary practice of remaining in a recumbent position post-LP may be unnecessary.
NORMAL VALUES
(See Table 443e-2) In uninfected CSF, the normal white blood cell count is fewer than five mononuclear cells (lymphocytes and monocytes) per μL. Polymorphonuclear leukocytes (PMNs) are not found in normal unconcentrated CSF; however, rare PMNs can be found in centrifuged or concentrated CSF specimens such as those used for cytologic examination. Red blood cells (RBCs) are not normally present in CSF; if RBCs are present from a traumatic tap, their number decreases as additional CSF is collected. CSF glucose concentrations <2.2 mmol/L (<40 mg/dL) are abnormal.
|
CEREBROSPINAL FLUID (CSF)a |
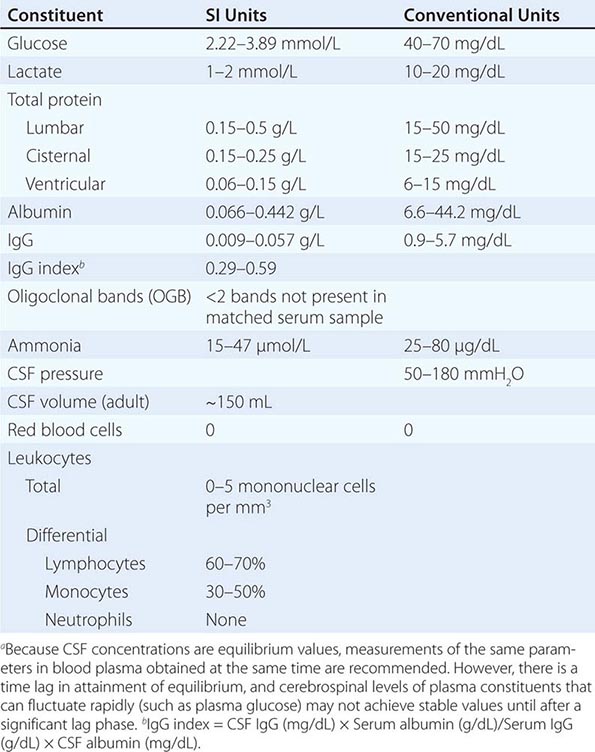
444e |
Biology of Neurologic Diseases |
The human nervous system is the organ of consciousness, cognition, ethics, and behavior; as such, it is the most intricate structure known to exist. More than one-third of the 23,000 genes encoded in the human genome are expressed in the nervous system. Each mature brain is composed of 100 billion neurons, several million miles of axons and dendrites, and >1015 synapses. Neurons exist within a dense parenchyma of multifunctional glial cells that synthesize myelin, preserve homeostasis, and regulate immune responses. Measured against this background of complexity, the achievements of molecular neuroscience have been extraordinary. This chapter reviews selected themes in neuroscience that provide a context for understanding fundamental mechanisms underlying neurologic disorders.
NEUROGENETICS
The landscape of neurology has been transformed by modern molecular genetics. Several hundred neurologic and psychiatric disorders can now be diagnosed through genetic testing (http://www.ncbi.nlm.nih.gov/sites/GeneTests/?db=GeneTests). The vast majority of these represent highly penetrant mutations that cause rare neurologic disorders; alternatively, they represent rare monogenic causes of common phenotypes. Examples of the latter include mutations of the amyloid precursor protein in familial Alzheimer’s disease, the microtubule-associated protein tau (MAPT) in frontotemporal dementia, and α-synuclein in Parkinson’s disease. These discoveries have been profoundly important because the mutated gene in the familial disorder often encodes a protein that is also pathogenetically involved (although not mutated) in the typical, sporadic form. The common mechanism involves disordered processing and, ultimately, aggregation of the protein leading to cell death (see “Protein Aggregation and Neurodegeneration,” below).
There is optimism that complex genetic disorders, caused by combinations of both genetic and environmental factors, have now become tractable problems. Genome-wide association studies (GWAS) have been carried out in many complex neurologic disorders, with many hundreds of variants identified, nearly all of which confer only a small increment in disease risk (1.15- to 1.5-fold). GWAS studies are rooted in the “common disease, common variant” hypothesis, as they examine potential risk alleles that are relatively frequent (e.g. >5%) in the general population. More than 1500 GWAS studies have been carried out, with notable successes such as the identification of 110 risk alleles for multiple sclerosis (Chap. 458). Furthermore, using bioinformatics tools, risk variants can be aligned in functional biologic pathways to identify novel pathogenic mechanisms as well as to reveal heterogeneity (e.g., different pathways in different individuals). Despite these successes, many experienced geneticists question the real value of common disease-associated variants, particularly whether they are actually causative or merely mark the approximate locations of more important—truly causative—rare mutations.
This debate has set the stage for the next revolution in human genetics, made possible by the development of increasingly efficient and cost-effective high-throughput sequencing methodologies. It is already possible to sequence an entire human genome in approximately an hour, at a cost of only $1300 for the entire coding sequence (“whole-exome”) or $3000 for the entire genome; it is certain that these costs will continue to decline. This makes it feasible to look for disease-causing sequence variations in individual patients with the possibility of identifying rare variants that cause disease. The utility of this approach was demonstrated by whole-genome sequencing in a patient with Charcot-Marie-Tooth neuropathy, in which compound heterozygous mutations were identified in the SH3TC2 gene, which then were shown to co-segregate with the disease in other members of the family.
It is increasingly recognized that not all genetic diseases or predispositions are caused by simple changes in the linear nucleotide sequence of genes. Disease-causative mutations also occur commonly in noncoding sequences of DNA. For example, large intronic GGGGCC repeat expansions in a gene of unknown function C9orf 72 (chromosome 9 open reading frame 72) were recently identified as a common cause of both frontotemporal dementia and amyotrophic lateral sclerosis (ALS). This mutation is the most common cause of both familial and sporadic ALS identified thus far. It was shown to be associated with TDP-43 (tar DNA binding protein-43) inclusions in both hippocampal and cerebral neurons. Interestingly, despite the absence of a start codon, the three alternate dipeptide sequences consisting of two amino acids are translated and found in postmortem brain tissue of affected patients. Three potential pathogenic mechanisms have been proposed, including (1) haploinsufficiency, (2) repeat RNA-mediated toxicity, and (3) dipeptide protein toxicity. The possibility of RNA toxicity is supported by the finding of intranuclear RNA foci containing C9orf72 hexanucleotide repeats and specific RNA-binding proteins. The C9orf72 mRNA forms quadruplexes of DNA and RNA, which then can halt transcription and also bind transcription factors. Mutations in both TARDP (transactive region DNA binding protein) and FUS (fused in sarcoma) also encode DNA/RNA-processing polypeptides and are a cause of familial and sporadic ALS.
As the complex architecture of the human genome becomes better defined, many disorders that result from alterations in copy numbers of genes (“gene-dosage” effects) resulting from unequal crossing-over are also likely to be identified. As much as 5–10% of the human genome consists of nonhomologous duplications and deletions, and these appear to occur with a much higher mutational rate than is the case for single base pair mutations. The first copy-number disorders to be recognized were Charcot-Marie-Tooth disease type 1A (CMT1A), caused by a duplication in the gene encoding the myelin protein PMP22, and the reciprocal deletion of the gene causing hereditary liability to pressure palsies (Chap. 459). Gene-dosage effects are causative in some cases of Parkinson’s disease (α-synuclein), Alzheimer’s disease (amyloid precursor protein), spinal muscular atrophy (survival motor neuron 2), the dysmyelinating disorder Pelizaeus-Merzbacher syndrome (proteolipid protein 1), late-onset leukodystrophy (lamin B1), and a variety of developmental neurologic disorders. It is likely that copy-number variations contribute substantially to normal human genomic variation for numerous genes involved in neurologic function, regulation of cell growth, and regulation of metabolism. It is also already clear that gene-dosage effects will influence many behavioral phenotypes, learning disorders, and autism spectrum disorders. Deletions at ch444eq and ch15q have been associated with schizophrenia, and deletions at 15q and 16p with autism. Interestingly, the 16p deletion is also associated with epilepsy. Duplications of the X-linked MeCP2 gene cause autism in males and psychiatric disorders with anxiety in females, whereas point mutations in this gene produce the neurodevelopmental disorder Rett’s syndrome. The understanding of the role of copy number variation in human disease is still in its infancy.
The role of splicing variation as a contributor to neurologic disease is another area of active investigation. Alternative splicing refers to the inclusion of different combinations of exons in mature mRNA, resulting in the potential for many different protein products encoded by a single gene. Alternative splicing represents a powerful mechanism for generation of complexity and variation, and this mechanism appears to be highly prevalent in the nervous system, affecting key processes such as neurotransmitter receptors and ion channels. Numerous diseases are already known to result from abnormalities in alternative splicing. Increased inclusion of exon 10–containing transcripts of MAPT can cause frontotemporal dementia. Aberrant splicing also contributes to the pathogenesis of Duchenne’s, myotonic, and facioscapulohumeral muscular dystrophies; ataxia telangiectasia; neurofibromatosis; some inherited ataxias; and fragile × syndrome, among other disorders. It is also likely that subtle variations of splicing will influence many genetically complex disorders. A splicing variant of the interleukin 7 receptor α chain, resulting in production of more soluble and less membrane-bound receptor, is associated with susceptibility to multiple sclerosis (MS) in multiple different populations.
Epigenetics refers to the mechanisms by which levels of gene expression can be exquisitely modulated, not by variations in the primary genetic sequence of DNA but rather by postgenomic alterations in DNA and chromatin structure, which influence how, when, and where genes are expressed. DNA methylation and methylation and acetylation of histone proteins that interact with nuclear DNA to form chromatin are key mediators of these events. Epigenetic processes appear to be dynamically active even in postmitotic neurons. Imprinting refers to an epigenetic feature, present for a subset of genes, in which the predominant expression of one allele is determined by its parent of origin. The distinctive neurodevelopmental disorders Prader-Willi syndrome (mild mental retardation and endocrine abnormalities) and Angelman’s syndrome (cortical atrophy, cerebellar dysmyelination, Purkinje cell loss) are classic examples of imprinting disorders whose distinctive features are determined by whether the paternal or maternal copy of the chromosome of the critical genetic region 15q11-13 is responsible. In a study of discordant monozygotic twins for MS in which the entire DNA sequence, transcriptome (e.g., mRNA levels), and methylome were assessed genome-wide, tantalizing allelic differences in the use of the paternal, compared to maternal, copy for a group of genes were identified. Preferential allelic expression, whether due to imprinting, resistance to X-inactivation, or other mechanisms, is likely to play a major role in determining complex behaviors and susceptibility to many neurologic and psychiatric disorders.
Another advance is the development of transgenic mouse models of neurologic diseases, which has been particularly fruitful in producing models relevant to Alzheimer’s disease, Parkinson’s disease, Huntington’s disease, and ALS. These models are useful in both studying disease pathogenesis and developing and testing new therapies. New transgenic mouse models with conditional expression have fostered investigations in which late gene expression avoids developmental compensation or in which the reversibility of a disease phenotype can be examined by turning a gene off after the disease phenotype has manifested. One can also examine the effects of gene expression in specific subsets of neurons, such as entorhinal cortex, or selectively in neurons, astrocytes, or microglia. Models in both Caenorhabditis elegans and Drosophila have also been extremely useful, particularly in studying genetic modifiers and therapeutic interventions.
ION CHANNELS AND CHANNELOPATHIES
The resting potential of neurons and the action potentials responsible for impulse conduction are generated by ion currents and ion channels. Most ion channels are gated, meaning that they can transition between conformations that are open or closed to ion conductance. Individual ion channels are distinguished by the specific ions they conduct; by their kinetics; and by whether they directly sense voltage, are linked to receptors for neurotransmitters or other ligands such as neurotrophins, or are activated by second messengers. The diverse characteristics of different ion channels provide a means by which neuronal excitability can be exquisitely modulated at both the cellular and the subcellular levels. Disorders of ion channels—channelopathies—are responsible for a growing list of human neurologic diseases (Table 444e-1). Most are caused by mutations in ion channel genes or by autoantibodies against ion channel proteins. One example is epilepsy, a syndrome of diverse causes characterized by repetitive, synchronous firing of neuronal action potentials. Action potentials are normally generated by the opening of sodium channels and the inward movement of sodium ions down the intracellular concentration gradient. Depolarization of the neuronal membrane opens potassium channels, resulting in outward movement of potassium ions, repolarization, closure of the sodium channel, and hyperpolarization. Sodium or potassium channel subunit genes have long been considered candidate disease genes in inherited epilepsy syndromes, and recently such mutations have been identified. These mutations appear to alter the normal gating function of these channels, increasing the inherent excitability of neuronal membranes in regions where the abnormal channels are expressed.
|
EXAMPLES OF NEUROLOGIC CHANNELOPATHIES |
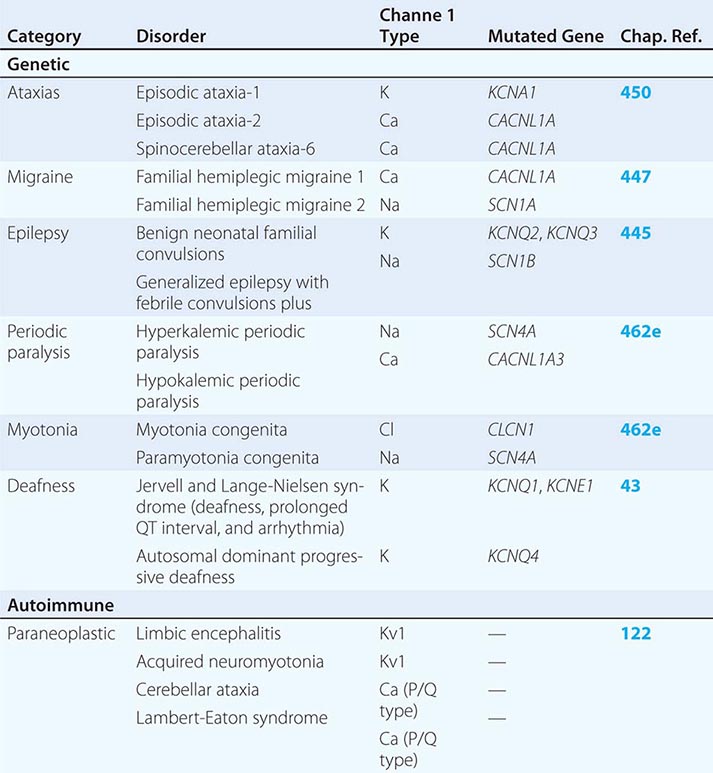
Whereas the specific clinical manifestations of channelopathies are quite variable, one common feature is that manifestations tend to be intermittent or paroxysmal, such as occurs in epilepsy, migraine, ataxia, myotonia, or periodic paralysis. Exceptions are clinically progressive channel disorders such as autosomal dominant hearing impairment. The genetic channelopathies identified to date are all uncommon disorders caused by obvious mutations in channel genes. As the full repertoire of human ion channels and related proteins is identified, it is likely that additional channelopathies will be discovered. In addition to rare disorders that result from obvious mutations, it is also likely that less penetrant allelic variations in channel genes or in their pattern of expression might underlie susceptibility to some apparently sporadic forms of epilepsy, migraine, or other disorders. For example, mutations in the potassium channel gene Kir2.6 have been found in many individuals with thyrotoxic hypokalemic periodic paralysis, a disorder similar to hypokalemic periodic paralysis but precipitated by stress from thyrotoxicosis or carbohydrate loading.
NEUROTRANSMITTERS AND NEUROTRANSMITTER RECEPTORS
Synaptic neurotransmission is the predominant means by which neurons communicate with each other. Classic neurotransmitters are synthesized in the presynaptic region of the nerve terminal; stored in vesicles; and released into the synaptic cleft, where they bind to receptors on the postsynaptic cell. Secreted neurotransmitters are eliminated by reuptake into the presynaptic neuron (or glia), by diffusion away from the synaptic cleft, and/or by specific inactivation. In addition to the classic neurotransmitters, many neuropeptides have been identified as definite or probable neurotransmitters; these include substance P, neurotensin, enkephalins, β-endorphin, histamine, vasoactive intestinal polypeptide, cholecystokinin, neuropeptide Y, and somatostatin. Peptide neurotransmitters are synthesized in the cell body rather than the nerve terminal and may colocalize with classic neurotransmitters in single neurons. A number of neuropeptides are important in pain modulation including substance P and calcitonin gene-related peptide (CGRP), which causes migraine-like headaches in patients. As a consequence, CGRP receptor antagonists have been developed and shown to be effective in treating migraine headaches. Nitric oxide and carbon monoxide are gases that appear also to function as neurotransmitters, in part by signaling in a retrograde fashion from the postsynaptic to the presynaptic cell.
Neurotransmitters modulate the function of postsynaptic cells by binding to specific neurotransmitter receptors, of which there are two major types. Ionotropic receptors are direct ion channels that open after engagement by the neurotransmitter. Metabotropic receptors interact with G proteins, stimulating production of second messengers and activating protein kinases, which modulate a variety of cellular events. Ionotropic receptors are multiple subunit structures, whereas metabotropic receptors are composed of single subunits only. One important difference between ionotropic and metabotropic receptors is that the kinetics of ionotropic receptor effects are fast (generally <1 ms) because neurotransmitter binding directly alters the electrical properties of the postsynaptic cell, whereas metabotropic receptors function over longer time periods. These different properties contribute to the potential for selective and finely modulated signaling by neurotransmitters.
Neurotransmitter systems are perturbed in a large number of clinical disorders, several of which are highlighted in Table 444e-2. One example is the involvement of dopaminergic neurons originating in the substantia nigra of the midbrain and projecting to the striatum (nigrostriatal pathway) in Parkinson’s disease and in heroin addicts after the ingestion of the toxin MPTP (1-methyl-4-phenyl-1,2,5,6-tetrahydropyridine).
|
PRINCIPAL CLASSIC NEUROTRANSMITTERS |
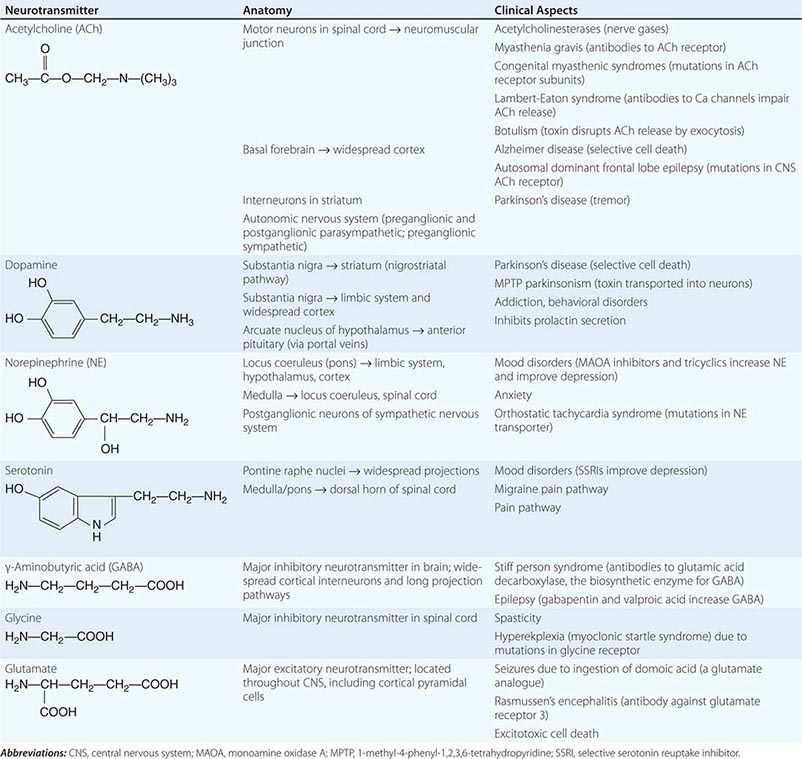
A second important dopaminergic system arising in the midbrain is the mediocorticolimbic pathway, which is implicated in the pathogenesis of addictive behaviors including drug reward. Its key components include the midbrain ventral tegmental area (VTA), median forebrain bundle, and nucleus accumbens (see Fig. 465e-2). The cholinergic pathway originating in the nucleus basalis of Meynert plays a role in memory function in Alzheimer’s disease.
Addictive drugs share the property of increasing dopamine release in the nucleus accumbens(Chap. 465e). Amphetamine increases intracellular release of dopamine from vesicles and reverses transport of dopamine through the dopamine transporters. Patients prone to addiction show increased activation of the nucleus accumbens following administration of amphetamine. Cocaine binds to dopamine transporters and inhibits dopamine reuptake. Ethanol inhibits inhibitory neurons in the VTA, leading to increased dopamine release in the nucleus accumbens. Opioids also disinhibit these dopaminergic neurons by binding to μ receptors expressed by γ-aminobutyric acid (GABA)–containing interneurons in the VTA. Nicotine increases dopamine release by activating nicotinic acetylcholine receptors on cell bodies and nerve terminals of dopaminergic VTA neurons. Tetrahydrocannabinol, the active ingredient of cannabis, also increases dopamine levels in the nucleus accumbens. Blockade of dopamine in the nucleus accumbens can terminate the rewarding effects of addictive drugs.
Not all cell-to-cell communication in the nervous system occurs via neurotransmission. Gap junctions provide for direct neuron-neuron electrical conduction and also create openings for the diffusion of ions and metabolites between cells. In addition to neurons, gap junctions are also widespread in glia, creating a syncytium that protects neurons by removing glutamate and potassium from the extracellular environment. Gap junctions consist of membrane-spanning proteins, termed connexins, that pair across adjacent cells. Mechanisms that involve gap junctions have been related to a variety of neurologic disorders. Mutations in connexin 32, a gap junction protein expressed by Schwann cells, are responsible for the X-linked form of Charcot-Marie-Tooth (CMT) disease (Chap. 459). Mutations in either of two gap junction proteins expressed in the inner ear—connexin 26 and connexin 31—result in autosomal dominant progressive hearing loss (Chap. 43). Glial calcium waves mediated through gap junctions also appear to explain the phenomenon of spreading depression associated with migraine auras and the march of epileptic discharges. Spreading depression is a neural response that follows a variety of different stimuli and is characterized by a circumferentially expanding negative potential that propagates at a characteristic speed of 20 m/s and is associated with an increase in extracellular potassium.
SIGNALING PATHWAYS AND GENE TRANSCRIPTION
The fundamental issue of how memory, learning, and thinking are encoded in the nervous system is likely to be clarified by identifying the signaling pathways involved in neuronal differentiation, axon guidance, and synapse formation, and by understanding how these pathways are modulated by experience. Many families of transcription factors, each comprising multiple individual components, are expressed in the nervous system. Elucidation of these signaling pathways has already begun to provide insights into the cause of a variety of neurologic disorders, including inherited disorders of cognition such as X-linked mental retardation. This problem affects ~1 in 500 males, and linkage studies in different families suggest that as many as 60 different X-chromosome-encoded genes may be responsible. The formation of RNA-DNA duplexes that block transcription has also been observed with the CGG repeat expansions that occur in fragile × gene-associated mental retardation. Rett’s syndrome, a common cause of (dominant) X-linked progressive mental retardation in females, is due to a mutation in a gene (MECP2) encoding a DNA-binding protein involved in transcriptional repression. Because the × chromosome comprises only ~3% of germline DNA, then by extrapolation, the number of genes that potentially contribute to clinical disorders affecting intelligence in humans must be potentially very large. As discussed below, there is increasing evidence that abnormal gene transcription may play a role in neurodegenerative diseases, such as Huntington’s disease, in which proteins with polyglutamine expansions bind to and sequester transcription factors. A critical transcription factor for neuronal survival is CREB (cyclic adenosine monophosphate responsive element-binding) protein, which also plays an important role in memory in the hippocampus. The regulatory gene repressor element 1-silencing transcription factor (REST) coordinates the expression of neuroprotective stress genes during normal aging. It turns off genes involved in cell death and pathology and boosts protective factors. High levels of REST are associated with normal cognition even in the presence of both amyloid plaques and neurofibrillary tangles. Although REST increases with normal aging, it fails to increase in the nucleus in patients with Alzheimer’s disease and is found clumped with amyloid in autophagosomes.
MYELIN AND NEUROINFLAMMATION
Myelin is the multilayered insulating substance that surrounds axons and speeds impulse conduction by permitting action potentials to jump between naked regions of axons (nodes of Ranvier) and across myelinated segments. Molecular interactions between the myelin membrane and axon are required to maintain the stability, function, and normal life span of both structures. A single oligodendrocyte usually ensheaths multiple axons in the central nervous system (CNS), whereas in the peripheral nervous system (PNS), each Schwann cell typically myelinates a single axon. Myelin is a lipid-rich material formed by a spiraling process of the membrane of the myelinating cell around the axon, creating multiple membrane bilayers that are tightly apposed (compact myelin) by charged protein interactions. Several inhibitors of axon growth are expressed on the innermost (periaxonal) lamellae of the myelin membrane (see “Stem Cells and Transplantation,” below). A number of clinically important neurologic disorders are caused by inherited mutations in myelin proteins of the CNS or PNS (Fig. 444e-1). Constituents of myelin also have a propensity to be targeted as autoantigens in autoimmune demyelinating disorders (Fig. 444e-2).
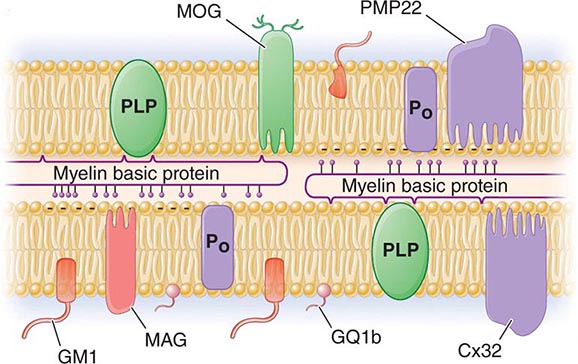
FIGURE 444e-1 The molecular architecture of the myelin sheath illustrating the most important disease-related proteins. The illustration represents a composite of central nervous system (CNS) and peripheral nervous system (PNS) myelin. Proteins restricted to CNS myelin are shown in green, proteins of PNS myelin are lavender, and proteins present in both CNS and PNS are red. In the CNS, the X-linked allelic disorders, Pelizaeus-Merzbacher disease and one variant of familial spastic paraplegia, are caused by mutations in the gene for proteolipid protein (PLP) that normally promotes extracellular compaction between adjacent myelin lamellae. The homologue of PLP in the PNS is the P0 protein, mutations in which cause the neuropathy Charcot-Marie-Tooth disease (CMT) type 1B. The most common form of CMT is the 1A subtype caused by a duplication of the PMP22 gene; deletions in PMP22 are responsible for another inherited neuropathy termed hereditary liability to pressure palsies (Chap. 459).
In multiple sclerosis (MS), myelin basic protein (MBP) and the quantitatively minor CNS protein, myelin oligodendrocyte glycoprotein (MOG), are likely T cell and B cell antigens, respectively (Chap. 458). The location of MOG at the outermost lamella of the CNS myelin membrane may facilitate its targeting by autoantibodies. In the PNS, autoantibodies against myelin gangliosides are implicated in a variety of disorders, including GQ1b in the Fisher variant of Guillain-Barré syndrome, GM1 in multifocal motor neuropathy, and sulfatide constituents of myelin-associated glycoprotein (MAG) in peripheral neuropathies associated with monoclonal gammopathies (Chap. 460).
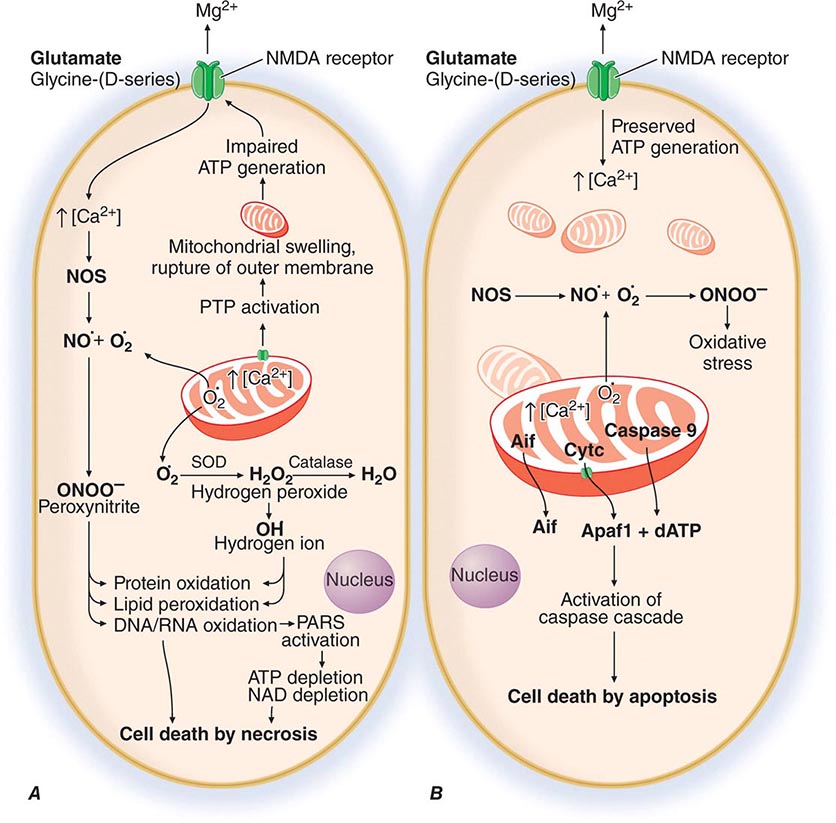
FIGURE 444e-2 Involvement of mitochondria in cell death. A severe excitotoxic insult (A) results in cell death by necrosis, whereas a mild excitotoxic insult (B) results in apoptosis. After a severe insult (such as ischemia), there is a large increase in glutamate activation of N-methyl-D-aspartate (NMDA) receptors, an increase in intracellular Ca2+ concentrations, activation of nitric oxide synthase (NOS), and increased mitochondrial Ca2+ and superoxide generation followed by the formation of ONOO–. This sequence results in damage to cellular macromolecules including DNA, leading to activation of poly-ADP-ribose polymerase (PARS). Both mitochondrial accumulation of Ca2+ and oxidative damage lead to activation of the permeability transition pore (PTP) that is linked to excitotoxic cell death. A mild excitotoxic insult can occur due either to an abnormality in an excitotoxicity amino acid receptor, allowing more Ca2+ flux, or to impaired functioning of other ionic channels or of energy production, which may allow the voltage-dependent NMDA receptor to be activated by ambient concentrations of glutamate. This event can then lead to increased mitochondrial Ca2+ and free radical production, yet relatively preserved ATP generation. The mitochondria may then release cytochrome c (Cytc), caspase 9, apoptosis-inducing factor (Aif), and perhaps other mediators that lead to apoptosis. The precise role of the PTP in this mode of cell death is still being clarified, but there does appear to be involvement of the adenine nucleotide transporter that is a key component of the PTP.
Specification to oligodendrocyte precursor cells (OPCs) is transcriptionally regulated by the Olig 2 and Yin Yang 1 genes, whereas myelination mediated by postmitotic oligodendrocytes depends on a different transcription factor, myelin gene regulatory factor (MRF). It is noteworthy that in the normal adult brain, large numbers of OPCs (expressing PDGFR-α and NG2) are widely distributed but do not myelinate axons, even in demyelinating environments such as in lesions of MS. Several families of molecules have now been identified that regulate oligodendrocyte differentiation and myelination, including LINGO-1, PSA-NCAM, hyaluronan, Nogo-A, the Wnt pathway, notch signaling (and its receptor Jagged), and the retinoic acid receptor RXRγ; all are inhibitory, with the exception of RXRγ, which is excitatory. All are also potential targets for myelin repair therapies, and a monoclonal antibody against LINGO-1 is in clinical testing for remyelination in MS. Very recently, a series of observations has called into question the traditional concept that axon-derived cues are always required for myelination to occur. Fixed (i.e., dead) axons could be efficiently myelinated by oligodendrocytes in vitro, as could artificial polystyrene nanowires of a similar diameter. This led to development of new high-throughput screening assays based on myelination of polystyrene nanowires to identify compounds that could promote myelination.
Macrophages and microglia represent the major cell types in the nervous system responsible for antigen presentation and innate immunity. Brain macrophages are derived from either hematopoietic stem cell–derived bone marrow monocytes or from brain microglia that migrate from the yolk sac early in embryogenesis before the blood-brain barrier is formed. In a murine model of autoimmune demyelination, experimental allergic encephalomyelitis (EAE) (Fig. 444e-3), macrophages derived from bone marrow monocytes, but not microglia, were found to represent the critical population that initiated inflammatory demyelination at paraxonal regions near nodes of Ranvier. An additional, unexpected role for brain microglia was also identified in the regulation of neural circuits through pruning of excitatory synapses and control of dendritic spine densities; mice depleted of microglia during development exhibited a variety of cognitive learning and behavioral deficits, including abnormal social behaviors. Remarkably, depletion of microglia in adult mice by administration of a selective inhibitor of colony-stimulating factor receptor 1 (CSFR1) was followed by their rapid repopulation, suggesting that a pool of resident microglial precursor cells may exist throughout the CNS.
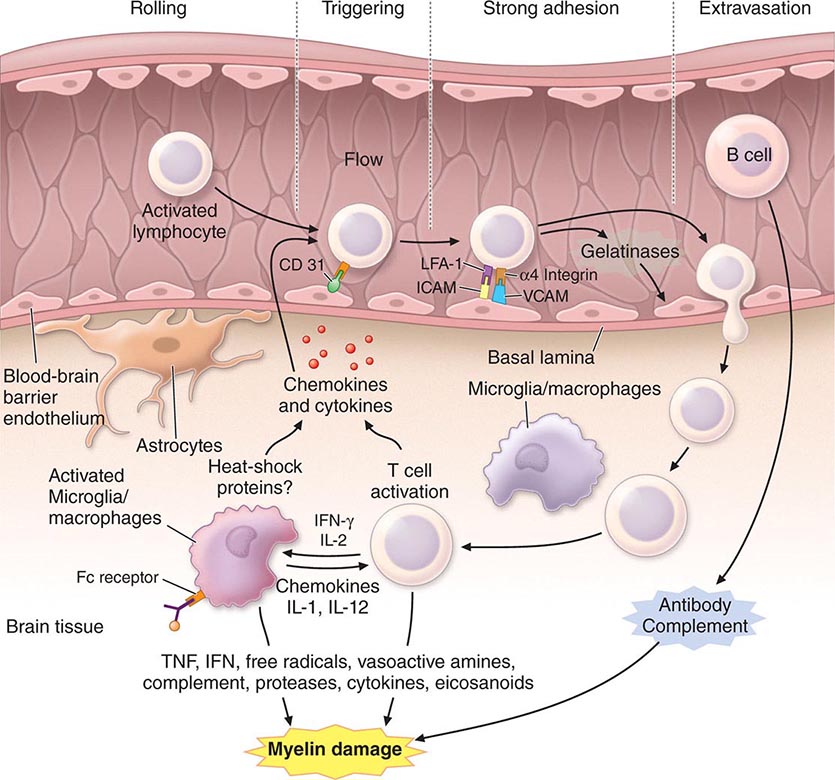
FIGURE 444e-3 A model for experimental allergic encephalomyelitis (EAE). Crucial steps for disease initiation and progression include peripheral activation of preexisting autoreactive T cells; homing to the central nervous system (CNS) and extravasation across the blood-brain barrier; reactivation of T cells by exposed autoantigens; secretion of cytokines; activation of microglia and astrocytes and recruitment of a secondary inflammatory wave; and immune-mediated myelin destruction. ICAM, intercellular adhesion molecule; IFN, interferon; IL, interleukin; LFA-1, leukocyte function-associated antigen-1; TNF, tumor necrosis factor; VCAM, vascular cell adhesion molecule.
MICROBIOTA AND NEUROLOGIC DISEASE
The human microbiome (Chap. 86e) represents the collective set of genes from the 1014 organisms living in our gut, skin, mucosa, and other sites. Different microbial communities are associated with different ethnicities, diets, and environments. In any individual, the predominant gut microbiota can be remarkably stable over decades, but also can be altered by exposure to certain microbial species, for example by ingestion of probiotics.
There is compelling evidence that gut microbes can shape immune responses through the interaction of their metabolism with that of humans. These gut-brain interactions are likely to be important in understanding the pathogenesis of many autoimmune neurologic diseases. For example, mice treated with broad-spectrum antibiotics are resistant to EAE, an effect associated with decreases in production of proinflammatory cytokines, and conversely more production of the immunosuppressive cytokines interleukin (IL) 10 and IL-13 and an increase in regulatory T and B lymphocytes. Oral administration of polysaccharide A (PSA) from Bacillus fragilis also protects mice from EAE, via increases in IL-10.
In addition to nonspecific effects on immune homeostasis mediated by cytokines and regulatory cells, some microbial proteins can trigger, in susceptible individuals, a cross-reactive immune response against a homologous protein in the nervous system, a mechanism termed molecular mimicry. Examples include cross-reactivity between the astrocyte water channel aquaporin-4 and an ABC transporter permease from Clostridia perfringens in neuromyelitis optica (Chap. 458); the neural ganglioside Gm1 and similar sialic acid–containing structures from Campylobacter jejuni in Guillain-Barré syndrome (Chap. 460); and the sleep-promoting protein hypocretin and hemagglutinin from H1N1 influenza virus in narcolepsy (Chap. 38), among others.
Recently, a number of tantalizing observations have incriminated the microbial environment in the pathogenesis of a much wider spectrum of neurologic conditions and behaviors, extending well beyond the traditional boundaries of immune-mediated pathologies. This is perhaps not surprising, as it has long been known in neurology that gut bacteria can influence brain function, based mostly on classic studies demonstrating that products of gut microbes can worsen hepatic encephalopathy, forming the basis of treatment with antibiotics for this condition.
Mice that developed in a completely germ-free environment displayed less anxiety, lower responses to stressful situations, more exploratory locomotive behaviors, and impaired memory formation compared with non-germ-free counterparts. These behaviors were related to changes in gene expression in pathways related to neural signaling, synaptic function, and modulation of neurotransmitters. Moreover, this behavior could be reversed when the germ-free mice were co-housed with non-germ-free mice.
The enteric autonomic nervous system in humans provides a bidirectional neural connection between the brain and gut. The vagus nerve, which innervates the upper gut and proximal colon, has been implicated in anxiety- and depression-like behaviors in mice. Ingestion of Lactobacillus rhamnosus induced changes in expression of the inhibitory neurotransmitter GABA1b in neurons of the limbic cortex, hippocampus, and amygdala, associated with reduced levels of corticosteroids and reduced anxiety- and depression-like behaviors. Remarkably, these changes could be blocked by vagotomy.
Another area of emerging interest is in a possible contribution of the gut microbiome to autism and related disorders. Children with autistic spectrum disorders have long been known to have gastrointestinal disturbances, and it has been claimed that the severity of dysbiosis correlates with the severity of autism. A murine model of autism was recently induced in offspring after injecting the pregnant mother with the viral RNA mimic polyinosinic:polycytidylic acid (poly I:C). Remarkably, oral treatment of offspring with B. fragilis corrected a range of autistic behaviors in these mice and also improved gut permeability.
[/level-membership-for-internal-medicine-category][not-level-membership-for-internal-medicine-category]
PART 17: Neurologic Disorders
SECTION 1 |
DIAGNOSIS OF NEUROLOGIC DISORDERS |
437 |
Approach to the Patient with Neurologic Disease |
Neurologic diseases are common and costly. According to estimates by the World Health Organization, neurologic disorders affect over 1 billion people worldwide, constitute 12% of the global burden of disease, and cause 14% of global deaths (Table 437-1). These numbers are only expected to increase as the world’s population ages. Most patients with neurologic symptoms seek care from internists and other generalists rather than from neurologists. Because therapies now exist for many neurologic disorders, a skillful approach to diagnosis is essential. Errors commonly result from an overreliance on costly neuroimaging procedures and laboratory tests, which, while useful, do not substitute for an adequate history and examination. The proper approach to the patient with a neurologic illness begins with the patient and focuses the clinical problem first in anatomic and then in pathophysiologic terms; only then should a specific diagnosis be entertained. This method ensures that technology is judiciously applied, a correct diagnosis is established in an efficient manner, and treatment is promptly initiated.
|
GLOBAL DISABILITY-ADJUSTED LIFE-YEARS (DALYs) AND NUMBER OF ANNUAL DEATHS FOR SELECTED NEUROLOGIC DISORDERS IN 2010 |
THE NEUROLOGIC METHOD
DEFINE THE ANATOMY
The first priority is to identify the region of the nervous system that is likely to be responsible for the symptoms. Can the disorder be mapped to one specific location, is it multifocal, or is a diffuse process present? Are the symptoms restricted to the nervous system, or do they arise in the context of a systemic illness? Is the problem in the central nervous system (CNS), the peripheral nervous system (PNS), or both? If in the CNS, is the cerebral cortex, basal ganglia, brainstem, cerebellum, or spinal cord responsible? Are the pain-sensitive meninges involved? If in the PNS, could the disorder be located in peripheral nerves and, if so, are motor or sensory nerves primarily affected, or is a lesion in the neuromuscular junction or muscle more likely?
The first clues to defining the anatomic area of involvement appear in the history, and the examination is then directed to confirm or rule out these impressions and to clarify uncertainties. A more detailed examination of a particular region of the CNS or PNS is often indicated. For example, the examination of a patient who presents with a history of ascending paresthesias and weakness should be directed toward deciding, among other things, if the location of the lesion is in the spinal cord or peripheral nerves. Focal back pain, a spinal cord sensory level, and incontinence suggest a spinal cord origin, whereas a stocking-glove pattern of sensory loss suggests peripheral nerve disease; areflexia usually indicates peripheral neuropathy but may also be present with spinal shock in acute spinal cord disorders.
Deciding “where the lesion is” accomplishes the task of limiting the possible etiologies to a manageable, finite number. In addition, this strategy safeguards against making serious errors. Symptoms of recurrent vertigo, diplopia, and nystagmus should not trigger “multiple sclerosis” as an answer (etiology) but “brainstem” or “pons” (location); then a diagnosis of brainstem arteriovenous malformation will not be missed for lack of consideration. Similarly, the combination of optic neuritis and spastic ataxic paraparesis suggests optic nerve and spinal cord disease; multiple sclerosis (MS), CNS syphilis, and vitamin B12 deficiency are treatable disorders that can produce this syndrome. Once the question, “Where is the lesion?” is answered, then the question, “What is the lesion?” can be addressed.
IDENTIFY THE PATHOPHYSIOLOGY
Clues to the pathophysiology of the disease process may also be present in the history. Primary neuronal (gray matter) disorders may present as early cognitive disturbances, movement disorders, or seizures, whereas white matter involvement produces predominantly “long tract” disorders of motor, sensory, visual, and cerebellar pathways. Progressive and symmetric symptoms often have a metabolic or degenerative origin; in such cases lesions are usually not sharply circumscribed. Thus, a patient with paraparesis and a clear spinal cord sensory level is unlikely to have vitamin B12 deficiency as the explanation. A Lhermitte symptom (electric shock–like sensations evoked by neck flexion) is due to ectopic impulse generation in white matter pathways and occurs with demyelination in the cervical spinal cord; among many possible causes, this symptom may indicate MS in a young adult or compressive cervical spondylosis in an older person. Symptoms that worsen after exposure to heat or exercise may indicate conduction block in demyelinated axons, as occurs in MS. A patient with recurrent episodes of diplopia and dysarthria associated with exercise or fatigue may have a disorder of neuromuscular transmission such as myasthenia gravis. Slowly advancing visual scotoma with luminous edges, termed fortification spectra, indicates spreading cortical depression, typically with migraine.
THE NEUROLOGIC HISTORY
Attention to the description of the symptoms experienced by the patient and substantiated by family members and others often permits an accurate localization and determination of the probable cause of the complaints, even before the neurologic examination is performed. The history also helps to bring a focus to the neurologic examination that follows. Each complaint should be pursued as far as possible to elucidate the location of the lesion, the likely underlying pathophysiology, and potential etiologies. For example, a patient complains of weakness of the right arm. What are the associated features? Does the patient have difficulty with brushing hair or reaching upward (proximal) or buttoning buttons or opening a twist-top bottle (distal)? Negative associations may also be crucial. A patient with a right hemiparesis without a language deficit likely has a lesion (internal capsule, brainstem, or spinal cord) different from that of a patient with a right hemiparesis and aphasia (left hemisphere). Other pertinent features of the history include the following:
1. Temporal course of the illness. It is important to determine the precise time of appearance and rate of progression of the symptoms experienced by the patient. The rapid onset of a neurologic complaint, occurring within seconds or minutes, usually indicates a vascular event, a seizure, or migraine. The onset of sensory symptoms located in one extremity that spread over a few seconds to adjacent portions of that extremity and then to the other regions of the body suggests a seizure. A more gradual onset and less well-localized symptoms point to the possibility of a transient ischemic attack (TIA). A similar but slower temporal march of symptoms accompanied by headache, nausea, or visual disturbance suggests migraine. The presence of “positive” sensory symptoms (e.g., tingling or sensations that are difficult to describe) or involuntary motor movements suggests a seizure; in contrast, transient loss of function (negative symptoms) suggests a TIA. A stuttering onset where symptoms appear, stabilize, and then progress over hours or days also suggests cerebrovascular disease; an additional history of transient remission or regression indicates that the process is more likely due to ischemia rather than hemorrhage. A gradual evolution of symptoms over hours or days suggests a toxic, metabolic, infectious, or inflammatory process. Progressing symptoms associated with the systemic manifestations of fever, stiff neck, and altered level of consciousness imply an infectious process. Relapsing and remitting symptoms involving different levels of the nervous system suggest MS or other inflammatory processes. Slowly progressive symptoms without remissions are characteristic of neurodegenerative disorders, chronic infections, gradual intoxications, and neoplasms.
2. Patients’ descriptions of the complaint. The same words often mean different things to different patients. “Dizziness” may imply impending syncope, a sense of disequilibrium, or true spinning vertigo. “Numbness” may mean a complete loss of feeling, a positive sensation such as tingling, or even weakness. “Blurred vision” may be used to describe unilateral visual loss, as in transient monocular blindness, or diplopia. The interpretation of the true meaning of the words used by patients to describe symptoms obviously becomes even more complex when there are differences in primary languages and cultures.
3. Corroboration of the history by others. It is almost always helpful to obtain additional information from family, friends, or other observers to corroborate or expand the patient’s description. Memory loss, aphasia, loss of insight, intoxication, and other factors may impair the patient’s capacity to communicate normally with the examiner or prevent openness about factors that have contributed to the illness. Episodes of loss of consciousness necessitate that details be sought from observers to ascertain precisely what has happened during the event.
4. Family history. Many neurologic disorders have an underlying genetic component. The presence of a Mendelian disorder, such as Huntington’s disease or Charcot-Marie-Tooth neuropathy, is often obvious if family data are available. More detailed questions about family history are often necessary in polygenic disorders such as MS, migraine, and many types of epilepsy. It is important to elicit family history about all illnesses, in addition to neurologic and psychiatric disorders. A familial propensity to hypertension or heart disease is relevant in a patient who presents with a stroke. There are numerous inherited neurologic diseases that are associated with multisystem manifestations that may provide clues to the correct diagnosis (e.g., neurofibromatosis, Wilson’s disease, mitochondrial disorders).
5. Medical illnesses. Many neurologic diseases occur in the context of systemic disorders. Diabetes mellitus, hypertension, and abnormalities of blood lipids predispose to cerebrovascular disease. A solitary mass lesion in the brain may be an abscess in a patient with valvular heart disease, a primary hemorrhage in a patient with a coagulopathy, a lymphoma or toxoplasmosis in a patient with AIDS, or a metastasis in a patient with underlying cancer. Patients with malignancy may also present with a neurologic paraneoplastic syndrome (Chap. 122) or complications from chemotherapy or radiotherapy. Marfan’s syndrome and related collagen disorders predispose to dissection of the cranial arteries and aneurysmal subarachnoid hemorrhage; the latter may also occur with polycystic kidney disease. Various neurologic disorders occur with dysthyroid states or other endocrinopathies. It is especially important to look for the presence of systemic diseases in patients with peripheral neuropathy. Most patients with coma in a hospital setting have a metabolic, toxic, or infectious cause.
6. Drug use and abuse and toxin exposure. It is essential to inquire about the history of drug use, both prescribed and illicit. Sedatives, antidepressants, and other psychoactive medications are frequently associated with acute confusional states, especially in the elderly. Aminoglycoside antibiotics may exacerbate symptoms of weakness in patients with disorders of neuromuscular transmission, such as myasthenia gravis, and may cause dizziness secondary to ototoxicity. Vincristine and other antineoplastic drugs can cause peripheral neuropathy, and immunosuppressive agents such as cyclosporine can produce encephalopathy. Excessive vitamin ingestion can lead to disease; examples include vitamin A and pseudotumor cerebri or pyridoxine and peripheral neuropathy. Many patients are unaware that over-the-counter sleeping pills, cold preparations, and diet pills are actually drugs. Alcohol, the most prevalent neurotoxin, is often not recognized as such by patients, and other drugs of abuse such as cocaine and heroin can cause a wide range of neurologic abnormalities. A history of environmental or industrial exposure to neurotoxins may provide an essential clue; consultation with the patient’s coworkers or employer may be required.
7. Formulating an impression of the patient. Use the opportunity while taking the history to form an impression of the patient. Is the information forthcoming, or does it take a circuitous course? Is there evidence of anxiety, depression, or hypochondriasis? Are there any clues to problems with language, memory, insight, comportment, or behavior? The neurologic assessment begins as soon as the patient comes into the room and the first introduction is made.
THE NEUROLOGIC EXAMINATION
The neurologic examination is challenging and complex; it has many components and includes a number of skills that can be mastered only through repeated use of the same techniques on a large number of individuals with and without neurologic disease. Mastery of the complete neurologic examination is usually important only for physicians in neurology and associated specialties. However, knowledge of the basics of the examination, especially those components that are effective in screening for neurologic dysfunction, is essential for all clinicians, especially generalists.
There is no single, universally accepted sequence of the examination that must be followed, but most clinicians begin with assessment of mental status followed by the cranial nerves, motor system, reflexes, sensory system, coordination, and gait. Whether the examination is basic or comprehensive, it is essential that it be performed in an orderly and systematic fashion to avoid errors and serious omissions. Thus, the best way to learn and gain expertise in the examination is to choose one’s own approach and practice it frequently and do it in the same exact sequence each time.
The detailed description that follows describes the more commonly used parts of the neurologic examination, with a particular emphasis on the components that are considered most helpful for the assessment of common neurologic problems. Each section also includes a brief description of the minimal examination necessary to adequately screen for abnormalities in a patient who has no symptoms suggesting neurologic dysfunction. A screening examination done in this way can be completed in 3–5 min.
Several additional points about the examination are worth noting. First, in recording observations, it is important to describe what is found rather than to apply a poorly defined medical term (e.g., “patient groans to sternal rub” rather than “obtunded”). Second, subtle CNS abnormalities are best detected by carefully comparing a patient’s performance on tasks that require simultaneous activation of both cerebral hemispheres (e.g., eliciting a pronator drift of an outstretched arm with the eyes closed; extinction on one side of bilaterally applied light touch, also with eyes closed; or decreased arm swing or a slight asymmetry when walking). Third, if the patient’s complaint is brought on by some activity, reproduce the activity in the office. If the complaint is of dizziness when the head is turned in one direction, have the patient do this and also look for associated signs on examination (e.g., nystagmus or dysmetria). If pain occurs after walking two blocks, have the patient leave the office and walk this distance and immediately return, and repeat the relevant parts of the examination. Finally, the use of tests that are individually tailored to the patient’s problem can be of value in assessing changes over time. Tests of walking a 7.5-m (25-ft) distance (normal, 5–6 s; note assistance, if any), repetitive finger or toe tapping (normal, 20–25 taps in 5 s), or handwriting are examples.
MENTAL STATUS EXAMINATION
• The bare minimum: During the interview, look for difficulties with communication and determine whether the patient has recall and insight into recent and past events.
The mental status examination is under way as soon as the physician begins observing and speaking with the patient. If the history raises any concern for abnormalities of higher cortical function or if cognitive problems are observed during the interview, then detailed testing of the mental status is indicated. The patient’s ability to understand the language used for the examination, cultural background, educational experience, sensory or motor problems, or comorbid conditions need to be factored into the applicability of the tests and interpretation of results.
The Folstein mini-mental status examination (MMSE) is a standardized screening examination of cognitive function that is extremely easy to administer and takes <10 min to complete. Using age-adjusted values for defining normal performance, the test is ~85% sensitive and 85% specific for making the diagnosis of dementia that is moderate or severe, especially in educated patients. When there is sufficient time available, the MMSE is one of the best methods for documenting the current mental status of the patient, and this is especially useful as a baseline assessment to which future scores of the MMSE can be compared.
Individual elements of the mental status examination can be subdivided into level of consciousness, orientation, speech and language, memory, fund of information, insight and judgment, abstract thought, and calculations.
Level of consciousness is the patient’s relative state of awareness of the self and the environment, and ranges from fully awake to comatose. When the patient is not fully awake, the examiner should describe the responses to the minimum stimulus necessary to elicit a reaction, ranging from verbal commands to a brief, painful stimulus such as a squeeze of the trapezius muscle. Responses that are directed toward the stimulus and signify some degree of intact cerebral function (e.g., opening the eyes and looking at the examiner or reaching to push away a painful stimulus) must be distinguished from reflex responses of a spinal origin (e.g., triple flexion response—flexion at the ankle, knee, and hip in response to a painful stimulus to the foot).
Orientation is tested by asking the person to state his or her name, location, and time (day of the week and date); time is usually the first to be affected in a variety of conditions.
Speech is assessed by observing articulation, rate, rhythm, and prosody (i.e., the changes in pitch and accentuation of syllables and words).
Language is assessed by observing the content of the patient’s verbal and written output, response to spoken commands, and ability to read. A typical testing sequence is to ask the patient to name successively more detailed components of clothing, a watch, or a pen; repeat the phrase “No ifs, ands, or buts”; follow a three-step, verbal command; write a sentence; and read and respond to a written command.
Memory should be analyzed according to three main time scales: (1) immediate memory is assessed by saying a list of three items and having the patient repeat the list immediately; (2) short-term memory is tested by asking the patient to recall the same three items 5 and 15 min later; and (3) long-term memory is evaluated by determining how well the patient is able to provide a coherent chronologic history of his or her illness or personal events.
Fund of information is assessed by asking questions about major historic or current events, with special attention to educational level and life experiences.
Abnormalities of insight and judgment are usually detected during the patient interview; a more detailed assessment can be elicited by asking the patient to describe how he or she would respond to situations having a variety of potential outcomes (e.g., “What would you do if you found a wallet on the sidewalk?”).
Abstract thought can be tested by asking the patient to describe similarities between various objects or concepts (e.g., apple and orange, desk and chair, poetry and sculpture) or to list items having the same attributes (e.g., a list of four-legged animals).
Calculation ability is assessed by having the patient carry out a computation that is appropriate to the patient’s age and education (e.g., serial subtraction of 7 from 100 or 3 from 20; or word problems involving simple arithmetic).
CRANIAL NERVE EXAMINATION
• The bare minimum: Check the fundi, visual fields, pupil size and reactivity, extraocular movements, and facial movements.
The cranial nerves (CN) are best examined in numerical order, except for grouping together CN III, IV, and VI because of their similar function.
CN I (Olfactory) Testing is often omitted unless there is suspicion for inferior frontal lobe disease (e.g., meningioma). With eyes closed, ask the patient to sniff a mild stimulus such as toothpaste or coffee and identify the odorant.
CN II (Optic) Check visual acuity (with eyeglasses or contact lens correction) using a Snellen chart or similar tool. Test the visual fields by confrontation, i.e., by comparing the patient’s visual fields to your own. As a screening test, it is usually sufficient to examine the visual fields of both eyes simultaneously; individual eye fields should be tested if there is any reason to suspect a problem of vision by the history or other elements of the examination, or if the screening test reveals an abnormality. Face the patient at a distance of approximately 0.6–1.0 m (2–3 ft) and place your hands at the periphery of your visual fields in the plane that is equidistant between you and the patient. Instruct the patient to look directly at the center of your face and to indicate when and where he or she sees one of your fingers moving. Beginning with the two inferior quadrants and then the two superior quadrants, move your index finger of the right hand, left hand, or both hands simultaneously and observe whether the patient detects the movements. A single small-amplitude movement of the finger is sufficient for a normal response. Focal perimetry and tangent screen examinations should be used to map out visual field defects fully or to search for subtle abnormalities. Optic fundi should be examined with an ophthalmoscope, and the color, size, and degree of swelling or elevation of the optic disc noted, as well as the color and texture of the retina. The retinal vessels should be checked for size, regularity, arteriovenous nicking at crossing points, hemorrhage, exudates, etc.
CN III, IV, VI (Oculomotor, Trochlear, Abducens) Describe the size and shape of pupils and reaction to light and accommodation (i.e., as the eyes converge while following your finger as it moves toward the bridge of the nose). To check extraocular movements, ask the patient to keep his or her head still while tracking the movement of the tip of your finger. Move the target slowly in the horizontal and vertical planes; observe any paresis, nystagmus, or abnormalities of smooth pursuit (saccades, oculomotor ataxia, etc.). If necessary, the relative position of the two eyes, both in primary and multidirectional gaze, can be assessed by comparing the reflections of a bright light off both pupils. However, in practice it is typically more useful to determine whether the patient describes diplopia in any direction of gaze; true diplopia should almost always resolve with one eye closed. Horizontal nystagmus is best assessed at 45° and not at extreme lateral gaze (which is uncomfortable for the patient); the target must often be held at the lateral position for at least a few seconds to detect an abnormality.
CN V (Trigeminal) Examine sensation within the three territories of the branches of the trigeminal nerve (ophthalmic, maxillary, and mandibular) on each side of the face. As with other parts of the sensory examination, testing of two sensory modalities derived from different anatomic pathways (e.g., light touch and temperature) is sufficient for a screening examination. Testing of other modalities, the corneal reflex, and the motor component of CN V (jaw clench—masseter muscle) is indicated when suggested by the history.
CN VII (Facial) Look for facial asymmetry at rest and with spontaneous movements. Test eyebrow elevation, forehead wrinkling, eye closure, smiling, and cheek puff. Look in particular for differences in the lower versus upper facial muscles; weakness of the lower two-thirds of the face with preservation of the upper third suggests an upper motor neuron lesion, whereas weakness of an entire side suggests a lower motor neuron lesion.
CN VIII (Vestibulocochlear) Check the patient’s ability to hear a finger rub or whispered voice with each ear. Further testing for air versus mastoid bone conduction (Rinne) and lateralization of a 512-Hz tuning fork placed at the center of the forehead (Weber) should be done if an abnormality is detected by history or examination. Any suspected problem should be followed up with formal audiometry. For further discussion of assessing vestibular nerve function in the setting of dizziness, hearing loss, or coma, see Chaps. 28, 43, and 328, respectively.
CN IX, × (Glossopharyngeal, Vagus) Observe the position and symmetry of the palate and uvula at rest and with phonation (“aah”). The pharyngeal (“gag”) reflex is evaluated by stimulating the posterior pharyngeal wall on each side with a sterile, blunt object (e.g., tongue blade), but the reflex is often absent in normal individuals.
CN XI (Spinal Accessory) Check shoulder shrug (trapezius muscle) and head rotation to each side (sternocleidomastoid) against resistance.
CN XII (Hypoglossal) Inspect the tongue for atrophy or fasciculations, position with protrusion, and strength when extended against the inner surface of the cheeks on each side.
MOTOR EXAMINATION
• The bare minimum: Look for muscle atrophy and check extremity tone. Assess upper extremity strength by checking for pronator drift and strength of wrist or finger extensors. Assess lower extremity strength by checking strength of the toe extensors and having the patient walk normally and on heels and toes.
The motor examination includes observations of muscle appearance, tone, and strength. Although gait is in part a test of motor function, it is usually evaluated separately at the end of the examination.
Appearance Inspect and palpate muscle groups under good light and with the patient in a comfortable and symmetric position. Check for muscle fasciculations, tenderness, and atrophy or hypertrophy. Involuntary movements may be present at rest (e.g., tics, myoclonus, choreoathetosis), during maintained posture (pill-rolling tremor of Parkinson’s disease), or with voluntary movements (intention tremor of cerebellar disease or familial tremor).
Tone Muscle tone is tested by measuring the resistance to passive movement of a relaxed limb. Patients often have difficulty relaxing during this procedure, so it is useful to distract the patient to minimize active movements. In the upper limbs, tone is assessed by rapid pronation and supination of the forearm and flexion and extension at the wrist. In the lower limbs, while the patient is supine the examiner’s hands are placed behind the knees and rapidly raised; with normal tone, the ankles drag along the table surface for a variable distance before rising, whereas increased tone results in an immediate lift of the heel off the surface. Decreased tone is most commonly due to lower motor neuron or peripheral nerve disorders. Increased tone may be evident as spasticity (resistance determined by the angle and velocity of motion; corticospinal tract disease), rigidity (similar resistance in all angles of motion; extrapyramidal disease), or paratonia (fluctuating changes in resistance; frontal lobe pathways or normal difficulty in relaxing). Cogwheel rigidity, in which passive motion elicits jerky interruptions in resistance, is seen in parkinsonism.
Strength Testing for pronator drift is an extremely useful method for screening upper limb weakness. The patient is asked to hold both arms fully extended and parallel to the ground with eyes closed. This position should be maintained for ~10 s; any flexion at the elbow or fingers or pronation of the forearm, especially if asymmetric, is a sign of potential weakness. Muscle strength is further assessed by having the patient exert maximal effort for the particular muscle or muscle group being tested. It is important to isolate the muscles as much as possible, i.e., hold the limb so that only the muscles of interest are active. It is also helpful to palpate accessible muscles as they contract. Grading muscle strength and evaluating the patient’s effort is an art that takes time and practice. Muscle strength is traditionally graded using the following scale:
0 = no movement
1 = flicker or trace of contraction but no associated movement at a joint
2 = movement with gravity eliminated
3 = movement against gravity but not against resistance
4– = movement against a mild degree of resistance
4 = movement against moderate resistance
4+ = movement against strong resistance
5 = full power
However, in many cases, it is more practical to use the following terms:
Noting the pattern of weakness is as important as assessing the magnitude of weakness. Unilateral or bilateral weakness of the upper limb extensors and lower limb flexors (“pyramidal weakness”) suggests a lesion of the pyramidal tract, bilateral proximal weakness suggests myopathy, and bilateral distal weakness suggests peripheral neuropathy.
REFLEX EXAMINATION
• The bare minimum: Check the biceps, patellar, and Achilles reflexes.
Muscle Stretch Reflexes Those that are typically assessed include the biceps (C5, C6), brachioradialis (C5, C6), and triceps (C7, C8) reflexes in the upper limbs and the patellar or quadriceps (L3, L4) and Achilles (S1, S2) reflexes in the lower limbs. The patient should be relaxed and the muscle positioned midway between full contraction and extension. Reflexes may be enhanced by asking the patient to voluntarily contract other, distant muscle groups (Jendrassik maneuver). For example, upper limb reflexes may be reinforced by voluntary teeth-clenching, and the Achilles reflex by hooking the flexed fingers of the two hands together and attempting to pull them apart. For each reflex tested, the two sides should be tested sequentially, and it is important to determine the smallest stimulus required to elicit a reflex rather than the maximum response. Reflexes are graded according to the following scale:
0 = absent
1 = present but diminished
2 = normoactive
3 = exaggerated
4 = clonus
Cutaneous Reflexes The plantar reflex is elicited by stroking, with a noxious stimulus such as a tongue blade, the lateral surface of the sole of the foot beginning near the heel and moving across the ball of the foot to the great toe. The normal reflex consists of plantar flexion of the toes. With upper motor neuron lesions above the S1 level of the spinal cord, a paradoxical extension of the toe is observed, associated with fanning and extension of the other toes (termed an extensor plantar response, or Babinski sign). However, despite its popularity, the reliability and validity of the Babinski sign for identifying upper motor neuron weakness is limited—it is far more useful to rely on tests of tone, strength, stretch reflexes, and coordination. Superficial abdominal reflexes are elicited by gently stroking the abdominal surface near the umbilicus in a diagonal fashion with a sharp object (e.g., the wooden end of a cotton-tipped swab) and observing the movement of the umbilicus. Normally, the umbilicus will pull toward the stimulated quadrant. With upper motor neuron lesions, these reflexes are absent. They are most helpful when there is preservation of the upper (spinal cord level T9) but not lower (T12) abdominal reflexes, indicating a spinal lesion between T9 and T12, or when the response is asymmetric. Other useful cutaneous reflexes include the cremasteric (ipsilateral elevation of the testicle following stroking of the medial thigh; mediated by L1 and L2) and anal (contraction of the anal sphincter when the perianal skin is scratched; mediated by S2, S3, S4) reflexes. It is particularly important to test for these reflexes in any patient with suspected injury to the spinal cord or lumbosacral roots.
Primitive Reflexes With disease of the frontal lobe pathways, several primitive reflexes not normally present in the adult may appear. The suck response is elicited by lightly touching with a tongue blade the center of the lips, and the root response the corner of the lips; the patient will move the lips to suck or root in the direction of the stimulus. The grasp reflex is elicited by touching the palm between the thumb and index finger with the examiner’s fingers; a positive response is a forced grasp of the examiner’s hand. In many instances, stroking the back of the hand will lead to its release. The palmomental response is contraction of the mentalis muscle (chin) ipsilateral to a scratch stimulus diagonally applied to the palm.
SENSORY EXAMINATION
• The bare minimum: Ask whether the patient can feel light touch and the temperature of a cool object in each distal extremity. Check double simultaneous stimulation using light touch on the hands. Perform the Romberg maneuver.
Evaluating sensation is usually the most unreliable part of the examination because it is subjective and is difficult to quantify. In the compliant and discerning patient, the sensory examination can be extremely helpful for the precise localization of a lesion. With patients who are uncooperative or lack an understanding of the tests, it may be useless. The examination should be focused on the suspected lesion. For example, in spinal cord, spinal root, or peripheral nerve abnormalities, all major sensory modalities should be tested while looking for a pattern consistent with a spinal level and dermatomal or nerve distribution. In patients with lesions at or above the brainstem, screening the primary sensory modalities in the distal extremities along with tests of “cortical” sensation is usually sufficient.
The five primary sensory modalities—light touch, pain, temperature, vibration, and joint position—are tested in each limb. Light touch is assessed by stimulating the skin with single, very gentle touches of the examiner’s finger or a wisp of cotton. Pain is tested using a new pin, and temperature is assessed using a metal object (e.g., tuning fork) that has been immersed in cold and warm water. Vibration is tested using a 128-Hz tuning fork applied to the distal phalanx of the great toe or index finger just below the nail bed. By placing a finger on the opposite side of the joint being tested, the examiner compares the patient’s threshold of vibration perception with his or her own. For joint position testing, the examiner grasps the digit or limb laterally and distal to the joint being assessed; small 1- to 2-mm excursions can usually be sensed. The Romberg maneuver is primarily a test of proprioception. The patient is asked to stand with the feet as close together as necessary to maintain balance while the eyes are open, and the eyes are then closed. A loss of balance with the eyes closed is an abnormal response.
“Cortical” sensation is mediated by the parietal lobes and represents an integration of the primary sensory modalities; testing cortical sensation is only meaningful when primary sensation is intact. Double simultaneous stimulation is especially useful as a screening test for cortical function; with the patient’s eyes closed, the examiner lightly touches one or both hands and asks the patient to identify the stimuli. With a parietal lobe lesion, the patient may be unable to identify the stimulus on the contralateral side when both hands are touched. Other modalities relying on the parietal cortex include the discrimination of two closely placed stimuli as separate (two-point discrimination), identification of an object by touch and manipulation alone (stereognosis), and the identification of numbers or letters written on the skin surface (graphesthesia).
COORDINATION EXAMINATION
• The bare minimum: Observe the patient at rest and during spontaneous movements. Test rapid alternating movements of the hands and feet and finger to nose.
Coordination refers to the orchestration and fluidity of movements. Even simple acts require cooperation of agonist and antagonist muscles, maintenance of posture, and complex servomechanisms to control the rate and range of movements. Part of this integration relies on normal function of the cerebellar and basal ganglia systems. However, coordination also requires intact muscle strength and kinesthetic and proprioceptive information. Thus, if the examination has disclosed abnormalities of the motor or sensory systems, the patient’s coordination should be assessed with these limitations in mind.
Rapid alternating movements in the upper limbs are tested separately on each side by having the patient make a fist, partially extend the index finger, and then tap the index finger on the distal thumb as quickly as possible. In the lower limb, the patient rapidly taps the foot against the floor or the examiner’s hand. Finger-to-nose testing is primarily a test of cerebellar function; the patient is asked to touch his or her index finger repetitively to the nose and then to the examiner’s outstretched finger, which moves with each repetition. A similar test in the lower extremity is to have the patient raise the leg and touch the examiner’s finger with the great toe. Another cerebellar test in the lower limbs is the heel-knee-shin maneuver; in the supine position the patient is asked to slide the heel of each foot from the knee down the shin of the other leg. For all these movements, the accuracy, speed, and rhythm are noted.
GAIT EXAMINATION
• The bare minimum: Observe the patient while walking normally, on the heels and toes, and along a straight line.
Watching the patient walk is the most important part of the neurologic examination. Normal gait requires that multiple systems—including strength, sensation, and coordination—function in a highly integrated fashion. Unexpected abnormalities may be detected that prompt the examiner to return in more detail to other aspects of the examination. The patient should be observed while walking and turning normally, walking on the heels, walking on the toes, and walking heel-to-toe along a straight line. The examination may reveal decreased arm swing on one side (corticospinal tract disease), a stooped posture and short-stepped gait (parkinsonism), a broad-based unstable gait (ataxia), scissoring (spasticity), or a high-stepped, slapping gait (posterior column or peripheral nerve disease), or the patient may appear to be stuck in place (apraxia with frontal lobe disease).
NEUROLOGIC DIAGNOSIS
The clinical data obtained from the history and examination are interpreted to arrive at an anatomic localization that best explains the clinical findings (Table 437-2), to narrow the list of diagnostic possibilities, and to select the laboratory tests most likely to be informative. The laboratory assessment may include (1) serum electrolytes; complete blood count; and renal, hepatic, endocrine, and immune studies; (2) cerebrospinal fluid examination; (3) focused neuroimaging studies (Chap. 440e); or (4) electrophysiologic studies (Chap. 442e). The anatomic localization, mode of onset and course of illness, other medical data, and laboratory findings are then integrated to establish an etiologic diagnosis.
|
FINDINGS HELPFUL FOR LOCALIZATIONS WITHIN THE NERVOUS SYSTEM |
The neurologic examination may be normal even in patients with a serious neurologic disease, such as seizures, chronic meningitis, or a TIA. A comatose patient may arrive with no available history, and in such cases, the approach is as described in Chap. 328. In other patients, an inadequate history may be overcome by a succession of examinations from which the course of the illness can be inferred. In perplexing cases it is useful to remember that uncommon presentations of common diseases are more likely than rare etiologies. Thus, even in tertiary care settings, multiple strokes are usually due to emboli and not vasculitis, and dementia with myoclonus is usually Alzheimer’s disease and not a prion disorder or a paraneoplastic illness. Finally, the most important task of a primary care physician faced with a patient who has a new neurologic complaint is to assess the urgency of referral to a specialist. Here, the imperative is to rapidly identify patients likely to have nervous system infections, acute strokes, and spinal cord compression or other treatable mass lesions and arrange for immediate care.
438e |
The Neurologic Screening Exam |
Knowledge of the basic neurologic examination is an essential clinical skill. A simple neurologic screening examination—assessment of mental status, cranial nerves, motor system, sensory system, coordination, and gait—can be reliably performed in 3–5 min. Although the components of the examination may appear daunting at first, skills usually improve rapidly with repetition and practice. In this video, the technique of performing a simple and efficient screening examination is presented.
439e |
Video Atlas of the Detailed Neurologic Examination |
The comprehensive neurologic examination is an irreplaceable tool for the efficient diagnosis of neurologic disorders. Mastery of its details requires knowledge of normal nervous system anatomy and physiology combined with personal experience performing orderly and systematic examinations on large numbers of patients and healthy individuals. In the hands of a great clinician, the neurologic examination also becomes a thing of beauty—the pinnacle of the art of medicine. In this video, the most commonly used components of the examination are presented in detail, with a particular emphasis on those elements that are most helpful for assessment of common neurologic problems.
440e |
Neuroimaging in Neurologic Disorders |
The clinician caring for patients with neurologic symptoms is faced with myriad imaging options, including computed tomography (CT), CT angiography (CTA), perfusion CT (pCT), magnetic resonance (MR) imaging (MRI), MR angiography (MRA), functional MRI (fMRI), MR spectroscopy (MRS), MR neurography (MRN), diffusion and diffusion tensor imaging, susceptibility-weighted MR imaging (SWI), arterial spin label MRI (ASL) and perfusion MRI (pMRI). In addition, an increasing number of interventional neuroradiologic techniques are available, including angiography catheter embolization, coiling, and stenting of vascular structures, and spine diagnostic and interventional techniques, such as diskography, transforaminal and translaminar epidural and nerve root injections, and blood patches. Multidetector CTA (MDCTA) and gadolinium-enhanced MRA have narrowed the indications for conventional angiography, which is now reserved for patients in whom small-vessel detail is essential for diagnosis or for whom concurrent interventional therapy is planned (Table 440e-1).
|
GUIDELINES FOR THE USE OF CT, ULTRASOUND, AND MRI |
In general, MRI is more sensitive than CT for the detection of lesions affecting the central nervous system (CNS), particularly those of the spinal cord, cranial nerves, and posterior fossa structures. Diffusion MR, a sequence sensitive to the microscopic motion of water, is the most sensitive technique for detecting acute ischemic stroke of the brain or spinal cord, and it is also useful in the detection of encephalitis, abscesses, and prion diseases. CT, however, is quickly acquired and is widely available, making it a pragmatic choice for the initial evaluation of patients with acute changes in mental status, suspected acute stroke, hemorrhage, and intracranial or spinal trauma. CT is also more sensitive than MRI for visualizing fine osseous detail and is indicated in the initial imaging evaluation of conductive hearing loss as well as lesions affecting the skull base and calvarium. MR may, however, add important diagnostic information regarding bone marrow infiltrative processes that are difficult to detect on CT.
COMPUTED TOMOGRAPHY
TECHNIQUE
The CT image is a cross-sectional representation of anatomy created by a computer-generated analysis of the attenuation of x-ray beams passed through a section of the body. As the x-ray beam, collimated to the desired slice width, rotates around the patient, it passes through selected regions in the body. X-rays that are not attenuated by body structures are detected by sensitive x-ray detectors aligned 180° from the x-ray tube. A computer calculates a “back projection” image from the 360° x-ray attenuation profile. Greater x-ray attenuation (e.g., as caused by bone), results in areas of high “density” (whiter) on the scan, whereas soft tissue structures that have poor attenuation of x-rays, such as organs and air-filled cavities, are lower (blacker) in density. The resolution of an image depends on the radiation dose, the detector size, collimation (slice thickness), the field of view, and the matrix size of the display. A modern CT scanner is capable of obtaining sections as thin as 0.5–1 mm with 0.4-mm in-plane resolution at a speed of 0.3 s per rotation; complete studies of the brain can be completed in 1–10 s.
Multidetector CT (MDCT) is now standard in most radiology departments. Single or multiple (from 4 to 320) solid-state detectors positioned opposite to the x-ray source result in multiple slices per revolution of the beam around the patient. The table moves continuously through the rotating x-ray beam, generating a continuous “helix” of information that can be reformatted into various slice thicknesses and planes. Advantages of MDCT include shorter scan times, reduced patient and organ motion, and the ability to acquire images dynamically during the infusion of intravenous contrast, which can be used to construct CT angiograms of vascular structures and perfusion images (Figs. 440e-1B and C). CTA can be displayed in three dimensions to yield angiogram-like images (Figs. 440e-1C, 440e-2E and F, and see Fig. 446-4). CTA has proved useful in assessing the cervical and intracranial arterial and venous anatomy.
FIGURE 440e-1 Computed tomography (CT) angiography (CTA) of ruptured anterior cerebral artery aneurysm in a patient presenting with acute headache. A. Noncontrast CT demonstrates subarachnoid hemorrhage and mild obstructive hydrocephalus. B. Axial maximum-intensity projection from CTA demonstrates enlargement of the anterior cerebral artery (arrow). C. Three-dimensional surface reconstruction using a workstation confirms the anterior cerebral aneurysm and demonstrates its orientation and relationship to nearby vessels (arrow). CTA image is produced by 0.5- to 1-mm helical CT scans performed during a rapid bolus infusion of intravenous contrast medium.
FIGURE 440e-2 Acute left hemiparesis due to middle cerebral artery occlusion. A. Axial noncontrast computed tomography (CT) scan demonstrates high density within the right middle cerebral artery (arrowheads). B. Mean transit time CT perfusion parametric map indicating prolonged mean transit time involving the right middle cerebral territory (arrows). C. Cerebral blood volume (CBV) map shows reduced CBV involving an area within the defect shown in B, indicating a high likelihood of infarction (arrows). D. Axial maximum-intensity projection from a CT angiography (CTA) study through the circle of Willis demonstrates an abrupt occlusion of the proximal right middle cerebral artery (arrow). E. Sagittal reformation through the right internal carotid artery demonstrates a low-density lipid-laden plaque (arrowheads) narrowing the lumen (black arrow). F. Three-dimensional surface-rendered CTA image demonstrates calcification and narrowing of the right internal carotid artery (arrow), consistent with atherosclerotic disease. G. Coronal maximum-intensity projection from magnetic resonance angiography shows right middle cerebral artery (MCA) occlusion (arrow). H. and I. Axial diffusion-weighted image (H) and apparent diffusion coefficient image (I) documents the presence of a right middle cerebral artery infarction.
Intravenous iodinated contrast is often administered to identify both vascular structures and to detect defects in the blood-brain barrier (BBB) that are caused by tumors, infarcts, and infections. In the normal CNS, only vessels and structures lacking a BBB (e.g., the pituitary gland, choroid plexus, and dura) enhance after contrast administration. The use of iodinated contrast agents carries a small risk of allergic reaction and adds additional expense. While helpful in characterizing mass lesions as well as essential for the acquisition of CTA studies, the decision to use contrast material should always be considered carefully.
INDICATIONS
CT is the primary study of choice in the evaluation of an acute change in mental status, focal neurologic findings, acute trauma to the brain and spine, suspected subarachnoid hemorrhage, and conductive hearing loss (Table 440e-1). CT is complementary to MR in the evaluation of the skull base, orbit, and osseous structures of the spine. In the spine, CT is useful in evaluating patients with osseous spinal stenosis and spondylosis, but MRI is often preferred in those with neurologic deficits. CT can also be obtained following intrathecal contrast injection to evaluate the intracranial cisterns (CT cisternography) for cerebrospinal fluid (CSF) fistula, as well as the spinal subarachnoid space (CT myelography), although intrathecal administration of gadolinium combined with MR may also be complementary.
COMPLICATIONS
CT is safe, fast, and reliable. Radiation exposure depends on the dose used but is normally between 2 and 5 mSv (millisievert) for a routine brain CT study. Care must be taken to reduce exposure when imaging children. With the advent of MDCT, CTA, and CT perfusion, the benefit must be weighed against the increased radiation doses associated with these techniques. Advanced noise reduction software now permits acceptable diagnostic CT scans at 30–40% lower radiation doses.
The most frequent complications are those associated with use of intravenous contrast agents. While two broad categories of contrast media, ionic and nonionic, are in use, ionic agents have been largely replaced by safer nonionic compounds.
Contrast nephropathy may result from hemodynamic changes, renal tubular obstruction and cell damage, or immunologic reactions to contrast agents. A rise in serum creatinine of at least 85 μmol/L (1 mg/dL) within 48 h of contrast administration is often used as a definition of contrast nephropathy, although other causes of acute renal failure must be excluded. The prognosis is usually favorable, with serum creatinine levels returning to baseline within 1–2 weeks. Risk factors for contrast nephropathy include advanced age (>80 years), preexisting renal disease (serum creatinine exceeding 2 mg/dL), solitary kidney, diabetes mellitus, dehydration, paraproteinemia, concurrent use of nephrotoxic medication or chemotherapeutic agents, and high contrast dose. Patients with diabetes and those with mild renal failure should be well hydrated prior to the administration of contrast agents, although careful consideration should be given to alternative imaging techniques such as MRI, noncontrast CT, or ultrasound (US). Nonionic, low-osmolar media produce fewer abnormalities in renal blood flow and less endothelial cell damage but should still be used carefully in patients at risk for allergic reaction. Estimated glomerular filtration rate (eGFR) is a more reliable indicator of renal function compared to creatinine alone because it takes into account age, race, and sex. In one study, 15% of outpatients with a normal serum creatinine had an estimated creatinine clearance of 50 mL/min/1.73 m2 or less (normal is ≥90 mL/min/1.73 m2). The exact eGFR threshold, below which withholding intravenous contrast should be considered, is controversial. The risk of contrast nephropathy increases in patients with an eGFR <60 mL/min/1.73 m2; however, the majority of these patients will only have a temporary rise in creatinine. The risk of dialysis after receiving contrast significantly increases in patients with eGFR <30 mL/min/1.73 m2. Thus, an eGFR threshold between 60 and 30 mL/min/1.73 m2 is appropriate; however, the exact number is somewhat arbitrary. A creatinine of 1.6 in a 70-year-old, non-African-American male corresponds to an eGFR of approximately 45 mL/min/1.73 m2. The American College of Radiology suggests using an eGFR of 45 mL/min/1.73 m2 as a threshold below which iodinated contrast should not be given without serious consideration of the potential for contrast nephropathy. If contrast must be administered to a patient with an eGFR below 45 mL/min/1.73 m2, the patient should be well hydrated, and a reduction in the dose of contrast should be considered. Use of other agents such as bicarbonate and acetylcysteine may reduce the incidence of contrast nephropathy.
Allergy Immediate reactions following intravenous contrast media can occur through several mechanisms. The most severe reactions are related to allergic hypersensitivity (anaphylaxis) and range from mild hives to bronchospasm and death. The pathogenesis of allergic hypersensitivity reactions is thought to include the release of mediators such as histamine, antibody-antigen reactions, and complement activation. Severe allergic reactions occur in ~0.04% of patients receiving nonionic media, sixfold lower than with ionic media. Risk factors include a history of prior contrast reaction (fivefold increased likelihood), food and or drug allergies, and atopy (asthma and hay fever). The predictive value of specific allergies, such as those to shellfish, once thought important, actually is now recognized to be unreliable. Nonetheless, in patients with a history worrisome for potential allergic reaction, a noncontrast CT or MRI procedure should be considered as an alternative to contrast administration. If iodinated contrast is absolutely required, a nonionic agent should be used in conjunction with pretreatment with glucocorticoids and antihistamines (Table 440e-2); however, pretreatment does not guarantee safety. Patients with allergic reactions to iodinated contrast material do not usually react to gadolinium-based MR contrast material, although such reactions can occur. It would be wise to pretreat patients with a prior allergic history to MR contrast administration in a similar fashion. Nonimmediate (>1 h after injection) reactions are frequent and probably related to T cell–mediated immune reactions. These are typically urticarial but can occasionally be more severe. Drug provocation and skin testing may be required to determine the culprit agent involved as well as determine a safe alternative.
|
GUIDELINES FOR PREMEDICATION OF PATIENTS WITH PRIOR CONTRAST ALLERGY |
Other side effects of CT scanning are rare but include a sensation of warmth throughout the body and a metallic taste during intravenous administration of iodinated contrast media. Extravasation of contrast media, although rare, can be painful and lead to compartment syndrome. When this occurs, consultation with plastic surgery is indicated. Patients with significant cardiac disease may be at increased risk for contrast reactions, and in these patients, limits to the volume and osmolality of the contrast media should be considered. Patients who may undergo systemic radioactive iodine therapy for thyroid disease or cancer should not receive iodinated contrast media if possible, because this will decrease the uptake of the radioisotope into the tumor or thyroid (see the American College of Radiology Manual on Contrast Media, Version 9, 2013; http://www.acr.org/~/media/ACR/Documents/PDF/QualitySafety/Resources/Contrast%20Manual/2013_Contrast_Media.pdf).
MAGNETIC RESONANCE IMAGING
TECHNIQUE
MRI is a complex interaction between hydrogen protons in biologic tissues, a static magnetic field (the magnet), and energy in the form of radiofrequency (Rf) waves of a specific frequency introduced by coils placed next to the body part of interest. Images are made by computerized processing of resonance information received from protons in the body. Field strength of the magnet is directly related to signal-to-noise ratio. While 1.5-T magnets have become the standard high-field MRI units, 3-T magnets are now widely available and have distinct advantages in the brain and musculoskeletal systems. Even higher field magnets (7-T) and positron emission tomography (PET) MR machines promise increased resolution and anatomic-functional information on a variety of disorders. Spatial localization is achieved by magnetic gradients surrounding the main magnet, which impart slight changes in magnetic field throughout the imaging volume. Rf pulses transiently excite the energy state of the hydrogen protons in the body. Rf is administered at a frequency specific for the field strength of the magnet. The subsequent return to equilibrium energy state (relaxation) of the hydrogen protons results in a release of Rf energy (the echo), which is detected by the coils that delivered the Rf pulses. Fourier analysis is used to transform the echo into the information used to form an MR image. The MR image thus consists of a map of the distribution of hydrogen protons, with signal intensity imparted by both density of hydrogen protons and differences in the relaxation times (see below) of hydrogen protons on different molecules. Although clinical MRI currently makes use of the ubiquitous hydrogen proton, research into sodium and carbon imaging and spectroscopy appears promising.
T1 and T2 Relaxation Times The rate of return to equilibrium of perturbed protons is called the relaxation rate. The relaxation rate varies among normal and pathologic tissues. The relaxation rate of a hydrogen proton in a tissue is influenced by local interactions with surrounding molecules and atomic neighbors. Two relaxation rates, T1 and T2, influence the signal intensity of the image. The T1 relaxation time is the time, measured in milliseconds, for 63% of the hydrogen protons to return to their normal equilibrium state, whereas the T2 relaxation is the time for 63% of the protons to become dephased owing to interactions among nearby protons. The intensity and image contrast of the signal within various tissues can be modulated by altering acquisition parameters such as the interval between Rf pulses (TR) and the time between the Rf pulse and the signal reception (TE). T1-weighted (T1W) images are produced by keeping the TR and TE relatively short, whereas using longer TR and TE times produces T2-weighted (T2W) images. Fat and subacute hemorrhage have relatively shorter T1 relaxation rates and thus higher signal intensity than brain on T1W images. Structures containing more water, such as CSF and edema, have long T1 and T2 relaxation rates, resulting in relatively lower signal intensity on T1W images and higher signal intensity on T2W images (Table 440e-3). Gray matter contains 10–15% more water than white matter, which accounts for much of the intrinsic contrast between the two on MRI (Fig. 440e-6B). T2W images are more sensitive than T1W images to edema, demyelination, infarction, and chronic hemorrhage, whereas T1W imaging is more sensitive to subacute hemorrhage and fat-containing structures.
|
SOME COMMON INTENSITIES ON T1- AND T2-WEIGHTED MRI SEQUENCES |
Many different MR pulse sequences exist, and each can be obtained in various planes (Figs. 440e-2, 440e-3, and 440e-4). The selection of a proper protocol that will best answer a clinical question depends on an accurate clinical history and indication for the examination. Fluid-attenuated inversion recovery (FLAIR) is a useful pulse sequence that produces T2W images in which the normally high signal intensity of CSF is suppressed (Fig. 440e-6B). FLAIR images are more sensitive than standard spin echo images for any water-containing lesions or edema. Susceptibility-weighted imaging, such as gradient echo imaging, is very sensitive to magnetic susceptibility generated by blood, calcium, and air and routinely obtained in patients suspected of pathology that might result in microhemorrhages, such as amyloid, hemorrhagic metastases, and thrombotic states (Fig. 440e-5C). MR images can be generated in any plane without changing the patient’s position. Each sequence, however, must be obtained separately and takes 1–10 min on average to complete. Three-dimensional volumetric imaging is also possible with MRI, resulting in a three-dimensional volume of data that can be reformatted in any orientation to highlight certain disease processes.
FIGURE 440e-3 Cerebral abscess in a patient with fever and a right hemiparesis. A. Coronal postcontrast T1-weighted image demonstrates a ring-enhancing mass in the left frontal lobe. B. Axial diffusion-weighted image demonstrates restricted diffusion (high signal intensity) within the lesion, which in this setting is highly suggestive of cerebral abscess.
FIGURE 440e-4 Herpes simplex encephalitis in a patient presenting with altered mental status and fever. A. and B. Coronal (A) and axial (B) T2-weighted fluid-attenuated inversion recovery images demonstrate expansion and high signal intensity involving the right medial temporal lobe and insular cortex (arrows). C. Coronal diffusion-weighted image demonstrates high signal intensity indicating restricted diffusion involving the right medial temporal lobe and hippocampus (arrows) as well as subtle involvement of the left inferior temporal lobe (arrowhead). This is most consistent with neuronal death and can be seen in acute infarction as well as encephalitis and other inflammatory conditions. The suspected diagnosis of herpes simplex encephalitis was confirmed by cerebrospinal fluid polymerase chain reaction analysis.
FIGURE 440e-5 Susceptibility-weighted imaging in a patient with familial cavernous malformations. A. Noncontrast computed tomography scan shows one hyperdense lesion in the right hemisphere (arrow). B. T2-weighted fast spin echo image shows subtle low-intensity lesions (arrows). C. Susceptibility-weighted image shows numerous low-intensity lesions consistent with hemosiderin-laden cavernous malformations (arrow).
MR Contrast Material The heavy-metal element gadolinium forms the basis of all currently approved intravenous MR contrast agents. Gadolinium is a paramagnetic substance, which means that it reduces the T1 and T2 relaxation times of nearby water protons, resulting in a high signal on T1W images and a low signal on T2W images (the latter requires a sufficient local concentration, usually in the form of an intravenous bolus). Unlike iodinated contrast agents, the effect of MR contrast agents depends on the presence of local hydrogen protons on which it must act to achieve the desired effect. There are nine different gadolinium agents approved in the United States for use with MRI. These differ according the attached chelated moiety, which also affects the strength of chelation of the otherwise toxic gadolinium element. The chelating carrier molecule for gadolinium can be classified by whether it is macrocyclic or has linear geometry and whether it is ionic or nonionic. Most of these are excreted by the renal system. Cyclical agents are less likely to release the gadolinium element, and thus are considered the safest category.
ALLERGIC HYPERSENSITIVITY Gadolinium-DTPA (diethylenetriaminepentaacetic acid) does not normally cross the intact BBB immediately but will enhance lesions lacking a BBB (Fig. 440e-3A) as well as areas of the brain that normally are devoid of the BBB (pituitary, dura, choroid plexus). However, gadolinium contrast has been noted to slowly cross an intact BBB over time and especially in the setting of reduced renal clearance or inflamed meninges. The agents are generally well tolerated; overall adverse events after injection range from 0.07–2.4%. True allergic reactions are rare (0.004–0.7%) but have been reported. Severe life-threatening reactions are exceedingly rare; in one report, only 55 reactions out of 20 million doses occurred. However, the adverse reaction rate in patients with a prior history of reaction to gadolinium is eight times higher than normal. Other risk factors include atopy or asthma (3.7%); although there is no cross-reactivity to iodinated contrast material, those with a prior allergic response to iodine should be considered at higher risk. Gadolinium contrast material can be administered safely to children as well as adults, although these agents are generally avoided in those under 6 months of age.
NEPHROTOXICITY Contrast-induced renal failure does not occur with gadolinium agents. A rare complication, nephrogenic systemic fibrosis (NSF), has occurred in patients with severe renal insufficiency who have been exposed to gadolinium contrast agents. The onset of NSF has been reported between 5 and 75 days following exposure; histologic features include thickened collagen bundles with surrounding clefts, mucin deposition, and increased numbers of fibrocytes and elastic fibers in skin. In addition to dermatologic symptoms, other manifestations include widespread fibrosis of the skeletal muscle, bone, lungs, pleura, pericardium, myocardium, kidney, muscle, bone, testes, and dura. The American College of Radiology recommends that a glomerular filtration rate (GFR) assessment be obtained within 6 weeks prior to elective gadolinium-based MR contrast agent administration in patients with:
1. A history of renal disease (including solitary kidney, renal transplant, renal tumor)
2. Age >60 years
3. History of hypertension
4. History of diabetes
5. History of severe hepatic disease, liver transplant, or pending liver transplant; for these patients, it is recommended that the patient’s GFR assessment be nearly contemporaneous with the MR examination
The incidence of NSF in patients with severe renal dysfunction (GFR <30) varies from 0.19 to 4%. Other risk factors for NSF include acute kidney injury, the use of nonmacrocyclic agents, and repeated or high-dose exposure to gadolinium. The American College of Radiology Committee on Drugs and Contrast Media states that patients receiving any gadolinium-containing agent should be considered at risk of NSF if they are on dialysis (of any form); have severe or end-stage chronic renal disease (eGFR <30 mL/min/1.73 m2) without dialysis; eGFR of 30–40 mL/min/1.73 m2 without dialysis (as the GFR may fluctuate); or have acute renal insufficiency.
COMPLICATIONS AND CONTRAINDICATIONS
From the patient’s perspective, an MRI examination can be intimidating, and a higher level of cooperation is required than with CT. The patient lies on a table that is moved into a long, narrow gap within the magnet. Approximately 5% of the population experiences severe claustrophobia in the MR environment. This can be reduced by mild sedation but remains a problem for some. Because it takes between 3 and 10 min per sequence, movement of the patient during an MR exam distorts all of the images; therefore, uncooperative patients should either be sedated for the MR study or scanned with CT. Generally, children under the age of 8 years usually require conscious sedation in order to complete the MR examination without motion degradation.
MRI is considered safe for patients, even at very high field strengths. Serious injuries have been caused, however, by attraction of ferromagnetic objects into the magnet, which act as missiles if brought too close to the magnet. Likewise, ferromagnetic implants, such as aneurysm clips, may torque within the magnet, causing damage to vessels and even death. Metallic foreign bodies in the eye have moved and caused intraocular hemorrhage; screening for ocular metallic fragments is indicated in those with a history of metal work or ocular metallic foreign bodies. Implanted cardiac pacemakers are generally a contraindication to MRI owing to the risk of induced arrhythmias; however, some newer pacemakers have been shown to be safe. All health care personnel and patients must be screened and educated thoroughly to prevent such disasters because the magnet is always “on.” Table 440e-4 lists common contraindications for MRI.
|
COMMON CONTRAINDICATIONS TO MAGNETIC RESONANCE IMAGING |
Note: See also http://www.mrisafety.com.
MAGNETIC RESONANCE ANGIOGRAPHY
MR angiography is a general term describing several MR techniques that result in vascular-weighted images. These provide a vascular flow map rather than the anatomic map shown by conventional angiography. On routine spin echo MR sequences, moving protons (e.g., flowing blood, CSF) exhibit complex MR signals that range from high- to low-signal intensity relative to background stationary tissue. Fast-flowing blood returns no signal (flow void) on routine T1W or T2W spin echo MR images. Slower-flowing blood, as occurs in veins or distal to arterial stenosis, may appear high in signal. However, using special pulse sequences called gradient echo sequences, it is possible to increase the signal intensity of moving protons in contrast to the low signal background intensity of stationary tissue. This creates angiography-like images, which can be manipulated in three dimensions to highlight vascular anatomy and relationships.
So called time-of-flight (TOF) MRA relies on the suppression of nonmoving tissue to provide a low-intensity background for the high signal intensity of flowing blood entering the section; arterial or venous structures may be highlighted. A typical TOF MRA sequence results in a series of contiguous, thin MR sections (0.6–0.9 mm thick), which can be viewed as a stack and manipulated to create an angiographic image data set that can be reformatted and viewed in various planes and angles, much like that seen with conventional angiography (Fig. 440e-2G).
Phase-contrast MRA has a longer acquisition time than TOF MRA, but in addition to providing anatomic information similar to that of TOF imaging, it can be used to reveal the velocity and direction of blood flow in a given vessel. Through the selection of different imaging parameters, differing blood velocities can be highlighted; selective venous and arterial MRA images can thus be obtained. One advantage of phase-contrast MRA is the excellent suppression of high-signal-intensity background structures.
MRA can also be acquired during infusion of contrast material. Advantages include faster imaging times (1–2 min vs 10 min), fewer flow-related artifacts, and higher resolution images. Recently, contrast-enhanced MRA has become the standard for extracranial vascular MRA. This technique entails rapid imaging using coronal three-dimensional TOF sequences during a bolus infusion of gadolinium contrast agent. Proper technique and timing of acquisition relative to bolus arrival are critical for success.
[/not-level-membership-for-internal-medicine-category]
