Supraventricular Arrhythmias in a Realistic 3D Model of the Human Atria
Atrial arrhythmias are the most common sustained cardiac arrhythmias in humans. Atrial arrhythmias, mainly atrial fibrillation (AF), which often provoke disabling symptoms and severe complications,1 are considered major causes of morbidity and mortality.
Additionally, it has been observed that AF induces changes in the atrial myocardium that help to perpetuate the arrhythmia “AF begets AF.” These changes, called atrial remodeling, include alterations in the expression of various ion channels affecting electrical activity of the atrial cells and changes in anatomical structure. They have been described in animals2 and in humans.3,4 Changes in the electrical activity cause a decreased effective refractory period (ERP) and slowed conduction and reduction in rate adaptation of ERP,2,3 which may help the initiation and persistence of AF, as suggested by experimental studies.2,3
Despite significant advances in our knowledge about the mechanisms that lead to the onset and maintenance of atrial arrhythmias, they remain incompletely elucidated. It is thought that atrial arrhythmias can be caused by focal ectopic activity, localized reentry, or multiple propagating wavelets.4–9 It is important to understand the mechanisms of initiation and perpetuation of atrial arrhythmias because they have a strong influence in the design of antiarrhythmic therapies. Several experimental and clinical studies have shown that different mechanisms lead to differences in the characteristics of spatiotemporal organization of atrial arrhythmias.
Studies of the spatiotemporal organization of atrial arrhythmias are currently being performed by analyzing the electrograms (EGM) recorded at different points on the atrial surface using different signal analysis techniques, including analysis of EGM morphology,10,11 dominant frequency (DF),7,12,13 and regularity12 or organization indexes (OI).14
In recent high-density mapping studies, areas of complex fractionated atrial electrograms (CFAE) and high DF have been proposed as critical regions for the maintenance of AF6,8,15 and have become target sites for AF ablation. However, ablation of high-DF areas has proven to be incompletely effective in patients with persistent AF.12 In addition, it is not universally accepted that improvement in AF ablation occurs after CFAE ablation in patients with persistent AF.16
In recent years, computational modeling has provided a framework of multiscale integrated models for the study of cardiac arrhythmias.17,18 Computational cardiac models that simulate atrial activity have proved to be an important tool in facilitating understanding of the complex mechanisms underlying atrial arrhythmias. Computer simulations of atrial tissue have provided hypotheses that have been tested experimentally and, additionally, have been used to investigate and to explain experimental and clinical observations. This chapter reviews the insights provided by these atrial models, with emphasis on the contributions of three-dimensional (3D) atrial models, and shows various examples of atrial arrhythmias simulated using a realistic 3D model of human atria developed by our group.
Brief Summary of Atrial Computer Models
Several computer atrial models have been developed and used to study atrial arrhythmias and to evaluate the efficacy of different therapeutic approaches. The first was developed by Moe et al19 Using a cellular automata model, they suggested that AF can result from the activity of multiple independent wave fronts propagating simultaneously throughout the entire atria. The multiple wavelet hypothesis, as a mechanism underlying AF, was confirmed experimentally after several years.4 The development of comprehensive mathematical models of the electrophysiological activity of human atrial cells20–23 has provided a useful tool for investigating the contribution of different ionic currents to atrial arrhythmias. Dr. Jalife’s group have been pioneers in combining experiments with simulation studies to understand the origin and maintenance of AF. Using a simplified 2D model of human atrial tissue, they have shown the important role of the IK1 current in stabilizing rotors during chronic AF, and how the blockade of IKur or Ito can terminate rotor activity.24 On the other hand, a recent study using a 2D model of atrial tissue suggested that electrotonic interaction between myocytes and fibroblasts plays an important role in the genesis of CFAE.25
The first 3D model of the human atria, which combined a detailed cellular ionic model (Nygren cell model20) with realistic geometry, was presented by Harrild and Henriquez.26 They showed how bundles of atrial muscle including the crista terminalis (CT), the pectinate muscles (PM), Bachmannn’s bundle (BB), and the limbus of the fossa ovalis play an important role in determining spread of the propagation wave front. Vigmond et al27 presented a less geometrically realistic model but included morphologic details such as electrical interatrial communications, anisotropic conduction, and muscular structures. They observed how specific structures in the atria—coronary sinus (CS), CT, PM, and orifices such as inferior caval vein (ICV) and superior caval vein (SCV)—play an important role in reentrant activity. Lausanne’s group introduced a simplified fiber structure in a 3D model for studying the impact of anisotropy on the morphology of electrograms10 and later evaluated the effects of different ablation patterns in the treatment of AF,28 showing that the prediction of converting AF to sinus rhythm observed experimentally was very similar to what was predicted by the computer model.29 This model, in combination with clinical data, has also been used to show that atrial fibrillatory cycle length is an important predictor of AF duration and of the rate of AF termination by ablation.30 In 2006, Seeman et al used data extracted from a visible female dataset to develop a 3D model of the atria with great anatomical detail. They included anisotropic properties of the tissue and heterogeneous electrophysiological properties to study the contributions of different anatomical structures in normal atrial conduction.31 Aslanidi et al presented a multiscale computational model based on this 3D model that included a human torso model to study the mechanisms underlying atrial arrhythmias32 and to test the treatment efficacy of antiarrhythmic drugs.33 The effect of electrical versus structural remodeling on AF perpetuation has been studied using a 3D model based on Harrild and Henriquez’s work.26 It has been observed that both electrical remodeling and structural remodeling contribute to APD shortenings, whereas structural remodeling is the main contributor to reduced conduction velocity.34
All of the described 3D atrial models used a simplistic fiber structure lacking detailed description of fiber direction in the atria. In 2009, our group developed a 3D atrial model that integrated realistic geometry and structure, as well as heterogeneous electrical properties, with detailed fiber orientation in the whole atria.35–39 In recent reports,40,41 semiautomatic methods were used to incorporate atrial anisotropy (including fiber orientation) and heterogeneities into patient-specific 3D models based on geometries obtained from magnetic resonance imaging (MRI) data, gaining an important step toward the use of specific atrial models in the clinic.
Building a 3D Model of the Human Atria
Anatomical Characteristics
A realistic 3D model of human atria that includes fiber orientation was previously developed by our group.35–37 The original set of surfaces of the model was based on the work of Harrild and Henriquez.26 These surfaces were modified in accordance with data from the literature and histologic observations.42,43 The model comprises the main structures (Figure 35-1): left and right atrial chambers (LA and RA), 20 pectinate muscles (PM), the fossa ovalis (FO), Bachmann’s bundle (BB), the crista terminalis (CT), left and right appendages (LAPG and RAPG), left and right pulmonary veins (LPV and RPV), superior and inferior caval veins (SCV and ICV), the isthmus of RA, atrioventricular rings (AVR) and the coronary sinus (CS). The sinoatrial node (SAN) is situated near the ostium of the SCV.
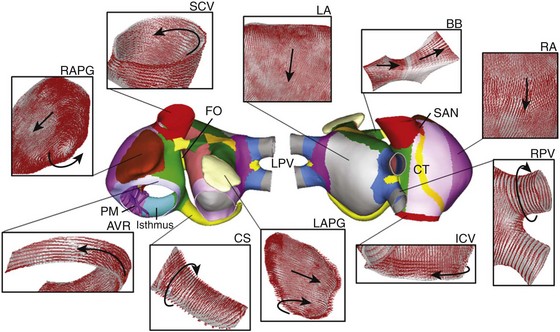
Figure 35-1 Frontal and dorsal views of the human atrial model. Colors represent areas with different fiber orientation. Arrows indicate the orientation of the fibers in the main areas of the atria. AVR, Atrioventricular rings; BB, Bachmann’s bundle; CS, coronary sinus; CT, crista terminalis; FO, fossa ovalis; ICV and SCV, inferior and superior caval veins; LA and RA, left and right atria; LAPG and RAPG, left and right appendages; PM, pectinate muscles; RPV and LPV, right and left pulmonary veins; SAN, sinoatrial node. (From Tobón, C, Ruiz-Villa C, Heidenreich E. et al: Three dimensional human atrial model with fiber orientation. Electrograms and arrhythmic activation patterns relationship. Plos One 8(2):1–13, 2013, Fig. 1.)
Several experimental observations have been made about the role of anatomical structure and electrophysiological heterogeneity in atrial electrical activity in both physiological and pathologic conditions.42,44 Notably, this atrial model includes a realistic fiber orientation based on histologic observations.42,45 The model was divided into 42 areas (see the colored zones in Figure 35-1), and a realistic fiber direction was assigned to each region. In Figure 35-1, the main areas of the model and their fiber orientation (indicated by arrows) are shown. It is noted that circulating muscle bundles42,46 around the CS, the LPV and RPV, the SCV and ICV, the AVR, and both appendages (RAPG and LAPG) are present, whereas BB, CT, and PM show aligned fibers along their longitudinal axes. The posterior walls of both atria (RA and LA) consist of mainly vertical fibers, whereas the fibers between the SCV and the ICV have a horizontal direction, provoking a complex arrangement of vertical, horizontal, and circular fibers in the ostium of the pulmonary veins.45
Electrophysiological Models
Nygren’s model20 of human atrial action potential (AP) was used to simulate cellular electrical activity. Electrophysiological heterogeneity was included to reproduce AP in different zones of the atria47: PM, CT, AVR, left and right appendages (APG), and atrial working myocardium (AWM), which includes the remaining atrial structures. To obtain these AP models, maximum conductance of It, IKr, and ICaL was modified.35 To reproduce electrical remodeling conditions, changes in conductance and kinetics of different ionic channels observed in experimental studies of permanent AF3,48 have been incorporated into these AP models. Maximum conductance for IK1 was increased by 250% and for ICaL and It was decreased by 74% and 85%, respectively; kinetics of the fast inactivation of ICaL was increased by 62%, the activation curve of It was shifted by +16 mV; and the inactivation curve of INa was shifted by +1.6 mV.49
Figure 35-2 shows the last AP obtained when a train of 10 stimuli at a basic cycle length of 1000 ms was applied for the different atrial cellular models considered (AWM, PM, CT, APG, and AVR) under both physiological (control) (Figure 35-2, A) and remodeling conditions (Figure 35-2, B). The APD90 values (see table in Figure 35-2, C) show that under control conditions, APD90 ranged from 180 ms to 307 ms. It is important to note, however, that atrial remodeling decreased the APD90 values in the whole atria (ranging from 56 ms to 92 ms) as well as the APD dispersion.
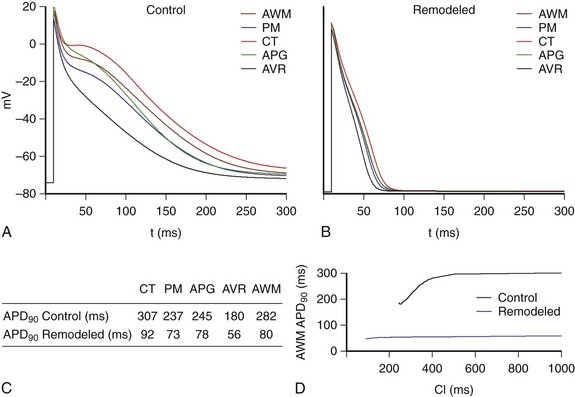
Figure 35-2 AP for the different types of atrial cells: crista terminalis (CT), pectinate muscles (PM), left and right appendages (APG), atrioventricular rings (AVR), and atria working myocardium (AWM), which includes the rest of the tissue; under (A) physiological conditions (control) and (B) remodeling conditions (remodeled), at a BCL = 1000 ms. C, APD90 values. D, Restitution curves for physiological and remodeling conditions for cells of the AWM. (From Tobón, C, Ruiz-Villa C, Heidenreich E. et al: Three dimensional human atrial model with fiber orientation. Electrograms and arrhythmic activation patterns relationship. Plos One 8(2):1–13, 2013, Fig. 3.)
Figure 35-2, D illustrates restitution curves for AWM, for both physiological (control) and electrically remodeled cells. It is possible to observe how the remodeling condition provokes a reduction in APD and in ADP rate adaptation, inducing a decrease in ERP and a reduction in rate adaptation of ERP, which will facilitate ectopic beat propagation.
Propagation and Atrial Electrograms
where Sv corresponds to the surface-to-volume ratio, D is the conductivity tensor, Cm is the specific membrane capacitance (50 pF), Iion is the total ionic current that crosses the membrane cells, Vm is the membrane potential, and Istim is the stimulus current. The monodomain equation was solved using a finite element method.
Conductivity values were assigned to obtain realistic conduction velocities observed in the different atrial zones: 25 cm/s in very slow regions (SAN), 54 cm/s in slow regions (PV), 120 cm/s in fast regions (BB, limbus of the FO and PM), and 143 cm/s in very fast regions (CT bundle), whereas the remaining atria had a conduction velocity of 69 cm/s.50,51 An anisotropic ratio of conductivity was also introduced in agreement with experimental data.51,52 The isthmus of the RA and the SAN were set isotropic, whereas an anisotropic ratio of 1 : 2 was used for BB, limbus of FO, PV, and AWM.52 Finally, an anisotropy ratio of 1 : 9 was used for CT.51
Unipolar pseudo-electrograms (EGM) were simulated in more than 43,000 points along the atrial surface. The extracellular potential (Φe) was calculated by the following equation53:
where ∇′Vm is the spatial gradient of transmembrane potential Vm, K is a constant that includes the ratio of intracellular and extracellular conductivities, r is the distance from the source point (x, y, z) to the measuring point (x′, y′, z′), and dv is the differential volume.
EGM on the entire atrial surface were processed with a 40- to 250-Hz band-pass filter, rectified, and further low-pass filtered at 20 Hz.54 Spectral analysis of the signals was then performed with fast Fourier transform (FFT), obtaining a spectral resolution of 0.12 Hz. The DF, defined as the frequency corresponding to the highest peak of the power spectrum, was determined. To measure frequency variability in the spectrum, the OI was also calculated. Spectral power of the DF and its three harmonic peaks were calculated by computing the area under the peaks. The OI was obtained as the ratio of this spectral power to the total power of the spectrum.14,54 False color DF and OI maps were constructed by assigning a color between blue and red to each point for lowest and highest values, respectively.
Atrial Activation during Sinus Rhythm
Normal atrial propagation patterns in sinus rhythm were simulated by applying a periodic stimulation of 10 beats, at a basic cycle length of 1000 ms, in the SAN area. Figures 35-3 depicts various snapshots of the propagation of the last beat applied for both physiological (Figure 35-3, A) and remodeling (Figure 35-3, B) conditions. As shown in the figures, the stimulus applied in the SAN region caused initiation of an almost triangular wave front that quickly spread to the ICV favored by high conductivity and anisotropy of the CT (see snapshots for 25 ms in Figure 35-3, A, B). The depolarizing wave propagated to the anterior septal portion of the LA through the interatrial BB, inducing the first activation of the LA after 46 ms (in normal atria) and 54 ms (in remodeled atria) from the SAN activation.
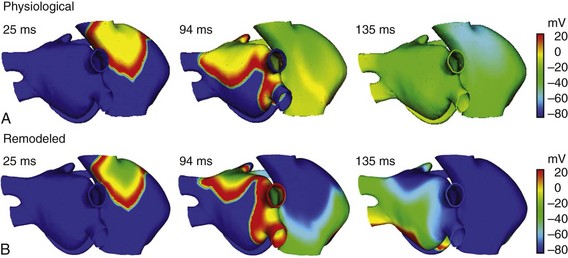
Figure 35-3 Snapshots of the propagation of the last stimulus applied in the SAN area (the 10th beat) for both physiological (A) and electrically remodeled atria (B). Colors represent the distribution of membrane voltage (AP values in mV) in the entire atria. Depolarized zones are illustrated by a red color, whereas repolarized zones are represented by a blue color.
Figure 35-3 also illustrated (see snapshots at 94 ms) the delay in propagation induced by remodeling conditions. The entire atrial depolarization occurred at 120 ms in normal conditions and at 138 ms in remodeled atria, ending in the distal LAPG. These values are in agreement with the values observed experimentally. Canavan et al55 showed that under physiological conditions, the last activation of atrial tissue occurred just before 120 ms. Another study56 observed the last activation of LA tissue at approximately 116 ms. It is interesting to note that the entire atria repolarized faster in remodeled conditions than under physiological conditions (see snapshots at 135 ms in Figure 35-3).
Atrial Arrhythmias in Electrically Remodeled Atria
After the 10th pulse was applied in the SAN area of the remodeled atria (see Figure 35-3, B), an ectopic focus (S2) was applied at different points of the atria. After the application of the bursts of six beats (S2) in the center of the posterior wall of the LA, the wave front induced by the ectopic focus fragmented, generating a reentrant activity (Figure 35-4). Different reentries in the RPV, SVC, and CT and wave fragmentations were observed (see snapshots at 3140 ms and 4824 ms in Figure 35-4, A). Thereafter, this complex activity became a more stable reentrant tachycardia rounded to RPV (see snapshot at 9317 ms in Figure 35-4, A), showing fragmentation of the wave front only in the CT arch area. The EGM calculated in three points of the LA—center of the posterior wall, center of the superior wall, and LAPG—and in three points of the RA—center of the posterior wall, CT, and RAPG—are shown in Figure 35-4, B. Figure 35-4, B also depicts the DF and OI values calculated from the spectral analysis of these EGM, using the method described in previous sections. In the entire atria, the EGM showed a stable and regular atrial activity (typical of a macro-reentrant atrial tachycardia) with single potentials, with the exception of the CT, where double potentials were observed as the result of fragmentation of the wave fronts that occurred in this region. Spectral analysis of the EGM also indicated organized and periodic overall activity, with DF values near 6 Hz and high OI values (near to 1), except in the CT with an OI of 0.84. It is noteworthy that the model reproduced stable and regular activation during reentrant atrial arrhythmias experimentally shown,57,58 and that the high OI values corresponded with this high regularity. Moreover, the model also reproduced the double potentials in the EGM recorded at points along the blocking line that become the CT, in accordance with experimental observations.11
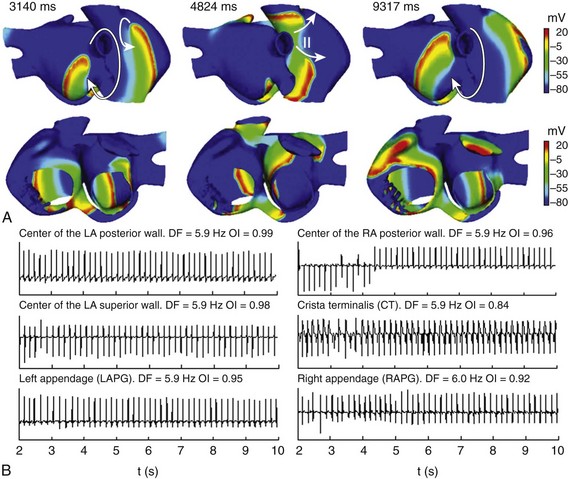
Figure 35-4 A, Snapshots of the reentrant activity observed in electrically remodeled atria when a burst of six beats (CL = 130 ms) was applied in the center of the LA posterior wall. Colors represent the distribution of membrane voltage (in mV). Depolarized zones are illustrated by a red color, whereas repolarized zones are represented by a blue color. Different reentries and wave fragmentations are observed before a reentrant activity is established around the RPV. Arrows indicate the direction of wave front propagation. The “••” indicates conduction block. B, EGM at different points of the atria. Values of DF and OI are illustrated. See text for details.
Upon application of the burst of six ectopic beats (S2) in the SCV, different reentrant mechanisms were observed (Figure 35-5). During the first few seconds, a reentrant tachycardia was maintained by a reentry wave front anchored in the CT area (see snapshot at 2549 ms in Figure 35-5, A). Very quickly (at approximately 5.5 s after initiation of reentrant tachycardia), the reentry that maintained the tachycardia collided and became a macro-reentry, turning the tricuspid annulus, starting a typical atrial flutter (AFL) (see snapshots at 5789 ms and 9965 ms in Figure 35-5, A). The EGM calculated at the six different points of the atria showed a change in morphology after the second 5.5, caused by the evolution from atrial tachycardia to typical AFL (Figure 35-5, B). During the first 5.5 seconds, the potentials are mainly simple in the entire atria, except in the CT, where double potentials are provoked by the wave front turning around the blocking line in this area. Thereafter, the model reproduced a typical AFL episode with the reentrant excitation traveling around the tricuspid valve ring, similar to that experimentally observed.59 This macro-reentry propagated to the rest of the atria with a 1 : 1 pattern of activation, according to experimental observations,60 provoking uniform and regular EGM in the entire atria with DF values near 5 Hz, in agreement with the range observed in humans (4.2 to 5.8).61 The OI values near to the unit in the whole atria also indicated high regularity in overall atrial activation. It is important to note that spectral analysis of the EGM was performed on the AFL pattern (the last 4.5 seconds of simulation).
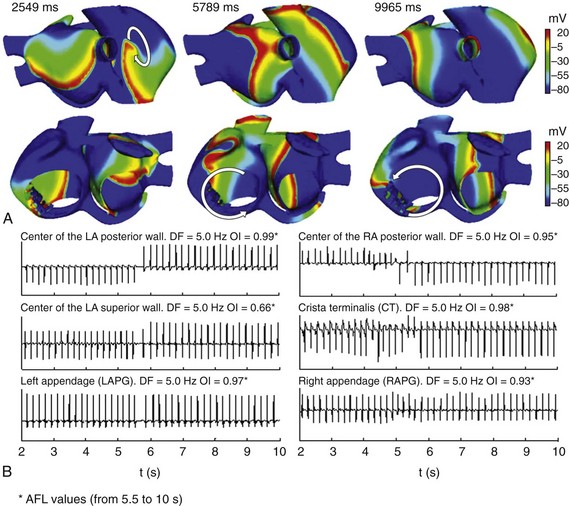
Figure 35-5 A, Snapshots of the reentrant activity observed in the electrically remodeled atria when a burst of six beats (CL = 130 ms) was applied in the SCV. Colors represent the distribution of membrane voltage (in mV). Depolarized zones are illustrated by a red color, whereas repolarized zones are represented by a blue color. In the first seconds, reentrant activity was maintained by reentry anchors in the CT. At 5.5 s, this reentrant activity became a typical AFL. Arrows indicate the direction of wave front propagation. B, EGM at different points of the atria. Values of DF and OI for these different points, calculated taking into account only the flutter activity (AFL), are illustrated. See text for details.
When the ectopic focus S2 (burst of six beats) was applied at the base of the RPV, an AF maintained by different reentrant patterns in the LA was observed (see Figure 35-6). Initially, a rotor was triggered in the posterior wall of the LA, while fragmentations and collisions of wave fronts, mainly at the level of CT, were observed (see snapshot at 3701 ms in Figure 35-6, A). AF was then maintained by figure-of-eight reentries and macro-reentries in the LA, whereas fragmentation of wave fronts and reentries around the CT continued in the RA (see snapshot at 9303 ms in Figure 35-6, A); at the end of simulation, it was possible to observe a rotor in the posterior wall of the LA (see snapshot at 9663 ms in Figure 35-6, A).
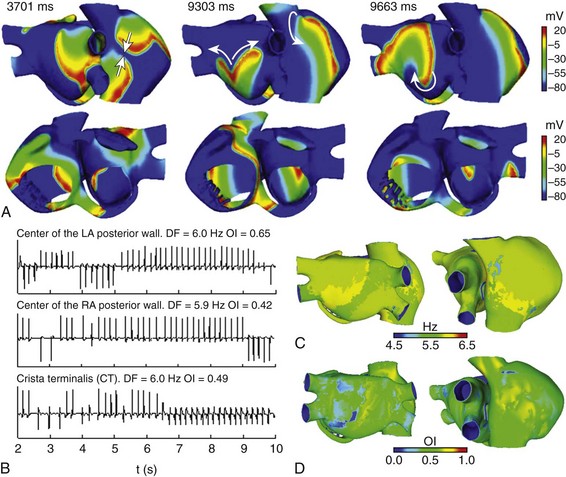
Figure 35-6 A, Snapshots of the AF induced in the electrically remodeled atria when a burst of six beats (CL = 130 ms) was applied at the base of the RPV. Colors represent the distribution of membrane voltage (in mV). Depolarized zones are illustrated by a red color, whereas repolarized zones are represented by a blue color. Different reentries are observed in LA, whereas wave fragmentations are shown in RA. Arrows indicate the direction of wave front propagation. B, EGM at different points of the atria. Values of DF and OI are illustrated. C and D, DF and OI maps calculated by processing more than 43,000 EGM; red color indicates the highest values and blue color the lowest values, according to the color scale. See text for details.
The EGM calculated at various points in the atria (see Figure 35-6, B) present mainly polymorphic single potentials. Double potentials and fragmented potentials (CFAE) are observed at pivot points, conduction blocks, and wave fragmentations. CL variations are also shown. Spectral analysis showed similar DF values and low OI values for the entire atria, accordingly with its irregular activity. To show distribution of DF and OI values throughout the whole atria, we developed DF and OI maps by processing more than 43,000 unipolar EGM distributed along the atrial surface. DF maps (see Figure 35-6, C) depict atrial zones with slight DF differences around a value of 5.8 Hz, whereas OI maps (see Figure 35-6, D) show how the overall atrial activity presents a low degree of organization (lower than 0.7).
The application of an ectopic focus S2 of continuous activity at the base of the RPV induced multiple fronts of reentry with irregular trajectories (see Figure 35-7). Zones of LA are activated periodically by the ectopic focus, and wave fragmentation and collisions are mainly observed throughout the rest of the atria (see snapshots at 3825 ms and 5928 ms in Figure 35-7, A). Rotors that collided and fragmented creating new wavefronts are mainly observed in RA (see snapshot at 7906 ms in Figure 35-7, A). In points near the ectopic focus, the EGM showed rapid and regular atrial activation with the highest DF and OI values, 7.7 Hz and 0.83, respectively, in the EGM of the center of the LA posterior wall (see Figure 35-7, B). However, in the posterior wall of the RA and in the CT, the EGM presented polymorphic potentials and CL variations. For this case, the DF map (see Figure 35-7, C) indicated that the entire LA was activated homogeneously at high frequency (around 7.7 Hz), whereas RA was activated at a lower frequency (around 5 Hz) with slightly higher DF values in small areas of SCV, tricuspid ring, and posterior wall. The OI map (see Figure 35-7, D) showed a high degree of organization in various zones of the LA, such as in part of the posterior wall and in areas of the inferior wall, with the highest OI values (close to 1) at the site of the application of ectopic focus and in neighboring areas. In the RA, a low degree of organization can be observed with OI values of ≈0.3 in some areas. These results are in accordance with clinical observations in which low OI values were observed in areas where multiple wave fronts interacted, whereas high OI values were associated with the source that maintained the AF.54
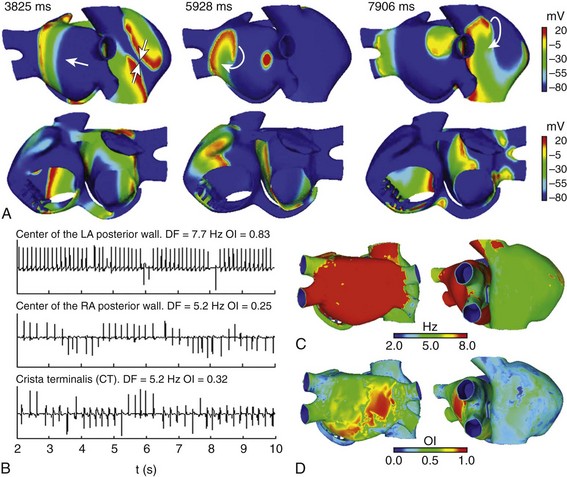
Figure 35-7 A, Snapshots of the AF induced in the electrically remodeled atria when a continuous ectopic focus was applied at the base of the RPV. Colors represent the distribution of membrane voltage (in mV). Depolarized zones are illustrated by a red color, whereas repolarized zones are represented by a blue color. Regular activation is observed in points near the focus area, whereas rotors, fragmentation, and collisions are observed in the rest of the atria. Arrows indicate the direction of wave front propagation. B, EGM at different points of the atria. Values of DF and OI are illustrated. C and D, DF and OI maps calculated by processing more than 43,000 EGM; red color indicates the highest values and blue color the lowest values, according to the color scale. See text for details.
Atrial Fibrillation Ablation
Surgical ablation is one of the most common treatments for AF. The surgical Maze III procedure, introduced by Cox et al,62 consists of creating lines of blockage to prevent all possible reentrant circuits in both atria. Although Maze III has proven its efficacy in terms of AF termination,63,64 it affects the correct mechanical activity of the atria during sinus rhythm.63 Since the introduction of Maze III, various ablation strategies have been tested to limit the number and length of ablation lines and, as a result, reduce undesirable damage to the atria.65,66 Evaluation of the effectiveness of different ablation patterns is usually performed in experimental and clinical studies. Recently, computer models have also been used to systematically evaluate the efficacy of different combinations of the ablation lines.29
Using the 3D model of human atria, we have simulated the effects of application of two ablation procedures on the AF pattern induced by application of a burst of six beats at the base of the RPV (shown in Figure 35-6). After AF was initiated, 10 seconds from starting the application of the burst, ablation lines were introduced in the model following two patterns: Maze III (Figure 35-8, A) and left-sided partial Maze (Figure 35-8, B). The ablation lines were of two to three elements of thickness and zero conductivity, simulating perfect transmural obstacles to the wave front propagation. Maze III consisted of ten lines localized in both RA and LA,62 whereas the left-sided partial Maze consisted of only four lines in LA.66 Figure 35-8, A depicts AF progression after the application of Maze III. It is possible to observe that Maze III finished AF in less than 1 second, and the entire atria reached a resting state awaiting the next SAN beat (see snapshot at 314 ms in Figure 35-8, A). The ablation lines in LA blocked the rotors in this area, which maintained FA (see previous section). Simultaneously, lines in the RA blocked reentrant wave fronts and the fragmentations observed in this area. However, when left-sided partial Maze was applied, the AF did not stop but became a reentrant tachycardia around the CT (see Figure 35-8, B). In this case, the ablation lines blocked the rotors in the LA, but RA could maintain the reentrant activity around a blocking line in the CT (see snapshot at 9660 ms in Figure 35-8, B). Fragmentations and collisions were not observed in the RA, thereby a stable reentrant tachycardia was established. It has been reported that atrial tachycardia follows AF ablation in a high percentage of patients, ranging from 1% to 50%.16,67 Although surgical ablation procedures are common interventions, and a great number of investigators have attempted to optimize their efficacy, no universally accepted strategies for ablation are known, and only international recommendations can be reached, such as the recent Heart Rhythm Society (HRs)/European Heart Rhythm Association (EHRA)/European Carbon Arrhythmia Society (ECAS) expert consensus statement on catheter and surgical ablation of atrial fibrillation.16
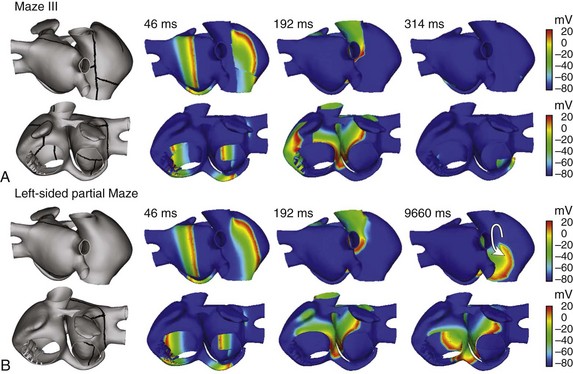
Figure 35-8 Snapshots illustrating the evolution of the AF obtained by the application of a burst of six beats at the base of the RPV (see Figure 35-3) when two different ablation patterns were applied. Ablation lines are indicated in the left figures and consist of applying zero conductivity in elements along the line, 10 seconds after application of the burst. A, Maze III ablation patterns finished AF very quickly. B, Left-sided partial Maze did not stop AF, but it converts AF into reentrant tachycardia. Arrow indicates the direction of the reentry. See text for details.
References
1. Wolf, P, Benjamin, E, Belanger, A, et al. Secular trends in the prevalence of atrial fibrillation: The Framingham study. Am Heart J. 1996; 113:790–796.
2. Nattel, S. New ideas about atrial fibrillation 50 years on. Nature. 2002; 415:219–226.
3. Workman, AJ, Kane, AK, Rankin, AC. The contribution of ionic currents to changes in refractoriness of human atrial myocytes associated with chronic atrial fibrillation. Cardiovasc Res. 2001; 52:226–235.
4. Allessie, MA, Bonke, FI, Schopman, FJ. Circus movement in rabbit atrial muscle as a mechanism of tachycardia. III. The “leading circle” concept: A new model of circus movement in cardiac tissue without the involvement of an anatomical obstacle. Circ Res. 1977; 41:9–18.
5. Haissaguerre, M, Jais, P, Shah, DC, et al. Spontaneous initiation of atrial fibrillation by ectopic beats originating in the pulmonary veins. N Engl J Med. 1998; 339:659–666.
6. Mandapati, R, Skanes, A, Chen, J, et al. Stable microreentrant sources as a mechanism of atrial fibrillation in the isolated sheep heart. Circulation. 2000; 101:194–199.
7. Berenfeld, O, Mandapati, R, Dixit, S, et al. Spatially distributed dominant excitation frequencies reveal hidden organization in atrial fibrillation in the Langendorff-perfused sheep heart. J Cardiovasc Electrophysiol. 2000; 11:869–879.
8. Mansour, M, Mandapati, R, Berenfeld, O, et al. Left-to-right gradient of atrial frequencies during acute atrial fibrillation in the isolated sheep heart. Circulation. 2001; 103:2631–2636.
9. Jalife, J. Rotors and spiral waves in atrial fibrillation. J Cardiovasc Electrophysiol. 2003; 14:776–780.
10. Jacquemet, V. A Biophysical Model of Atrial Fibrillation and Electrograms: Formulation, Validation and Applications [PhD thesis]. Lausanne: École Polytechnique Fédérale de Lausanne; 2004.
11. Konings, KT, Smeets, JL, Penn, OC, et al. Configuration of unipolar atrial electrograms during electrically induced atrial fibrillation in humans. Circulation. 1997; 95:1231–1241.
12. Sanders, P, Berenfeld, O, Hocini, M, et al. Spectral analysis identifies sites of high-frequency activity maintaining atrial fibrillation in humans. Circulation. 2005; 112:789–797.
13. Lin, YJ, Tai, CT, Chen, SA. Can mapping and ablation of atrial fibrillation be guided by frequency analysis of fibrillatory waves? J Cardiovasc Electrophysiol. 2006; 17:S44–S49.
14. Everett, TH, Wilson, EE, Verheule, S, et al. Structural atrial remodeling alters the substrate and spatiotemporal organization of atrial fibrillation: A comparison in canine models of structural and electrical atrial remodeling. Am J Physiol Heart Circ Physiol. 2006; 291:H2911–H2923.
15. Nademanee, K, Lockwood, E, Oketani, N, et al. Catheter ablation of atrial fibrillation guided by complex fractionated atrial electrogram mapping of atrial fibrillation substrate. J Cardiol. 2010; 55:1–12.
16. Calkins, H, Kuck, KH, Cappato, R, et al. HRS/EHRA/ECAS Expert consensus statement on catheter and surgical ablation of atrial fibrillation: Recommendations for patient selection, procedural techniques, patient management and follow-up, definitions, endpoints, and research trial design. Europace. 2012; 14:528–590.
17. Noble, D. Modeling the heart—from genes to cells to the whole organ. Science. 2002; 295:1678–1682.
18. Rudy, Y, From genes and molecules to organs and organisms: Heart. Comprehensive Biophysics: Textbook of Simulation and Modeling. Egelman, EH, eds. Comprehensive Biophysics: Textbook of Simulation and Modeling; vol 9. Academic Press, Oxford, 2012:268–327.
19. Moe, GK, Rheinboldt, WC, Abildskov, JA. A computer model of atrial fibrillation. Am Heart J. 1964; 67:200–220.
20. Nygren, A, Fiset, C, Firek, L, et al. Mathematical model of an adult human atrial cell: The role of K+ currents in repolarization. Circ Res. 1998; 82:63–81.
21. Courtemanche, M, Ramirez, RJ, Nattel, S. Ionic mechanisms underlying human atrial action potential properties: Insights from a mathematical model. Am J Physiol. 1998; 275:H301–H321.
22. Maleckar, MM, Greenstein, JL, Giles, WR, et al. Electrotonic coupling between human atrial myocytes and fibroblasts alters myocyte excitability and repolarization. Biophys J. 2009; 97:2179–2190.
23. Grandi, E, Pandit, SV, Voigt, N, et al. Human atrial action potential and Ca2+ model: Sinus rhythm and chronic atrial fibrillation. Circ Res. 2009; 109:1055–1066.
24. Pandit, SV, Berenfeld, O, Anumonwo, JM, et al. Ionic determinants of functional reentry in a 2-D model of human atrial cells during simulated chronic atrial fibrillation. Biophys J. 2005; 88:3806–3821.
25. Ashihara, T, Haraguchi, R, Nakazawa, K, et al. The role of fibroblasts in complex fractionated electrograms during persistent/permanent atrial fibrillation: Implications for electrogram-based catheter ablation. Circ Res. 2012; 110:275–284.
26. Harrild, D, Henriquez, C. A computer model of normal conduction in the human atria. Circ Res. 2000; 87:E25–E36.
27. Vigmond, EJ, Ruckdeschel, R, Trayanova, N. Reentry in a morphologically realistic atrial model. J Cardiovasc Electrophysiol. 2001; 12:1046–1054.
28. Ruchat, P, Dang, L, Virag, N, et al. A biophysical model of atrial fibrillation to define the appropriate ablation pattern in modified maze. Eur J Cardiothorac Surg. 2001; 31:65–69.
29. Dang, L, Virag, N, Ihara, Z, et al. Evaluation of ablation patterns using a biophysical model of atrial fibrillation. Ann Biomed Eng. 2005; 33:465–474.
30. Haïssaguerre, M, Lim, KT, Jacquemet, V, et al. Atrial fibrillatory cycle length: Computer simulation and potential clinical importance. Europace. 2007; 9:v64–v70.
31. Seemann, G, Hoper, C, Sachse, FB, et al. Heterogeneous three-dimensional anatomical and electrophysiological model of human atria. Philos Transact A Math Phys Eng Sci. 2006; 364:1465–1481.
32. Aslanidi, OV, Colman, MA, Stott, J, et al. 3D virtual human atria: A computational platform for studying clinical atrial fibrillation. Prog Biophys Mol Biol. 2011; 107:156–168.
33. Aslanidi, OV, Al-Owais, M, Benson, AP, et al. Virtual tissue engineering of the human atrium: Modeling pharmacological actions on atrial arrhythmogenesis. Eur J Pharm Sci. 2012; 46:209–221.
34. Krogh-Madsen, T, Abbott, GW, Christini, DJ. Effects of electrical and structural remodeling on atrial fibrillation maintenance: A simulation study. PLoS Comput Biol. 2012; 8:e1002390.
35. Tobón, C, Ruiz-Villa, CA, Heidenreich, E, et al, Effect of the ectopic beats location on vulnerability to reentries in a three-dimensional realistic model of human atrium. Programs and Abstracts of the 36th Annual International Conference of Computers in Cardiology. 2009:449–452.
36. Ruiz-Villa, CA. Estudio de la vulnerabilidad a reentradas a través de modelos matemáticos y simulación de la aurícula humana [PhD thesis]. Valencia: Universitat Politècnica de València; 2010.
37. Tobón, C. Modelización y evaluación de factores que favorecen las arritmias auriculares y su tratamiento mediante técnicas quirúrgicas [PhD thesis]. Valencia: Universitat Politécnica de València; 2010.
38. Tobón, C, Rodríguez, JF, Ferrero, JM, et al. Dominant frequency and organization index maps in a realistic 3D computational model of atrial fibrillation. Europace. 2012; 14:v25–v32.
39. Tobón C, Ruiz-Villa CA, Heidenreich E, et al: A three-dimensional human atrial model with fiber orientation: Electrograms and arrhythmic activation patterns relationship. PloS ONE accepted.
40. Krueger, MW, Schmidt, V, Tobón, C, et al, Modeling atrial fiber orientation in patient-specific geometries: A semi-automatic rule-based approach. Programs and Abstracts of the 6th International Conference on Functional Imaging and Modeling of the Heart. 2011:223–232.
41. McDowell, KS, Vadakkumpadan, F, Blake, R, et al. Methodology for patient-specific modeling of atrial fibrosis as a substrate for atrial fibrillation. J Electrocardiol. 2012; 45:640–645.
42. Ho, SY, Anderson, RH, Sanchez-Quintana, D. Atrial structure and fibres: Morphologic bases of atrial conduction. Cardiovasc Res. 2002; 54:325–336.
43. Cohen, GI, White, M, Sochowski, RA, et al. Reference values for normal adult transesophageal echocardiographic measurements. J Am Soc Echocardiogr. 1995; 8:221–230.
44. Wilders, R, Wagner, MB, Golod, DA, et al. Effects of anisotropy on the development of cardiac arrhythmias associated with focal activity. Pflugers Arch. 2000; 441:301–312.
45. Nathan, H, Eliakim, M. The junction between the left atrium and the pulmonary veins: An anatomic study of human hearts. Circulation. 1966; 34:412–422.
46. Ho, S, Sanchez-Quintana, D. The importance of atrial structure and fibers. Clin Anat. 2009; 22:52–63.
47. Feng, J, Yue, L, Wang, Z, et al. Ionic mechanisms of regional action potential heterogeneity in the canine right atrium. Circ Res. 1998; 83:541–551.
48. Bosch, RF, Zeng, X, Grammer, JB, et al. Ionic mechanisms of electrical remodeling in human atrial fibrillation. Cardiovasc Res. 1999; 44:121–131.
49. Zhang, H, Liu, J-H, Garratt, CJ, et al, Cellular modelling of electrical remodelling in two different models of human atrial myocytes. Presented at the 30th Annual International Conference of Computers in Cardiology. 2003:777–780.
50. Boineau, JP, Canavan, TE, Schuessler, RB, et al. Demonstration of a widely distributed atrial pacemaker complex in the human heart. Circulation. 1988; 77:1221–1237.
51. Hansson, A, Holm, M, Blomstrom, P, et al. Right atrial free wall conduction velocity and degree of anisotropy in patients with stable sinus rhythm studied during open heart surgery. Eur Heart J. 1998; 19:293–300.
52. Kleber, AG, Rudy, Y. Basic mechanisms of cardiac impulse propagation and associated arrhythmias. Physiol Rev. 2004; 84:431–488.
53. Clayton, RH, Holden, AV. Propagation of normal beats and re-entry in a computational model of ventricular cardiac tissue with regional differences in action potential shape and duration. Prog Biophys Mol Biol. 2004; 85:473–499.
54. Takahashi, Y, Sanders, P, Jais, P, et al. Organization of frequency spectra of atrial fibrillation: Relevance to radiofrequency catheter ablation. J Cardiovasc Electrophysiol. 2006; 17:382–388.
55. Canavan, TE, Schuessler, RB, Cain, ME, et al. Computerized global electrophysiological mapping of the atrium in a patient with multiple supraventricular tachyarrhythmias. Ann Thorac Surg. 1988; 46:232–235.
56. Lemery, R, Guiraudon, G, Veinot, JP. Anatomic description of Bachmann’s bundle and its relation to the atrial septum. Am J Cardiol. 2003; 91:1482–1485.
57. Kalman, JM, Olgin, JE, Karch, MR, et al. “Cristal tachycardias”: Origin of right atrial tachycardias from the crista terminalis identified by intracardiac echocardiography. J Am Coll Cardiol. 1998; 31:451–459.
58. Ryu, K, Sahadevan, J, Khrestian, CM, et al. Use of fast Fourier transform analysis of atrial electrograms for rapid characterization of atrial activation—Implications for delineating possible mechanisms of atrial tachyarrhythmias. J Cardiovasc Electrophysiol. 2006; 17:198–206.
59. Saoudi, N, Cosío, F, Waldo, A, et al. A classification of atrial flutter and regular atrial tachycardia according to electrophysiological mechanisms and anatomical bases; a Statement from a Joint Expert Group from The Working Group of Arrhythmias of the European Society of Cardiology and the North American Society of Pacing and Electrophysiology. Eur Heart J. 2001; 22:1161–1182.
60. Friedman, PA, Luria, D, Fenton, AM, et al. Global right atrial mapping of human atrial flutter: The presence of posteromedial (sinus venosa region) functional block and double potentials: A study in biplane fluoroscopy and intracardiac echocardiography. Circulation. 2000; 101:1568–1577.
61. Olshansky, B, Wilber, DJ, Hariman, RJ. Atrial flutter—Update on the mechanism and treatment. Pacing Clin Electrophysiol. 1992; 15:2308–2335.
62. Cox, JL. The surgical treatment of atrial fibrillation. IV. Surgical technique. J Thorac Cardiovasc Surg. 1991; 101:584–592.
63. Cox, JL, Schuessler, RB, Lappas, DG, et al. An 8½-year clinical experience with surgery for atrial fibrillation. Ann Surg. 1996; 224:267–273.
64. Khargi, K, Lemke, B, Deneke, T. Concomitant anti-arrhythmic procedures to treat permanent atrial fibrillation in CABG and AVR patients are as effective as in mitral valve patients. Eur J Cardiothorac Surg. 2005; 27:841–846.
65. Sie, HT, Beukema, WP, Elvan, A, et al. New strategies in the surgical treatment of atrial fibrillation. Cardiovasc Res. 2003; 58:501–509.
66. Sueda, T, Nagata, H, Orihashi, K, et al. Efficacy of a simple left atrial procedure for chronic atrial fibrillation in mitral valve operations. Ann Thorac Surg. 1997; 63:1070–1075.
67. Kobza, R, Kottkamp, H, Dorszewski, A, et al. Stable secondary arrhythmias late after intraoperative radiofrequency ablation of atrial fibrillation: Incidence, mechanism, and treatment. J Cardiovasc Electrophysiol. 2004; 15:1246–1249.