Chapter 6 Supplementary techniques including blood parasite diagnosis
Tests for the acute-phase response
Inflammatory response to tissue injury includes alteration in serum protein concentration, especially increases in fibrinogen, haptoglobin, caeruloplasmin, immunoglobulins (Ig) and C-reactive protein (CRP), and decrease in albumin. The changes occur in acute infection, during active phases of chronic inflammation, with malignancy, in acute tissue damage (e.g. following acute myocardial infarction) with physical injury. Measurement of the acute-phase response is a helpful indicator of the presence and extent of inflammation or tissue damage and response to treatment. The usual tests are estimation of CRP and measurement of the erythrocyte sedimentation rate (ESR); some studies have suggested that plasma viscosity is also a useful indicator, but there is debate on the relative value of theses tests.1,2
Kits that are sensitive and precise are available for CRP assay; small increases in serum levels of CRP can often be detected before any clinical features become apparent, whereas as a tissue-damaging process resolves, the serum level rapidly decreases to within the normal range (<5 mg/l). The ESR is slower to respond to acute disease activity and it is insensitive to small changes in disease activity. It is less specific than CRP because it is also influenced by immunoglobulins (which are not acute-phase reactants) and by anaemia. Moreover, because the rate of change of ESR is slower than that of CRP, it rarely reflects the current disease activity and clinical state of the patient as closely as the CRP. The ESR is a useful screening test, and the conventional manual ESR method is simple, cheap and not dependent on power supply, thus making it suitable for point-of-care (near-patient) testing. It is recommended that, in clinical practice, both tests should be carried out in tandem.3 Because CRP assay is a biochemical test usually performed in the clinical chemistry laboratory, it will not be discussed further here.
Erythrocyte Sedimentation Rate
The method for measuring the ESR recommended by the International Council for Standardization in Haematology (ICSH)4 and also by various national authorities5 is based on that of Westergren, who developed the test in 1921 for studying patients with pulmonary tuberculosis. ESR is the measurement of the sedimentation of red cells in diluted blood after standing for 1 h in an open-ended glass tube of 30 cm length mounted vertically on a stand.
Conventional Westergren Method
Method
The method described below, originally described by the International Council for Standardization in Haematology (ICSH)4 and now adopted by the Clinical and Laboratory Standards Institute (CLSI) as its approved method,5 is intended to provide a reference method for verifying the reliability of any modification of the test.
Range in health
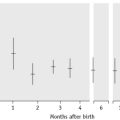
The mean values and the upper limit for 95% of normal adults are given in Table 6.1. There is a progressive increase with age, but it is difficult to define a strictly healthy population for determining normal values in individuals older than 70 years.6 In the newborn, the ESR is usually low. In childhood and adolescence, it is the same as for normal men with no differences between boys and girls. It is increased in pregnancy, especially in the later stages, and independent of anaemia;7 this is due to the physiological effect of haemodilution (an increase in the plasma volume)
| Age range (years) | ESR mean MM IN 1 H |
|---|---|
| 10–19 | 8 |
| 20–29 | 10.8 |
| 30–39 | 10.4 |
| 40–49 | 13.6 |
| 50–59 | 14.2 |
| 60–69 | 16 |
| 70–79 | 16.5 |
| 80–91 | 15.8 |
| Pregnancy | |
| Early gestation | 48 (62 if anaemic) |
| Later gestation | 70 (95 if anaemic) |
In the newborn, the ESR has been reported to be 0–2 mm in 1 h, increasing to 4 mm in 1 h at 1 week, up to 17 mm in 1 h by day 14, and then 10–20 mm in 1 h for both girls and boys, until puberty.8 However, as the studies in infants were obtained by the capillary method, they are not strictly comparable to the Westergren method.
Modified methods
Time
Sedimentation is measured after aggregation has occurred and before the cells start to pack, usually at 18–24 min. From the rate during this time period the sedimentation that would have occurred at 60 min is derived and converted to the conventional ESR equivalent by an algorithm.9
Sloping tube
Red cells sediment more quickly when streaming down the wall of a sloped tube. This phenomenon has been incorporated into automated systems in which the end-point is read after 20 min with the tube held at an angle of 18° from the vertical.10 Incorporating a low-speed centrifugation step (approx. 800 rpm) in this automated method reduces the end-point time further.11 These have been shown to give results comparable to the conventional method.
Quality Control
The standardized method can be used as a quality-control procedure for routine tests or alternatively stabilized whole blood preparations which are now available are suitable as a daily control for use with automated systems (e.g. ESR-Chex).12 Three or four specimens of EDTA blood kept at 4°C will also serve as a control on the following day.
Another control procedure is to calculate the daily cumulative mean, which is relatively stable when at least 100 specimens are tested each day in a consistent setting (see Chapter 25). A coefficient of variation of <15% between daily sets appears to be a satisfactory index for monitoring instrument performance.13
Semiquantitative Slide Method
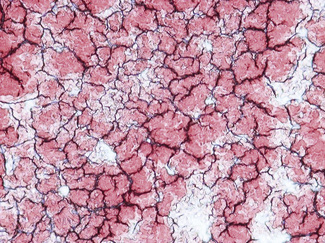
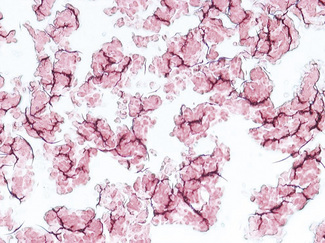
Enhanced red cell adhesion/aggregation can be demonstrated by allowing a drop of citrated blood to dry on a slide. An estimate of the amount of cell aggregation on the film by image analysis provides a semiquantitative measure of the acute-phase response that appears to correlate with the ESR.14 Based on this principle, serial microscopic images of red cells aggregating on a glass slide taken every 30 s for 5 min can distinguish a normal ESR from a high value (Figs 6.1, 6.2). The images demonstrate greater spacing of cells in blood with higher ESR values compared with blood with lower ESR values.
Mechanism of Erythrocyte Sedimentation
An elevated ESR occurs as an early feature in myocardial infarction.15 Although a normal ESR cannot be taken to exclude the presence of organic disease, the vast majority of acute or chronic infections and most neoplastic and degenerative diseases are associated with changes in the plasma proteins that lead to an acceleration of sedimentation. An increased ESR in subjects who are HIV seropositive seems to be an early predictive marker of progression toward acquired immune deficiency syndrome (AIDS).16 The ESR is less helpful in countries where chronic diseases are rife; however, one study has shown that very high ESRs (higher than 100 mm/h) have a specificity of 0.99 and a positive predictive value of 0.9 for an acute or chronic infection.17 The ESR is influenced by age, stage of the menstrual cycle and medications taken (corticosteroids, contraceptive pills). It is especially low (0–1 mm) in polycythaemia, hypofibrinogenaemia and congestive cardiac failure and when there are abnormalities of the red cells such as poikilocytosis, spherocytosis, or sickle cells. In cases of performance-enhancing drug intake by athletes (discussed below) the ESR values are generally lower than the usual value for the individual and as a result of the increase in haemoglobin (i.e. the effect of secondary polycythaemia).
Plasma Viscosity
The ESR and plasma viscosity generally increase in parallel with each other.1 Plasma viscosity is, however, primarily dependent on the concentration of plasma proteins, especially fibrinogen, and it is not affected by anaemia. Changes in the ESR may lag behind changes in plasma viscosity by 24–48 h, and viscosity seems to reflect the clinical severity of disease more closely than does the ESR.18
There are several types of viscometers, including rotational and capillary types that are suitable for routine use1 and, as for ESR methods, automated closed-tube methods are available.19 The main use of plasma viscosity is in the investigation of individuals with suspected hyperviscosity, myeloma and macroglobulinaemia. In conjunction with the ESR and CRP, the plasma viscosity can be used as a marker for inflammation. The viscosity test should be carried out as described in the instruction manual for the particular instrument used.
Reference Values
Each laboratory should establish its own reference values for plasma viscosity. As a general guide, ICSH has recorded that with the Harkness capillary viscometer normal plasma has a viscosity of 1.16–1.33 mPa/s (if expressed in poise (P), 1 cP = 1 mPa/s) at 37°C and 1.50–1.72 mPa/s at 25°C.20 Plasma viscosity is lower in the newborn (0.98–1.25 mPa/s at 37°C), increasing to adult values by the 3rd year; it is slightly higher in old age. There are no significant differences in plasma viscosity between men and women or in pregnancy. It is remarkably constant in health, with little or no diurnal variation, and it is not affected by exercise. A change of only 0.03–0.05 mPa/s is thus likely to be clinically significant.
Whole blood viscosity
Guidelines for measuring blood viscosity and red cell deformability by standardized methods have been published.21 Rotational and capillary viscometers are suitable for measuring blood viscosity; deformability can be measured by recording the rate at which red cells in suspension pass through a filter with pores 3–5 mm in diameter.
Heterophile antibodies in serum: diagnosis of infectious mononucleosis
Infectious mononucleosis (IM) is caused by Epstein–Barr virus.22 The immune response that develops in response to virus-infected cells includes not only antibodies to viral antigens but also characteristic heterophile antibodies. Before the nature of this reaction was understood, Paul and Bunnell23 demonstrated the antibodies as agglutinins directed against sheep red cells. They are, in fact, not specific for sheep red cells but also react with horse and ox, but not human, red cells. They are IgM globulins, which are immunologically related to, but distinct from, antibodies that occur in response to the Forssman antigens. The latter are widely spread in animal tissue; they occur at low titre in healthy individuals and at high titre in serum sickness and in some leukaemias and lymphomas.24,25 In these non-IM conditions, the antibody can be absorbed out by guinea pig cells. Thus, for the diagnosis of IM, it is necessary to demonstrate that the antibody present has the characters of the Paul–Bunnell antibody (i.e. it is absorbed by ox red cells but not by guinea pig kidney). This is the basis of the absorption tests for IM (‘monospot’ test). Immunofluorescent antibody tests have been developed to distinguish the IgM antibody, which occurs at high titre in the early phase of IM and diminishes during convalescence, from the IgG antibody, which persists at high titre for years after infection26,27 and which also occurs in the non-IM infections.22,28
Screening Tests for Infectious Mononucleosis
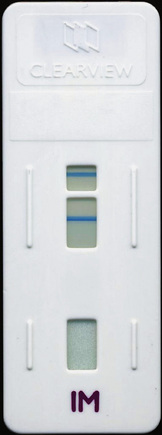
The reagents for IM screening are available commercially in diagnostic kits from several manufacturers. Guinea pig cells can be also be manufactured locally as described in previous editions. Some kits are based on agglutination of stabilized horse red cells or antigen-coated latex particles to which IM antibody binds. An extensive evaluation of 14 slide tests for the UK Medical Devices Agency (MDA), showed them to have a sensitivity between 0.87 and 1.00 and specificity of 0.97 to 1.00, with an overall accuracy (positive and negative) in the order of 91–100%.25 False-positive reactions have been reported in malaria, toxoplasmosis, and cytomegalovirus infection; autoimmune diseases; and even occasionally without any apparent underlying disease.29,30 False-negative reactions occur if the test is carried out before the level of heterophile antibody has increased or conversely when it has decreased. False-negative reactions may also occur in the very young and the very old. In the UK MDA study the best performance was obtained with the Clearview test (Unipath), which uses latex-labelled bovine erythrocyte glycoprotein. IM heterophile antibody binds to this to form a complex that presents as a band in the result window (Fig. 6.3). The test can be performed with diluted whole blood as well as with plasma or serum.
Clinical Value
Tests for the heterophile antibody are useful for diagnosis. Antibodies are often present as early as the 4th to 6th day of the disease and are almost always found by the 21st day. They disappear as a rule within 4–5 months. There is no unanimity as to how frequently negative reactions are found in ‘true’ IM. Occasionally, the characteristic antibodies develop very late in the course of the disease, perhaps weeks or even months after the patient becomes ill. It is also known that a positive reaction may be transient and that the antibodies may be present at such low titres that they may be missed or may produce anomalous agglutination reactions when associated with the naturally occurring antibody at similar titres. For all of these reasons, it is difficult to state categorically that any particular patient has not or will not produce antibodies. Antibodies specific for Epstein–Barr virus have been demonstrated in the serum of 86% of patients with clinical and/or haematological features of IM.31
There is no substantial evidence that sera containing agglutinins in high concentration giving the typical reactions of IM are ever found in other diseases uncomplicated by IM. In particular, the heterophile antibody titres in the lymphomas are similar to those found in unselected patients not suffering from IM.32
Erythropoietin
A pure form of human erythropoietin from recombinant DNA (r-HuEpo) is available for diagnostic assay methods by ELISA, enzyme immunoassay and radioimmune assay. Commercial kits are available that are reliable and sensitive,33 although there is some inter-method variability.34 Results are expressed in international units by reference to an international (WHO) standard. This was originally a urinary extract, and a preparation is available with a potency of 10 iu per ampoule.35 The present standard has been established for r-HuEpo with a potency of 86 iu per ampoule.36
Reference Range
The normal reference range in plasma or serum varies considerably according to the method of assay.33 For the ELISA method used by the UK supraregional service, the normal range is 9.1–30.8 iu/l. With test kits, in the steady state without anaemia, it is usually given as 5–25 iu/l or slightly higher. In normal children, the levels are the same as in adults, except for infants younger than 2 months when the levels are low.37
There is a diurnal variation, with the highest values at night.38 In pregnancy, erythropoietin concentration increases with gestation.39
Significance
Increased levels of erythropoietin are found in the plasma (or serum) in various anaemias,40 and there is normally an inverse relationship between haemoglobin and erythropoietin. In thalassaemia, erythropoietin is lower than in iron deficiency with the same degree of anaemia, but there is a close inverse correlation with the red cell count.41 In renal disease, there is a progressive decline in the erythropoietin response to anaemia, and in end-stage renal failure the concentration is normal or even lower than normal despite increasing anaemia. In renal patients receiving dialysis, erythropoietin treatment may cause functional iron deficiency.42
Some impairment of production of erythropoietin may occur in association with neoplasias and chronic inflammatory diseases. Increased concentrations of erythropoietin occur in secondary polycythaemia as a result of respiratory and cardiac disease; in the presence of abnormal haemoglobins with high oxygen affinity; and in association with carcinoma of the kidney and other erythropoietin-secreting tumours such as hepatoma, uterine fibroma and ovarian carcinoma.40
In primary polycythaemia (‘polycythaemia vera’), the plasma erythropoietin level is usually lower than normal even when the haemoglobin has been reduced by venesection.43,44 In secondary polycythaemia, the level of erythropoietin is never below normal. An assay is particularly useful in patients with erythrocytosis of undetermined cause; low erythropoietin has a specificity of 0.92 with moderate sensitivity for diagnosing primary polycythaemia.43 However, in such cases there may be an intermittent increase in erythropoietin secretion. Thus, determining its level in a single sample of plasma may be misleading. Low levels have been found in one-third of cases of primary (essential) thrombocythaemia, especially when haemoglobin is at a high normal level.43
Autonomous in vitro erythropoiesis
When mononuclear cells from blood or bone marrow are cultured, erythroid colonies (CFU-E) will normally develop only when erythropoietin is present in the culture medium. However, growth will occur in erythropoietin-free medium in primary polycythaemia. This provides a method for distinguishing primary from secondary polycythaemia.45–47
Mononuclear cells are collected from a blood sample by density separation (see p. 65) and added to an appropriate serum-free liquid culture medium46,47 or collagen gel medium,48 which is then divided into two portions. To one portion is added 1 iu/ml of erythropoietin. Both portions are plated and incubated for 7 days at 37°C. They are then stained with benzidine and examined directly under an inverted microscope or after spreading onto slides. The numbers of benzidine-positive cell clusters in the erythropoietin-free and erythropoietin-containing samples are counted and compared. A diagnosis of primary polycythaemia is indicated if there is an approximately equal growth in both samples. A method has been described in which flow cytometry with immunofluorescence is used to detect growth of the erythroid cells after only 2–5 days of culture.49
Thrombopoietin
Thrombopoietin regulates megakaryocyte development and platelet production. It is a protein produced by the liver and has been purified from serum.50 It is considerably larger than erythropoietin, with a molecular weight of about 335 kDa. A recombinant human thrombopoietin (rhTPO) has been produced and used to prepare a monoclonal antibody and develop a sensitive and specific ELISA. This has been used to measure thrombopoietin in normal serum and serum from patients with various blood disorders.51 The normal range (mean and 2SD) is 0.79 ± 0.35 fmol/ml for men and 0.70 ± 0.26 fmol/ml for women. It is increased in thrombocytopenias and is especially high (18.5 ± 12.4 fmol/ml) in aplastic anaemia with severe thrombocytopenia. In essential thrombocythaemia, thrombopoietin is in the range of 1.01–4.82 fmol/ml.51
Haematological tests in sports medicine
Assays to detect the illicit use of hormones such as erythropoietin in endurance sports are becoming increasingly important.52,53 Some of the current test methods for detecting erythropoietin used in this manner are described below.
Blood doping, often called induced erythrocythemia, is the practice of increasing the number of red blood cells through an intravenous infusion of blood, thereby enhancing performance in sports through the increase in red blood cell mass with an increased oxygen-carrying capacity.52 Alternatively, recombinant hormones such as erythropoietin can be used to induce erythropoiesis. Blood doping is an illegal practice as it provides an unfair advantage of endurance and performance over other athletes;52,54 It is also potentially dangerous due to the abnormal increase in red cell mass and the risk of acquiring infection from contaminated blood.54 The International Doping Test and Management55 collaborates with the World Anti-Doping Agency and other international and national sports authorities to coordinate the collection of blood and urine samples to be analysed in accredited laboratories.56
The full blood count, which includes the reticulocyte count, haemoglobin and packed cell volume, is the cheapest and most effective way to screen for suspected use of erythropoietin55 as abnormal blood counts may suggest doping. The sports administrative bodies collect blood profiles on individual athletes and these are monitored over time so changes in blood parameters due to doping can be detected. Compared to population-derived upper limits of the reference range such as the 0.5 Hct limit or the 2.5% reticulocyte limit, the fluctuations allowed are smaller when using individual-based cut-offs.52,54 Blood samples need to be analysed within 24 h of venesection52 and the security and confidentiality of blood samples obtained should be maintained at all times. The abnormalities in the blood profile which may suggest doping are outlined in the following section.
Reticulocytes
The administration of recombinant erythropoietin can be suspected from a raised reticulocyte count.57 Erythropoietin causes increased production of erythroblasts and immature reticulocytes, and accelerates their release from the bone marrow into peripheral blood. The mean haemoglobin content of the reticulocyte fraction is also raised.
Erythropoietin
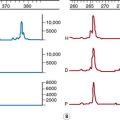
Changes in one or more of the full blood count parameters are only suggestive of the possible use of erythropoietin so they should be followed by tests to directly detect recombinant erythropoietin in the plasma.53,58 The structural differences between the endogenous and the recombinant erythropoietin isoforms59 make it possible to separate the two isoforms of erythropoietin, providing the samples are collected within 24 h of erythropoietin administration.60 Alternatively, isoelectric focusing can detect exogenous (recombinant) erythropoietin in urine specimens61,62
Principles of parasite detection
The essential method for a definitive diagnosis of malaria remains the finding of parasites in a blood film, followed by the identification of the particular species by morphology. Microscopic diagnosis can be a satisfying process in which parasites are identified then are assigned to their species based on fine morphological detail. Examination of thick or thin blood films remains the most sensitive routinely applied technique where microscopic expertise is available. Only brief outlines of how microscopic diagnoses may be reached are given in this chapter, and for more detailed accounts, readers are referred to a parasitology textbook. Where microscopic expertise is not available, antibody-based ‘rapid diagnostic tests’ (RDTs) are increasingly applied. RDTs have widespread application in developing countries, but increasingly are gaining use in all laboratories to screen potentially infected samples and to supplement microscopic diagnosis. It is important, however, that users appreciate the strengths and limitations that govern selection and interpretation of RDTs. Molecular approaches to malaria diagnosis and in particular to species identification, employ PCR-based assays and have the capability to be highly sensitive and specific.63Cost and time constraints, however, mean that at present molecular techniques are employed principally in reference or research laboratories. Molecular techniques in parasite diagnosis are not discussed in this text.
Examination of blood films for parasites
General Principles
Thick films are extremely useful when parasites are scanty, and these should be prepared and examined as a routine where malaria is suspected. Identification of the species is less easy than in thin films, and mixed infections may be missed, but if 5 min are spent examining a thick film, this is equivalent to about 1 h spent in traversing a thin film. Once the presence of parasites has been confirmed, a thin film should be used for determining the species and, in the case of Plasmodium falciparum, for assessing the severity of the infection by counting the percentage of positive cells. Low levels of parasitaemia may be missed by microscopy, and proficiency testing studies have demonstrated the need for all laboratories, and especially those lacking expertise, to take part in external quality control programmes and to refer problematic cases to more experienced centres.64,65
Microscopic diagnosis of malaria
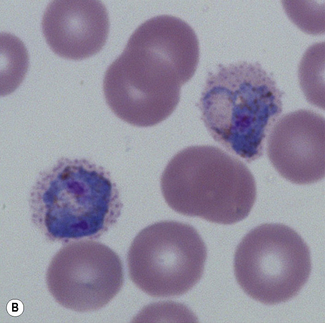
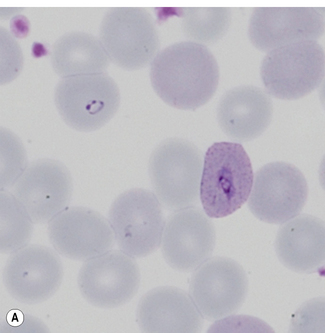
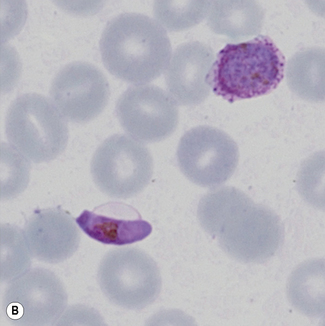
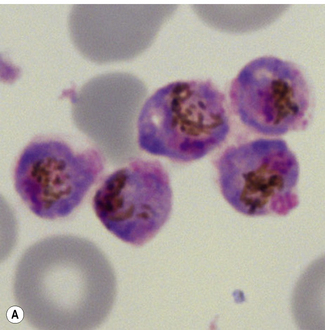
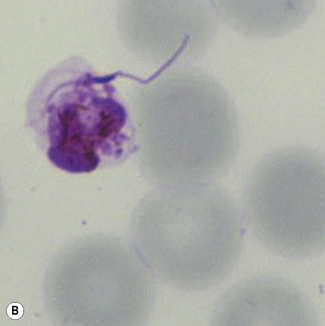
Morphological criteria for differentiation of malaria parasites are given in Table 6.2 and illustrated in Figures 6.5–6.8. Mixed species infections are well recognized, and microscopists should be alert to morphological features that cannot be reconciled to a single disease type (Fig. 6.9). Films for malaria must be made no longer than 3–4 h after blood collection. Films prepared later may still reveal parasites, but the parasite morphology will differ from fresh samples making species identification more difficult and in some cases causing the appearances of parasite stages not normally occurring in blood (Fig. 6.10).
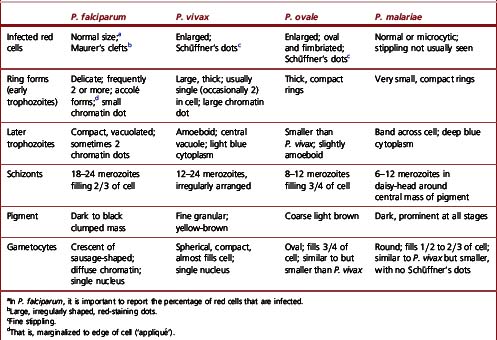
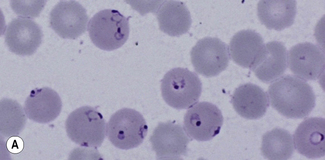
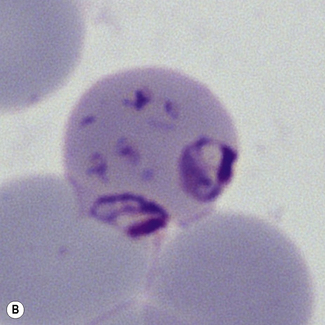
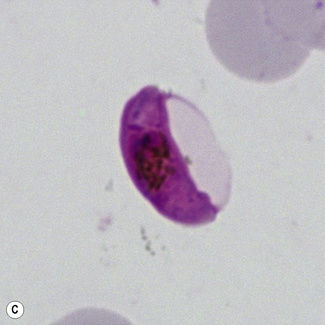
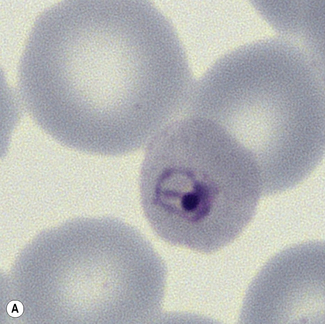
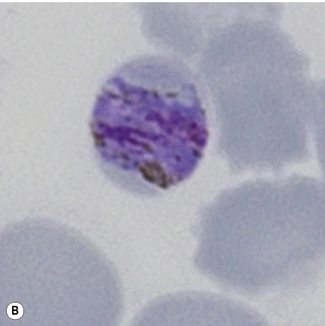
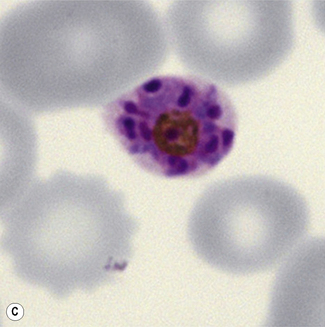
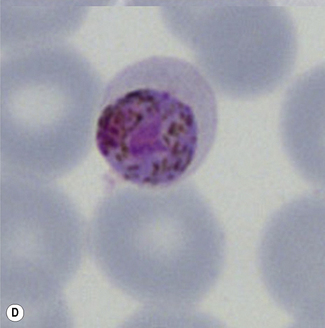
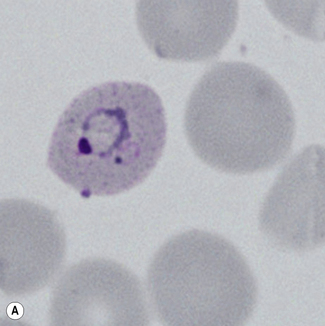
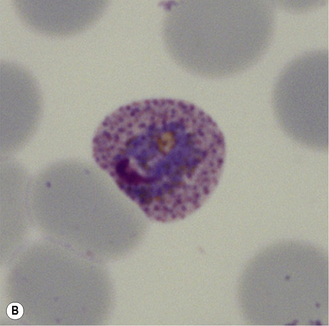
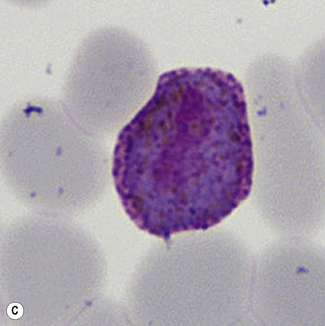
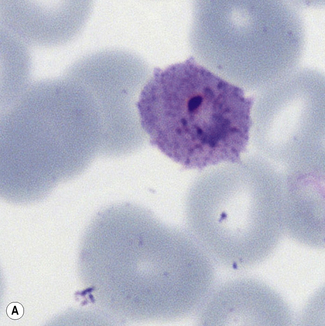
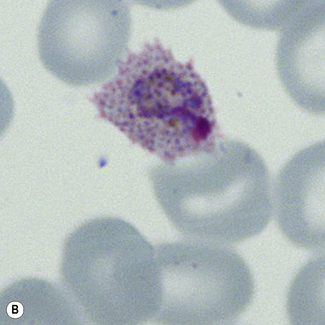
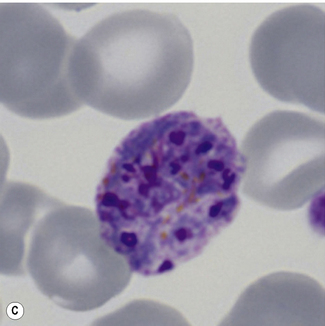
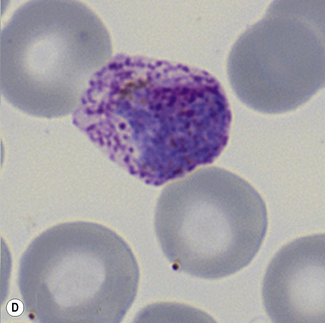
Figure 6.8 Morphology of P. ovale. Distinguishing P. ovale from P. vivax is perhaps the most difficult morphological distinction in malaria diagnosis. For both species, the red cells are enlarged, distorted, and contain visible Schüffner’s dots. The features that help distinguish these forms are given in Table 6.2. In this figure, note that the parasites and erythrocytes are smaller than for P. vivax, and that in some cases the cytoplasm is fimbriated. Both early (A) and late trophozoites (B) have coarse ‘ring’ forms. The schizont (C) contains fewer than 16 developing merozoites. A microgametocyte (D) does not fill the erythrocyte and numerous dots can be seen in the erythrocyte cytoplasm.
Two other morphology-based screening methods can be used for malaria diagnosis.
Fluorescence Microscopy
Red cells containing malaria parasites fluoresce when examined by fluorescence microscopy after staining with acridine orange. This has a sensitivity of about 90% in acute infections but only 50% at lower levels of parasitaemia, and false-positive readings may occur with Howell–Jolly bodies and reticulocytes. When positive, it is necessary to examine a conventionally stained blood film to identify the species.66
Quantitative Buffy Coat Method
The quantitative buffy coat (QBC) method (BD Diagnostic Systems) is another procedure for detection of parasites by fluorescent microscopy. The blood is centrifuged in capillary tubes that are coated with acridine orange. It is fairly sensitive but requires expensive equipment and has the disadvantage of false-positive results in the presence of Howell–Jolly bodies and reticulocytes. When positive, identification of species requires examination of a stained blood film, but it is useful as an initial screening test.67
Rapid diagnostic tests for malaria
Rapid diagnostic tests (RDTs) for malaria employ specific antibodies that detect malaria antigens in the blood of infected individuals. RDTs use small blood samples obtained by finger prick or by venepunture and employ a ‘lateral diffusion’ system similar to a pregnancy test to generate results. RDTs therefore display results in the form of visible ‘bands’ that can be interpreted by non-expert users with limited facilities. In general, a blood specimen to be tested (2–50 μl) is lysed in buffer solution containing one or more malaria-specific ‘detection antibodies’. The detection antibody is coupled to a visually observable label. Where specific antigen is present, a complex is formed between that antigen and its cognate labelled antibody. The labelled antigen–antibody complex generated is then bound by a second ‘capture-antibody’ that recognizes the same antigen, and which is immobilized as a line on the test strip. A positive result therefore generates a visible line of antigen–antibody complex. A separate immobilized capture antibody recognizes the labelled detection antibody alone; this control band will produce a line in the absence of malaria antigen and confirms that the test has been performed correctly and the result can be interpreted (Fig. 6.11).72
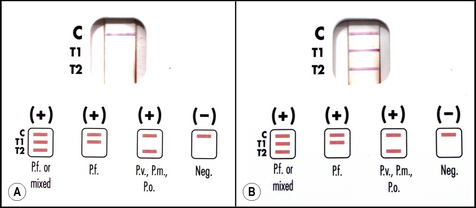
The antigen targets detected by RDTs fall into two groups. The first group of antigens are expressed in all malarial species. Antigens from this group therefore confirm malarial infection is present, but do not allow the parasite species to be determined. Antigens from this group are Plasmodium aldolase (PMA) or parasite lactate dehydrogenase (pLDH). The second group of antigens are specific for P. falciparum. Antigens from this group are histidine-rich protein-2 of P. falciparum (pfHRP2) or a P. falciparum-specific form of LDH (pfLDH). Antibodies from the two groups are used individually, or in combination, to produce two different test formats. A ‘two line’ test uses an anti-pfHRP2 band together with the positive control band to recognize P. falciparum only. A ‘three line’ test uses a P. falciparum specific antibody band, together with PMA or pLDH, together with the positive control antibody. The three line test can therefore indicate the presence of P. falciparum, or if P. falciparum is not present the test will indicate the presence of other malarial species. Since the second antibody is pan-malarial, the three line test does not distinguish between infection by P. vivax, P. ovale, or P. malariae, and will not detect mixed infection. For field diagnosis in malaria-endemic areas the selection of a two line (P. falciparum only) test, or three line (pan-malarial) test, will depend on local species prevalence. It is considered that if >90% of malaria cases in an area are caused by P. falciparum an RDT that detects only that species is appropriate for use. The introduction of such tests in malaria endemic areas also requires careful consideration of ease of use; cost; and limitations imposed by transport, distribution and storage.68
In terms of diagnostic sensitivity, WHO requires RDTs to reliably detect infections of 100 parasites per microlitre of blood (95% sensitivity).69 This is equivalent to the diagnostic sensitivity reasonably expected of a field microscopist diagnosing malaria in endemic regions.70 Sensitivity becomes less reliable below 100 parasites per microlitre, and this contrasts with the ‘gold standard’ sensitivity achieved by an expert microscopist in good conditions, who should detect 5–10 parasites per microlitre.70 Sensitivity does depend on species. For P. falciparum parasites, RDT sensitivity frequently exceeds 100 parasites per microlitre, although genetic variation of P. falciparum antigens may reduce sensitivity in some instances.69 For other malarial species, sensitivity of detection is recognized to be less good, particularly for P. ovale and P. malariae where RDTs may not detect infections that are clinically significant. There is also a recognized incidence of false-positive reactions caused by cross-reaction with autoantibodies (particularly with rheumatoid factor) that varies between detection systems. In all instances, malaria antigens are recognized to persist for a number of weeks following successful treatment, and in these circumstances a positive result may not indicate current infection.
The lower sensitivity of RDTs when compared with expert microscopic diagnosis means that all positive and negative results should be confirmed using microscopy. Symptomatic parasitaemia in non-immune subjects may occur with fewer than 100 parasites per microlitre of blood, and repeat testing of negative samples may be required to confirm a diagnosis. Users should also be aware that the positive line on the test only indicates a correctly performed test, and does not confirm effectiveness of parasite detection or accuracy of the test. Awareness of diagnostic performance for the selected test in the user’s laboratory is therefore mandatory.69
Leishmaniasis
Diagnosis of Leishmaniasis in the Haematology Laboratory
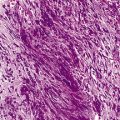
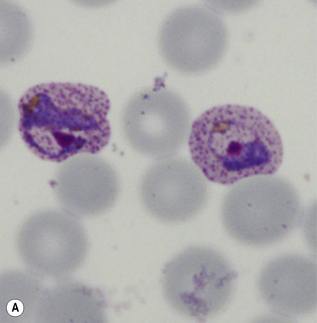
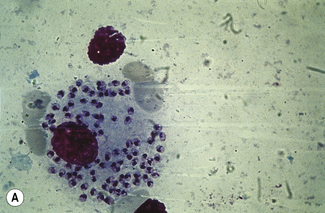
Leishmaniasis is diagnosed in the haematology laboratory by direct visualization of the amastigotes (often referred to as Leishman–Donovan bodies). Buffy coat preparations of peripheral blood or aspirates (see p. 64 for preparation of buffy coats) from marrow, spleen, lymph nodes or skin lesions should be spread on a slide to make a thin smear and stained with Leishman’s or Giemsa’s stain (pH 7.2) for 20 min (see p. 66). Amastigotes are seen within monocytes or, less commonly, in neutrophils in peripheral blood and in macrophages in bone marrow aspirates. They are small, round bodies 2–4 mm in diameter with indistinct cytoplasm, a nucleus, and a small rod-shaped kinetoplast (Fig. 6.12A). Occasionally, amastigotes may be seen lying free between cells.
Trypanosomiasis
Diagnosis of Trypanosomiasis in the Haematology Laboratory
Thick Blood Films or Chancre Aspirates
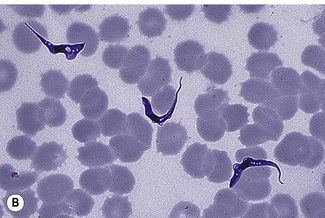
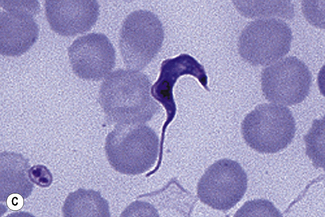
Examination of a thick film allows more of the sample to be examined rapidly, but T. cruzi are easily damaged by the spreading of specimens for thick films. Thick films are prepared by spreading a drop of blood on a slide to cover a 15–20-mm diameter area and staining with Giemsa staining technique or Field’s rapid technique (see p. 62) as for malaria smears. Microscopically, T. b. gambiense and T. b. rhodesiense cannot be distinguished from each other; they are 13–42 mm long with a single flagellum, a centrally placed nucleus, and a small dot-like kinetoplast. T. cruzi measures 12–30 mm and has a larger kinetoplast than T. b. gambiense and T. b. rhodesiense (Fig. 6.12B,C).
Concentration Techniques
Quantitative buffy coat method
The QBC method71 is referred to on p. 110. After centrifugation, the tube should be left to stand upright for 5 min, and the plasma interface area is then examined for motile trypomastigotes. This has been suggested as the ‘gold standard’ for diagnosis.
Capillary tube method
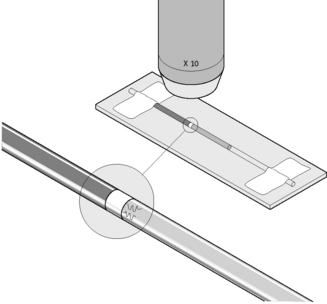
Fill one or two micro-haematocrit capillary tubes with EDTA or citrated blood. Seal the ends and centrifuge for about 5 min as for microhaematocrit. Then lay the capillary tubes adjacent to each other on a microscope slide, and secure both ends onto the slide with adhesive tape (Fig. 6.13). Examine the plasma just below the red cell and buffy layer immediately for motile trypomastigotes using a ×20 or ×10 objective with the condenser iris partially closed or by dark-field microscopy.
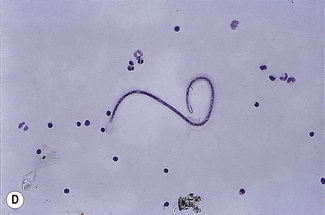
Filariasis and loiasis
Filariasis involving the lymphatics is the cause of elephantiasis. It is caused by the filarial worms Brugia malayi, Wuchereria bancrofti and Brugia timori, whereas filarial infection of the subcutaneous tissues is caused by Loa loa. The larvae of these worms, microfilariae, are transmitted by mosquito to humans, where they can be found in the blood and where they show periodicity with fluctuating levels at different times of the day (Fig. 6.12D).
1 International Committee for Standardization in Haematology. Guidelines on the selection of laboratory tests for monitoring the acute-phase response. J Clin Pathol. 1988;41:1203-1212.
2 Lowe G.D.O. Annotation: Should plasma viscosity replace the ESR? Br J Haematol. 1994;86:6-11.
3 Osei-Bimpong A., Meek J.H., Lewis S.M. ESR or CRP? A comparison of their clinical utility. Haematology. 2007;12:353-357.
4 International Council for Standardization in Haematology. ICSH recommendations for measurement of erythrocyte sedimentation rate. J Clin Pathol. 1993;46:198-203.
5 National Committee for Clinical Laboratory Standards. Reference and selected procedures for the erythrocyte sedimentation rate (ESR) test (H2-A4). Wayne, PA: NCCLS; 2000.
6 Sharland D.E. Erythrocyte sedimentation rate. The normal range in the elderly. J Am Geriatr Soc. 1980;28:346-348.
7 van den Broek N.R., Letsky E.A. Pregnancy and the erythrocyte sedimentation rate. Br J Obstet Gynaecol. 2001;108:1164-1169.
8 Adler S.M., Denton R.L. The erythrocyte sedimentation rate in the newborn period. J Pediatr. 1975;86:942-948.
9 Kallner A., Engervall P., Björkholm M. Kinetic measurement of the erythrocyte sedimentation rate. Ups J Med Sci. 1994;99:179-186.
10 Happe M.R., Buttafarono D.F., Dooley D.P., et al. Validation of the Diesse Mini-Ves erythrocyte sedimentation rate (ESR) analyzer using the Westergren method in patients with systemic inflammatory conditions. Am J Clin Pathol. 2002;118:14-17.
11 Menarini A. Features of the Vesmatic 30 analyser. Available at: www.menarini.com/diagnostic_uk/uk/diagnostic/products/hematology/erythrocyte_sedimentation_rate/ves_matic_30_plus/ Accessed 05.01.10
12 Garvey B.J., Mahon A., Parker-Williams J., et al. An evaluation of ESR-Chex control material for erythrocyte sedimentation rate determination (MDA 99/28). Norwich: Medical Devices Agency, Stationery Office; 1999.
13 Plebani M., Piva E. Erythrocyte sedimentation rate: use of fresh blood for quality control. Am J Clin Pathol. 2002;117:621-626.
14 Rotstein R., Fusman R., Berliner S., et al. The feasibility of estimating the erythrocyte sedimentation rate within a few minutes by using a simple slide test. Clin Lab Haematol. 2001;23:21-25.
15 Froom P., Margaliot S., Caine Y., et al. Significance of erythrocyte sedimentation rate in young adults. Am J Clin Pathol. 1984;82:198-200.
16 Lefrère J.J., Salmon D., Doinel C., et al. Sedimentation rate as a predictive marker in HIV infection. AIDS. 1988;2:63-64.
17 Fincher R.F., Page M.I. Clinical significance of extreme elevation of the erythrocyte sedimentation rate. Arch Intern Med. 1986;146:1581-1583.
18 Harkness J. The viscosity of human plasma: its measurement in health and disease. Biorheology. 1971;8:171-193.
19 Benson B. BV 200 Viscometer features, 2008. Available at: www.bensonviscometers.com/BV200.html
20 International Committee for Standardization in Haematology. Recommendation for selected method for the measurement of plasma viscosity. J Clin Pathol. 1984;37:1147-1152.
21 International Committee for Standardization in Haematology. Guidelines for measurement of blood viscosity and erythrocyte deformability. Clin Hemorheol. 1986;6:439-453.
22 Henle W., Henle G.E., Horwitz C.A. Epstein-Barr virus specific diagnostic tests in infectious mononucleosis. Hum Pathol. 1974;5:551-565.
23 Paul J.R., Bunnell W.W. The presence of heterophile antibodies in infectious mononucleosis. Am J Med Sci. 1932;183:90.
24 Huh J., Cho K., Heo D.S., et al. Detection of Epstein-Barr virus in Korean peripheral T-cell lymphoma. Am J Hematol. 1999;60:205-214.
25 Klein G. Epstein-Barr virus strategy in normal and neoplastic B cells. Cell. 1994;77:791-793.
26 Strand B.C., Schuster T.C., Hopkins R.F., et al. Identification of an Epstein-Barr virus nuclear antigen by fluoro-immuno-electrophoresis and radioimmuno-electrophoresis. J Virol. 1981;38:996-1004.
27 Edwards J.M.B., McSwiggen D.A. Studies on the diagnostic value of an immunofluorescence test for EB virus-specific IgM. J Clin Pathol. 1974;27:647-651.
28 Rea T.D., Ashley R.L., Russo J.E., et al. A systematic study of Epstein-Barr virus serological assays following acute infection. Am J Clin Pathol. 2002;117:156-161.
29 Reed R.E. False-positive monospot tests in malaria. Am J Clin Pathol. 1974;61:173-174.
30 Horwitz C.A., Henle W., Henle G., et al. Persistent falsely positive rapid tests for infectious mononucleosis. Report of five cases with four-six year follow-up data. Am J Clin Pathol. 1979;72:807-811.
31 Evans A.S., Niederman J.C. EBV-IgA and new heterophile antibody tests in diagnosis of infectious mononucleosis. Am J Clin Pathol. 1982;77:555-560.
32 Goldman R., Fishkin B.G., Peterson E. The value of the heterophile antibody reaction in the lymphomatous diseases. J Lab Clin Med. 1950;35:681-687.
33 Marsden J.T., Sherwood R.A., Peters T.J. Evaluation of six erythropoietin kits. Norwich: (MDA 95/57) Medical Devices Agency, Stationery Office; 1995.
34 Bechensteen A.G., Lappin T.R.J., Marsden J., et al. Unreliability in immunoassays of erythropoietin: anomalous estimates with an assay kit. Br J Haematol. 1993;83:663-664.
35 Annable L., Cotes P.M., Mussett M.V. The second international preparation of erythropoietin. Bull World Health Org. 1972;47:99-112.
36 Storring P.L., Gaines Das R.E. The international standard for recombinant DNA-derived erythropoietin: collaborative study of four recombinant DNA-derived erythropoietins and two highly purified human erythropoietins. J Endocrinol. 1992;134:459-484.
37 Hellebostad M., Haga P., Cotes M.P. Serum immunoreactive erythropoietin in healthy normal children. Br J Haematol. 1988;70:247-250.
38 Wide L., Bengtsson C., Birgegard G. Circadian rhythm of erythropoietin in human serum. Br J Haematol. 1988;72:85-90.
39 Cotes P.M., Canning C.E., Lind T. Changes in serum immunoreactive erythropoietin during the menstrual cycle and normal pregnancy. Br J Obstet Gynaecol. 1983;90:304-311.
40 Kendall R.G. Erythropoietin. Clin Lab Haematol. 2001;23:71-80.
41 Tassiopoulos T., Konstantopoulos K., Tassiopoulos S., et al. Erythropoietin levels and microcytosis in heterozygous beta-thalassaemia. Acta Haematol. 1997;98:147-149.
42 MacDougall I.C., Cahill I., Hulme B., et al. Detection of functional iron deficiency during erythropoietin treatment: a new approach. Br Med J. 1992;304:225-226.
43 Messinezy M., Westwood N.B., El-Hemaidi I., et al. Serum erythropoietin values in erythrocytoses and in primary thrombocythaemia. Br J Haematol. 2002;117:47-53.
44 Carneskog J., Safai-Kutti S., Wadenvik H., et al. The red cell mass, plasma erythropoietin and spleen size in apparent polycythaemia. Eur J Haematol. 1999;62:43-48.
45 Weinberg R.S. In vitro erythropoiesis in polycythemia vera and other myeloproliferative disorders. Semin Hematol. 1997;34:64-69.
46 Lemoine F., Najman A., Baillou C., et al. A prospective study of the value of bone marrow erythroid progenitor cultures in polycythemia. Blood. 1986;68:996-1002.
47 Beckman B.S., Anderson W.F., Beltran G.S., et al. Diagnostic use of CFU-E formation from peripheral blood in polycythemia vera. Am J Clin Pathol. 1983;79:496-499.
48 Dobo I., Mossuz P., Campos L., et al. Comparison of four serum-free, cytokine-free media for analysis of endogenous erythroid colony growth in polycythemia vera and essential thrombocythemia. Hematol J. 2001;2:396-403.
49 Manor D., Rachmilewitz E.A., Fibach E. Improved method for diagnosis of polycythemia vera based on flow cytometric analysis of autonomous growth of erythroid precursors in liquid culture. Am J Hematol. 1997;54:47-52.
50 Kaushansky K. Thrombopoietin: the primary regulator of platelet production. Blood. 1995;86:419-431.
51 Tahara T., Usuki K., Sato H., et al. A sensitive sandwich ELISA for measuring thrombopoietin in human serum: serum thrombopoietin levels in healthy volunteers and in patients with haemopoietic disorders. Br J Haematol. 1996;93:783-788.
52 Morkeberg J.S., Belhage B., Damsgaard R. Strategies to combat doping in cycling. International Sports Medical Journal. 2008;9:155-161.
53 Robinson N., Giraud S., Saudan C., et al. Erythropoietin and blood doping. Br J Sports Med. 2006;40:30-34.
54 Catlin D.H., Fitch K.D., Ljungqvist A. Medicine and science in the fight against doping in sport. J Intern Med. 2008;264(2):99-114.
55 International Doping Test Management. Diagnostic testing for drug abuse detection. Available at: www.idtm.com, 2004. Accessed 30.12.09
56 World Anti-doping Agency. About WADA. Available at: www.wada-ama.org/en/, 2010. Accessed 16.02.10
57 Erslev A.J. Production of erythrocytes. In: Williams W.J., editor. Hematology. New York: McGraw-Hill; 1990:389-407.
58 World Anti-doping Agency. The 2009 prohibition list world anti-doping code. Available at: www.wada-ama.org/en/World-Anti-Doping-Program/Sports-and-Anti-Doping-Organizations/The-Code/, 2009. Accessed 30.12.09
59 Rush R.S., Derby P.L., Smith D.M., et al. Microheterogeneity of erythropoietin carbohydrate structure. Anal Chem. 1995;67:1442-1452.
60 Wide L., Bengtsson C., Berglund B., et al. Detection in blood and urine of recombinant erythropoietin administered to healthy men. Med Sci Sports Exerc. 1995;27:1569-1576.
61 Lasne F., de Ceaurriz J. Recombinant erythropoietin in urine. Nature. 2000;405:635-636.
62 Lasne F., Martin L., Crepin N., et al. Detection of isoelectric profiles of erythropoietin in urine: differentiation of natural and administered recombinant hormones. Anal Biochem. 2002;311:119-126.
63 Johnston S.P., Pieniazek N.J. PCR as a confirmatory technique for laboratory diagnosis of malaria. J Clin Microbiol. 2006;44:1087-1089.
64 Thomson S.T., Lohmann R.C., Crawford L., et al. External quality assessment in the examination of blood films for malaria parasites within Ontario, Canada. Arch Pathol Lab Med. 2000;124:57-60.
65 Bell D., GO R., Miguel C., et al. Diagnosis of malaria in a remote area of the Philippines: comparison of techniques and their acceptance by health workers and the community. Bull World Health Org. 2001;79:933-941.
66 Lowe B.S., Jeffa N.F., New L. Acridine orange fluorescence techniques as alternatives to traditional Giemsa staining for the diagnosis of malaria in developing countries. Trans R Soc Trop Med Hyg. 1996;90:30-34.
67 Bailey W., Smith D. The quantitative buffy coat for the diagnosis of trypanosomes. Trop Doct. 1994;24:54-56.
68 World Health Organization. The Use of Malaria Rapid Diagnosis Tests. WHO, Geneva, 2004;1-20.
69 World Health Organization. Towards Quality Testing of Malaria Rapid Diagnostic Tests: Evidence and Methods. WHO, Geneva, 2006;1-22.
70 New Perspectives Malaria Diagnosis Report of a joint WHO/USAID informal consultation 25–27 October 1999. 4.2: Approaches to the diagnosis of malaria: microscopic diagnosis. Geneva: WHO/SAID; 11
71 Ali F.M. Separation of Human Blood and Bone Marrow Cells. Bristol: Wright; 1986.