[level-membership-for-internal-medicine-category]
Chapter 11 State-of-the-Art Instrumentation for PET and SPECT Imaging in Small Animals
MICRO–POSITRON EMISSION TOMOGRAPHY
Dedicated, high spatial resolution small-animal PET imaging devices have become available. Some are in-house-developed systems at several research institutions,1–5 but more recently, dedicated small-animal systems have become available through several commercial suppliers. The spatial resolution of these imaging devices is typically in the range of 1.0 to 1.5 mm full-width at half-maximum (FWHM) and enables mapping of the distribution of positron-emitting radiotracer and its changes over time throughout the body of small animals. These imaging systems have been used quite extensively for measuring substrate metabolism and cell replication rates of tumors as indices of tumor growth rates and tumor aggressiveness, and for determining responses of tumor growth to investigational therapeutic agents.6–10 Other research has utilized these small-animal imaging devices for the development and validation of novel noninvasive assays for identifying activation and expression of transgenes.6,9–11
POSITRON EMISSION TOMOGRAPHY IMAGING OF THE RODENT HEART
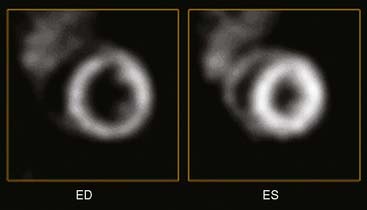
The small dimensions of the rodent heart pose formidable challenges for PET studies of the cardiovascular system in rodents. In general, dedicated small-animal PET systems employ two different technical concepts: (1) crystal detector–based and (2) multiwire proportional chamber–based systems.12,13 As shown in Figure 11-1, multiwire proportional chamber–based systems may offer superior spatial or volume resolution but generally are less sensitive and require longer image acquisition times. Conversely, crystal-based systems offer higher sensitivity (count rate per unit radioactivity) and offer superior temporal resolution but at the expense of somewhat lower spatial resolution (Fig. 11-2).
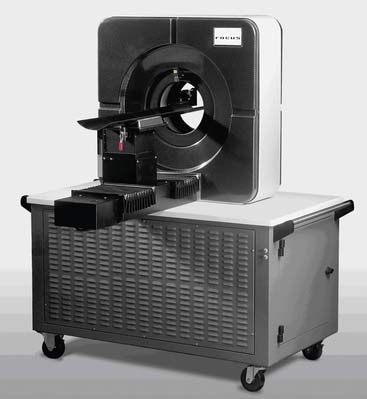
Several commercial small-animal scanners are now available since the first prototype scanner was built at University of California, Los Angeles. Figure 11-3 shows one such small-animal PET scanner, the microPET Focus 120.14 This system consists of 96 scintillation detectors arranged in four rings with a 14.7-cm diameter and 7.6-cm axial extent. Each detector consists of a 12 × 12 array of 1.52 × 1.52 × 10 mm lutetium oxyorthosilicate (LSO) crystals coupled to a position-sensitive photomultiplier tube (PS-PMT) via optical fiber bundles. Data are acquired in three-dimensional (3D) mode. With standard filtered backprojection reconstruction algorithms, the system achieves an isotropic (in all three directions) spatial resolution of 1.5 mm in the center of the field of view (FOV) and remains less than 2.0 mm within 5 cm of the center of the FOV. Imaging of the myocardium in mice and rats with the flow tracer 13N-ammonia or the glucose analogue 18F-deoxyglucose typically requires activity doses of 0.5 to 1.5 mCi.15 Count rates at these radioactivity doses remain relatively low so that dead-time losses are small. Image reconstruction with the more recently developed maximum a posteriori probability (MAP) algorithm, now employed for cardiac studies in mice, provides images of myocardial perfusion and glucose uptake of good to excellent diagnostic quality (see Fig. 11-2).16 The MAP reconstruction algorithm improves the spatial resolution in the center of the FOV to 1.2 mm FWHM so that a volumetric resolution of less than 5 microliters is now possible.
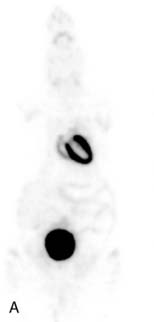
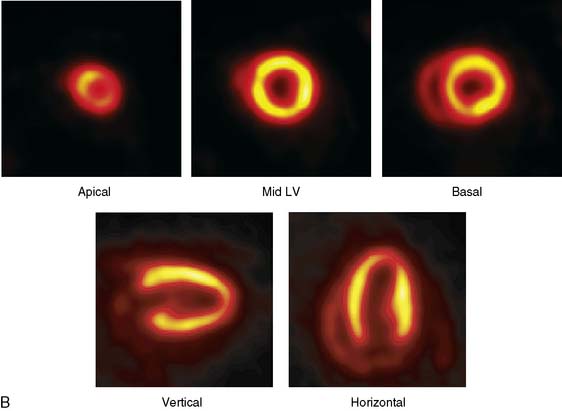
The emission data are reconstructed initially into a set of contiguous transaxial slices with a 0.75-mm interplane spacing (Fig. 11-4).17 The transaxial images are typically reoriented into short-axis and vertical and horizontal long-axis cuts (Fig. 11-5)17 that can be assembled into polar maps analogous to those of myocardial perfusion studies in humans (Fig. 11-6).17 Images of glucose uptake obtained with 18F-deoxyglucose are of greater contrast and higher quality than images of perfusion obtained with 13N-ammonia. This is most likely because of the more complete clearance of 18F-deoxyglucose from blood and higher tracer activity concentrations in the myocardium. Another reason is the slower physical decay of 18F-deoxyglucose so that over the total image acquisition time, more counts are recorded. On the other hand, the shorter physical half-life of 13N-ammonia affords the ability to perform repeat examinations of myocardial blood flow during the same study session so that effects of interventions can be evaluated. ECG gated image acquisition is also possible with small PET systems so that left ventricular function can be assessed.18 For example, in normal 300-g rats, the left ventricular ejection fraction was about 60% to 70%, and the stroke volume was about 300 μL.18
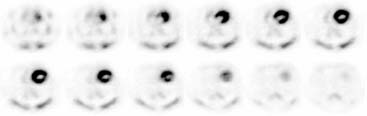
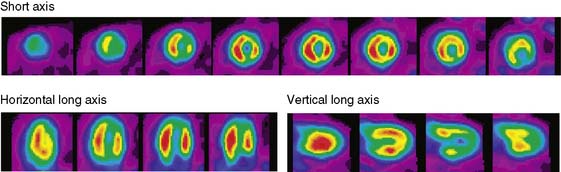
Figure 11-5 Reoriented images of the myocardial 18F-deoxyglucose uptake in the same mouse as depicted in Figure 11-4. Selected short-axis (upper row) and vertical and horizontal long-axis cuts are shown.
(Reproduced with permission from Schelbert HR, Inubushi M, Ross RS: PET imaging in small animals. J Nucl Cardiol 10:513–520, 2003.)
Figure 11-6 Polar map display of the 18F-deoxyglucose uptake in the left ventricular myocardium in the mouse depicted in Figures 11-4 and 11-5.
(Reproduced with permission from Schelbert HR, Inubushi M, Ross RS: PET imaging in small animals. J Nucl Cardiol 10:513–520, 2003.)
The image reconstruction algorithm corrects for radioactive decay and for dead-time losses. It also includes routines for photon attenuation correction. These routines utilize transmission images that are typically acquired prior to radiotracer administration and are performed using a Co57 point source or, for hybrid microPET/CT systems, an x-ray attenuation map. Despite the small body size of rats, photon attenuation causes about 30% systematic underestimation of the true myocardial radioactivity concentration.19 Albeit somewhat less in mice, photon attenuation still amounts to about 17% underestimation of the true activity. Accordingly, even in small animals, proper attenuation correction is important for the measurement of the true absolute intensities in cardiac imaging. Chow et al.19 have shown that CT-based attenuation correction methods result in less noise correction to emission images compared to the transmission-based attenuation corrections.
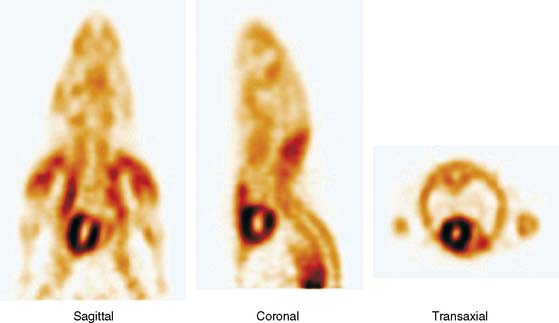
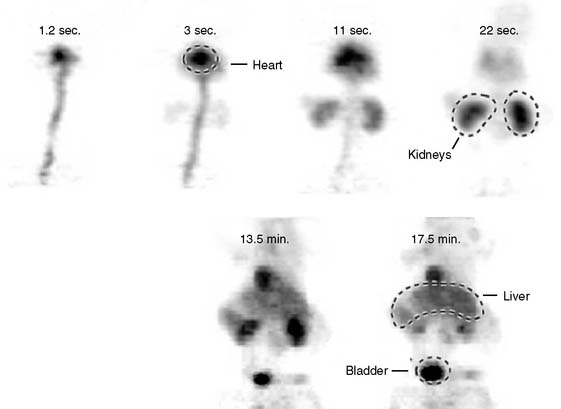
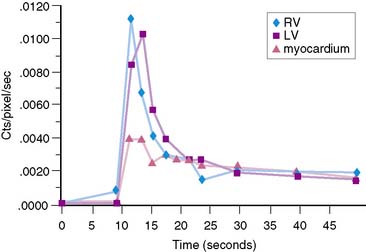
The stationary imaging gantry of microPET permits rapid serial (or “dynamic”) acquisition of images. Theoretically, images can be recorded at sampling rates of less than 1 second. For practical purposes, however, image acquisition rates depend on the number of counts required for statistically adequate image frames. Framing rates in the range of 2 to 10 seconds per image following an intravenous bolus of 13N-ammonia, 18F-deoxyglucose, or 11C-palmitate produce statistically adequate images for generating tissue time-activity curves and thus are appropriate for radiotracer kinetic studies.20 Figure 11-7 depicts selected frames acquired during and shortly after an intravenous bolus injection of 13N-ammonia in a rat. High temporal-resolution tissue time-activity curves for the right and left ventricular blood pools and the left ventricular myocardium in a rat following an intravenous bolus of 18F-deoxyglucose into a tail vein are shown in Figure 11-8.
IMAGING THE CARDIOVASCULAR SYSTEM IN MICE AND RATS
Experimental Coronary Occlusions in the Rat
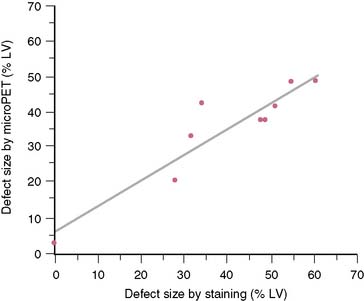
The extent and severity of regional myocardial perfusion defects that are experimentally induced by transient coronary occlusions in rats can be accurately determined with microPET.15 In Figure 11-9, myocardial perfusion was imaged with intravenous 13N-ammonia at baseline, 45 minutes later during a 20-minute coronary occlusion, and again 45 minutes following reperfusion. Figure 11-10 shows the corresponding polar map displays. The location and extent of the image perfusion defects corresponded well with the actual regions observed on postmortem stained tissue. Using a threshold of 50% of the maximum myocardial activity concentration as the lower limit of normal, the size of the flow defect derived from polar maps of myocardial perfusion correlated linearly with the defect sizes determined by postmortem examination (Fig. 11-11).
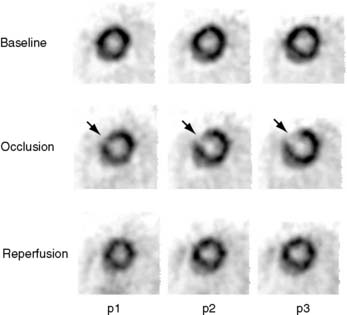
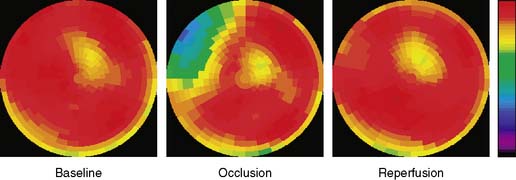
Figure 11-10 Polar map display of the distribution of myocardial blood flow recorded serially before, during, and following a transient coronary occlusion in the rat depicted in Figure 11-7. Note the perfusion defect on the polar map during the occlusion, as indicated in blue.
(Reproduced with permission from Kudo T, Fukuchi K, Annala AJ, et al: Noninvasive measurement of myocardial activity concentrations and perfusion defect sizes in rats with a new small-animal positron emission tomograph, Circulation 106:118–123, 2002.)
Studies in Genetically Modified Mice
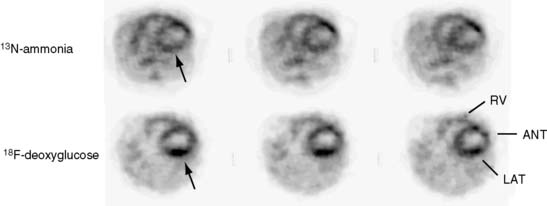
Initial studies have demonstrated the possibility of phenotyping genetically modified mice. For example, cardiac myocyte-specific excision of the murine β-1 integrin gene results in extensive myocardial fibrosis.21 In adulthood, the mice develop a form of dilated cardiomyopathy and symptoms of congestive heart failure. MicroPET imaging with 18F-deoxyglucose in β-1-integrin knockout mice revealed heterogeneously distributed tracer uptake consistent with either replacement of myocytes by fibrotic tissue or as a consequence of regional alterations in substrate metabolism (Fig. 11-12). Assessment of myocardial perfusion with 13N-ammonia in the β-1-integrin knockout mouse further revealed heterogeneously distributed myocardial blood flow in addition to patchy regions of reduced tracer uptake.
Development of Novel Radiotracer Assay Approaches
Noninvasive, image-based probe systems for studying location, extent, magnitude, and duration of gene expression have also been explored and are now being used in small animals. One approach used in oncologic studies in mice has been the PET reporter gene/reporter probe system.9–11,22 In one of these systems, a mutant herpes simplex virus thymidine kinase gene is delivered by an adenoviral vector and represents the PET reporter gene. If expressed in tissue, thymidine kinase phosphorylates the radiolabeled 9-(4-[18F]-fluoro-3 hydroxymethylbutyl) (guanine) (18FHBG) that serves as the PET reporter probe. Because the phosphorylated product of 18FHBG is relatively impermeable to the cell membrane, it becomes effectively trapped in tissue and thus can be imaged with PET. Details on this in vivo assay approach and on other probe systems are described in several recent reviews.6,9,10,23
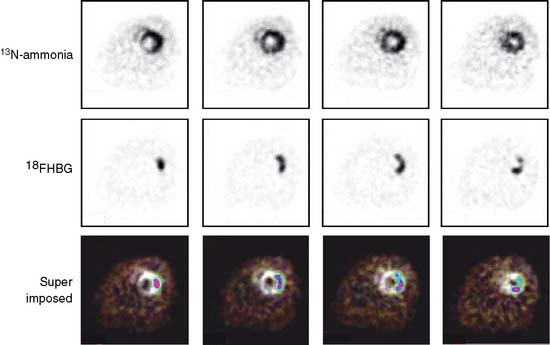
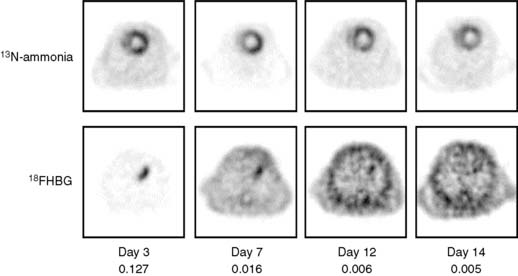
Pilot studies with in vitro imaging approaches had explored the feasibility of adapting these probe systems to the heart.24 Optical and microPET imaging approaches have more recently been utilized to examine the feasibility of using these probe systems for in vivo studies of the heart. In these investigations, the PET reporter gene was introduced into the myocardium by direct needle injection during a thoracotomy. Images of the PET reporter probe were then obtained several days after transfection.25,26 Another study in rats explored quantitative aspects of the probe system (Fig. 11-13).27 The site of the reporter gene expression in the myocardium as identified by microPET correlated closely with that determined postmortem. In vivo measured activity concentrations of the PET reporter probe accurately represented those measured by in vitro tissue counting and, importantly, correlated with the tissue activity of the expressed thymidine kinase. Further, as shown in Figure 11-14, repeat imaging up to 17 days following transfection of the PET reporter gene defined the time course of the gene expression. The expression was highest on days 3 and 5, was still identifiable in some animals between days 10 and 14, but was no longer observed on day 17.
PET imaging studies with the reporter gene/reporter probe system in rats also appear promising for investigations on cardiac cell therapy.28 Embryonic rat cardiomyoblasts were transfected with the PET reporter gene and were delivered by direct needle injection into the myocardium of rats. Engraftment and survival of the transplanted myoblasts were then demonstrated noninvasively and repeatedly by microPET imaging of the myocardial retention of the intravenously delivered PET reporter probe.
Quantification of Functional Processes
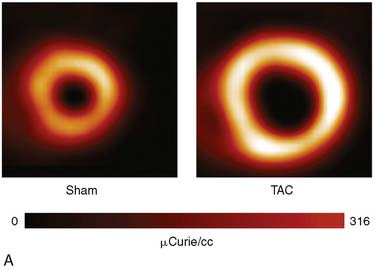
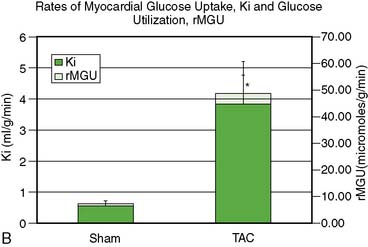
Adoption of PET’s advantages and full quantitative capabilities to the cardiovascular system of mice and rats remains difficult and is still incomplete. The potential of PET for measuring rates of functional processes is based on the ability to accurately measure tracer activity concentrations in the myocardium and in arterial blood or left ventricular blood pool and to dynamically monitor their changes over time. Major limitations have been the small size of the left ventricular cavity, the thin left ventricular wall, and the rapid heart rates in rodents (~400 to 600 beats/min). Therefore, measurements of tracer activity concentrations in the less than 1-mm-thick myocardium require substantial corrections for partial volume effects that might lead to considerable errors. The small inner diameter of the LV cavity together with the rapid heart rate causes considerable spillover of activity between myocardium and blood, and results in considerable contaminations of counts recovered from regions of interests assigned to the myocardium and the blood pool. Difficulties in serial sampling of arterial blood needed for validation of noninvasively derived radiotracer input functions, mostly due to the small blood volume in mice or rats, has further limited development and implementation of tracer kinetic approaches in small animals. Nevertheless, significant advances have been made over the last couple of years in obtaining accurate measurement of the blood input function, either by direct arterial blood sampling29,30 or by derivation of the input function from PET images. A recent study by Fang et al.31 validated a new method for deriving the arterial input function from dynamic PET image data that is less susceptible to spillover (SP) and partial volume (PV) effects. This method accounts for the SP and PV effects in a physiologic model to obtain a model-corrected input function that compared well with the physically derived arterial blood samples. These investigators speculated that the addition of cardiac and respiratory gating, in combination with iterative algorithms such as MAP, would further reduce the SP and PV effects in the image-derived input function. This is supported by recent studies at the University of Virginia that demonstrated that high-resolution iterative reconstruction algorithms, combined with cardiac gating, minimized SP from the blood pool to the myocardium and vice versa.32 Partial volume corrections for the blood pool were small because the dimensions were approximately two times the intrinsic spatial resolution of the Siemens Focus 120 scanner.33 Performing PV corrections for the myocardium enabled accurate estimates of the kinetic rate constants and hence the rates of glucose uptake, Ki, and utilization, rMGU, using a three-compartment model approach in a mouse model of pressure-overload left ventricular hypertrophy produced by transverse aortic constriction (TAC) over 4 weeks (Fig. 11-15).
Measurements of Myocardial Activity Concentrations
Regional radiotracer activity concentrations can be measured in absolute units in the myocardium of rats.15 Following intravenous injection of 18F-deoxyglucose and tracer accumulation in the myocardium, regions of interest were assigned to the left ventricular myocardium on the attenuation-corrected images. The PV-related underestimation of true tissue activity concentrations was corrected for with a recovery coefficient of 0.59, a value derived from postmortem measurements of the myocardial wall thickness and from the performance characteristics of the imaging system. Additional adjustments were needed for method-related differences in activity measurements between microPET and in vitro well counting of tissue samples. A calibration factor adjusted for differences in in vitro and in vivo measurements in tissue concentrations was obtained from images of a “rat phantom” that mimics the distribution of radioactivity in the body of the rat, and that contained in the region of the heart a solution of known radioactivity concentration.15 Once corrected for PV effect and for differences in measurement sensitivities, values of tissue activity concentrations determined in vivo correlated closely and linearly with those obtained by postmortem well counting of myocardial tissue samples and ranging from 0.89 to 10.46 MBq/g. (Fig. 11-16).
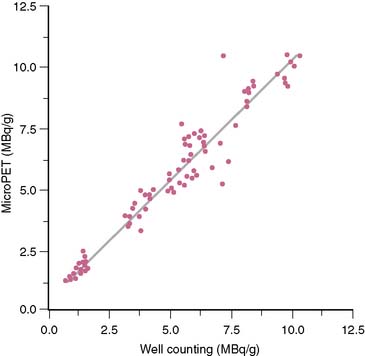
Figure 11-16 Comparison of 18F-deoxyglucose concentrations in vivo and by well counting.
(Reproduced with permission from Kudo T, Fukuchi K, Annala AJ et al: Noninvasive measurement of myocardial activity concentrations and perfusion defect sizes in rats with a new small-animal positron emission tomograph, Circulation 106:118–123, 2002.)
Assays of Time-Dependent Changes in Tissue Activity Concentrations
Other studies have explored semiquantitative PET approaches for identifying alterations in the myocardium’s substrate metabolism as phenotypic consequences of gene alterations in mice. In addition to 18F-deoxyglucose, these studies also employed 11C-palmitate as a tracer of fatty acid metabolism in transgenic mice with cardiac-specific overexpression of peroxisome proliferator–activated receptor alpha (PPARα).20 Beginning with the intravenous tracer administration, serial images were recorded for up to 40 minutes, and whole heart time-activity curves were generated. Consistent with the expression of PPARα target genes involved in free fatty acid and glucose metabolism, myocardial 18F-deoxyglucose uptake in these transgenic mice was found to be diminished, whereas 11C-palmitate uptake and clearance as indices of myocardial fatty acid uptake and oxidation were found to be increased. The images and derived time-activity curves in these mice clearly indicated trends of the alterations in substrate metabolism that were in agreement with findings by in vitro assays of the heart.
Measurements of Absolute Blood Flow in the Myocardium of Rats
The possibility to extract time-dependent activity concentrations from the serially acquired images in both arterial blood and myocardium has also been demonstrated in the somewhat larger heart of rats.34 Time-activity curves for myocardium and left ventricular blood pool were derived in these studies with 13N-ammonia and 11C-acetate from regions of interest assigned to the serially acquired images. Model fitting of the time-activity curves yielded estimates of myocardial blood flow that averaged 4.56 mL/m/g, a value consistent with that reported for rat myocardium.35 Further, the myocardial clearance rate of 11C-acetate as an index of regional myocardial oxidative metabolism averaged 1.48 min−1 and thus was markedly higher than clearance rates of 0.48 ± 0.004 min−1 reported for human myocardium at baseline.36 Although the noninvasively derived estimates of myocardial blood flow and oxidative metabolism lacked independent validation in this study in rats, and although heart rate and blood pressure were not reported, the high values of blood flow and oxidative metabolism, at least relative to those in humans, are consistent with the high heart rate and consequently high levels of cardiac work in the rodent heart. The findings of this study support the possibility of extracting quantitative information on functional processes of the myocardium in rodents. However, estimates of regional myocardial blood flow and oxidative metabolism varied considerably between myocardial regions, as for example the septum and the lateral wall, highlighting the difficulties and current limitations in extracting accurate and uncontaminated regional tracer activity concentrations from the serially acquired images.
Semiquantitative Estimates of Changes in Myocardial Blood Flow in Mice
Experimentally induced genetic alterations in mice may affect myocardial blood flow homogenously rather than regionally. Demonstration of phenotypic consequences of genetic alterations therefore requires estimates of myocardial blood flow in absolute units rather than identification of regional alterations in the relative flow distribution of blood flow. Additional factors complicating such measurements include the already high levels of myocardial blood flow at rest. Even though myocardial blood flow has not been measured in vivo in mice, values may be as high as 4 mL/m/g, judging from the high resting heart rates of 400 to 600 beats/min in mice and from estimates of 3.5 to 4.0 mL/min/g as observed in rat myocardium.35 Consequently, the myocardial net retention of most tracers of myocardial blood flow resides in the plateau region of the nonlinear relationship between the tracer net retention and myocardial blood flow. Further increases in blood flow, as for example induced by pharmacologic vasodilatation, would be associated with only small increments in radiotracer uptake. Because of this, one microPET study in mice with 13N-ammonia attempted to lower rather than increase myocardial blood flow, and examined whether associated decreases in flow could be demonstrated noninvasively with microPET imaging.37 With an approximate 50% reduction in the heart rate after intraperitoneal administration of the α2-adrenoreceptor agonist clonidine, the myocardial retention of 13N-ammonia expressed as percent of the total injected dose declined significantly but by modest 14%. Even if the 50% reduction in heart rate produced more substantial decreases in myocardial blood flow, the observed modest decrease in tracer retention most likely was because of the nonlinear relationship between tracer net uptake and myocardial blood flow, at least in the hyperemic flow range.
Limitations and Challenges
With the recent development of high-resolution and high-sensitivity small-animal PET scanners, accurate imaging of the murine heart is now possible. Obtaining the arterial blood input function has been a challenge in dynamic PET imaging of the mouse heart in the past, but adoption of the factor analysis approach to serially acquired microPET images appears promising for determining accurate estimates of the arterial tracer input function and likely also of the myocardial tissue response.38 The high-resolution iterative ordered subset expectation maximization (OSEM)-MAP reconstruction algorithms improve the reconstructed image resolution as compared to the conventional analytic filtered backprojection algorithm.39 Nevertheless, even the relatively high spatial resolution of the dedicated microPET systems remains low relative to the myocardial wall thickness of about 0.9 mm in the mouse. Accordingly, the necessary partial volume corrections have to be applied for accurate estimates of the myocardial tracer uptake. This along with cardiac and/or respiratory gating enables accurate estimates of the blood input function.32
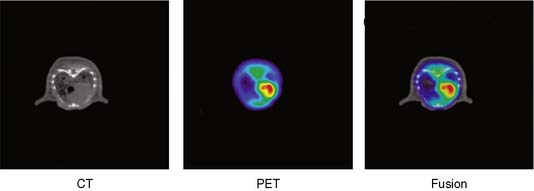
Other refinements to existing methodologies include small-animal PET/CT and PET/MRI approaches and thus coregistration of functional with anatomic information (Fig. 11-17).40,41 Besides offering improved accuracy in localizing regional functional processes, the addition of anatomic information may prove useful for more accurate determination of regional tracer activity concentrations. With these method- and instrumentation-related refinements, it will likely become possible to fully utilize the potential of PET in mice as a noninvasive probe of a broad range of tissue assays. Such assays include tracer kinetic approaches already fully validated and employed in large-animal studies and in humans for measurements of myocardial blood flow, oxidative metabolism and consumption, and myocardial substrate metabolism.
MICRO–SINGLE-PHOTON EMISSION COMPUTED TOMOGRAPHY
MicroSPECT Instrumentation
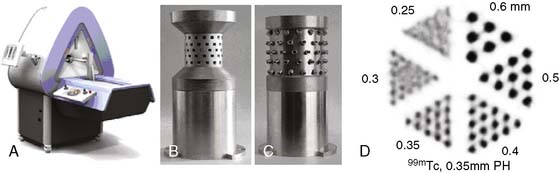
One drawback to gantry-based microSPECT systems is that they are not optimal for imaging rapid, dynamic processes, because there is a finite time required to rotate the detector head to the next position. The investigators from the Radiology Research Laboratory at the University of Arizona Health Sciences Center developed a unique “gantryless” stationary SPECT system called FASTSPECT for small-animal imaging. The system consists of 24 modular gamma cameras arranged in two circular arrays: one array of 11 cameras and a second array of 13 cameras. Each of the modular cameras consists of a 10 cm × 10 cm NaI(Tl) scintillation crystal coupled to a photomultiplier tube with an optical light guide. The collimator consists of 24 1-mm-diameter pinholes drilled into a cylindrical aperture in such a manner that an object placed in the center of the FOV is simultaneously projected onto the center of each of the 24 detectors. Compared with a single-pinhole aperture and detector system, having multiple pinholes and detectors markedly improves the overall system sensitivity. Importantly, because the detectors are placed in a circular pattern around the animal, there is no need to rotate a gantry. A full 3D dynamic image set can be acquired in only 5 to 10 minutes. Another unique stationary approach to rapid dynamic microSPECT imaging is a second-generation system called U-SPECT-II that was developed by Beekman and colleagues and is now available commercially (Fig. 11-18A).42 The system consists of interchangeable tungsten ring collimators with 75 pinholes (see Fig. 11-18B) that yield non-overlapping projections of the imaging volume onto three 508 × 381 × 9.5 mm detectors. Using the mouse collimator with 0.35-mm pinhole apertures, a resolution of less than 0.35 mm was obtained using a rod phantom filled with 99mTc (see Fig. 11-18C). The U-SPECT-II system acquires the data set simultaneously in list mode, and both ECG and respiratory gating can be performed. Figure 11-19 is an example image of myocardial perfusion (99mTc-tetrofosmin) in a mouse heart at end-diastole and end-systole that was obtained with U-SPECT. The ultra-high-resolution images clearly show both papillary muscle and the thin right ventricular wall of the mouse heart. With U-SPECT-II, CT imaging can also be performed using a separate CT module, and the reconstructed image data sets can be co-registered and fused with postacquisition software.
Uses of MicroSPECT Instrumentation for Cardiovascular Molecular Imaging
Myocardial Perfusion and LV Function
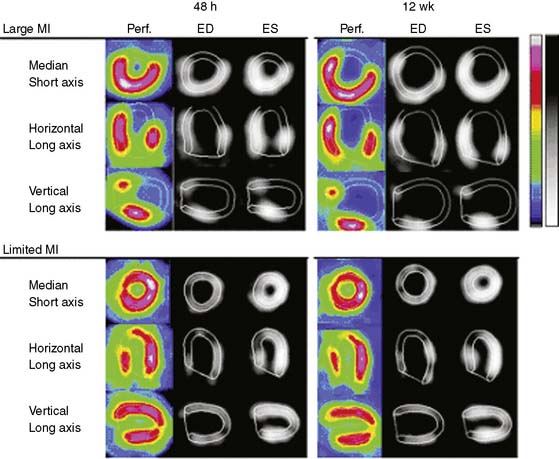
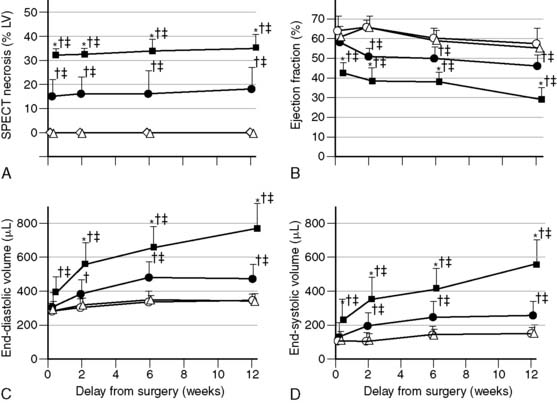
State-of-the-art, standalone microSPECT systems have many attractive features, but for some applications, excellent results have been obtained using clinical SPECT cameras with pinhole collimators. In one study, Maskali et al. used such a system to image myocardial perfusion and LV function by gated SPECT in a rat model of postinfarction LV remodeling over 12 weeks.43 The rats were serially imaged over 12 weeks using 400 to 700 MBq of 99mTc-sestamibi injected intravenously (300-500-μL volume) at each time point. The camera system consisted of a single-head clinical SPECT camera with a 3-mm diameter pinhole and a magnification factor of approximately 4.5 (195 mm focal length, 43 mm radius of rotation). Image reconstruction was performed using an OSEM iterative algorithm, and LV function was determined using clinical QGS software. The investigators demonstrated that in the post-MI setting, the initial (48-hour) infarct size measured by sestamibi SPECT predicts the extent of subsequent LV remodeling in rats (Fig. 11-20).43
Quantitative Assessment of Myocardial Viability Using Technetium-99m-Glucarate
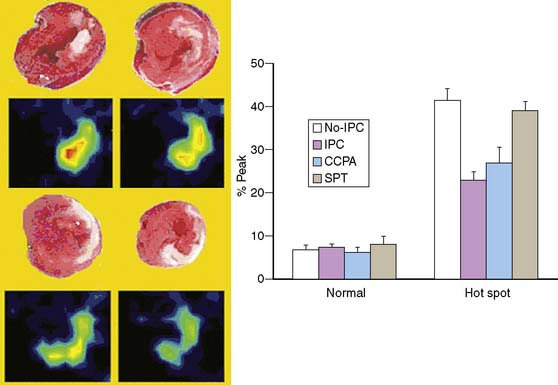
In a recent study by Liu et al. at the University of Arizona,44 the FASTSPECT camera (described earlier) was used to image 99mTc-glucarate uptake in the hearts of rats as a measure of the extent of myocardial necrosis following experimental coronary occlusion (Fig. 11-21). The investigators demonstrated that administration of the α1 adenosine receptor agonist 2-chloro-N6-cyclopentyladenosine reduced infarct size to the same extent as that obtained with ischemic preconditioning (IPC), and that the degree of protection was lost in the presence of a nonselective adenosine receptor antagonist, SPT.44 This study is an excellent example of how quantitative microSPECT imaging can be used as an endpoint when assessing the efficacy of new therapies in experimental models.
Dual-Isotope Imaging of Myocardial Perfusion and Inflammation
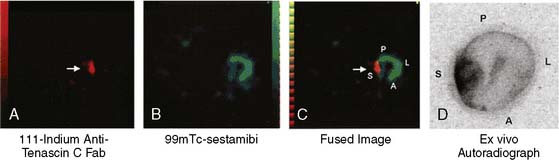
Sato et al. reported on the use of a radiolabeled anti-tenascin-C monoclonal antibody for imaging myocardial inflammation.45 In a rat model of autoimmune myocarditis produced by immunization with porcine myosin twice over a 7-day interval, these investigators demonstrated high accumulation of 111In-labeled anti-tenascin-C antibody in the inflamed myocardial region. Using a dual-isotope approach with 111In-anti-tenascin-C and 99mTc-sestamibi (Fig. 11-22) and SPECT imaging, these investigators demonstrated that the focal uptake of 111In-anti-tenascin-C antibody in the septal wall could easily be visualized in vivo. The camera system utilized for these experiments was a three-headed clinical SPECT camera with 1-mm pinholes on each detector. The fused image shown in panel C of Figure 11-22 highlights the multi-isotope advantage of SPECT instrumentation, whereby the sestamibi perfusion image can serve as an anatomic marker that is helpful for localizing the focal uptake of the “hot spot” tracer in the myocardium. Even with dual-modality hybrid microSPECT/CT systems where the CT image is extremely valuable as an anatomic reference point, the use of different isotopes to simultaneously image different aspects of cardiovascular system under study is advantageous.
Monocyte Trafficking in Atherosclerosis
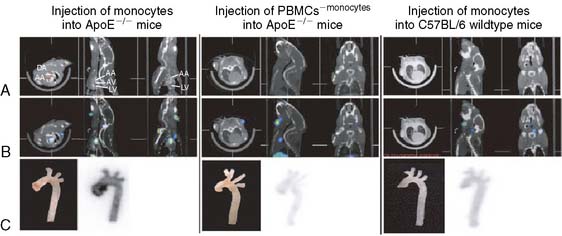
In another recent study, Kircher et al. used a commercially available dual-modality microSPECT/CT (X-SPECT, Gamma Medica Ideas, Inc.) to follow monocyte trafficking in a murine model of atherosclerosis.46 ApoE−/− subjects were fed for several weeks on the Western diet to produce atherosclerotic plaques. Monocytes were isolated from donor wild-type mice and labeled ex vivo with 111In-oxine. Approximately 3 × 10⁶ labeled cells were then injected into a tail vein, and serial microSPECT/CT imaging was performed over 5 days. Figure 11-23 depicts the CT (row A), fused microSPECT/CT (row B), and postmortem phosphor plate autoradiographs of the excised aortas (row C). The panel on the left shows an ApoE−/− mouse that received the indium-labeled monocytes. As shown, the monocytes homed in on the atherosclerotic region of the ascending aorta, which was confirmed by immunohistochemistry. The binding specificity was demonstrated using a mouse that received a fraction of cells that had been depleted of monocytes (middle panel) and with a negative control wild-type mouse with no atherosclerosis (right panel). In both of these negative controls, no uptake of the indium-labeled tracer was observed in the aortic arch. The longer half-life of the single photon isotope 111In (2.7 days) allowed for the monitoring of the same population of labeled cells over time. As mentioned earlier, this ability to track cells over a period of days is one of the advantages of using microSPECT over microPET.
Imaging Matrix Metalloproteinase Expression in Vascular Remodeling
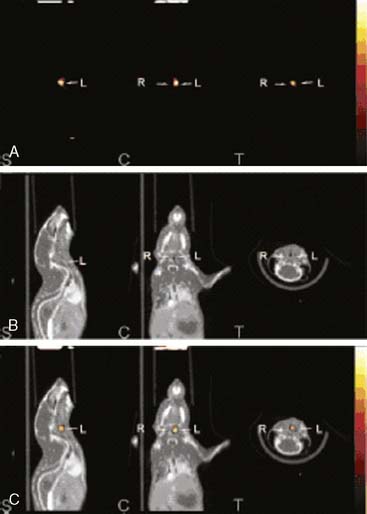
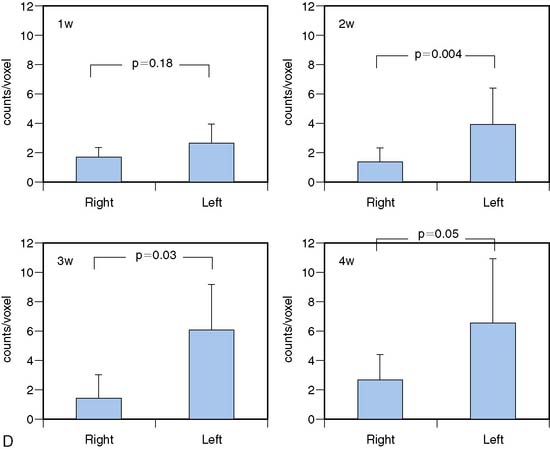
Zhang et al. utilized high-resolution microSPECT/CT to image activated matrix metalloproteinases (MMPs) using a novel 111In-labeled tracer (RP782).47 ApoE−/− mice that had been fed a high-cholesterol diet were subjected to left common carotid injury. RP782 was administered at 1, 2, 3, and 4 weeks after injury. The microSPECT camera utilized 1-mm-diameter pinhole collimators. To enhance CT contrast, an infusion of an iodinated contrast agent (iohexol, 100 μL/min) was given. As shown in Figure 11-24, at 3 weeks postinjury, an RP782 hotspot was observed in the injured left carotid artery but not in the uninjured right carotid artery. Importantly, image quantification (panel D) allowed for the determination of the time course of MMP activation. This study provides an excellent example of the importance of using a second modality, in this case CT, to help localize the uptake of the radiolabeled probe. It also demonstrates that the use of an iodinated CT contrast agent can greatly enhance the CT image for this purpose.
1. Lecomte R., Cadorette J., Richard P., et al. Initial results from Sherbrooke avalanche photodiode positron tomograph. IEEE Trans Nucl Sci. 1996;41:1446-1452.
2. Cherry S.R., Shao Y., S R.W., et al. MicroPET: a high resolution PET scanner for imaging small animals. IEEE Trans Nucl Sci. 1997;44:1161-1166.
3. Chatziioannou A.F., Cherry S.R., Shao Y., et al. Performance evaluation of microPET: a high-resolution lutetium oxyorthosilicate PET scanner for animal imaging. J Nucl Med. 1999;40(7):1164-1175.
4. Chatziioannou A., Tai Y.C., Doshi N., Cherry S.R. Detector development for microPET II: a 1 microl resolution PET scanner for small animal imaging. Phys Med Biol. 2001;46(11):2899-2910.
5. Ziegler S.I., Pichler B.J., Boening G., et al. A prototype high-resolution animal positron tomograph with avalanche photodiode arrays and LSO crystals. Eur J Nucl Med. 2001;28(2):136-143.
6. Blasberg R. PET imaging of gene expression. Eur J Cancer. 2002;38(16):2137-2146.
7. Cherry S.R., Gambhir S.S. Use of positron emission tomography in animal research. ILAR J. 2001;42(3):219-232.
8. Chatziioannou A.F. Molecular imaging of small animals with dedicated PET tomographs. Eur J Nucl Med. 2002;29(1):98-114.
9. Herschman H.R., MacLaren D.C., Iyer M., et al. Seeing is believing: non-invasive, quantitative and repetitive imaging of reporter gene expression in living animals, using positron emission tomography. J Neurosci Res. 2000;59(6):699-705.
10. Gambhir S.S. Molecular imaging of cancer with positron emission tomography. Nat Rev Cancer. 2002;2(9):683-693.
11. Gambhir S.S., Herschman H.R., Cherry S.R., et al. Imaging transgene expression with radionuclide imaging technologies. Neoplasia. 2000;2(1–2):118-138.
12. Schafers K.P. Imaging small animals with positron emission tomography. Nuklearmedizin. 2003;42(3):86-89.
13. Rowland D.J., Lewis J.S., Welch M.J. Molecular imaging: the application of small animal positron emission tomography. J Cell Biochem Suppl. 2002;39:110-115.
14. Laforest R., Longord D., Siegel S., Newport D.F., Yap J: Performance evaluation of the microPET-Focus-F120. In Paper presented at: IEEE Nuclear Science Symposium and Medical Imaging Conference, Rome, Italy, 2004.
15. Kudo T., Fukuchi K., Annala A.J., et al. Noninvasive measurement of myocardial activity concentrations and perfusion defect sizes in rats with a new small-animal positron emission tomograph. Circulation. 2002;106(1):118-123.
16. Chatziioannou A., Qi J., Moore A., et al. Comparison of 3-D maximum a posteriori and filtered backprojection algorithms for high-resolution animal imaging with microPET. IEEE Trans Med Imaging. 2000;19(5):507-512.
17. Schelbert H.R., Inubushi M., Ross R.S. PET imaging in small animals. J Nucl Cardiol. 2003;10(5):513-520.
18. Lecomte R., Croteau E., Gauthier M.-E., et al. Cardiac PET imaging of blood flow, metabolism and function in normal and infarcted rats. IEEE Trans Nucl Sci. 2003. (in press)
19. Chow P.L., Rannou F.R., Chatziioannou A.F. Attenuation correction for small animal PET tomographs. Phys Med Biol. 2005;50(8):1837-1850.
20. Finck B.N., Lehman J.J., Leone T.C., et al. The cardiac phenotype induced by PPARalpha overexpression mimics that caused by diabetes mellitus. J Clin Invest. 2002;109(1):121-130.
21. Shai S.Y., Harpf A.E., Babbitt C.J., et al. Cardiac myocyte-specific excision of the beta-1 integrin gene results in myocardial fibrosis and cardiac failure. Circ Res. 2002;90(4):458-464.
22. Blasberg R. Imaging gene expression and endogenous molecular processes: molecular imaging. J Cereb Blood Flow Metab. 2002;22(10):1157-1164.
23. Min J.J., Gambhir S.S. Gene therapy progress and prospects: noninvasive imaging of gene therapy in living subjects. Gene Ther. 2004;11(2):115-125.
24. Bengel F.M., Anton M., Avril N., et al. Uptake of radiolabeled 2′-fluoro-2′-deoxy-5-iodo-1-beta-D-arabinofuranosyluracil in cardiac cells after adenoviral transfer of the herpesvirus thymidine kinase gene: the cellular basis for cardiac gene imaging. Circulation. 2000;102(9):948-950.
25. Wu J.C., Inubushi M., Sundaresan G., Schelbert H.R., Gambhir S.S. Positron emission tomography imaging of cardiac reporter gene expression in living rats. Circulation. 2002;106(2):180-183.
26. Wu J.C., Inubushi M., Sundaresan G., Schelbert H.R., Gambhir S.S. Optical imaging of cardiac reporter gene expression in living rats. Circulation. 2002;105(14):1631-1634.
27. Inubushi M., Wu J.C., Gambhir S.S., et al. Positron-emission tomography reporter gene expression imaging in rat myocardium. Circulation. 2003;107(2):326-332.
28. Wu J.C., Chen I.Y., Sundaresan G., et al. Molecular imaging of cardiac cell transplantation in living animals using optical bioluminescence and positron emission tomography. Circulation. 2003;108(11):1302-1305.
29. Pain F., Laniece P., Mastrippolito R., Gervais P., Hantraye P., Besret L. Arterial input function measurement without blood sampling using a beta-microprobe in rats. J Nucl Med. 2004;45(9):1577-1582.
30. Laforest R., Sharp T.L., Engelbach J.A., et al. Measurement of input functions in rodents: challenges and solutions. Nucl Med Biol. 2005;32(7):679-685.
31. Fang Y.H., Muzic R.F.Jr. Spillover and partial-volume correction for image-derived input functions for small-animal 18F-FDG PET studies. J Nucl Med. 2008;49(4):606-614.
32. Kundu B.K., Locke L., Berr S., Matherne G., Lankford A. Dynamic FDG-PET imaging in-vivo to evaluate glucose metabolism in a mouse model of myocardial hypertrophy. J Nucl Med. 2008;49(Suppl 1):184P.
33. Phelps M.E. PET: Molecular Imaging and Its Biological Applications. New York, NY: Springer-Verlag, 2004.
34. Bentourkia M., Croteau E., Aliaga A., et al. Cardiac studies in rats with 11C-acetate and PET: A comparison with 13N-ammonia. IEEE Trans Nucl Sci. 2002;49(5):2322-2327.
35. Waller C., Kahler E., Hiller K.H., et al. Myocardial perfusion and intracapillary blood volume in rats at rest and with coronary dilatation: MR imaging in vivo with use of a spin-labeling technique. Radiology. 2000;215(1):189-197.
36. Armbrecht J.J., Buxton D.B., Brunken R.C., Phelps M.E., Schelbert H.R. Regional myocardial oxygen consumption determined noninvasively in humans with [1-11C]acetate and dynamic positron tomography. Circulation. 1989;80(4):863-872.
37. Inubushi M., Jordan M.C., Roos K.P., et al. Nitrogen-13 ammonia cardiac positron emission tomography in mice: effects of clonidine-induced changes in cardiac work on myocardial perfusion. Eur J Nucl Med Mol Imaging. 2004;31(1):110-116.
38. Wu H.M., Stout D., Shoghi-Jadid K., Schiepers C., Chatziioannou A., Huang S.C. Derivation of input function from dynamic FDG-microPET images of mice (abstract). Mol Imaging Biol. 2002;4(Suppl 1):S43.
39. Qi J., Leahy R.M., Cherry S.R., Chatziioannou A., Farquhar T.H. High-resolution 3D Bayesian image reconstruction using the microPET small-animal scanner. Phys Med Biol. 1998;43(4):1001-1013.
40. Goertzen A.L., Meadors A.K., Silverman R.W., Cherry S.R. Simultaneous molecular and anatomical imaging of the mouse in vivo. Phys Med Biol. 2002;47(24):4315-4328.
41. Judenhofer M.S., Catana C., Swann B.K., et al. PET/MR images acquired with a compact MR-compatible PET detector in a 7-T magnet. Radiology. 2007;244(3):807-814.
42. van der Have F., Vastenhouw B., Ramakers R.M., et al. U-SPECT-II: An ultra-high-resolution device for molecular small-animal imaging. J Nucl Med. 2009;50:599-605.
43. Maskali F., Franken P.R., Poussier S., et al. Initial infarct size predicts subsequent cardiac remodeling in the rat infarct model: an in vivo serial pinhole gated SPECT study. J Nucl Med. 2006;47(2):337-344.
44. Liu Z., Barrett H.H., Stevenson G.D., Furenlid L.R., Pak K.Y., Woolfenden J.M. Evaluating the protective role of ischaemic preconditioning in rat hearts using a stationary small-animal SPECT imager and 99mTc-glucarate. Nucl Med Commun. 2008;29(2):120-128.
45. Sato M., Toyozaki T., Odaka K., et al. Detection of experimental autoimmune myocarditis in rats by 111In monoclonal antibody specific for tenascin-C. Circulation. 2002;106(11):1397-1402.
46. Kircher M.F., Grimm J., Swirski F.K., et al. Noninvasive in vivo imaging of monocyte trafficking to atherosclerotic lesions. Circulation. 2008;117(3):388-395.
47. Zhang J., Nie L., Razavian M., et al. Molecular imaging of activated matrix metalloproteinases in vascular remodeling. Circulation. 2008;118(19):1953-1960.
[/level-membership-for-internal-medicine-category][not-level-membership-for-internal-medicine-category]
Chapter 11 State-of-the-Art Instrumentation for PET and SPECT Imaging in Small Animals
MICRO–POSITRON EMISSION TOMOGRAPHY
Dedicated, high spatial resolution small-animal PET imaging devices have become available. Some are in-house-developed systems at several research institutions,1–5 but more recently, dedicated small-animal systems have become available through several commercial suppliers. The spatial resolution of these imaging devices is typically in the range of 1.0 to 1.5 mm full-width at half-maximum (FWHM) and enables mapping of the distribution of positron-emitting radiotracer and its changes over time throughout the body of small animals. These imaging systems have been used quite extensively for measuring substrate metabolism and cell replication rates of tumors as indices of tumor growth rates and tumor aggressiveness, and for determining responses of tumor growth to investigational therapeutic agents.6–10 Other research has utilized these small-animal imaging devices for the development and validation of novel noninvasive assays for identifying activation and expression of transgenes.6,9–11
POSITRON EMISSION TOMOGRAPHY IMAGING OF THE RODENT HEART
The small dimensions of the rodent heart pose formidable challenges for PET studies of the cardiovascular system in rodents. In general, dedicated small-animal PET systems employ two different technical concepts: (1) crystal detector–based and (2) multiwire proportional chamber–based systems.12,13 As shown in Figure 11-1, multiwire proportional chamber–based systems may offer superior spatial or volume resolution but generally are less sensitive and require longer image acquisition times. Conversely, crystal-based systems offer higher sensitivity (count rate per unit radioactivity) and offer superior temporal resolution but at the expense of somewhat lower spatial resolution (Fig. 11-2).
Several commercial small-animal scanners are now available since the first prototype scanner was built at University of California, Los Angeles. Figure 11-3 shows one such small-animal PET scanner, the microPET Focus 120.14 This system consists of 96 scintillation detectors arranged in four rings with a 14.7-cm diameter and 7.6-cm axial extent. Each detector consists of a 12 × 12 array of 1.52 × 1.52 × 10 mm lutetium oxyorthosilicate (LSO) crystals coupled to a position-sensitive photomultiplier tube (PS-PMT) via optical fiber bundles. Data are acquired in three-dimensional (3D) mode. With standard filtered backprojection reconstruction algorithms, the system achieves an isotropic (in all three directions) spatial resolution of 1.5 mm in the center of the field of view (FOV) and remains less than 2.0 mm within 5 cm of the center of the FOV. Imaging of the myocardium in mice and rats with the flow tracer 13N-ammonia or the glucose analogue 18F-deoxyglucose typically requires activity doses of 0.5 to 1.5 mCi.15 Count rates at these radioactivity doses remain relatively low so that dead-time losses are small. Image reconstruction with the more recently developed maximum a posteriori probability (MAP) algorithm, now employed for cardiac studies in mice, provides images of myocardial perfusion and glucose uptake of good to excellent diagnostic quality (see Fig. 11-2).16 The MAP reconstruction algorithm improves the spatial resolution in the center of the FOV to 1.2 mm FWHM so that a volumetric resolution of less than 5 microliters is now possible.
The emission data are reconstructed initially into a set of contiguous transaxial slices with a 0.75-mm interplane spacing (Fig. 11-4).17 The transaxial images are typically reoriented into short-axis and vertical and horizontal long-axis cuts (Fig. 11-5)17 that can be assembled into polar maps analogous to those of myocardial perfusion studies in humans (Fig. 11-6).17 Images of glucose uptake obtained with 18F-deoxyglucose are of greater contrast and higher quality than images of perfusion obtained with 13N-ammonia. This is most likely because of the more complete clearance of 18F-deoxyglucose from blood and higher tracer activity concentrations in the myocardium. Another reason is the slower physical decay of 18F-deoxyglucose so that over the total image acquisition time, more counts are recorded. On the other hand, the shorter physical half-life of 13N-ammonia affords the ability to perform repeat examinations of myocardial blood flow during the same study session so that effects of interventions can be evaluated. ECG gated image acquisition is also possible with small PET systems so that left ventricular function can be assessed.18 For example, in normal 300-g rats, the left ventricular ejection fraction was about 60% to 70%, and the stroke volume was about 300 μL.18
Figure 11-5 Reoriented images of the myocardial 18F-deoxyglucose uptake in the same mouse as depicted in Figure 11-4. Selected short-axis (upper row) and vertical and horizontal long-axis cuts are shown.
(Reproduced with permission from Schelbert HR, Inubushi M, Ross RS: PET imaging in small animals. J Nucl Cardiol 10:513–520, 2003.)
Figure 11-6 Polar map display of the 18F-deoxyglucose uptake in the left ventricular myocardium in the mouse depicted in Figures 11-4 and 11-5.
(Reproduced with permission from Schelbert HR, Inubushi M, Ross RS: PET imaging in small animals. J Nucl Cardiol 10:513–520, 2003.)
The image reconstruction algorithm corrects for radioactive decay and for dead-time losses. It also includes routines for photon attenuation correction. These routines utilize transmission images that are typically acquired prior to radiotracer administration and are performed using a Co57 point source or, for hybrid microPET/CT systems, an x-ray attenuation map. Despite the small body size of rats, photon attenuation causes about 30% systematic underestimation of the true myocardial radioactivity concentration.19 Albeit somewhat less in mice, photon attenuation still amounts to about 17% underestimation of the true activity. Accordingly, even in small animals, proper attenuation correction is important for the measurement of the true absolute intensities in cardiac imaging. Chow et al.19 have shown that CT-based attenuation correction methods result in less noise correction to emission images compared to the transmission-based attenuation corrections.
The stationary imaging gantry of microPET permits rapid serial (or “dynamic”) acquisition of images. Theoretically, images can be recorded at sampling rates of less than 1 second. For practical purposes, however, image acquisition rates depend on the number of counts required for statistically adequate image frames. Framing rates in the range of 2 to 10 seconds per image following an intravenous bolus of 13N-ammonia, 18F-deoxyglucose, or 11C-palmitate produce statistically adequate images for generating tissue time-activity curves and thus are appropriate for radiotracer kinetic studies.20 Figure 11-7 depicts selected frames acquired during and shortly after an intravenous bolus injection of 13N-ammonia in a rat. High temporal-resolution tissue time-activity curves for the right and left ventricular blood pools and the left ventricular myocardium in a rat following an intravenous bolus of 18F-deoxyglucose into a tail vein are shown in Figure 11-8.
IMAGING THE CARDIOVASCULAR SYSTEM IN MICE AND RATS
Experimental Coronary Occlusions in the Rat
The extent and severity of regional myocardial perfusion defects that are experimentally induced by transient coronary occlusions in rats can be accurately determined with microPET.15 In Figure 11-9, myocardial perfusion was imaged with intravenous 13N-ammonia at baseline, 45 minutes later during a 20-minute coronary occlusion, and again 45 minutes following reperfusion. Figure 11-10 shows the corresponding polar map displays. The location and extent of the image perfusion defects corresponded well with the actual regions observed on postmortem stained tissue. Using a threshold of 50% of the maximum myocardial activity concentration as the lower limit of normal, the size of the flow defect derived from polar maps of myocardial perfusion correlated linearly with the defect sizes determined by postmortem examination (Fig. 11-11).
Figure 11-10 Polar map display of the distribution of myocardial blood flow recorded serially before, during, and following a transient coronary occlusion in the rat depicted in Figure 11-7. Note the perfusion defect on the polar map during the occlusion, as indicated in blue.
(Reproduced with permission from Kudo T, Fukuchi K, Annala AJ, et al: Noninvasive measurement of myocardial activity concentrations and perfusion defect sizes in rats with a new small-animal positron emission tomograph, Circulation 106:118–123, 2002.)
Studies in Genetically Modified Mice
Initial studies have demonstrated the possibility of phenotyping genetically modified mice. For example, cardiac myocyte-specific excision of the murine β-1 integrin gene results in extensive myocardial fibrosis.21 In adulthood, the mice develop a form of dilated cardiomyopathy and symptoms of congestive heart failure. MicroPET imaging with 18F-deoxyglucose in β-1-integrin knockout mice revealed heterogeneously distributed tracer uptake consistent with either replacement of myocytes by fibrotic tissue or as a consequence of regional alterations in substrate metabolism (Fig. 11-12). Assessment of myocardial perfusion with 13N-ammonia in the β-1-integrin knockout mouse further revealed heterogeneously distributed myocardial blood flow in addition to patchy regions of reduced tracer uptake.
Development of Novel Radiotracer Assay Approaches
Noninvasive, image-based probe systems for studying location, extent, magnitude, and duration of gene expression have also been explored and are now being used in small animals. One approach used in oncologic studies in mice has been the PET reporter gene/reporter probe system.9–11,22 In one of these systems, a mutant herpes simplex virus thymidine kinase gene is delivered by an adenoviral vector and represents the PET reporter gene. If expressed in tissue, thymidine kinase phosphorylates the radiolabeled 9-(4-[18F]-fluoro-3 hydroxymethylbutyl) (guanine) (18FHBG) that serves as the PET reporter probe. Because the phosphorylated product of 18FHBG is relatively impermeable to the cell membrane, it becomes effectively trapped in tissue and thus can be imaged with PET. Details on this in vivo assay approach and on other probe systems are described in several recent reviews.6,9,10,23
Pilot studies with in vitro imaging approaches had explored the feasibility of adapting these probe systems to the heart.24
[/not-level-membership-for-internal-medicine-category]
