Chapter 2
Spirometry
1. Determine whether spirometry is acceptable and repeatable.
2. Identify airway obstruction using vital capacity (VC) and forced expiratory volume in one second (FEV1).
3. Differentiate between obstruction and restriction as causes of reduced VC.
4. Determine whether there is a significant response to bronchodilators.
1. Select the appropriate VC and FEV1 for reporting from a series of spirometry maneuvers.
2. Quantify the degree of obstruction according to ATS-ERS criteria.
3. Describe the characteristics of an intrathoracic or extrathoracic obstruction pattern.
Vital capacity
Description
The VC is the volume of gas measured from a slow, complete expiration after a maximal inspiration, without forced or rapid effort (Figure 2-1). Alternately, VC may be recorded as a maximal inspiration following a complete expiration. VC is normally recorded in either liters (L) or milliliters (mL), and reported at body temperature, pressure, and saturation (BTPS). VC is sometimes referred to as the slow vital capacity (SVC), distinguishing it from FVC. Inspiratory capacity (IC) and expiratory reserve volume (ERV) are subdivisions of the VC. IC is the largest volume of gas that can be inspired from the resting expiratory level (see Figure 2-1). IC is sometimes further divided into the tidal volume (VT) and inspiratory reserve volume (IRV). ERV is the largest volume of gas that can be expired from the resting end-expiratory level (see Figure 2-1). Both the IC and ERV are recorded in liters or milliliters, corrected to BTPS.
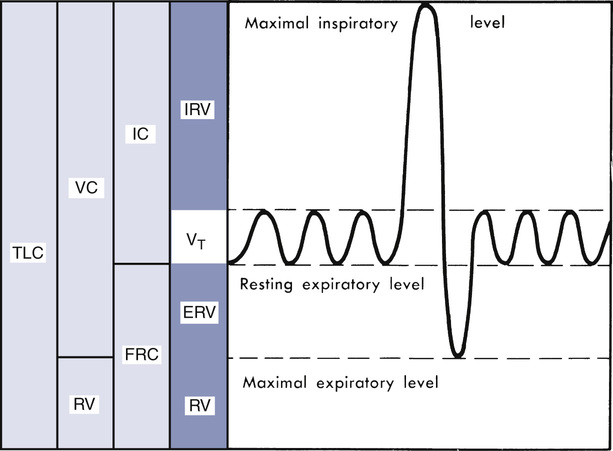
Diagrammatic representation of lung volumes and capacities based on a simple spirogram. TLC, total lung capacity; VC, vital capacity; RV, residual volume; FRC, functional residual capacity; IC, inspiratory capacity; Vt, tidal volume; IRV, inspiratory reserve volume; ERV, expiratory reserve volume. Relationships between the subdivisions and relative sizes as compared with TLC are shown (shaded areas). Resting expiratory level is used as a starting point for FRC determinations because it remains more stable than other identifiable points during repeated measurements. (Modified from Comroe JH Jr, Forster RE, Dubois AB, et al. The lung: Clinical physiology and pulmonary function tests. 2nd ed. St. Louis: 1962; Mosby.)
Technique
VC is measured by having the patient inspire maximally and then exhale completely into a spirometer. (See Chapter 11 for a complete discussion of spirometers.) The patient is instructed to perform the maneuver slowly and completely. VC can also be measured from maximal expiration to maximal inspiration. The spirometer does not need to produce a graphic display if only VC is to be measured. However, if IC and ERV are to be determined (see Figure 2-1), some means of recording volume change is required. The graphic display may be a computer screen or a recording device (see Chapter 11). A graphic display allows the technologist to determine that the test is performed correctly (Criteria for Acceptability 2-1). A graphic display is also usually required for reimbursement purposes.
Obtaining a valid slow VC is important. The subdivisions of the VC (IC and ERV) are used in the calculation of residual volume (RV) and total lung capacity (TLC). An excessively large tidal volume or an irregular breathing pattern during the VC maneuver may alter ERV or IC. If either ERV or IC is erroneously recorded, other lung volumes may be incorrectly estimated (see Chapter 4).
The accuracy of the IC and ERV measurements depends on the stability of the end-expiratory level, which should vary by less than 100 mL. Three or more tidal breaths should be recorded before the VC maneuver is performed. If the end-expiratory volume is not consistent, IC and/or ERV may be measured incorrectly (i.e., too large or too small). Even if the end-expiratory level is constant, the VT usually increases when the patient breathes through a mouthpiece with a noseclip in place. This increase in VT may change the IC or ERV, depending on the patient’s breathing pattern. Erroneous estimates of ERV may affect the calculation of RV, as described in Chapter 4.
Significance and Pathophysiology
Spirometry is indicated in a variety of situations (see Chapter 1). According to the 2005 ATS-ERS recommendations, there is only one contraindication to spirometry but several conditions that could yield a suboptimal test (Box 2-1). However, testing personnel should be aware of other conditions, which should be evaluated before testing, such as recent stroke, eye surgery, thoracic/abdominal surgery or pneumothorax, uncontrolled hypertension or hypotension,and known thoracic, aortic, or cerebral aneurysm.
Normal VC may vary as much as 20% above or below the predicted value in healthy individuals, but it must be above the bottom 5th percentile (lower limit of normal; see Chapter 13) to be considered normal. The ATS-ERS guidelines recommend the use of the National Health and Nutrition Examination Survey III (NHANES III) reference equations (see Evolve website http://evolve.elsevier.com/Mottram/Ruppel/) for patients in the United States ages 8-80 years. For children under 8 years old, the guidelines recommend the equations of Wang and others. However, in 2007, Stanojevic and others extended the NHANES III dataset to age 4 years.
In adults, VC varies directly with height and inversely with age; tall patients have larger VCs than short patients. VC increases up to approximately age 20 and then decreases each year thereafter, with an average decrease of about 25-30 mL/yr. It is usually smaller in women than in men because of differences in body size. Recent evidence indicates that lung volumes may differ significantly according to ethnic origin. VC also varies in individuals, depending on body position or time of day. Interpretation of lung function should consider the key factors of age, sex, height, and race (see Chapter 13).

where:
Predicted values may be read from special diagrams called nomograms but are usually calculated by a computer. (See Chapter 13.) The lower limit of normal, representing the lower 5th percentile of the normal distribution curve, is recommended as the cutoff to judge normality.
As Hutchinson originally noted (see Chapter 1), a patient’s vital capacity is directly related to survival, and numerous studies have since supported his conclusion. In a study published in 2011 using data on spirometry and survival from the Atherosclerosis Risk in Communities (ARIC) dataset, 7489 participants with usable spirometry data were compared against measures of ventilatory function after controlling for many other factors likely to be associated with survival. The study concluded that survival was strongly associated with the forced vital capacity over all other spirometry parameters.
There are numerous causes of a decreased VC (Box 2-2). In general, these fall into the categories of loss of distensible lung tissue (i.e., fibrosis), obstructive lung disease, and reduced chest wall expansion (i.e., neuromuscular, kyphosis).
When the VC is reduced, additional pulmonary function measurements may be indicated. Forced expiratory maneuvers (see section, Forced Vital Capacity) can reveal whether the reduced VC is caused by obstruction. Reduced VC without slowing of expiratory flow is a nonspecific finding. Measurement of other lung volumes (see Chapter 4) may be indicated to determine whether a restrictive defect is present. Measurement of muscle pressures may help determine whether there is a problem with neuromuscular weakness (see Chapter 10).
In adults, VC less than the lower limit of normal (95% confidence limits, see Chapter 13) may be considered abnormal. Interpretation of the measured VC in relation to the reference value should consider the clinical question to be answered (Interpretive Strategies 2-1). The clinical question is often revealed in the history and physical findings of the patient (see Chapter 1). The terms mild, moderate, and severe may be used to qualify the extent of reduction of the VC in a manner similar to that described for FEV1 (see following section, FEV1).
Artificially low estimates of the VC may result from poor patient effort. Similarly, inadequate patient instruction may affect the performance of the test maneuver. These errors may be eliminated by applying appropriate criteria (Criteria for Acceptability 2-1). Values for at least two maneuvers should be reproducible within 150 mL (see Chapter 12).
IC and ERV are approximately 75% and 25% of the VC, respectively. Changes in IC or ERV usually parallel increases or decreases in the VC. Increased VT caused by exertion or acid-base disorders (e.g., metabolic acidosis, respiratory alkalosis) may reduce IRV or ERV. This occurs because end-inspiratory and end-expiratory levels (see Figure 2-1) are altered. A similar pattern is commonly seen when patients breathe into a spirometer through a mouthpiece with noseclips in place. Changes in IC or ERV are of minimal diagnostic significance when considered alone. Reduction of IC or ERV is consistent with restrictive defects. Obese patients typically show a decrease in ERV, usually resulting in a low VC. A reduced ERV is one of the earliest lung function changes in obese patients.
Forced Vital Capacity, Forced Expiratory Volume, and Forced Expiratory Flow
Description
Technique
FVC is measured by having the patient, after inspiring maximally, expire as forcefully and rapidly as possible into a spirometer (see Chapter 1). The patient should inspire completely. The inhalation should be rapid but not forced. There should be little, if any, pause (less than 1-2 seconds) at maximal inspiration; a prolonged pause (4-6 seconds) may decrease flow during the subsequent expiration.
The volume expired may be read directly from a volume-time recording (Figure 2-2). This method is used by some small portable spirometers. More commonly, the maneuver is displayed on a computer monitor or liquid crystal display screen. The computer analyzes the signal from the spirometer, then calculates and displays the FVC. A spirometer that produces a graphical tracing (either volume-time or flow-volume) is essential for clinical
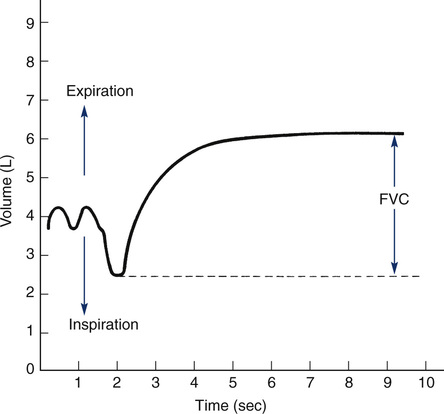
Typical spirogram plotting volume against time as patient exhales forcefully. In this tracing, expiration causes an upward deflection; in some systems, the tracing is inverted. The patient inspires to the maximal inspiratory level (dashed line), at which point lung volume is close to TLC. The patient then expires as forcefully and rapidly as possible to the maximal expiratory level, at which point the lungs contain the RV only (see text).
laboratory purposes to allow a visual inspection of the maneuver (Figure 2-3) and is also necessary for reimbursement purposes. Devices providing only numerical data may be helpful for simple screening. Whether used for diagnosis or monitoring, all spirometers should meet the criteria proposed by the ATS-ERS (see Chapter 12). The FVC maneuver depends on patient effort. Not all patients may be able to perform it acceptably (Criteria for Acceptability 2-2).
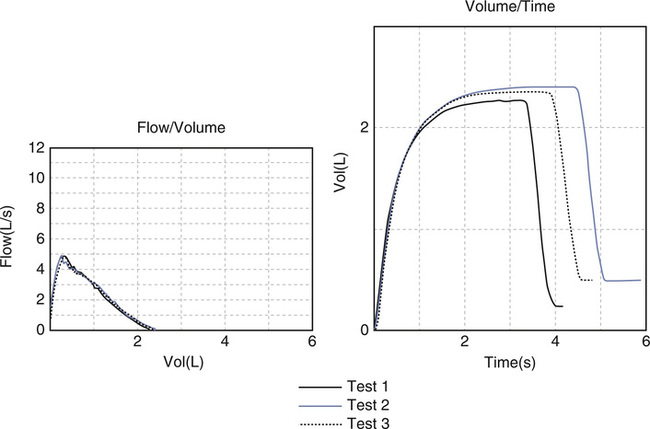
Acceptability based on a fast start (no hesitation), a sharp peak flow, no cough or glottic closure in the first second, and meeting the end of test criteria.
FEV1 (and other FEVT values) may be measured by timing the FVC maneuver over the described intervals. Historically, this was done by recording the FVC spirogram on graph paper moving at a fixed speed. The FEV for any interval could then be read from the graph, as shown in Figure 2-4. Most modern spirometers time the FVC maneuver using a computer. The computer then calculates and displays the FEV1 or other FEVT intervals. The spirometer should provide a volume-time display of each maneuver (Figure 2-5). A graphic representation allows the monitoring of patient effort at the beginning of the test. Accurate measurement of FEV1 (and other FEVT intervals) depends on the determination of the start-of-test (Figure 2-6). Computerized spirometers detect the start-of-test as a change in flow or volume above a certain threshold. The computer then stores volume and flow data points in memory and calculates the FEV1.
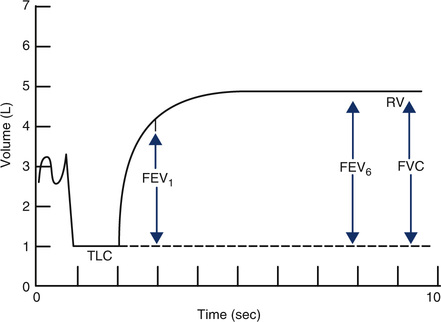
Various FEVT values can be measured from the volume-time display of an FVC effort. FEV at intervals of 1 and 6 seconds, along with the FVC, are shown (arrows). FEV1 is the most commonly used index of airflow. FEV6 is sometimes used as a surrogate for FVC in patients with airway obstruction. Precise timing and acceptable start-of-test are required to determine FEVT values accurately (Criteria for Acceptability 2-2).
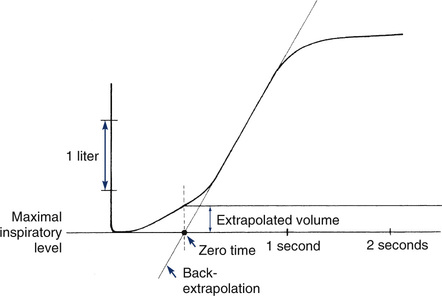
Back-extrapolation is a method for correcting measurements made from a spirogram that does not show a sharp deflection from the maximal inspiratory level. This occurs when a patient does not begin forced exhalation rapidly enough or hesitates at the start-of-test. A straight line drawn through the steepest part of a volume-time tracing is extended to cross the volume baseline (maximum inspiration). The point of intersection is the back-extrapolated time zero. To accurately determine the new time zero, the display should include at least 0.25 seconds and preferably at least 1 second before the start of the exhalation. Timed volumes, such as FEV1, are measured from this point rather than from the initial deflection from the baseline or from the point of maximal flow. The perpendicular distance from maximal inspiration to the volume-time tracing at time zero defines the back-extrapolated volume. To accurately determine FEV1, the back-extrapolated volume should be less than 5% of the FVC or less than 150 mL, whichever is greater. FVC efforts with larger extrapolated volumes should be considered unacceptable.
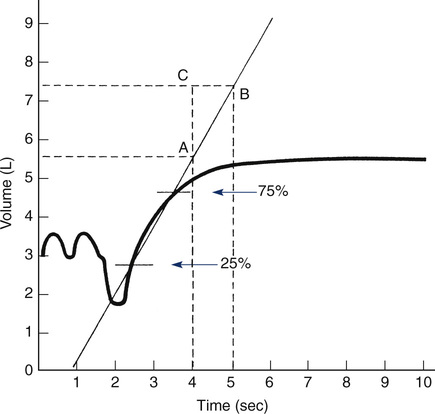
The slope of the line connecting 25% and 75% points is the average flow over the middle half of the FVC maneuver. Alternatively, a line connecting these points may be drawn to intersect two timelines 1 second apart (points A and B). The flow in liters per second can be read as the vertical distance between the points of intersection (AC)—in this case, approximately 2 L/sec.
Open circuit technique describes an FVC maneuver where the subject inhales maximally, places the mouthpiece or filter into their mouth, and then forcefully exhales until empty. Using this technique, the patient has to coordinate taking the deep breath, holding the breath at TLC, and placing the mouthpiece correctly, which can be a challenge for some subjects. Closed-circuit technique describes a maneuver where the subject breathes tidally on the spirometer, inhales maximally, forcefully exhales, and then may be instructed to inhale forcefully to measure the inspiratory flow and volume. Most computerized spirometers correct for a slow start-of-test by back-extrapolation (see Figure 2-5). Visualization of the volume-time spirogram is the best means of identifying poor initial effort. Some portable spirometers report FEV1 without a spirogram. Such measurements should be used with caution because it may be difficult to determine whether the maneuver was performed acceptably.
The ratio of the FEV1 to FVC is expressed as follows:

The FEF25%-75% is measured from an FVC maneuver. The FEF25%-75% is the average flow during the middle half (from 25% to 75%) of the VC. A computerized measurement of the FEF25%-75% requires storage of flow and volume data points for the entire maneuver. Calculation of the average flow over the middle portion of the exhalation is simply 50% of the volume expired divided by the time required to get from the 25% point to the 75% point. To manually calculate the FEF25%-75%, a volume-time spirogram is used. The points at which 25% and 75% of the vital capacity have been expired are marked on the curve (see Figure 2-6). A straight line connecting these points can be extended to intersect two timelines 1 second apart. The flow (in liters per second) can then be read directly as the vertical distance between the points of intersection. Instantaneous flows, such as the FEF50% or FEF75%, cannot be read directly from a volume-time display but can be measured using a flow-volume curve (see later section, Flow-Volume Curve).
The FEF25%-75% depends on the FVC. Large FEF25%-75% values may be derived from maneuvers that produce small FVC measurements because the “middle half” of the volume is actually gas expired at the beginning of expiration. This effect may be particularly evident if the patient terminates the FVC maneuver before exhaling completely. When the FEF25%-75% is used for assessing the response to bronchodilator or bronchial challenge, the effect of changes in the absolute lung volumes must be considered. Measuring the FEF25%-75% at the same lung volumes in the comparison tests is called the isovolume technique. Isovolume corrections are usually applied when the FVC changes by more than 10% (indicating a change in TLC or RV). This technique requires that lung volumes (see Chapter 4) be measured in conjunction with flows. The isovolume technique may also be used with other flow measurements that are dependent on FVC.
Acceptability and Repeatability for Spirometry Results
1. The volume-time tracing should show maximal effort with a smooth curve. There should be no coughing or hesitation during the first second. The tracing should show at least 6 seconds of forced effort. An obvious plateau with no volume change (25 mL or less) for at least 1 second should be achieved. Children, adolescents, and some restricted patients may plateau in less than 6 seconds (children less than 10 years of age must exhale at least 3 seconds). Patients with severe obstruction may continue exhalation well past 15 seconds; therefore, 6 seconds is simply a minimum. In severe obstruction, very low flows may be observed at the end of expiration. Continuation of the maneuver in these patients will not appreciably change the test results. The FVC maneuver may be stopped if the patient cannot continue for clinical reasons such as excessive coughing or dizziness. Multiple prolonged (longer than 6-15 seconds) exhalations are seldom necessary.
2. The start-of-test should be abrupt and unhesitating. Each maneuver should have the back-extrapolated volume calculated. FEV1 and all other flows must be measured after back-extrapolation (see Figure 2-5). The ATS-ERS guidelines recommend that the volume-time tracing must begin at least 0.25 seconds before the beginning of the exhalation in order to be able to measure the back-extrapolated volume. If the volume of back-extrapolation is greater than 5% of the FVC or 150 mL (whichever is greater), the maneuver is unacceptable and should be repeated. The patient should be shown the correct technique for performing the maneuver. Demonstration by the technologist is often helpful.
3. A minimum of three acceptable efforts should be obtained. The test may be repeated multiple times, but if repeatable values cannot be obtained after eight attempts, testing may be discontinued. The only criterion for eliminating a test session completely is failure to obtain two acceptable maneuvers after at least eight attempts.
4. The two largest values for both FVC and FEV1 should be within 150 mL (or within 100 mL if the FVC is 1 liter or less). The second largest value is simply subtracted from the largest value for both FVC and FEV1 to determine repeatability. Some clinicians prefer to use 5% as the repeatability criterion. This may be more appropriate than an absolute volume of 150 mL, particularly in children or those with large FVC values. However, the 150 mL of absolute volume criterion has less variance than the 5% criterion, making it less dependent on individual characteristics and therefore more widely applicable to patients of varying age, gender, and baseline lung function. If the two largest FVC or FEV1 values are not within 150 mL (or 5%, if that criterion is applied), the maneuver should be repeated up to a maximum of eight times or until the patient cannot or will not continue. The repeatability criteria should be applied only after the maneuver has been judged as acceptable. Individual spirometric maneuvers should not be rejected solely because they are not repeatable. Bronchospasm or fatigue often affects repeatability. Interpretation of the test should include comments regarding repeatability or lack of it. As a minimum, three acceptable satisfactory maneuvers should be saved for evaluation. (See Figure 2-6.)
Data from all acceptable maneuvers should be examined. The largest FVC and the largest FEV1 should be reported, even if the two values are from different test maneuvers. The reported FEV1/FVC ratio is taken from these values. Flows that depend on the FVC (e.g., the FEF25%-75%) should be taken from the single best test maneuver, which is the maneuver with the largest sum of FVC and FEV1 (Table 2-1). The reported flow-volume curve is also taken from the single best test maneuver.
Table 2-1
Comparison of Spirometry Efforts
| Test | Trial 1 | Trial 2 | Trial 3 | Best Test Reported |
| FVC (L) | 5.20 | 5.30 | 5.35* | 5.35 |
| FEV1 (L) | 4.41* | 4.35 | 4.36* | 4.41 |
| FEV1/FVC (%) | 85 | 82 | 82 | 82 |
| FEF25%-75% (L/sec) | 3.87 | 3.92 | 3.94 | 3.94 |
| FEF50% (L/sec) | 3.99 | 3.95 | 3.41 | 3.41 |
| FEF25% (L/sec) | 1.97 | 1.95 | 1.89 | 1.89 |
| PEF (L/sec) | 8.39 | 9.44 | 9.89 | 9.89 |
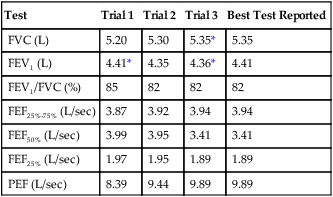
*These values are keys to selecting the best test results. The FEV1 is taken from trial 1 and the FVC from trial 3, even though the largest sum of FVC and FEV1 occurs in trial 3. All FVC-dependent flows (average and instantaneous) come from trial 3. The maximal expiratory flow-volume curve, if reported, would be the curve from trial 3 as well. It should be noted that the FEV1% (FEV1/FVC) is calculated from the FEV1 of trial 1 and the FVC of trial 3.
Significance and Pathophysiology
Forced Vital Capacity
See Interpretive Strategies 2-2. FVC usually equals VC in healthy individuals. In patients without obstruction, FVC and VC should be within 150 mL of each other. FVC and VC may differ if the patient’s effort is variable or if significant airway obstruction is present (i.e., FEV1/FVC less than 0.70). FVC is often lower than VC in patients with obstructive diseases if forced expiration causes airway collapse. This pattern is often seen in emphysema because of a loss of tethering support of the airways. Large pressure gradients across the walls of the airways during forced expiration collapse the terminal portions of the airways. Gas is trapped in the alveoli and cannot be expired. This causes the FVC to appear smaller than the VC. The FVC can appear larger than the VC if the patient exerts greater effort on the forced maneuver.
FVC can be reduced by mucus plugging and bronchiolar narrowing, as is common in chronic
bronchitis, chronic or acute asthma, bronchiectasis, and cystic fibrosis. Reduced FVC is also present in patients whose trachea or mainstem bronchi are obstructed. Tumors or diseases affecting the patency of the large airways can produce this result.
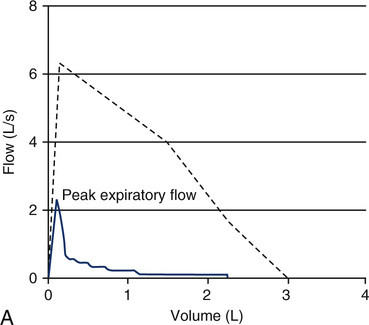
Some obstructed patients have a relatively normal FVC in relation to their predicted values. However, the time required to expire their FVC (forced expiratory time or FET) is usually prolonged. Healthy adults can expire their FVC within 4 to 6 seconds. Normal children and adolescents may exhale their FVC in less than 4 seconds. Patients with severe obstruction (e.g., those with emphysema) may require 15 seconds or more to exhale completely (Figure 2-7). Accurate measurement of FVC in such individuals may be limited by how long the spirometer can collect exhaled volume. Some spirometers allow only 15 seconds of volume recording. This is usually long enough to diagnose airway obstruction. However, the FVC and FEV1% may be inaccurate if the patient continues to exhale for a longer time. The ATS-ERS recommends that spirometers measure FVC for at least 15 seconds (see Chapter 12).
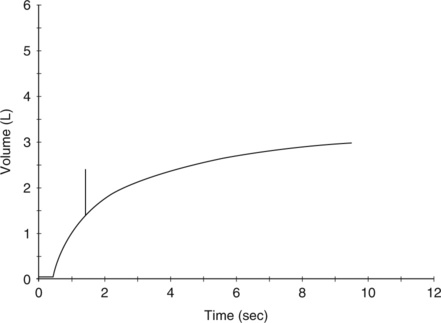
A tick mark notes the point at which the patient exhaled his FEV1. A significant volume is exhaled after the first second, and the tracing does not show an obvious plateau.
An alternative to measuring FVC in severely obstructed patients is to use FEV6. Because normal patients can exhale their FVC in 6 seconds, substituting FEV6 for FVC allows the FEV1/FEV6 to be used as an index of obstruction. Using FEV6 in place of FVC eliminates the necessity of having the patient try to exhale for a long interval. Predicted values for FEV6 and FEV1/FEV6 may be calculated using coefficients in Chapter 13. Because FEV6 may underestimate FVC, use of FEV1/FEV6 instead of FEV1/FVC may reduce the sensitivity of spirometry to detect airway obstruction, especially in older patients and in those with mild obstruction.
Reduced FVC (or VC) is a nonspecific finding. Values below the 5th percentile are considered abnormal (see Chapter 13). A low FVC may be caused by either obstruction or restriction (see Box 2-2). Interpretation of the FVC in obstructive diseases requires correlation with flows. An FVC that is significantly lower than VC suggests airway collapse and gas trapping. In restrictive patterns, low FVC may indicate the need to assess other lung volumes, particularly total lung capacity (TLC; see Chapter 4). Interpretation of FVC values close to the lower limit of normal depends on the clinical question to be answered. An FVC at the 5th percentile would be interpreted differently in a healthy patient with no symptoms than in a patient with a history of cough or wheezing. An FVC much lower than expected is often accompanied by the complaint of exertional dyspnea.
Forced Expiratory Volume (FEV1)
FEV1 measures the volume expired over the first second of an FVC maneuver. FEV1 is reported as a volume, although it measures flow over a specific interval. FEV1, like FVC, may be reduced in either obstructive or restrictive patterns (Figures 2-7 and 2-8). FEV1 values may also be reduced because of poor effort or cooperation by the patient.
ModerateFEV1 = 60%-69% predicted
Moderately severeFEV1 = 50%-59% predicted
FEV1 is the most widely used spirometric parameter, particularly for the assessment of airway obstruction. FEV1 is used in conjunction with VC for simple screening, assessment of response to bronchodilators, inhalation challenge studies, and detection of exercise-induced bronchospasm (see Chapters 7 and 9). FEV1 is the most robust pulmonary function test, making it the measurement of choice in evaluating lung function in general. In fact, the motto of the National Lung Health Education Program (NLHEP) is “Test your lungs. Know your numbers,” and these numbers are the FEV1 and FVC (or FEV6). The NLHEP advocates for the widespread use of simple office spirometry in order to increase the awareness and detection of COPD as well as other respiratory disorders. In particular, the NLHEP recommends that all smokers age 45 years and older have spirometry done to detect airflow obstruction, even before the onset of clinical symptoms.
Forced Expiratory Volume Ratio (FEVT%)
Normal FEVT% ratios for healthy adults are as follows:
Patients with unobstructed airflow can usually exhale their entire FVC within 4 seconds. Conversely, patients with obstructive disease have reduced FEVT% for each interval (1 second, 2 seconds, etc.). The FEV1/VC ratio is the most important measurement for distinguishing an obstructive impairment. A decreased FEV1/VC ratio is the hallmark of an obstructive disease. As already mentioned, the ratio decreases with age, so care should be taken in interpreting the FEV1/VC ratio in absolute terms. An absolute cutoff of 70% is considered to distinguish between normal and airflow obstruction in defining COPD by the Global Initiative for Chronic Obstructive Lung Disease (GOLD) and ATS-ERS guidelines on COPD. However, this value may actually underestimate the presence of obstruction in younger adults (false negative), and overestimate it in older individuals (false positive) (see Chapter 13 for predicted values).
Forced Expiratory Flow 25%-75%
Validity of FVC maneuvers depends largely on patient effort and cooperation. Equally important is the instruction and coaching supplied by the technologist. Many patients need several attempts before performing the maneuver acceptably. Demonstration of proper technique by the technologist helps the patient give maximal effort. Placement of the mouthpiece behind the teeth and lips, maximal inspiration, little if any pause, and maximal expiration should all be demonstrated. Emphasis should be placed on the initial burst of air and on continuing expiration for at least 6 seconds. Acceptability of each FVC maneuver should be evaluated according to specific criteria (see Criteria for Acceptability 2-2). The final report should include comments on the quality of the data obtained (see Chapter 12). These comments may be provided by the technologist, physician, or both.
Validity of the FEV1 also depends on cooperation and effort. Adequate instruction and demonstration of the maneuver by the technologist is essential. Repeatability of FEV1 should be within 150 mL for the two best of at least three acceptable maneuvers. Accurate measurement of FEV1 requires an acceptable spirometer (see Chapter 12), preferably one that allows inspection of the volume-time curve and back-extrapolation.
Flow-volume curve
Description
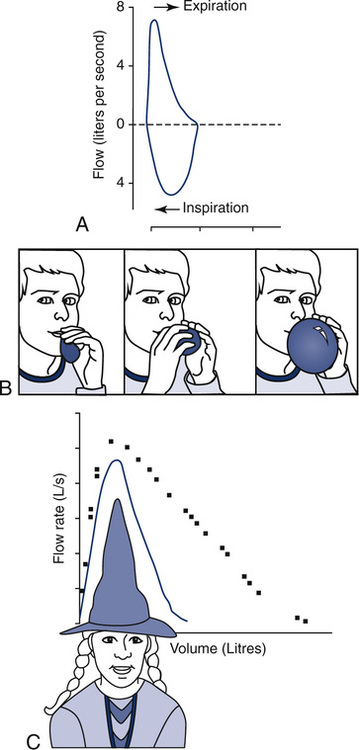
The FVC graphs the flow generated during an FVC maneuver against volume change. The FVC may be followed by an FIVC maneuver, plotted similarly. Flow is usually recorded in liters per second, and the volume is recorded in liters, BTPS. The maximal expiratory flow-volume (MEFV) curve shows flow as the patient exhales from maximal inspiration (TLC) to maximal expiration (RV). The maximal inspiratory flow volume (MIFV) displays inspiratory flow plotted from RV to TLC. When MEFV and MIFV curves are plotted together, the resulting figure is called a flow-volume (F-V) loop (Figure 2-9). The reported F-V loop is taken from the single best test maneuver (highest sum of FEV1 and FVC).
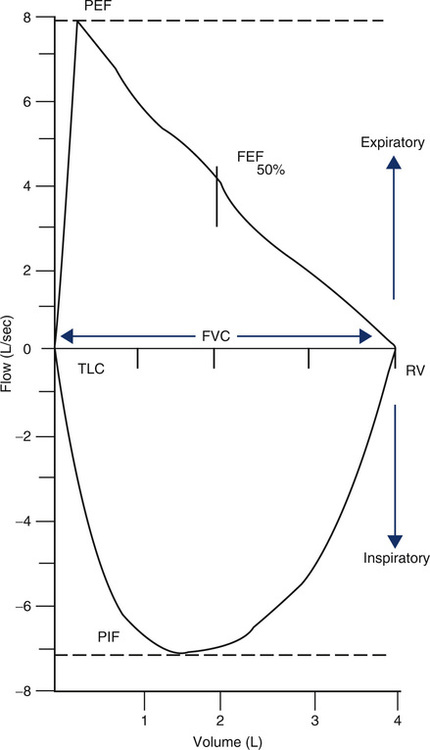
A flow-volume recording in which an FVC and an FIVC maneuver are recorded in succession. Flow in liters per second is plotted on the vertical axis and volume, in liters, on the horizontal axis. By convention, expiratory flow is plotted upward (positive), and inspiratory flow is plotted downward (negative). The maximal exhalation begins with the patient at total lung capacity (TLC) and continues until residual volume (RV) is reached; a maximal inspiration then returns to TLC. The FVC can be read from the tracing as the maximal horizontal deflection along the zero flow line. Peak flows for expiration and inspiration (PEF and PIF) can be read directly from the tracing as the maximal deflections on the flow axis (positive and negative). The instantaneous flow (FEF) at any point in the FVC can also be measured directly. Abnormalities, such as small or large airway obstruction, may show up as characteristic changes in the maximal flow rates. The flow-volume loop is a graphic display of the MEFV and MIFV curves combined.
Technique
FVC, as well as peak expiratory flow (PEF) and peak inspiratory flow (PIF), can be read directly from the F-V loop. Instantaneous flow at any lung volume can be measured directly from the F-V loop. Maximal flow at 75%, 50%, and 25% of the FVC is commonly reported as the  max75,
  max50, and
  max25. The subscript in these terms refers to the portion of the FVC remaining. The same flows are also reported as the FEF25%, FEF50%, and FEF75% with the subscripts referring to the percentage of FVC exhaled. This latter terminology is now preferred by the ATS-ERS guidelines. Most computerized spirometers superimpose timing marks (ticks) on the MEFV curve (Figure 2-10). These marks allow FEV1 (or other FEVT) values to be read from the F-V loop.
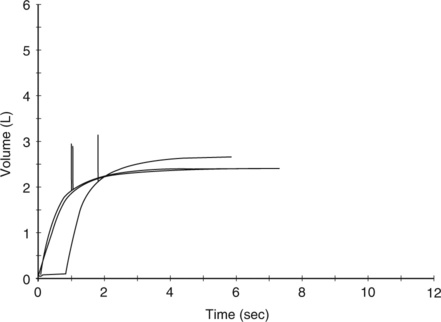
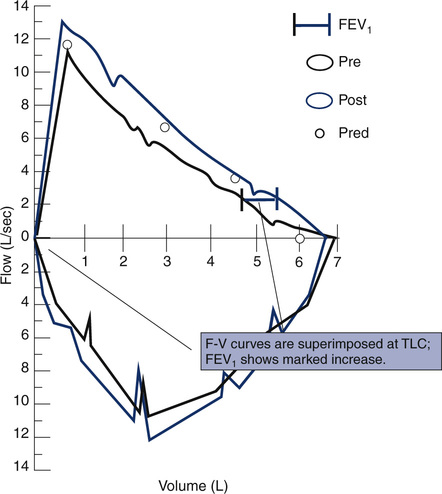
F-V loop data, stored in computer memory, can be easily manipulated. Multiple loops can be compared by superimposing them with contrasting colors. Bronchodilator or inhalation challenge F-V loops can be presented in a similar manner. A predicted MEFV curve can be plotted using points for PEF and maximal flows at 75%, 50%, and 25% of the FVC. A patient’s flow-volume curve can then be superimposed directly over the expected values (see Figure 2-10). Superimposing multiple FVC maneuvers as F-V loops can be used to assess reproducibility of the patient’s effort. Positioning loops side by side or superimposing can also help detect decreasing flows with repeated efforts. This pattern may be seen because FVC maneuvers can induce bronchospasm (i.e., FVC-induced bronchospasm or FVC worsening). Storing tests in the order performed is recommended. This allows a review of the test session and detection of bronchospasm or fatigue.
Reproducible MEFV curves, particularly the PEF, are good indicators of adequate patient effort (Criteria for Acceptability 2-3). Assessing the start-of-test and determining whether exhalation lasted at least 6 seconds may be difficult if only the F-V loop is displayed. Simultaneous display of flow-volume and volume-time curves is useful (Figure 2-11). Although computerized systems calculate back-extrapolated volume, a volume-time tracing may be necessary to perform back-extrapolation manually (see Figure 2-5). Common technical problems with volume-time tracings and F-V loops are shown in Figure 2-12.
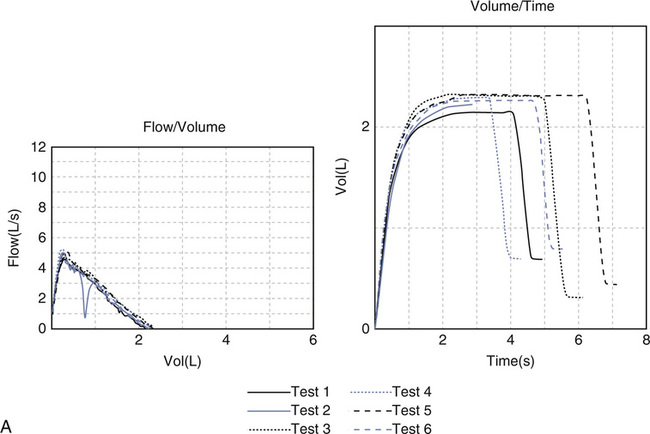
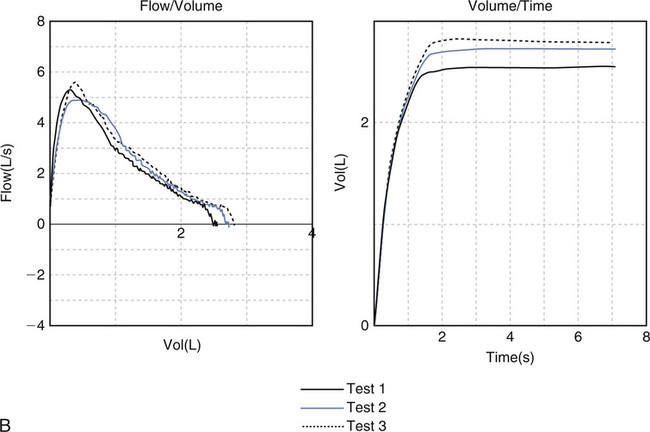
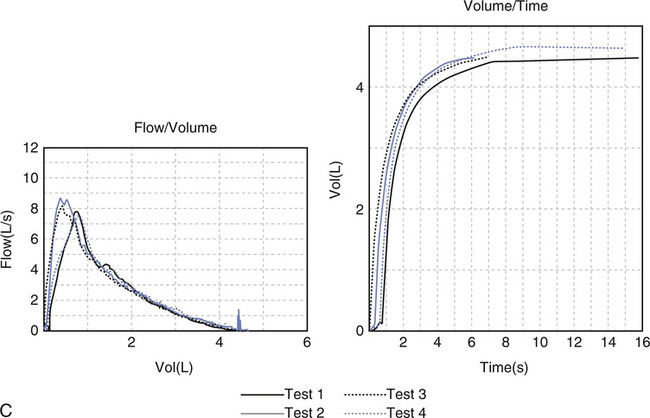
(A) Cough during the first second of exhalation will interfere with proper measurement of FEV1; (B) Glottic closure results in an abrupt termination of expiration and will affect accurate measurement of FVC. (C) Test 1 demonstrates excessive back extrapolation volume secondary to a slow start. This will cause an overestimation of the FEV1.
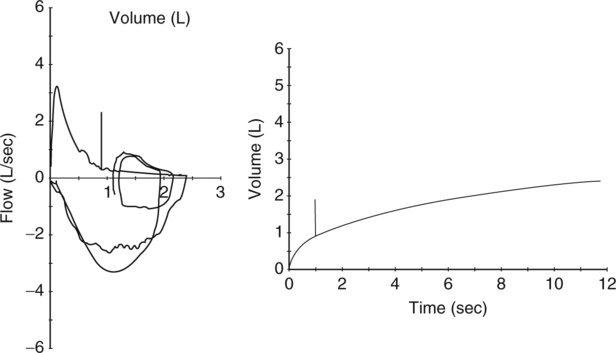
The expiratory flow-volume curve shows severely reduced flows at all lung volumes; inspiratory flows are also markedly reduced. Note that the tidal breathing loop (recorded immediately before the forced effort) shows higher flows than the maximal expiratory flow volume curve. This is consistent with dynamic airway compression during forced exhalation. The expiratory volume-time tracing reveals reduced flow with no obvious plateau even after 12 seconds of exhalation.
Significance and Pathophysiology
See Interpretive Strategies 2-3. Maximal flow at any lung volume during forced expiration or forced inspiration can be easily measured from the F-V loop (see Figure 2-9). Significant decreases in flow or volume are easily detected from a single graphic display. Many clinicians prefer to include the F-V loop or MEFV curve as part of the patient’s medical record.
In healthy patients flow ( ) over the effort-independent segment decreases linearly as lung volume decreases. Pressures around airways are balanced by gas pressures in the airways so that flow is limited at an “equal pressure point.” As the lung empties, the equal pressure point moves upstream into increasingly smaller airways and continues until small airways begin to close, trapping some gas in the alveoli (the RV). This pattern of airflow limitation in healthy lungs causes the MEFV curve to have a linear or slightly concave appearance (see Figure 2-9). This degree of concavity increases with age, presumably because of reduced flows secondary to loss of elastic recoil with aging.
Flow-Volume Loops in Small Airway Obstruction
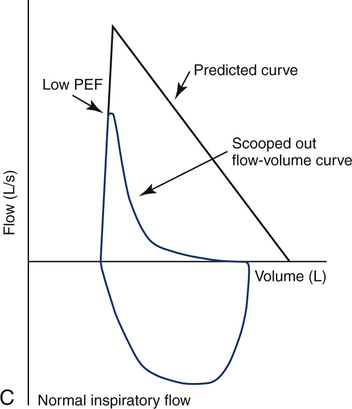
Maximal flow is decreased in patients who have obstruction in small airways, particularly at low lung volumes. The effort-independent segment of the MEFV curve appears more concave or “scooped out” (Figure 2-12). Values for  max50 and
  max25 are characteristically decreased. Decreases in
  max50 correlate well with the reduction in FEF25%-75% in patients with small airway obstructive disease.
Flow-Volume Loops in Large Airway Obstruction
Obstruction of the upper airway, trachea, or mainstem bronchi also shows characteristic patterns. Both expiratory and inspiratory flow may be limited. The F-V loop is extremely useful in diagnosing these large airway abnormalities (see Figure 2-13). Comparison of expiratory and inspiratory flows at 50% of the FVC (FEF50% and FIF50%, respectively) may help determine the site of obstruction. In healthy patients, the ratio of FEF50% to FIF50% is approximately 1.0 or slightly less. Fixed large airway obstruction causes equally reduced flows at 50% of the VC during inspiration and expiration (Figure 2-13). Obstructive lesions that vary with the phase of breathing also produce characteristic patterns. Variable extrathoracic obstruction usually shows normal expiratory flow but diminished inspiratory flow. The FEF50%/FIF50% is often greater than 1.0 because the obstructive
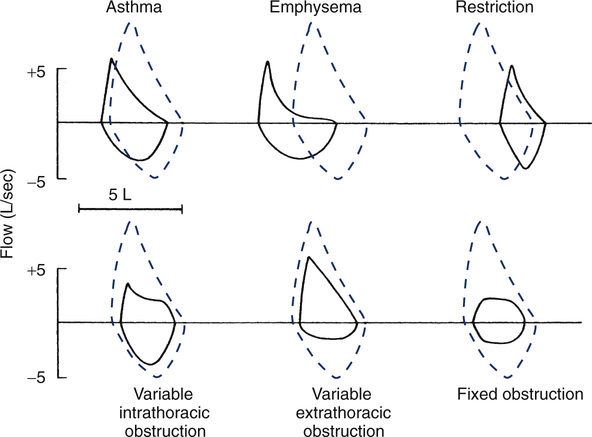
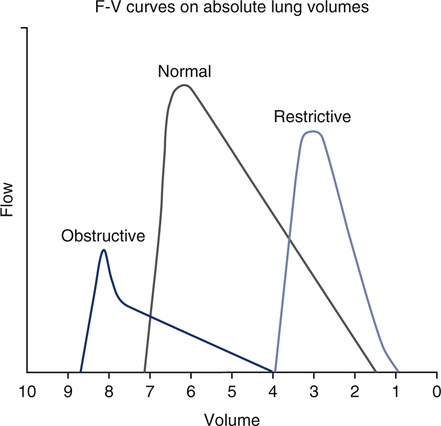
Six curves are shown plotting flow in liters per second against the FVC on an absolute volume scale, with the expected curve shown as dashed lines. In patients who have asthma and emphysema the expiratory curve is characteristically concave. The TLC and RV points are consistent with hyperinflation and/or air trapping. In patients with lung or chest wall restriction the shape of the loop is preserved but the FVC is decreased. The TLC and RV are displaced toward lower lung volume. The bottom three examples depict types of large airway obstruction. Variable intrathoracic obstruction shows reduced flows on expiration (“what’s in is out”) despite near-normal flows on inspiration. Variable extrathoracic obstruction shows an opposite pattern. Inspiratory flow is reduced, while expiratory flow is relatively normal (“what’s out is in”). Fixed large airway obstruction is characterized by equally reduced inspiratory and expiratory flows.

process is outside of the thorax, the MEFV portion of the curve appears as it would in a healthy individual, but the inspiratory portion of the loop is flattened. Inspiratory flow depends on how much obstruction is present. A common cause of variable extrathoracic obstruction, resulting in truncated inspiratory flow, is paradoxical vocal cord closure during inspiration, also known as vocal cord dysfunction. In variable intrathoracic obstruction, PEF is reduced. Expiratory flow remains constant until the site of flow limitation reaches the smaller airways. This gives the expiratory limb a “squared-off” appearance (see Figure 2-13). The inspiratory portion of the loop may be completely normal. The FEF50%/FIF50% will be typically much less than 1.0, depending on the severity of obstruction. In patients with truncation of both the inspiratory and expiratory loops, a fixed obstruction may be present.
Airway obstruction associated with abnormality of the muscular control of the posterior pharynx and larynx sometimes produces a “sawtooth” pattern visible on the inspiratory and expiratory limbs of the MEFV curve (Figure 2-14). This pattern, although neither sensitive or specific for, is sometimes observed in patients suspected of having sleep apnea. If this pattern is observed on the F-V curve and the subject complains of daytime hypersomnolence, a referral to a sleep center may be warranted. The interpretation of this noise is sometimes termed redundant tissue of the upper airway.
Flow-Volume Loops in Restrictive Disease
Restrictive disease processes may show normal or greater than normal peak flows with linear decreases in flow versus volume. The lung volume displayed on the X-axis is decreased. Moderate or severe restriction demonstrates equally reduced flows at all lung volumes. Reduced flows are primarily caused by the decreased cross-sectional area of the small airways at low lung volumes. Simple restriction causes the F-V loop to appear as a miniature of the normal curve (see Figure 2-12), often with supranormal flow as seen by elevated FEV1/VC.
Before- and after-bronchodilator F-V loops can be superimposed to measure changes in flow at specific lung volumes. The curves are usually positioned by superimposing at maximal inspiration. This method assumes that any increase in FVC occurs while TLC remains constant. If postbronchodilator lung volume tests are performed, the curves may be superimposed on an absolute volume scale (i.e., isovolume correction). This method shows bronchodilator-induced changes in lung volumes as well as flows. Sometimes, lung volumes will change after bronchodilator without any change in FEV1. Inhalation challenge studies (see Chapter 10) can be displayed similarly to assess the reduction in flows at specific lung volumes.
F-V loops may also be measured during exercise (see Chapter 7). By superimposing a flow-volume curve during exercise over the maximal F-V loop, specific patterns of ventilatory response can be assessed. Patients who have airflow limitation are typically unable to increase ventilation during exercise when expiratory flow equals maximal flow. Exercise F-V curves can be used to demonstrate this phenomenon.
Peak expiratory flow
Description
Technique
PEF can be easily measured from a flow-volume curve (MEFV). PEF may also be measured by using devices that sense flow directly (see Chapter 11), or by using volume displacement spirometers and deriving the rate of volume change. Many portable devices (i.e., peak flow meters) are available to measure maximal flow during forced expiration. Most sense flow as movement of air against a turbine or through an orifice. PEF done in conjunction with spirometry is performed as described for F-V loops.
At least three maneuvers should be performed and recorded, along with the order in which the values were obtained. All readings are recorded in order to detect effort-induced bronchospasm. The largest PEF obtained should be reported. The PEF is effort-dependent and variable. It may be particularly variable in patients with hyperreactive airways (Criteria for Acceptability 2-4). Up to five attempts should be made to achieve adequate repeatability, defined as no more than 0.67 L/sec (40 L/min) difference between the largest of two out of three acceptable efforts.
Portable peak flow meters need to be precise (low variability in the same instrument). Precision is more important than accuracy for detecting changes from serial measurements. Peak flow meters should have ranges of 60 to 400 L/min for children and 100 to 850 L/min for adults. Standards for peak flow monitoring devices have been published by the ATS-ERS (see Chapters 11 and 12).
Significance and Pathophysiology
See Interpretive Strategies 2-4. The PEF attainable by healthy young adults may exceed 10 L/sec or 600 L/min, BTPS. Even when an accurate pneumotachometer is used, the value of PEF measurements may be limited. Peak flow is effort-dependent. It primarily measures large airway function and muscular effort. Decreased PEF values should be evaluated for consistent patient effort. PEF values for patients without hyperreactive airways are usually similar with repeated efforts. Asthmatic patients often have a pattern of decreasing PEF with repeated trials. Widely varying peak flows without a pattern of induced bronchospasm suggest poor effort or cooperation. However, PEF measurements alone are not sufficient to make a diagnosis of asthma. Spirometry, lung volumes, diffusing capacity, and airway resistance measurements may be required to evaluate fully the associated physiologic impairment.
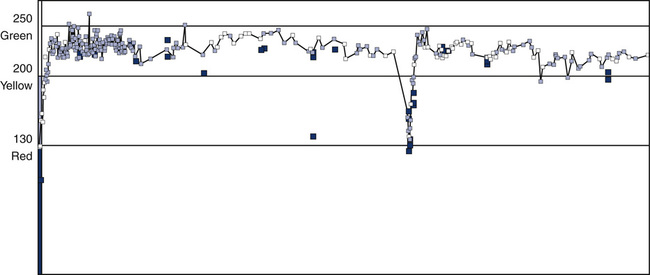
The National Asthma Education and Prevention Program suggests a “zone” system, based on the individual’s personal best or predicted PEF (Interpretive Strategy 2-4). The zone system uses green, yellow, and red as indicators for maintaining or altering therapy. Green (80% to 100% of the personal best PEF) indicates a continuation of routine therapy. Yellow (50% to 80% of the personal best PEF) indicates that an acute episode may be starting. Patients should be instructed to take their medication immediately according to their physicians’ orders. Red (less than 50% of the personal best PEF) indicates that an acute change has occurred. Immediate treatment is required, and the clinician should be notified or after taking their medication, the patient should go to the ER. This approach dramatically improves the patient’s ability to communicate symptomatic changes to the clinician (Figure 2-15).
Maximum voluntary ventilation (MVV)
Description
Technique
MVV is continued for at least 12 seconds but no more than 15 seconds. The patient is hyperventilating, so efforts longer than 15 seconds may exaggerate the sensation of lightheadedness. Even the 12-second interval may produce dizziness or syncope. The test may be performed with the patient in either a sitting or standing position. If done while standing, a chair should be available in case of dizziness. Some automated spirometers allow MVV to be terminated before 12 seconds. This accommodates patients who cannot continue because of coughing or lightheadedness. If MVV does not last 12 seconds, it should be noted in the technologist’s comments (see Chapter 12). At least two MVV maneuvers should be performed. The two largest should be within 20% of each other. The largest value is reported (Criteria for Acceptability 2-5).
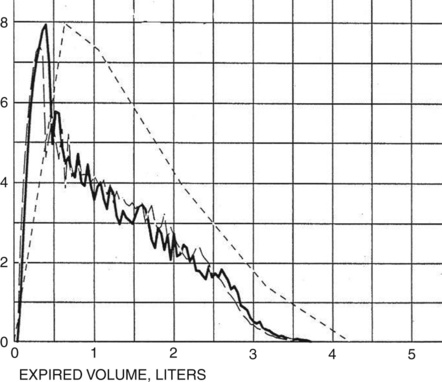
The volume expired is measured by a spirometer. The spirometer must have adequate frequency response over a wide range of flows (see Chapters 11 and 12). Historically, the volume of each breath was read from a volume-time spirogram or from a recording of accumulated volume (Figure 2-16). Now volume data from each breath are summed by a computer for the interval measured. The MVV (for a 12-second test) is calculated as flow in liters per minute, as follows:
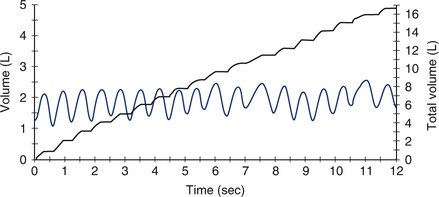
A composite MVV spirogram on which breath-by-breath volume change and accumulated volume are plotted against time. The undulating line shows the tidal volume (approximately 1 L in this test) moved during each breath over a 12-second interval. To calculate MVV, the volumes of individual breaths can be added and multiplied by a factor of 5 (i.e., 60 seconds/12 seconds = 5) because the MVV is reported in liters per minute.
Vol12 = volume in liters expired in 12 seconds
60 = factor for extrapolation from seconds to minutes
For other intervals, the MVV is calculated similarly. The MVV must be corrected to BTPS.
Significance and Pathophysiology
See Interpretive Strategies 2-5. MVV tests the overall function of the respiratory system. It is influenced by airway resistance, respiratory muscles, compliance of the lung and/or chest wall, and ventilatory control mechanisms. Values in healthy young men average between 150 and 200 L/min. Values are slightly lower in healthy women. MVV decreases with age in both men and women and varies considerably in healthy patients. Only large reductions in MVV (25% or more) are considered significant.
The MVV value may be helpful in estimating ventilation during exercise. Note, however, that the MVV maneuver does not mimic the true respiratory pattern during maximal exercise, and thus is only an estimate of maximal breathing capacity during exercise (see Chapter 7). Airway-obstructed patients who have an MVV less than 50 L/min often have a ventilatory limitation to exercise. Maximal exercise ventilation in healthy patients is usually less than 70% of their MVV. In airway-obstructed patients, maximal ventilation during exercise approaches or even exceeds their MVV. This pattern occurs partly because the MVV itself is reduced in obstruction. Highly conditioned healthy patients may also reach their MVV during maximal exercise (see Chapter 7).
Before- and after-bronchodilator studies
Description
Technique
Patients referred for spirometry testing should withhold routine bronchodilator therapy before the procedure (Table 2-2). Some patients may be unable to manage their symptoms if bronchodilators are withheld. These patients should be instructed to take their bronchodilator medication as needed. In these instances, the time when the medication was last taken should be noted. Some patients who use bronchodilators shortly before testing (within 4 hours) still show significant improvement after a repeated dose.
Table 2-2
| Medication | Time to Withhold* |
| Short-acting β2agonist | 4 hours |
| Long-acting β2agonist | 12 hours |
| Methylxanthines (theophyllines) | 12 hours |
| Slow-release methylxanthines | 24 hours |
| Atropine-like preparations | 8 hours |
| Cromolyn sodium | 8-12 hours |
| Inhaled steroids | Maintain dosage |
*Approximate times; may be adjusted for individual patients.
Inhaled bronchodilators can be administered by a metered-dose inhaler (MDI) or a small-volume nebulizer. An MDI provides a reproducible means of administering the bronchodilator. Some patients are unable to coordinate activation of the MDI with slow, deep inspiration. For these patients, use of an aerosol reservoir, or spacer, may provide a more consistent delivery of medication. If the patient is unfamiliar with the MDI, the technologist may need to activate the device (How-to 2-2). Small-volume, jet-powered nebulizers may be used to administer more bronchodilator over a longer interval. Nebulizers, if reused, must be carefully disinfected between patients.
Measurements of FEV1, FVC, FEF25%-75%, PEF, and sGaw (Chapter 4) are commonly made before and after bronchodilator administration. In each case, the percentage of change is calculated as follows:

Post-drug = test parameter after administration
 are used, they should be isovolume-corrected for changes in the FVC. If FVC increases more than FEV1 after bronchodilator therapy, FEV1% may actually decrease. FEV1% should not be used to judge bronchodilator response. sGaw may show a marked increase after bronchodilator therapy. Improved conductance may occur despite minimal change in FEV1 or conventional measures of flow. Spirometry or plethysmography after bronchodilator therapy should meet the usual criteria for acceptability and reproducibility.
Significance and Pathophysiology
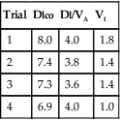
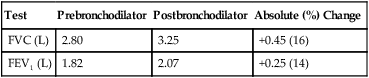
See Interpretive Strategies 2-6. Reversibility of airway obstruction is considered significant for increases of greater than 12% and 200 mL for either the FEV1 or FVC (Table 2-3). If the sGaw is assessed, an increase of 30% to 40% is usually considered significant. Some patients may show little or no improvement in FEV1 but have a significant improvement in sGaw (Chapter 4). Changes in FEF25%-75% of 20% to 30% are sometimes considered significant. However, flows that depend on the FVC should be volume-corrected (Case Study 2-2). If not corrected, FEF25%-75% may appear to decrease although FEV1 and FVC improve. Likewise, the FEF25%-75% may appear to increase even though there is no change in FEV1. This tends to occur when the postbronchodilator FVC falls from the baseline value, often as a result of suboptimal technique or effort.
Table 2-3
Illustration of Bronchodilator Response
| Test | Prebronchodilator | Postbronchodilator | Absolute (%) Change |
| FVC (L) | 2.80 | 3.25 | +0.45 (16) |
| FEV1 (L) | 1.82 | 2.07 | +0.25 (14) |
Summary
• The chapter describes spirometry—the most commonly performed pulmonary function study.
• Various spirometry tests are identified. Techniques for performing the tests and criteria for acceptability are enumerated.
• Simple spirometry, F-V loops, and bronchodilator studies are discussed.
• Differentiation between obstructive and restrictive disorders is made by explaining the pathophysiologies involved.
• Other tests of respiratory mechanics related to airflow are discussed in related chapters (e.g., 4, 8 and 9).
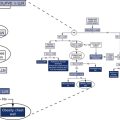
Case Studies
Case 2-1
C.ase 2-2
 max50 (L/sec)
 (L/sec)
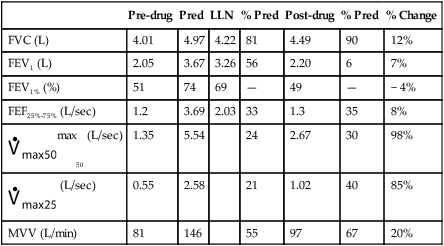
 and
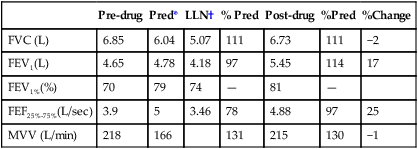
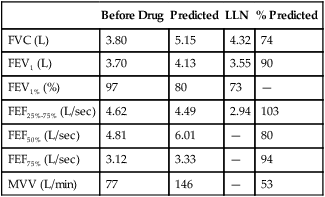
and  max50. MVV is reduced in proportion to the subject’s FEV1. Little or no change occurs in FEV1 after inhaled bronchodilator therapy. FVC does improve significantly.
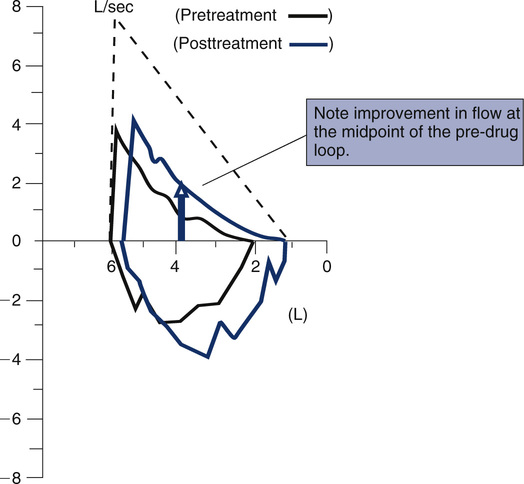
Case 2-3
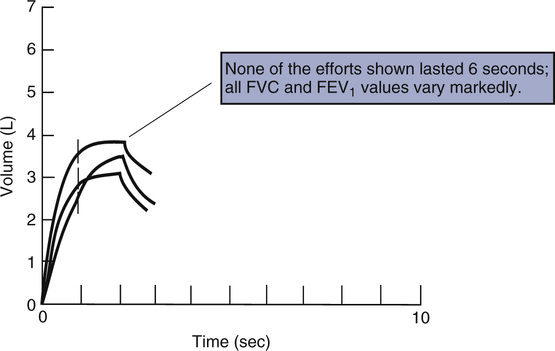
Alternative tests for this subject should be independent of the subject’s effort. A simple blood gas analysis was performed. The results indicated normal oxygenation and acid-base status. Testing of lung volumes and diffusing capacity was postponed because both of these depend on subject effort and cooperation. A bronchial challenge test (see Chapter 9) might have been indicated because he had asthma-like symptoms. However, bronchial challenge tests use spirometry, which this subject was unable or unwilling to perform acceptably.
1. A patient performs three FVC maneuvers using a computerized spirometer. The spirometer reports that all maneuvers had a back-extrapolated volume of less than 5% and 150 mL. The maneuvers met all other criteria for acceptability and repeatability. The technologist should:
b. Correct the FEV1 and all other flows by the amount of the back-extrapolated volume
2. A 58-year-old man who complains of increased shortness of breath with exercise has the following spirometry results:
| Measured | Predicted | LLN | % Predicted | |
| FVC (L) | 5.11 | 4.93 | 4.19 | 104 |
| FEV1 (L) | 2.57 | 3.95 | 3.38 | 65 |
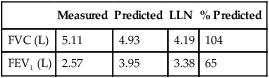
These results are consistent with which of the following?
3. An 81-year-old man performs three acceptable spirometry efforts and records these results:
| Measured | Predicted | LLN | % Predicted | |
| FVC (L) | 2.17 | 3.82 | 3.25 | 57 |
| FEV1 (L) | 1.71 | 2.41 | 2.05 | 71 |
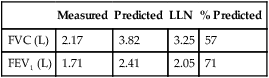
Which of the following do these values suggest?
4. Which of the following best describes the flow-volume curve shown?
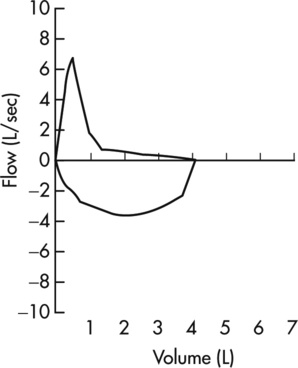
a. Normal forced expiratory flow pattern
b. Variable intrathoracic obstruction
5. A 20-year-old man complains of shortness of breath with exercise. The following results of spirometry are obtained:
| Measured | Predicted | LLN | % Predicted | After Bronchodilator | % Change | |
| FVC (L BTPS) | 4.98 | 5.83 | 4.96 | 85 | 5.98 | 20 |
| FEV1 (L BTPS) | 3.18 | 4.68 | 3.98 | 68 | 3.50 | 10 |
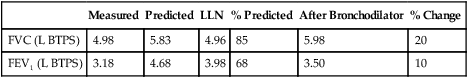
Which of the following statements best describes these findings?
a. Results are of normal spirometry.
b. There is moderate obstruction with significant response to bronchodilators.
c. There is moderate obstruction without significant response to bronchodilators.
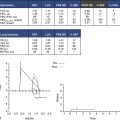
6. A 33-year-old woman complains of increasing shortness of breath with exertion. Her spirometry results are as follows:
| Measured | Predicted | LLN | % Predicted | |
| FVC (L) | 2.25 | 3.09 | 2.62 | 73 |
| FEV1 (L) | 1.84 | 2.62 | 2.23 | 70 |
| PEF (L/s) | 2.77 | 6.17 | 5.24 | 45 |
| MVV (L/min) | 45 | 104 | — | 43 |
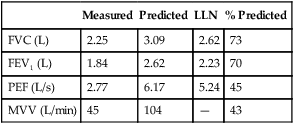
Which of the following is most consistent with these results?
7. How long should the pulmonary function technologist wait after giving inhaled β2 agonist before conducting postbronchodilator testing?
8. A 60-year-old woman complains of increasing shortness of breath with exertion. Her spirometry results are as follows:
| Trial 1 | Trial 2 | Trial 3 | Best | Predicted | LLN | % Predicted | |
| FVC (L) | 2.25 | 2.30 | 2.28 | 2.30 | 2.96 | 2.23 | 78 |
| FEV1 (L) | 1.14 | 1.06 | 1.12 | 1.14 | 2.41 | 1.86 | 47 |
| BE Vol (L) | 0.230 | 0.145 | 0.09 |
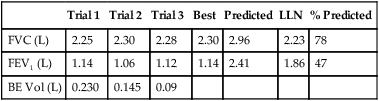
Which of the following is most consistent with these results?
9. A 14-year-old male with cystic fibrosis performs three spirometry trials:
| Trial 1 | Trial 2 | Trial 3 | |
| FVC (L) | 3.01 | 2.99 | 3.12 |
| FEV1 (L) | 1.99 | 2.01 | 1.95 |
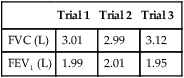
The reported flow-volume loop should come from which data?
10. A healthy, physically fit patient performs spirometry, and the following values are recorded:
| Trial 1 | Trial 2 | Trial 3 | Trial 4 | |
| FVC (L) | 6.52 | 6.23 | 6.17 | 6.37 |
| FEV1 (L) | 5.01 | 5.22 | 5.13 | 5.19 |
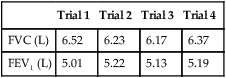
Which values of FVC, FEV1, and FEV1% should be reported for this patient?
a. FVC = 6.52 L, FEV1 = 5.22 L, FEV1% = 80%
b. FVC = 6.23 L, FEV1 = 5.22 L, FEV1% = 84%
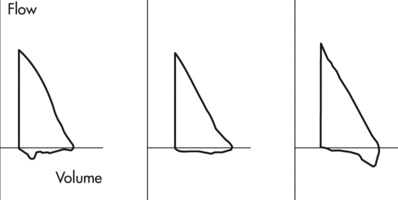
11. A patient, whose chief complaints are cough and hoarseness, performs a series of FVC efforts, and flow-volume curves are recorded as shown. Which of the following diagnoses seems most likely?
12. A patient performs the following test:
| Trial 1 | Trial 2 | Trial 3 | Trial 4 | |
| FVC (L) | 4.50 | 4.22 | 4.13 | 4.30 |
| FEV1 (L) | 3.45 | 3.15 | 3.02 | 2.95 |