Chapter 4 SPECT Processing, Quantification, and Display
OBLIQUE REORIENTATION AND RESLICING
Although the original tomograms obtained by reconstructing raw data from positron emission tomography (PET) and SPECT scanners are in a transaxial orientation, cardiac images are generally viewed in different formats consisting of short-axis, horizontal long-axis, and vertical long-axis slices. Short-axis slices are also necessary for some automatic perfusion quantification algorithms, and determination of functional parameters can depend upon accurate reorientation.1 Generation of these standard sections from the original transaxial images used to be performed interactively, requiring the user to mark the location of the left ventricular (LV) axis. In the past few years, automatic techniques for performing this task have been described and are commercially available.2–4
Two approaches2,3 for automatic reorientation start by identifying the LV region in the transaxial images, using a threshold-based approach that includes knowledge about expected position, size, and shape of the LV. Once isolated, the approach described by Germano et al.2 uses the original data to refine the estimate of the myocardial surface. Normals to an ellipsoid fit to the LV region are used to resample the myocardium; a Gaussian function is fit to the profiles obtained at each sample. The best fit Gaussian is used to estimate the myocardial center for each profile, and after further refinement based on image intensities and myocardial smoothness, the resulting mid-myocardial points are fitted to an ellipsoid whose long axis is used as the final LV long axis. The method was tested on 400 patient images and the result compared to interactively denoted long axes. Failure of the method was described as either not localizing the LV, presence of significant hepatic or intestinal activity in the LV region of the image, or greater than 45(o) difference between automatically and interactively determined axes. With these criteria, the method was successful in 394 of the 400 cases.
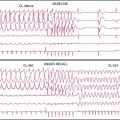
Faber et al.3 also use the expected size and location of the heart in the image to isolate the ventricles. They then use a search algorithm to find the best axis of symmetry in the transaxial plane by reflecting the image about this axis and subtracting the result from the original slices. To improve comparisons in the case of reduced perfusion, the image is normalized separately on each side of the axis being tested. Once the best axis on the transaxial slice is located, the image is resliced parallel to this axis, and the process is repeated using the resulting near-sagittal images. This method was applied to 25 rest and stress studies; automatic center and axis angles were compared to those chosen by an expert, and the difference in quantitative results resulting from the automatic and interactive reorientation were evaluated. The average absolute mean difference between the interactively and automatically chosen horizontal long-axis angles was 6.3 ± 5(o). The average absolute mean difference between the interactively and automatically chosen veritcal long-axis angles was 5.7 ± 4.2(o). In addition, using the quantitation following interactively chosen reorientation angles as the gold standard, the automatic reorientation resulted in an accuracy of 92% for diagnosing coronary artery disease (CAD). Example results from this method can be seen in Figure 4-1.
Slomka et al.4 take a different approach entirely to automated reorientation. Their method registers the original image data to a “template” image in which the orientation of the LV is known and standardized. The template is created by averaging a large number of registered, normal patient data sets, and a separate template is created for males and females. The registration is done by first translating and scaling the image based on principal axes; the match is refined by minimizing the sum of the absolute differences between the template and the image being registered. This method was not compared to interactively reoriented images, but it was evaluated visually for 38 normal and 10 abnormal subjects and found to be successful for all.
MOTION CORRECTION (See Chapter 5)
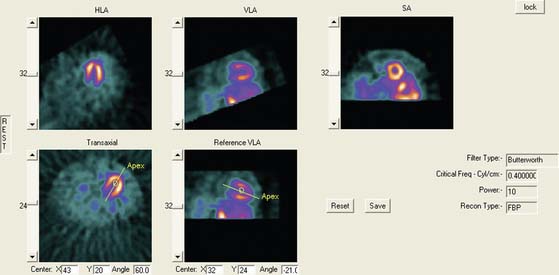
Patient or organ motion during SPECT scanning can cause small image artifacts in the best case and make the scan unreadable in the worst case. A good overview of the effects of motion and how to detect them are given by Fitzgerald and Danias.5 Most manufacturers now provide automatic motion correction algorithms that account for a patient moving during the acquisition. One early approach by Cooper et al.6 attempted to determine the position change of the heart in the sinograms and correct for this. This method, along with manual correction, was found by O’Conner et al.7 to be particularly effective in removing various kinds of patient movement in a phantom study. More recently, a motion correction technique has been introduced that is based on the operation of making projections or sinograms more consistent with the reconstruction.8 From the original data, a reconstruction is created. New projections are computed using the original reconstruction and compared to the original projections. Each original projection is aligned with the new projections created from the reconstruction. The registered projections are reconstructed again to create a new starting reconstruction, and the process is iterated until the registered original projections match the reprojections of the reconstruction created from them. This occurs when the data sets are consistent (i.e., when the motion artifacts are removed from the projections through the iterative alignment). An evaluation of this approach was published by Matsumoto et al.9 The importance of motion correction on both slices and quantitative results is demonstrated in Figure 4-2.
AUTOMATED PERFUSION QUANTIFICATION
Data-based methods for identifying a patient’s myocardial perfusion abnormalities from thallium (Tl)-201 SPECT studies have been previously developed and commercialized by investigators at Cedars-Sinai Medical Center10 and Emory University11 and reported as early as 1985. More recently, these methods have been widely used by various investigators to quantify myocardial perfusion SPECT studies imaged using technetium 99mTc-based agents. These methods utilize a statistically defined database of normal (and abnormal) patients to be used as a pattern to compare prospective CAD patients. These methods have been extensively validated12 and proven to be clinically valuable12 in standardizing and objectifying13 myocardial perfusion scans. These validations have shown that in stable patients having serial perfusion studies, quantification is more reproducible than the visual interpretation of experts for determining the magnitude of the perfusion abnormality.13 This improved reproducibility of quantitative techniques over visual analysis promotes the need for the use of quantification in randomized clinical trials and in monitoring the effects of therapy in an individual patient.13
Myocardial Isolation and Sampling
Newer quantitative methods have been developed to overcome the major limitations described. These methods use several automatic image-identification techniques for isolation of the left myocardium from the remainder of the image.14 Once the left myocardium is identified, the apex and base, the coordinates of the central axis of the ventricular chamber, and a limiting radius for count profile search are determined automatically. In the majority of cases, operator interaction is required only for verification of automatically determined parameters. If at any time these automated programs fail to locate any of the features, they will branch to an interactive mode and require the operator to select the parameters manually.
Once the LV has been isolated from the myocardial perfusion scan, these automated programs extract the 3D LV myocardial count distribution. This sampling is done using either a hybrid, two-part, 3D sampling scheme of stacked short-axis slices15 or an ellipsoidal sampling of the 3D distribution inside the ellipsoid.16 In the hybrid sampling approach used in the CEqual program, the apical region of the myocardium is sampled using spherical coordinates, and the rest of the myocardium is sampled using cylindrical coordinates. This approach promotes a radial sampling that is mostly perpendicular to the myocardial wall for all points and thus results in a more accurate representation of the perfusion distribution with minimal sampling artifacts. Following operator verification of the automatically derived features, the 3D maximum count myocardial distribution is extracted from all stacked short-axis tomograms.16 During cylindrical sampling, maximum count circumferential profiles, each composed of 40 points, are automatically generated from the short-axis slices. During spherical sampling, maximal counts are extracted from the apical region, with the number of samples proportional to the apical area from which they are extracted. The combination of the cylindrical and spherical coordinates forms a set of 3D count profiles representing the myocardial tracer uptake. In the approach used by the QPS program, the sampling geometry is performed using an ellipsoidal rather than a hybrid model, and count profiles from endocardium to epicardium are used rather than maximal counts. Other methods used variations of these approaches, including a slice-by-slice maximal count circumferential profile extraction.17,18
These 3D count distributions are generated for the stress and the rest myocardial perfusion distributions. A normalized percent change between stress and rest is also calculated as a reversibility distribution.19 The most normal region of the stress distribution is used for normalizing the rest to the stress distribution.
Normal Databases and Criteria for Abnormality
Once the stress and rest count distributions have been extracted from a patient’s LV myocardium and the reversibility distribution determined, they are compared to normal patterns found in computerized databases. These normal databases are usually generated from patients with a low likelihood of CAD. Although there is variation among methods as to how best to define these patients, in general, patients with less than 5% probability of CAD are used. This probability is based on the Diamond and Forester20 criteria that uses a Bayesian analysis of the patient’s age, sex, symptoms, and the results of other noninvasive tests such as stress EKG.
The stress, rest, and reversibility distributions from males and females are separately combined to produce gender-matched normal files. This is done to help account for differences in body habitus that cause changes in the expected normal patterns between men and women due to photon attenuation. The distributions from these normal patients are statistically combined to provide the mean normal regional LV normalized count distribution and its corresponding regional standard deviation for the stress, rest, and reversibility distributions.11,21
Determination of the optimal cutoff criteria for each region requires that perfusion studies from both normal and abnormal patients be used. In the normal databases used by the CEqual processing program, for example, the optimal cutoff point is determined using receiver operator curve (ROC) analysis.21 By varying the standard deviation (and/or any other quantitative parameter used, such as the extent of the abnormality) the determination of “normal” or “abnormal” by the program is compared to a gold standard such as expert visual analysis or catheterization results. ROC curves are then generated by plotting the true-positive rate versus the false-positive rate. The best cutoff is then determined as the desired tradeoff between the expected sensitivity and specificity for the detection and localization of CAD. Depending on the developers’ strategy, optimal criteria could mean the best tradeoff between sensitivity and specificity, or high-sensitivity with lower specificity, or higher specificity with lower sensitivity. These results can and do vary between methods, but they can also vary between normal databases used by the same program. It is imperative that the physician using these programs has reviewed published validations performed against prospective populations to understand the true performance characteristics of the quantitative software/normal database combination they are using.
Quantitative Parameters
Quantitative parameters that take into account both the extent and severity of the abnormality are also determined. The total severity score is calculated as the total number of standard deviations below the mean normal distribution for regions exhibiting perfusion defects.22 The sum stress score is the sum of segmental scores in a (17 or 20) segmental model of the LV where each segment is scored from 0 (normal) to 4 (perfusion absent).23 These scores are either manually or automatically assigned. Automatic assignment is performed by comparison to the normal database, with the scores calibrated to interpretations by human experts.
Commercial Implementations
Variations of the methods described thus for have been commercialized in at least eight separate products at the time of this writing. Three of these methods have become the most popular. These are the ECTb developed at Emory University,24,25 Corridor 4DM developed at the University of Michigan,26,27 and QPS/QGS developed at Cedars-Sinai in Los Angeles.16,28 A fourth method also used commercially is the Wackers-Liu CQ software developed at Yale University.17,29
These software packages have become popular because (1) they are automated; (2) they (usually) integrate image display, perfusion quantification, and functional quantification in one package; and (3) they are well validated.25,30,31 Examples of applying three commercial programs to quantify the same patient are shown in Figures 4-3 through 4-5. It is important to understand that the implementation of these programs varies from vendor to vendor. Thus, even though one should expect that the same program will yield the same results given the same perfusion study, the ease and speed of obtaining and displaying results may vary not only between the packages but also from vendor to vendor and between versions of the same program.
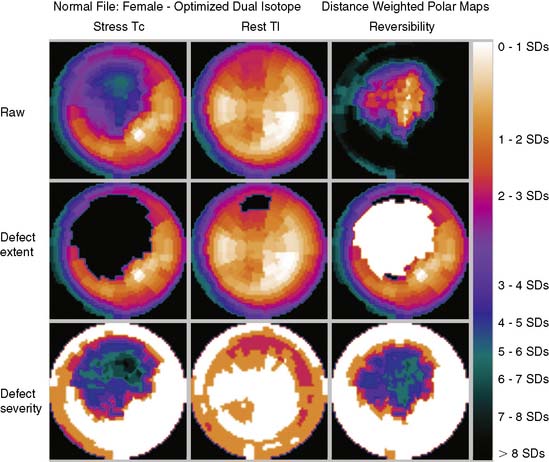
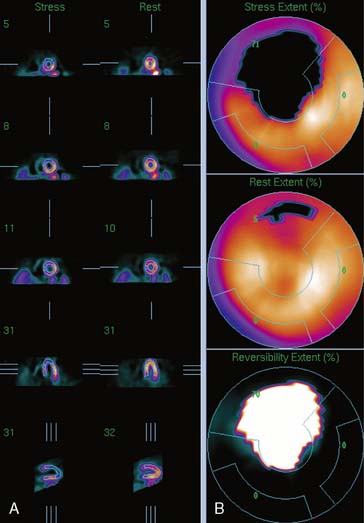
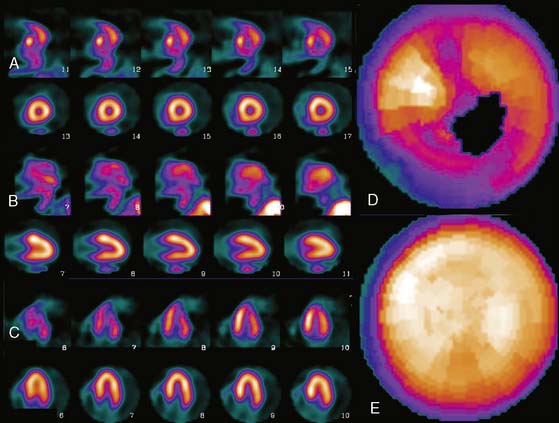
Figure 4-4 Perfusion quantification results obtained from processing the same patient as in Figure 4-3 with QPS. The left side of the figure (A) shows slices from the patient; the top three rows contain short-axis slices, and the bottom two rows show horizontal long-axis and vertical long-axis slices, respectively. The right side of the figure (B) shows the results of quantitation: the stress blackout map (top), the rest blackout map (middle), and the whiteout reversibility map (bottom). Note the similarities of these results compared with those of Figure 4-3.
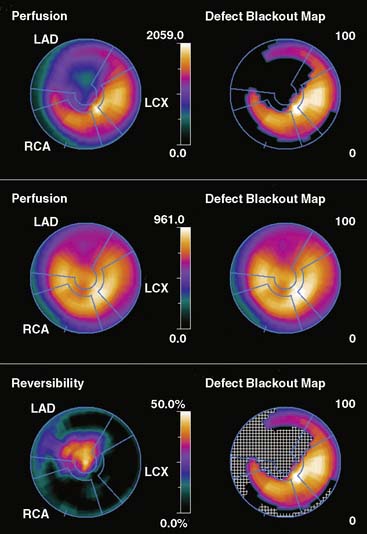
Figure 4-5 Perfusion quantification results obtained from processing the same patient as in Figure 4-3 with Corridor 4DM. The top row shows the quantitated stress (left) and stress blackout map (right). The middle row shows the quantitated rest (left) and rest blackout map (right). The bottom row shows the difference between rest and stress perfusion (left) along with the whiteout reversibility map (right). Note the similarities of these results with those of Figures 4-3 and 4-4.
New Databases
As new acquisition protocols and/or new perfusion tracers become popular, new normal databases must be developed. For example, for ECTb, gender-matched normal databases have been defined21 and validated for the following SPECT protocols:
All protocols used treadmill exercise to stress the patients.
One concern is whether the normal databases developed using patients stressed with exercise can be used for patients undergoing pharmacologic stress. It is evident by looking at these studies that patients imaged after pharmacologic stress have more background activity and more myocardial activity than patients undergoing treadmill exercise. Nevertheless, the relative distributions in normal and CAD patients are similar enough that when the same normal database is used for both forms of stress, it results in similar diagnostic accuracy.33 Although it would be ideal to have separate databases for protocols using pharmacologic stress, the development cost would be prohibitive.
DISPLAY
Polar Maps
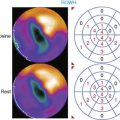
Polar maps, or bull’s-eye displays, are the standard for viewing circumferential profiles. They allow a quick and comprehensive overview of the circumferential samples from all slices by combining these into a color-coded image. The points of each circumferential profile are assigned a color based on normalized count values, and the colored profiles are shaped into concentric rings. The most apical slice processed with circumferential profiles forms the center of the polar map, and each successive profile from each successive short-axis slice is displayed as a new ring surrounding the previous. The most basal slice of the LV makes up the outermost ring of the polar map. Figure 4-3 shows polar maps created from applying the CEqual quantification method to a perfusion study.
The use of color can help identify abnormal areas at a glance as well. Abnormal regions from the stress study can be assigned a black color, thus creating a blackout map. Blacked-out areas that normalize at rest are color-coded white, thus creating a whiteout reversibility map.19 This can also be seen in Figure 4-3. Additional maps—for example, a standard deviation map that shows the number of standard deviations below normal of each point in each circumferential profile—can aid in evaluation of the study by indicating the severity of any abnormality.
Polar maps, while offering a comprehensive view of the quantitation results, distort the size and shape of the myocardium and any defects. There have been numerous improvements in the basic polar map display to help overcome some of these problems.15 For instance, “distance-weighted” maps are created so that each ring is the same thickness. These maps have been shown to be useful for accurate localization of abnormalities. “Volume-weighted” maps are constructed such that the area of each ring is proportional to the volume of the corresponding slice. This type of map has been shown to be best for estimating defect size. However, more realistic displays have been introduced that do not suffer from the distortions of polar maps.
Three-Dimensional Displays
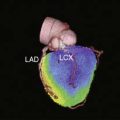
Three-dimensional graphics techniques can be used to overlay results of perfusion quantification onto a representation of a specific patient’s LV. Figure 4-6 displays the same information seen in the polar maps of Figure 4-3, using a 3D representation. In its most basic form, the pixel locations of the maximal-count myocardial points sampled during quantitation are used to estimate the myocardial surface. More sophisticated methods may detect the epicardial surface boundaries of the perfusion scan.16,24,34 These points can be connected into triangles, which are then color-coded similarly to the polar map; details of how such displays can be created may be found in the book by Watt, for example.35 Such displays can routinely be rotated in real time and viewed from any angle with current computer power. They have the advantage of showing the actual size and shape of the LV and the extent and location of any defect in a very realistic manner. Some studies have shown that the 3D models are more accurate for evaluating the size and location of perfusion defects than polar maps36 or slice-by-slice displays.37
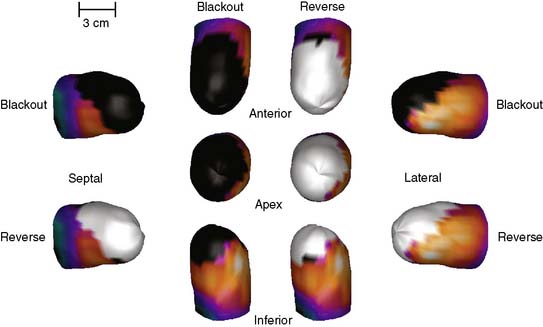
Figure 4-6 Three-dimensional surface-rendered displays of stress blackout and reversibility whiteout information from the same patient as in Figure 4-3. From the top, clockwise, are shown an anterior, lateral, inferior, and septal view. An apical view is shown in the middle of the display.
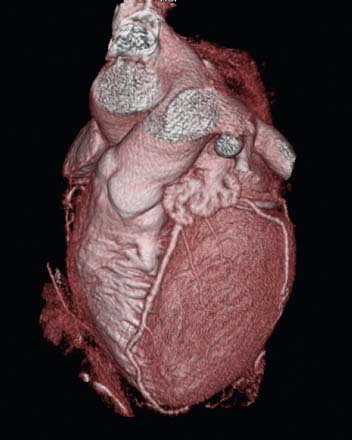
A second approach to creating 3D displays from cardiac images generates the myocardial boundaries directly from image voxels without explicit boundary detection. These techniques are more helpful when used with computed tomography (CT) data; however, given the current interest in CT coronary angiography (CTCA), it is useful to understand the methods. Volume rendering is a 3D graphics technique that provides very realistic-appearing visualizations. For a volume of data, such as a stack of 2D tomographic slices, one assigns to every pixel a transparency, a color, and a reflectivity. The visual process is then simulated by recreating the physical process of light traveling through or bouncing off the pixels that it encounters as it travels through the volume. More details of this process may also be found in the textbook by Watt.35 For any given volume of data, the main problems involve the correct assignation of the pixel properties. Selecting a gray level threshold above which everything is opaque and below which everything is transparent, for example, will provide a 3D image with hard surfaces at that threshold. Unfortunately, very few medical images are accurately segmented with such simplistic threshold techniques. CT images are in fact probably the best adapted to this simple method of assigning pixel properties, since Hounsfield units are related to the electron density of particular tissues, and thus, bone can be made opaque and white, while muscle tissue can be made translucent and red, for example. Nonetheless, most 3D displays of the heart generated from CTCA require large amounts of preprocessing to remove extracardiac structures. The accuracy of this preprocessing is generally related to the quality of the images, and user intervention may be required to produce a useable 3D display. In addition, large amounts of memory and processing power are required for volume rendering of large data sets, although specialized algorithms that take advantage of specific data properties may be used to speed up the process.38 Nevertheless, the realism, high resolution, and flexibility of volume renderings give them an advantage over surface renderings in many cases; this can be appreciated in Figure 4-7.
ARTIFICIAL INTELLIGENCE TECHNIQUES APPLIED TO SPECT
Interpretation of medical images by decision-support systems has made significant progress in recent years, mostly due to the implementation of artificial intelligence (AI) techniques. There are several major application areas associated with AI39,40: natural language processing, problem solving and planning, computer vision, expert systems, and neural computing (neural networks). Expert systems and neural networks are two AI techniques that are currently being applied to nuclear medicine.
Expert System Analysis of Perfusion Tomograms
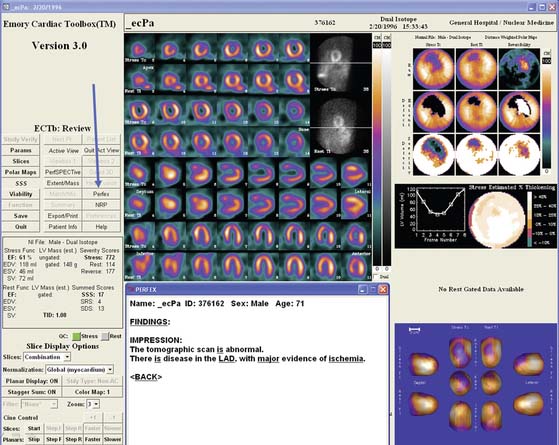
Expert systems are becoming commercially popular because they are designed to circumvent the problem of having few experts in areas where many are needed. Thus, expert systems attempt to capture the knowledge or expertise of the human domain expert and provide it to a large number of nonexperts. An example of the power of expert systems is found in PERFEX (PERFusion EXpert), a system that was originally developed to assist in diagnosing CAD from 201Tl-myocardial distributions.41,42 This type of approach has the potential for standardizing the image interpretation process. After reviewing 291 studies from patients with angiographically documented coronary artery disease, heuristic rules were derived that best correlated the presence and location of perfusion defects on 201Tl-SPECT studies with coronary lesions. These rules operate on data that are input to the expert system from the CEqual SPECT quantification process, which identifies (1) defects as portions of the myocardium where normalized perfusion falls below a predetermined number of standard deviations when compared to a gender-matched normal file and (2) reversibility as defects at stress that improve at rest. An automatic feature extraction program then describes the location and severity of each defect or reversibility. The location is expressed in the form of 32 possible descriptors and is defined as coordinates of both depth (basal, medial, distal-apical, and proximal-apical) and angular location (eight subsets of the septal, inferior, lateral, and anterior myocardial walls). The severity is expressed in terms of certainty factors that range from −1 to +1 (−1 means there is definitely no disease, +1 means there is definitely disease, and the range from −0.2 to +0.2 means equivocal or indeterminable). Using the above features, the expert system automatically determines the location, size, and shape of each defect/reversibility. This information is used to “fire” or execute the 253 heuristic rules in order to produce new facts or draw new inferences. For each input parameter and for each rule, a certainty factor is assigned and is used to determine the certainty of the identification and location of a coronary lesion.
PERFEX has undergone extensive validation. Sixty prospective 99mTc-sestamibi patients (30 with angiographic correlation and 30 without, including 40 patients with CAD and 20 normals) were first used to validate the clinical efficacy of the CEqual/PERFEX program for detecting and localizing CAD.43 The results showed excellent agreement between PERFEX and the human expert for detecting the presence (95%) and localizing CAD to the LAD (92%), LCx (100%), and RCA (96%) vascular territories. The results were good but less impressive for detecting the absence of CAD (50%) overall or in the vascular territories: LAD (46%), LCx (71%), and RCA (76%). These disagreements were concluded to be due mostly to the inherent limitation of not taking into account all of the clinical variables as is done by experts.
The purpose of a second study44 was to validate PERFEX using a large prospective validation consisting of 376 stress/delayed 201Tl-, 138 rest/stress 99mTc-sestamibi myocardial perfusion studies, and 141 rest 201Tl-/stress 99mTc- sestamibi patients who also underwent coronary angiography. The visual interpretations of slices and maps, vessel stenosis from coronary angiography, and PERFEX interpretations were all accessed automatically from databases and used to automatically generate intercomparisons. This study showed that PERFEX demonstrated a higher sensitivity and correspondingly a lower specificity than visual interpretation by human experts for identifying the presence and location of CAD. It also showed that the agreement between PERFEX and the human expert was better than compared to coronary angiography.
Neural Networks
With careful training, neural networks can provide a unique approach to solving problems. For example use neural networks have already been used by three different groups in nuclear cardiology to identify which coronaries are expected to have stenotic lesions for a specific hypoperfused distribution.45–47 These methods vary on the number of input and output nodes used. The more training data available, the better the possibility for more nodes. The output of these systems can be as simple as a single node signifying that there is a lesion present in the myocardium.
WeAidU is one example of an automatic interpretation neural network for interpretation of myocardial perfusion scans.48 In a European multicenter trial of this approach, perfusion studies from different hospitals along with the physicians’ interpretations were transmitted to the neural network site where the images were processed and the interpretations compared. Agreement between hospitals varied between 74% and 92%.49
Data Mining
Data mining is a technique for discovering patterns in large data sets. These methods are generally statistical in nature and/or taken from pattern recognition approaches. Like neural nets, they require a training set for which the truth is known. However, instead of creating a neural network that may be able to process images for diagnostic purposes, the output of a data mining approach is associations between patterns in the data set. These associations may be used to help create an expert system or simply to investigate the data set more closely. Usually, the data input into a data mining algorithm is highly processed; for example, the scores from a typical 17-segment model may be used as the input. A data mining algorithm provided with this information for a large number of patients, along with each patient’s actual diagnosis, may be able to predict the value of a score in each region that would indicate a fixed defect and statistics about its likelihood of being abnormal. Some examples of data mining applied to cardiac SPECT perfusion images can be read in research by Kurgan et al.50 and Sacha et al.51
Commercial Implications
The PERFEX expert system approach described earlier has been integrated as part of the ECTb.25 In this integrated view box display, all of the myocardial perfusion and function visual and quantitative data are available for the physician’s review, as is a button that when depressed provides the expert system decision support. An example PERFEX processing within ECTb is shown in Figure 4-8.
The WeAidU NEURAL NETWORK decision support approach has also been integrated into a cardiac software product called Care Heart and is now part of Exini Diagnostics (www.exini.com) under the name Exini Heart.
ASSESSMENT OF SERIAL STUDIES
First, to optimally compare the images visually or quantitatively, they should be aligned with each other. MacDonald et al., for example, have demonstrated variabilities resulting from processing differences in serial SPECT studies,52 and Faber et al.53 demonstrated that explicit alignment of perfusion studies was necessary to allow accurate detection of even 10% changes in perfusion. The problem of matching one cardiac SPECT perfusion image to another has been investigated in the realm of aligning stress and rest images of the same patient or matching PET and SPECT images to each other. Historically, the images have been aligned to each other using only translation and rotation. In the simplest case, this alignment is achieved by finding and aligning the LV long axes in both images.2,3 More complicated template matching that aligns over translation and rotation of two different images has also been described by Slomka et al.,4 Turkington,54 Peace,55 and Faber,53 for example. Some of these approaches were originally developed to align stress images to rest images,3 to correct dynamic images for motion,56 and to align a patient’s image to a single standard for finding perfusion abnormalities,57 but each of these applications is essentially similar to the problem of matching serial SPECT studies.
Others have matched extracted boundaries of the LV to align the images. Gilardi et al.56 matched the extracted LV surfaces of PET and SPECT images of the same patient to find the rigid transform that best aligns the studies. Declerck et al.57 used the iterative closest point approach to find the best rigid transform to align rest and stress surfaces to each other and to determine the best spline transform to align a specific SPECT study to a template image for diagnosing abnormalities. Thirion58 used an elastic deformable model approach for intramodality registration of SPECT images. Use of this approach to align serial SPECT studies of patients acquired only days apart showed that it could improve reproducibility in quantitative perfusion measurements.59
Once the images are aligned, explicit statistical comparison between the perfusion distributions may help the physician determine if differences in perfusion are significant. This is because the use of standard measures of perfusion may not be sufficient to detect small changes. Faber et al. investigated using standard perfusion quantification measures, such as the summed stress score and summed total severity score, to analyze changes in perfusion.60 In a set of simulations in which defect size and severity were varied, they showed that changes in summed stress scores did not correlate well with changes in severity (r = 0.56); summed stress scores correlated somewhat better (r = 0.77). This is unsurprising, since summed stress scores have a rather small range and may not be able to capture small changes. In general, scores such as the STSS and the total perfusion deficit (TPD),61 which evaluate each pixel of the polar map and have a wide range of possible values, should be able to capture more of the variabilities of perfusion changes in serial studies. In fact, TPD has been used in large-scale clinical trials with success to analyze whether changes can be seen in groups of patients.62 More recently, Berman et al. have shown that of TPD to assess serial studies is more reproducible than visual assessment.13 In a set of patients whose condition was not expected to change, serial imaging performed within 22 months was analyzed by both visual analysis and quantitative TPD, and correlations of quantitative parameters between the serial studies were higher than correlations of visual indices.
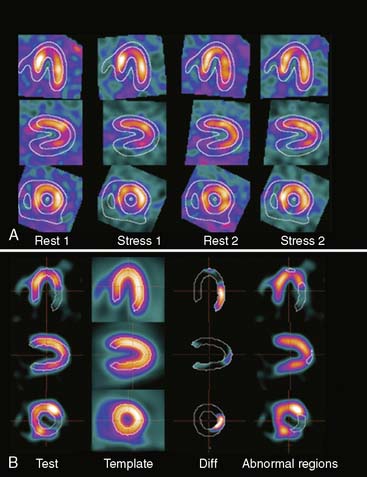
However, use of a single global measure of perfusion will not give a complete picture of clinical changes when evaluating single patients. Instead, more information may be obtained by evaluating regional or even pixel-level changes in polar maps or the images themselves. Faber et al. investigated using a statistical comparison of the perfusion values within each segment of a 20-segment division of the polar maps.60 While useful for detecting large perfusion changes, the approach failed entirely when changes were less than or equal to 5%. The method could only detect 10% changes when the size of the defect was greater than ⅛ of the LV. A more accurate approach looked at changes of pixel values within perfusion defects (determined by comparison of the perfusion values to a normal database). Perfusion values from the blacked-out area of one study were compared to those from the same region in the other study. This approach allowed high accuracy detection of both 10% and 15% differences in perfusion severity.53 One of the few clinical studies performed to evaluate the efficacy of alignment and statistical comparison approaches for analysis of serial studies was carried out by Itti et al.63 These investigators used the methods of Declerck et al.57 to align both of the serial studies to a normal template and determine regions of abnormality in both. Changes within this abnormal region were computed and compared statistically. The method was applied in 49 patients to compare perfusion before and after PTCA, using QCA as a gold standard. They were able to show significant differences in perfusion changes between patients that did and did not reocclude 3 months after revascularization. Figure 4-9 shows an example from this work.
FUSION OF MULTIMODALITY CARDIAC IMAGERY
Most manufacturers now supply interactive software so that the user can manipulate one image with 3D rotations and translations until it matches a second. However, these procedures are difficult and time-consuming, as well as subjective and irreproducible. To eliminate these drawbacks, automated methods are being developed. An excellent overview of cardiac image registration is given by Makela et al.64 In the following sections, three applications of automatic integration of cardiac nuclear medicine with other modalities are described.
Registration of Myocardial Perfusion and Magnetic Resonance Images
Various groups have published reports regarding surface-based registration of cardiac MRI and PET images.65–69 In the work of Sinha et al.65 the LV boundaries were detected interactively using morphologic and linear filtering tools. By combining this transform with the known pixel sizes and temporal resolution, either of the four-dimensional image sets could be transformed into the spatial and temporal coordinates of the other. This method was validated by calculating the difference between user-identified landmarks in the two images after transformation, using 6 MRI/PET image pairs and an average of 14 landmarks per pair. The accuracy was determined to be 1.3 + 1.1 mm for the end-diastolic images and 1.95 + 1.6 for end-systolic images.
Makela et al.66 segment the MRI and PET data sets using deformable models fitted to edges in the MRI image and the PET transmission images. This gives 3D models of the important structures in the thorax, specifically, lungs, mediastinum, and body surface. The models are aligned rigidly using an optimization algorithm. The same group67 extended this work by including an additional segmentation of the left and right ventricles from the MRI using a more sophisticated deformable model; since this step was done after registration, the model could be superimposed over the PET image and used to evaluate left and right ventricular perfusion.
More recently, volumetric approaches, which do not require explicit boundary detection as a first step, have been explored. These methods are commonplace in brain images, where even images from different modalities are very similar, and a good measure of similarity between the two images can be easily found. In cardiac applications, however, nuclear images of the thorax seldom look much like those from MRI. However, if the heart can be isolated from both MRI and nuclear images, then it is possible to align them using a cost function that operates on the original myocardial pixel values and attempts to reduce the differences between them. This is the approach taken by Aladl et al.68 When they compared the automatic approach to an interactive one performed by an expert, they found differences in translation and orientation to average approximately 1 pixel and 4(o), respectively, based on 20 patients. Results from this method can be seen in Figure 4-10.
Misko et al69 described the use and value of registered SPECT and cardiac MRI. They used manual alignment tools to reorient the ED frame of the SPECT study with the ED frame of the MRI. Perfusion data were obtained from this ED SPECT slice, whereas function was obtained from the MRI. They used delayed enhancement MRI techniques to define viability. The registered data sets were not displayed in 3D; instead, they were divided into 6 segments per short-axis slice, and the perfusion, motion, and viability information was combined in 18 patients. They computed a statistic called MIBI uptake per volume (MIV), which is made up of counts from the perfusion image normalized by the volume determined by the MRI LV boundaries. They were able to show strong relationships between reduced perfusion, delayed enhancement, and hypokinesis. Although this work is a preliminary example of how clinical fusion of SPECT and MRI might work, it does not address whether explicit alignment of these modalities aids diagnosis compared to mental integration which is typically performed by the clinician.
Registration of Myocardial Perfusion Images and Coronary Artery Data from Angiography
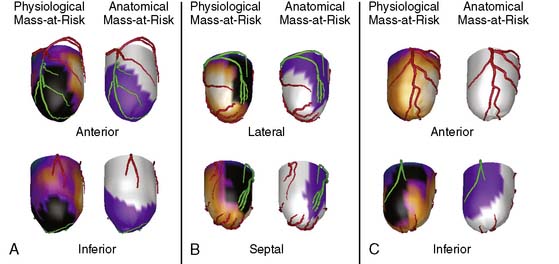
Most approaches that attempt to combine nuclear with angiographic data perform the alignment by registering a 3D LV model representing myocardial perfusion with the patient’s own 3D coronary artery tree and present both in a single unified display. One method creates a patient-specific coronary arterial tree from a 3D geometric reconstruction performed on simultaneously acquired, from digital biplane angiographic projections, or from two single-plane projections acquired at different angles. The 3D reconstructed arterial tree is approximated by successive conical segments and scaled and rotated to fit onto the myocardial surface. The left and/or right coronary arteries are registered with the myocardial perfusion surface model by automatically minimizing a cost function that describes the relationships of the coronary artery tree with the interventricular and atrioventricular groove and the surface of the myocardium.70 A recent publication has described clinical validations of this technique.71 Figure 4-11 shows an example of fusion on three different patient examples.
Similar work has been reported by Schindler et al.72 Three-dimensional models of the LV epicardium were generated from SPECT and aligned with 3D models of the left coronary artery tree created from angiograms. In this work, however, the alignment was performed by using acquisition parameters for SPECT and angiography to determine “patient coordinates” of the two models. Once these coordinates were known, the models could be easily aligned, and a simple translation between the two models was applied if necessary to refine the match. A display was generated by reprojecting both 3D models into the desired view angle.
A completely different approach was taken by Nishimura et al.73 They used the original angiograms but superimposed these on top of a 3D model of perfusion obtained from SPECT quantification. The 3D LV was oriented to match the known angles of the angiogram and then automatically translated so that the endocardial surface in the 3D SPECT display matched the LV contour seen in a contrast left ventriculogram taken at the same angle as the arteriogram. A scaling factor was applied to the surface based on a previously calculated value determined using phantom studies.
Fusion of Myocardial Perfusion Images and CT Angiography (See Chapter 8)
More recently, the advent of combined PET/CT machines utilizing high-speed multislice CT has allowed the sequential acquisition of PET perfusion and CTCA. The images are in close alignment so that coronary artery anatomy can be visualized with the PET perfusion information. A visualization technique that displays volume-rendered CT surfaces with PET perfusion color-coding has been described by Namdar et al.74; in this case, the heart can be visualized in high resolution but with perfusion information overlaid on top. However, it is well understood that even in combined PET/CT scanners, the hearts are not perfectly aligned, owing to cardiac, breathing, and patient motion. Thus, additional alignment may need to be performed prior to display and analysis. Nakauro et al.75 use an approach similar to that of Namdar et al.74 for displaying SPECT and computed tomographic angiography (CTA) from a combined SPECT/CT scanner; however, this group does an explicit registration and volumetric display.
Faber et al.76 take a surface-based approach in which coronary arteries segmented from the CT studies are explicitly aligned to and displayed on top of 3D models created from the PET perfusion data. The 3D LV epicardium is extracted from the PET image, and coronary arteries are extracted from the CT coronary angiogram. The left tree is aligned to the LV such that the LAD follows the anterior interventricular groove, and the LCx follows the left atrioventricular groove. The right tree is aligned so that the PDA follows the inferior interventricular groove. A final warping operation is performed so that the arteries are forced to lie on the epicardial surface.
Given that additional alignment is needed even from combined scanners and that high-resolution multislice CT scanners exist in radiology departments separate from any nuclear perfusion scanners, it is quite desirable to be able to align retrospectively CTA and SPECT or PET studies from different scanners. A study by Nakajo et al.77 described using processed SPECT and CTA to create a combined surface display. They used manual identification of the coronary arteries in the CTA to define the trees and a threshold-based, semiautomatic algorithm to define the LV epicardium and endocardium. The CTA and SPECT images were aligned manually and also automatically using linear and nonrigid registration methods. For the automatic methods, a binary image of the LV was created from the CTA using the semiautomatically detected endocardial and epicardial surfaces. A linear transformation was computed that maximized the overlap between the SPECT and binary CT images. Then a second degree polynomial transformation was computed to maximize the same cost function. Three-dimensional polygonal surfaces were created from the aligned SPECT images and color-coded for perfusion, and then the manually detected coronary arteries were displayed on top of this surface.
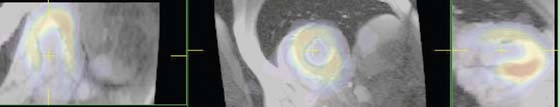
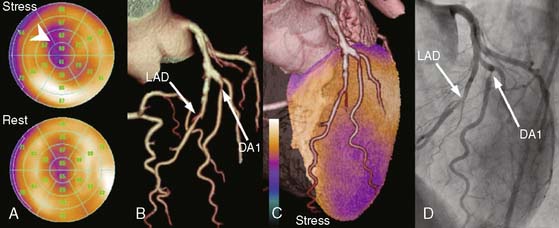
Another group has taken a similar approach but with a volume-rendering type of display based on the CTA. Gaemperli et al.78 describe an approach where the SPECT and CTA images are manually aligned. The LV epicardium is semiautomatically segmented from the CTA, and the SPECT intensity information is projected onto this epicardial surface. The coronary artery tree is segmented using an automated vessel-tracking technique. The results are displayed using a volume rendering technique. This group determined that fusion process was highly reproducible and accurate. They also published results of using this approach clinically.79 One example of the results of this approach is shown in Figure 4-12.
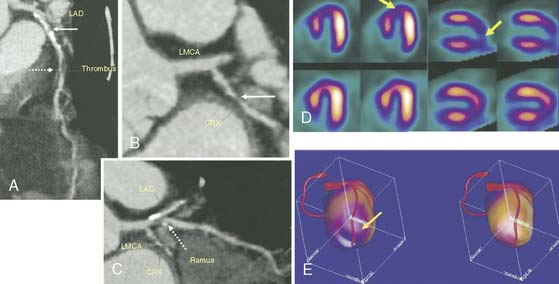
Finally, it is also possible to use the methods of Faber et al. for aligning CTA with SPECT or PET images obtained from separate scanners. Since this method was developed to handle misalignment between the two studies, it is easily applied to scans that are not already in registration. This surface-based technique aligns the 3D coronary artery tree from CTA with the LV epicardial surface from MPI, which is automatically generated during standard perfusion quantification. Clinical assessment of this approach was described by both Rispler et al.80 and Santana et al.81 An example of the method applied to a CTA and SPECT study obtained from two separate scanners is shown in Figure 4-13.
PHASE ANALYSIS OF GATED MYOCARDIAL PERFUSION SPECT IMAGES
It has been shown that phase analysis measured from gated myocardial perfusion SPECT images can differentiate patient cohorts who were expected to have different degrees of LV dyssynchrony.82 LV dyssynchrony measured by phase analysis has been shown to correlate with that measured by 2D tissue Doppler imaging (TDI)83 and 3D TDI,84 and to predict patient response to cardiac resynchronization therapy (CRT),85 in patients with end-stage heart failure, depressed LV ejection fraction, and prolonged QRS duration on surface electrocardiography. Phase analysis software packages have been recently developed and validated to quantitatively measure LV mechanical dyssynchrony from gated myocardial perfusion SPECT images.
Mathematical Principles in Phase Analysis
Gated SPECT MPI produces a number of 3D LV images (frames) corresponding to different time points during the cardiac cycle. As these frames progress from the R-wave, both location and intensity of each myocardial segment change periodically. While change of the location of each myocardial segment allows assessment of regional wall motion, change of the intensity indicates regional wall thickening due to the partial volume effect.86 It has been shown that the change in myocardial wall thickness is approximately linear to the change in maximum counts extracted from the same myocardial segment.87,88 The phase analysis technique measures the first-harmonic phase of regional LV count changes throughout the cardiac cycle. This phase information is related to the time interval when a region in the 3D LV myocardial wall starts to contract (presumably, onset of mechanical contraction [OMC]). It provides information as to how uniform or inhomogeneous the distribution of these time intervals is for the entire LV (i.e., a measure of LV synchrony/dyssynchrony).
Processing and Quantification of Dyssynchrony
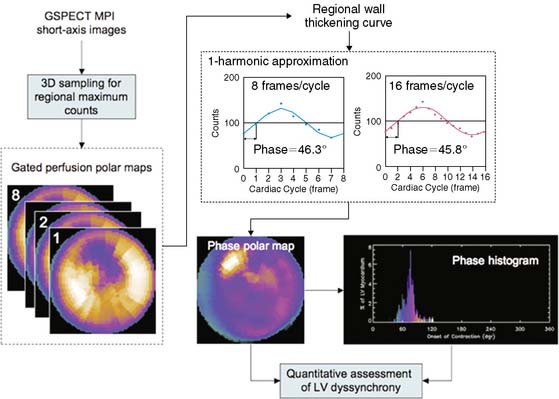
The basics of phase analysis are generally similar in most quantitative software packages, but implementations and processing details may vary significantly. For example, in the Emory Synctool, the input is a gated SPECT MPI short-axis image, which is reconstructed from a conventional gated SPECT MPI study using a conventional reconstruction algorithm. The short-axis image is then searched in 3D to obtain regional maximal counts using a 3D sampling algorithm previously implemented in the ECTb.25 These samples can be displayed as gated polar maps. First-harmonic Fourier function is used to approximate the regional wall thickening curve and to calculate regional phase for each myocardial sample—that is, each pixel of the gated polar maps. This results in an OMC phase distribution, which is then quantitatively assessed for uniformity or heterogeneity. An example of this processing stream is shown in Figure 4-14. Five indices related to this distribution, including mean and standard deviation, for example, have been used to assess LV dyssynchrony. Normal limits for these indices were generated from gated SPECT MPI studies of 45 male and 45 female normal subjects.89 Clinical validations of the phase analysis technique showed that phase standard deviation and histogram bandwidth had better clinical usefulness than the other derived quantitative indices.
Reproducibility
Phase analysis is largely automatic. Intra-observer and inter-observer reproducibility of this technique has been evaluated in a recent study using 10 consecutive subjects with LV dysfunction (LVEF ≤ 35%) and 10 normal controls.90 For phase standard deviation and histogram bandwidth, intra-observer correlation coefficients were 1.00 and 1.00, and mean absolute differences between two reads by the same observer at different occasions were 0.8° and 1.4°, respectively. Inter-observer correlation coefficients were 0.99 and 0.99, and the mean absolute differences between two reads by two independent observers were 2.0° and 5.4°, respectively, for phase standard deviation and histogram bandwidth. The superior reproducibility of phase analysis over echocardiography is a promising advantage that may improve prediction of response to CRT, since 20% to 40% of the poor CRT outcome is based on echocardiographic results, and in none of these studies was gated SPECT MPI used.
Temporal Resolution
Since gated SPECT MPI studies are usually acquired as 8 or 16 frames/cardiac cycle, these data are perceived to have low temporal resolution. It is important to note that phase analysis uses continuous Fourier harmonic functions to approximate the discrete wall-thickening samples. Use of Fourier processing reduces the differences between phases measured from fewer gates. In the example in Figure 4-14, the phase difference between 8 versus 16 frames/cycle is very small: 0.5° (360° corresponds to one cardiac cycle), demonstrating that Fourier harmonic approximation improves the temporal resolution of the phase measurement. A recent simulation study based on digital phantoms has shown that in common clinical settings (≥10 counts per myocardial pixel) phase analysis can detect phase delays using gated SPECT MPI data acquired with 8 or 16 frames/cycle with the same accuracy as if they had been acquired using 64 frames/cycle but processed without Fourier analysis, indicating that the temporal resolution of phase analysis is equivalent to 1/64 cardiac cycle.91
1. Knollmann D., Winz O.H., Meyer P.T., et al. Gated myocardial perfusion SPECT: algorithm-specific influence of reorientation on calculation of left ventricular volumes and ejection fraction. J Nucl Med. 2008;49:1636-1642.
2. Germano G., Kavanagh P.B., Su H.T., et al. Automatic reorientation of 3-dimensional transaxial myocardial perfusion SPECT images. J Nucl Med. 1995;36:1107-1114.
3. Faber T.L., Folks R.D., Garcia E.V. Development and analysis of an automatic reorientation program [abstract]. J Nucl Cardiol. 2007;14:S99.
4. Slomka P.J., Hurwitz G.A., Stephenson J., Cradduck T. Automated alignment and sizing of myocardial stress and rest scans to three-dimensional normal templates using an image registration algorithm. J Nucl Med. 1995;36:1115-1122.
5. Fitzgerald J., Danias T.G. Effect of motion on cardiac SPECT imaging: recognition and motion correction. J Nucl Cardiol. 2001;8:701-706.
6. Cooper J.A., Neumann P.H., McCandless B.K. Detection of patient movement during myocardial perfusion imaging. J Nucl Med. 1993;35:1341-1348.
7. O’Conner M.K., Kanal K.M., Gebhard M.W., Rossman P.J. Comparison of four motion correction techniques in SPECT imaging of the heart: A cardiac phantom study. J Nucl Med. 1998;39:2027-2034.
8. Lee K.J., Barber D.C. Use of forward projection to correct patient motion during SPECT imaging. Phys Med Biol. 1998;43:171-187.
9. Matsumoto N., Berman D.S., Kavanagh P.B., et al. Quantitative assessment of motion artifacts and validation of a new motion-correction program for myocardial perfusion SPECT. J Nucl Med. 2001;42:687-694.
10. Garcia E.V., Van Train K., Maddahi J., et al. Quantification of rotational thallium-201 myocardial tomography. J Nucl Med. 1985;26:17-26.
11. DePasquale E., Nody A., DePuey G., et al. Quantitative rotational thallium-201 tomography for identifying and localizing coronary artery disease. Circulation. 1988;77:316-327.
12. Wackers F.J.T. Science, art, and artifacts: How important is quantification for the practicing physician interpreting myocardial perfusion studies? J Nucl Cardiol. 1994;1:S109-S117.
13. Berman D.S., Kang X., Gransar H., et al. Quantitative assessment of myocardial perfusion abnormality on SPECT myocardial perfusion imaging is more reproducible than expert visual analysis. J Nucl Cardiol. 2009;16:45-53.
14. Ezekiel A., Van Train K.F., Berman D.S., et al. Automatic determination of quantitation parameters from Tc-sestamibi myocardial tomograms. In: Computers in Cardiology. Los Alamitos, California: IEEE Computer Society; 1991:237-240.
15. Garcia E.V., Cooke C.D., Van Train K.F., et al. Technical aspects of myocardial perfusion SPECT imaging with Tc-99m sestamibi. Am J Cardiol. 1990;66:23-31E.
16. Germano G., Kavanaugh P.B., Waechter P., et al. A new algorithm for the quantitation of myocardial perfusion SPECT. I: Technical principles and reproducibility. J Nucl Med. 2000;41:712-719.
17. Liu Y.H., Sinusa A.J., DeMan P., et al. Quantification of SPECT myocardial perfusion images: Methodology and validation of the Yale-CQ method. J Nucl Cardiol. 1999;6:190-203.
18. Watson D.D. Quantitative SPECT techniques. Semin Nucl Med. 1999;29:192-203.
19. Klein J.L., Garcia E.V., DePuey E.G., et al. Reversibility bullseye: A new polar bull’s-eye map to quantify reversibility of stress-induced SPECT Tl-201 myocardial perfusion defects. J Nucl Med. 1990;31:1240-1246.
20. Diamond G.A., Forrester J.S. Analysis of probability as an aid in the clinical diagnosis of coronary artery disease. N Engl J Med. 1979;300:1350-1358.
21. Van Train K.F., Areeda J., Garcia E.V., et al. Quantitative same-day rest-stress technetium-99m-sestamibi SPECT: Definition and validation of stress normal limits and criteria for abnormality. J Nucl Med. 1993;34:1494-1502.
22. DePuey E.G., Roubin G.S., DePasquale E.E., et al. Sequential multivessel coronary angioplasty assessed by thallium-201 tomography. Cathet Cardiovasc Diagn. 1989;18:213-221.
23. Berman D.S., Hachamovitch R., Kiat H., et al. Incremental value of prognostic testing in patients with known or suspected ischemic heart disease: A basis for optimal utilization of exercise technetium-99m sestamibi myocardial perfusion single-photon emission computed tomography. J Am Coll Cardiol. 1995;26:639-647.
24. Faber T.L., Cooke C.D., Folks R.D., et al. Left ventricular function and perfusion from gated SPECT perfusion images: An integrated method. J Nucl Med. 1999;40:650-659.
25. Garcia E.V., Faber T.L., Cooke C.D., Folks R.D., Chen J., Santana C. The increasing role of quantification in nuclear cardiology: The Emory approach. J Nucl Cardiol. 2007;14:420-432.
26. Ficaro E.P., Kritzman J.N., Corbett J.R. Development and clinical validation of normal Tc-99m sestamibi database: comparison of 3D-MSPECT to CEqual [abstract]. J Nucl Med. 1999;5:125P.
27. Ficaro E.P., Lee B.C., Kritzman J.N., Corbett J.R. Corridor 4DM: The Michigan method for quantitative nuclear cardiology. J Nucl Cardiol. 2007;14:455-465.
28. Germano G., Kavanagh P.B., SLomka P.J., et al. Quantitation in gated perfusion SPECT imaging: The Cedars-Sinai approach. J Nucl Cardiol. 2007;14:433-454.
29. Liu Y.H. Quantification of nuclear cardiac images: The Yale approach. J Nucl Cardiol. 2007;14:483-491.
30. Sharir T., Germano G., Waechter P.B., et al. A new algorithm for the quantitation of myocardial perfusion SPECT. II: Validation and diagnostic yield. J Nucl Med. 2000;41:720-727.
31. Van Train K.F., Garcia E.V., Maddahi J., et al. Multicenter trial validation for quantitative analysis of same-day rest-stress technetium-99m-sestamibi myocardial tomograms. J Nucl Med. 1994;35:609-1168.
32. Folks R., Garcia E., Van Train K., et al. Quantitative two-day Tc-99m sestamibi myocardial SPECT: Multicenter trial validation of normal limits. J Med Tech. 1996;24:158.
33. DePuey E.G., Krawcynska E.G., D’Amato P.H., Patterson R.E. Thallium-201 single-photon emission computed tomography with intravenous dipyridamole to diagnose coronary artery disease. Coron Artery Dis. 1990;1:75-82.
34. Ella A., Champier J., Bontemps L., Itti R. Three-dimensional automatic warping in cardiac SPECT. Nucl Med Commun. 2000;21:1135-1146.
35. Watt A. 3D Computer Graphics. London: Addison Wesley, 1999.
36. Cooke C.D., Vansant J.P., Krawczynska E., et al. Clinical validation of 3-d color-modulated displays of myocardial perfusion. J Nuclear Cardiol. 1997;4:108-1106.
37. Santana C.A., Garcia E.V., Vansant J.P., et al. Three-dimensional color-modulated display of myocardial SPECT perfusion distributions accurately assesses coronary artery disease. J Nucl Med. 2000;41:1941-1946.
38. Levin D., Aladl U., Germano G., Slomka P. Techniques for efficient, real-time 3D visualization of multi-modality cardiac data using consumer graphics hardware. Comput Med Imaging Graph. 2005;29:463-475.
39. Anderson J.A., Rosenfeld E., editors. Neurocomputing: Foundations of Research. Cambridge, MA: MIT Press, 1988.
40. Nilsson N. Principles of Artificial Intelligence. Wellsboro, PA: Tioga Publishing, 1980.
41. Ezquerra N.F., Garcia E.V. Artificial intelligence in nuclear medicine imaging. Am J Cardiac Imaging. 1989;3:130-141.
42. Garcia E.V., Herbst M.D., Cooke C.D., et al: Knowledge-based visualization of myocardial perfusion tomographic images. In Proceedings of the First Conference on Visualization in Biomedical Computing, Atlanta, GA, 1990, IEEE Press, pp 157-161.
43. Garcia E.V., Cooke C.D., Krawczynska E., Folks R., et al. Expert system interpretation of technetium-99m sestamibi myocardial perfusion tomograms: Enhancements and validation. Circulation. 1995;92:1-10.
44. Garcia E.V., Cooke C.D., Folks R.D., et al. Diagnostic performance of an expert system for the interpretation of myocardial perfusion SPECT studies. J Nucl Med. 2001;42:1185-1191.
45. Fujita H., Katafuchi T., Uehara T., Nishimura T. Application of artificial neural network to computer-aided diagnosis of coronary artery disease in myocardial SPECT bull’s-eye images. J Nucl Med. 1992;33:272-276.
46. Hamilton D., Riley P.J., Miola U.J., Amro A.A. A feed forward neural network for classification of bull’s-eye myocardial perfusion images. Eur J Nucl Med. 1995;22:108-115.
47. Porenta G., Dorffner G., Kundrat S., et al. Automated pnterpretation of Planar thallium-201-dipyridamole stress-redistribution scintigrams using artificial neural networks. J Nucl Med. 1994;35:2041-2047.
48. Lindahl D., Palmer J., Ohlsson M., et al. Automated interpretation of myocardial SPECT perfusion images using artificial neural networks. J Nucl Med. 1997;38:1870-1875.
49. Tagil K., Andersson L.-G., Balogh I., et al. Evaluation of a new internet based system for interpretation of myocardial perfusion images. J Nucl Cardiol. 1991;8:S16. (abstr.)
50. Kurgan L.A., Cios K.J., Tadeusiewicz R., et al. Knowledge discovery approach to automated cardiac SPECT diagnosis. Artif Intell Med. 2001;23:149-169.
51. Sacha J.P., Goodenday L., Cios K.J. Bayesian learning for cardiac SPECT image interpretation. Artif Intell Med. 2002;26:109-143.
52. MacDonald L.A., Elliott M.D., Leonard S.M., et al. Variability of myocardial perfusion SPECT: Contribution of repetitive processing, acquisition and testing [abstract]. J Nucl Med. 1999;40:126P.
53. Faber T.L., Modersitzki J., Folks R.D., Garcia E.V. Detecting changes in serial myocardial perfusion SPECT: A simulation study. J Nucl Cardiol. 2005;12:302-310.
54. Turkington T.G., DeGrado T.R., Hanson M.W., Coleman R.E. Alignment of dynamic cardiac PET images for correction of motion. IEEE Trans Nucl Sci. 1997;44:235-242.
55. Peace R.A., Staff R.T., Gemmell H.G., et al. Automatic detection of coronary artery disease in myocardial perfusion SPECT using image registration and voxel to voxel statistical comparisons. Nucl Med Commun. 2002;23:785-794.
56. Gilardi M.C., Rizzo G., Savi A., et al. Correlation of SPECT and PET cardiac images by a surface matching registration technique. Comp Med Imaging Graph. 1998;22:391-398.
57. Declerck J., Feldmar J., Goris M.L., Betting F. Automatic registration and alignment on a template of cardiac stress and rest reoriented SPECT images. IEEE Trans Med Imaging. 1997;16:727-737.
58. Thirion J.P. Image matching as a diffusion process: An analogy to Maxwell’s demons. Med Image Anal. 1998;2:243-260.
59. Hendel R.C., Thirion J.P., Leonard S.M. The impact of geometric and intensity normalization on the reproducibility of myocardial perfusion SPECT imaging [abstract]. J Nucl Med. 2000;41:46P.
60. Faber T.L., Galt J.R., Chen J., et al. Detecting changes in myocardial perfusion. In: Lemke H.U., Vannier M.W., Inamura K., et al, editors. Computer-Assisted Radiology and Surgery. Berlin: Springer-Verlag; 2002:879-883.
61. Slomka P.J., Nishina H., Berman D.S., et al. Automated quantification of myocardial perfusion SPECT using simplified normal limits. J Nucl Cardiol. 2005;12:66-77.
62. Shaw L.J., Berman D.S., Maron D.J., et al. Optimal medical therapy with or without percutaneous coronary intervention to reduce ischemic burden: Results from the Clinical Outcomes Utilizing Revascularization and Aggressive Drug Evaluation (COURAGE) trial nuclear substudy. Circulation. 2008;117:1283-1291.
63. Itti E., Klein G., Rosso J., Evangelista E., et al. Assessment of myocardial reperfusion after myocardial infarction using automatic 3D quantification and template matching. J Nucl Med. 2004;45:1981-1988.
64. Makela T., Clarysse P., Sipila O., et al. A review of cardiac image registration methods. IEEE Trans Med Imaging. 2002;21:1011-1021.
65. Sinha S., Sinha U., Czernin J., et al. Noninvasive assessment of myocardial perfusion and metabolism: feasibility of registering gated MR and PET images. AJR Am J Roentgenol. 1995;164:301-307.
66. Makela T.J., Clarysse P., Lotjonen J., et al. A new method for the registration of cardiac PET and MR images using deformable model-based segmentation of the main thorax structures. In: Niessen W.J., Viergever M.A., editors. Lecture Notes in Computer Science, vol 2208: Medical Image Computing and Computer-Assisted Intervention. Berlin: Springer-Verlag; 2001:557-564.
67. Makela T., Pham Q.C., Clarysse P., et al. A 3D model-based registration approach for the PET, MR and MCG cardiac data fusion. Med Image Anal. 2003;7:377-389.
68. Aladl U.E., Hurwitz G.A., Dey D., et al. Automatic image registration of gated cardiac single photon emission computed tomography and magnetic resonance imaging. J Magn Reson Imaging. 2004;19:283-290.
69. Misko J., Dzluk M., Skrobowska E., et al. Co-registration of cardiac MRI and rest gated SPECT in the assessment of myocardial perfusion, function, and viability. J Cardiovasc Magn Reson. 2006;8:389-397.
70. Faber T.L., Chiron F., Ezquerra N.F., Rossignac J., et al. Registration of multimodal 3D cardiac information using the iterative closest point approach. In: Wilson D.C., et al, editors. Mathematical Modeling, Estimation, and Imaging. Bellingham, WA: SPIE; 2000:233-241.
71. Faber T.L., Santana C.A., Garcia E.V., et al. 3D fusion of coronary arteries with myocardial perfusion distributions: Clinical validation. J Nucl Med. 2004;45:745-753.
72. Schindler T.H., Magosaki N., Jeserich M., et al. Fusion imaging: Combined visualization of 3D reconstructed coronary artery tree and 3D myocardial scintigraphic image in coronary artery disease. Int J Card Imaging. 1999;15:357-368.
73. Nishimura Y., Fukuchi K., Kataufchi T., et al. Superimposed display of coronary artery on gated myocardial perfusion scintigraphy. J Nucl Med. 2004;45:1444-1449.
74. Namdar M., Hany T.F., Koepfli P., et al. Integrated PET/CT for the assessment of coronary artery disease: a feasibility study. J Nucl Med. 2005;46:930-935.
75. Nakauro T., Utsunomiya U., Shiraishi S., et al. Fusion imaging between myocardial perfusion single photon computed tomography and cardiac computed tomography. Circulation. 2005;112:e47-e48.
76. Faber T.L., Garcia E.V., Hertel S., et al. Evaluation of automatic fusion of coronary arteries onto left ventricular surfaces from PET/CT [abstract]. J Nucl Med. 2004;45:399P.
77. Nakajo H., Kumita S., Cho K., Kumazaki T. Three-dimensional registration of myocardial perfusion SPECT and CT angiography. Ann Nucl Med. 2005;19:207-215.
78. Gaemperli O., Schepis T., Kalff V., et al. Validation of a new cardiac image fusion software for three-dimensional integration of myocardial perfusion SPECT and standalone 64-slice CT angiography. Eur J Nucl Med Mol Imaging. 2007;34:1097-1106.
79. Gaemperli O., Schepis T., Valenta I., et al. Cardiac image fusion from stand-alone SPECT and CT: Clinical experience. J Nucl Med. 2007;48:696-703.
80. Rispler S., Keidar Z., Ghersin E., et al. Integrated single photon emission computed tomography and computed tomography coronary angiography for the assessment of hemodynamically significant coronary artery lesions. J Am Coll Cardiol. 2007;49:1059-1067.
81. Santana C.A., Garcia E.V., Faber T.L., et al. Diagnostic performance of fusion of myocardial perfusion imaging (MPI) and computed tomography coronary angiography. J Nucl Cardiol. 2009. 16:201–211, 2009
82. Trimble M.A., Smalheiser S., Borges-Neto S., et al. Evaluation of left ventricular mechanical dyssynchrony as determined by phase analysis of ECG-gated myocardial perfusion SPECT imaging in patients with left ventricular dysfunction and conduction disturbances. J Nucl Cardiol. 2007;14:298-307.
83. Henneman M.M., Chen J., Ypenburg C., Dibbets, et al. Phase analysis of gated myocardial perfusion SPECT compared to tissue Doppler imaging for the assessment of left ventricular dyssynchrony. J Am Coll Cardiol. 2007;49:1708-1714.
84. Ajmone Marsan N., Henneman M.M., Chen J., et al. Left ventricular dyssynchrony assessed by two 3-dimensional imaging modalities: phase analysis of gated myocardial perfusion SPECT and tri-plane tissue Doppler imaging. Eur J Nucl Med Mol Imaging. 2008;35:166-173.
85. Henneman M.M., Chen J., Dibbets P., et al. Can LV dyssynchrony as assessed with phase analysis on gated myocardial perfusion SPECT predict response to CRT? J Nucl Med. 2007;48:1104-1111.
86. Hoffman E.J., Huang S.C., Phelps M.E. Quantitation in positron emission computed tomography: 1. Effect of object size. Comput Assist Tomogr. 1979;3:299-308.
87. Galt J.R., Garcia E.V., Robbins W.L. Effects of myocardial wall thickness on SPECT quantification. IEEE Trans Med Imaging. 1990;9:144-150.
88. Cooke C.D., Garcia E.V., Cullom S.J., et al. Determining the accuracy of calculating systolic wall thickening using a Fast Fourier Transform approximation: A simulation study based on canine and patient data. J Nucl Med. 1994;35:1185-1192.
89. Chen J., Garcia E.V., Folks R.D., et al. Onset of left ventricular mechanical contraction as determined by phase analysis of ECG-gated myocardial perfusion SPECT imaging: Development of a diagnostic tool for assessment of cardiac mechanical dyssynchrony. J Nucl Cardiol. 2005;12:687-695.
90. Trimble M.A., Velazquez E.J., Adams G.L., et al. Repeatability and reproducibility of phase analysis of gated SPECT myocardial perfusion imaging used to quantify cardiac dyssynchrony. Nucl Med Commun. 2008;29:374-381.
91. Chen J., Faber T.L., Cooke C.D., Garcia E.V. Temporal resolution of multi-harmonic phase analysis of ECG-gated myocardial perfusion SPECT studies. J Nucl Cardiol. 2008;15:383-391.