Chapter 3 Specialized Electrodiagnostic Studies
LATE RESPONSES
Late responses are obtained using special techniques that are not possible with conventional nerve conduction studies. The settings are usually changed to allow the examiner to capture these responses. This include using longer sweep speed of 5–10 ms/division and lower amplifier gain of 200–500 μV/division which could be adjusted depending on the limb studied, site of stimulation and magnitude of response. Since it is intended for the action potentials to travel proximally with the late response recording, the bipolar stimulator is switched to place the cathode more proximally and the anode distally.
F Wave
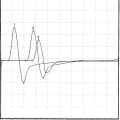
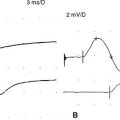
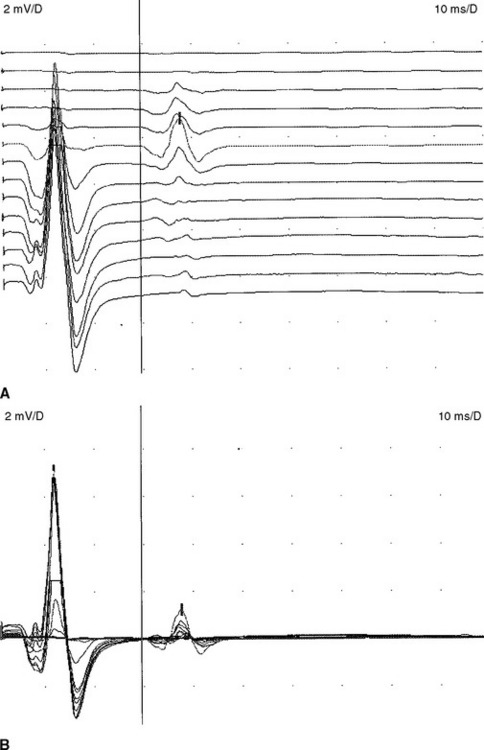
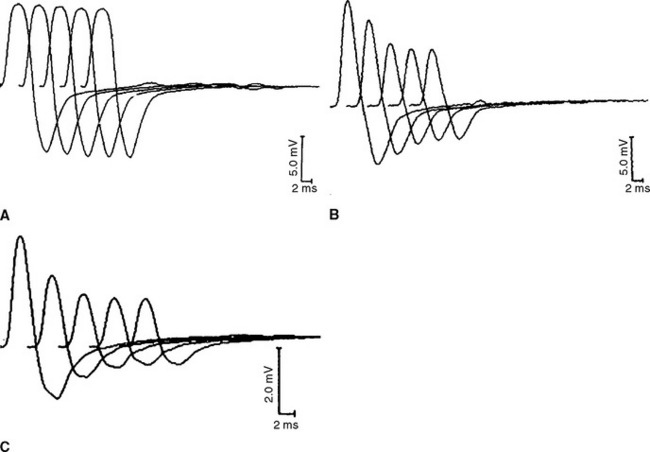
The F waves are low-amplitude and ubiquitous responses that are typically variable in latency, amplitude, and morphology (Figure 3-1A and B). Their variability is explained by differing groups of motor neurons generating the recurring discharge with each individual group of neurons having different number of motor neurons and conducting properties. Several parameters may be analyzed, but the minimal F wave latency is the most reliable and useful measurement since it represents conduction of the largest and fastest motor fibers. Since F wave latencies vary from one stimulus to the next, an adequate study requires that about 10 F waves be clearly identified. The minimal F wave latency is also dependent on the length of motor axons which correlates with the patient’s height and limb length. The most sensitive criterion of abnormality in a unilateral disorder is a latency difference between the two sides, or between two similar nerves in the same limb. Absolute latencies are most useful only for sequential reassessment of the same nerve. F wave persistence is a measure of the number of F waves obtained for the number of stimulations. This varies between individuals and is inhibited by muscle activity while it is enhanced by relaxation or the use of Jendrasik maneuver. It is usually above 50% except when stimulating the peroneal nerve while recording the extensor digitorum brevis. F wave chronodispersion is the degree of scatter among consecutive F waves and is determined by the difference between the minimal and maximal F wave latencies. It indicates the range of motor conduction velocities between the smallest and largest myelinated motor axon in the nerve. The F wave conduction velocity may be calculated after distal and proximal supramaximal stimulations and provides a better comparison between proximal and distal (forearm or leg) segments.
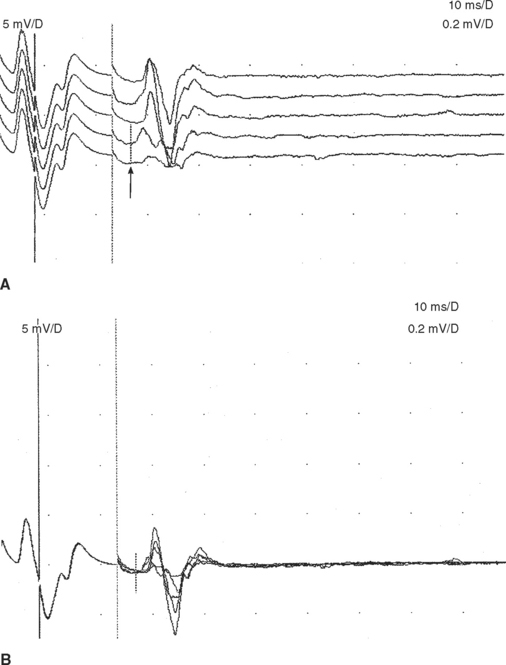
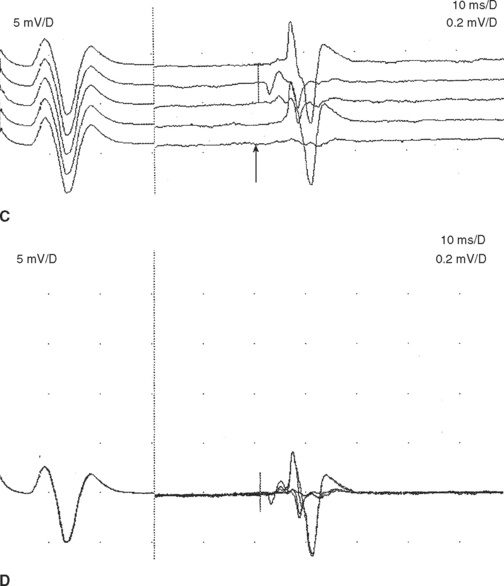
F wave latencies are prolonged in most polyneuropathies, particularly the demyelinating type, including Guillain-Barré syndrome and chronic inflammatory demyelinating polyneuropathy (CIDP) (Figure 3-1C and D). F wave latencies in radiculopathies have a limited use. They may be normal despite partial motor axonal loss because the surviving axons conduct normally, and in single radiculopathies since most muscles have multiple root innervation. Finally, focal slowing at the root level may get diluted by the relatively long motor axon.
A Wave
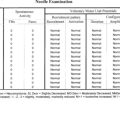
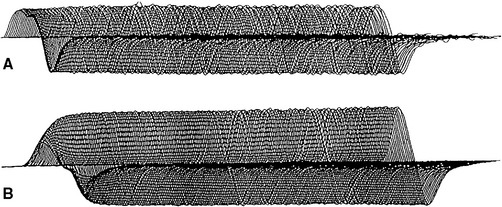
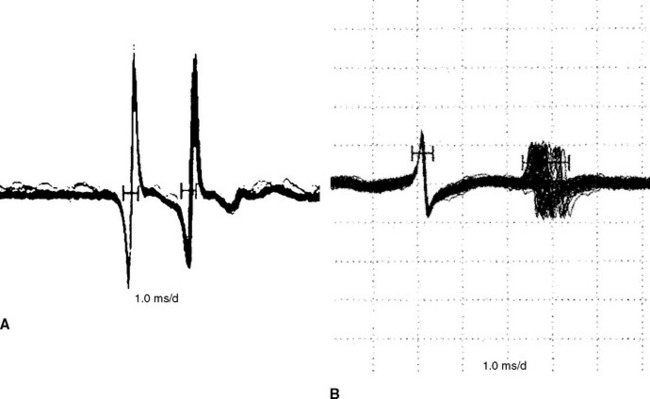
The A wave (axonal wave) is a potential that is seen occasionally during recording of F waves at supramaximal stimulation. The A wave follows the CMAP and often precedes, but occasionally follows, the F wave. The A wave may be mistakenly considered for an F response but its constant latency and morphology in at least 10 out of 20 stimulations differentiates it from the highly variable morphology and latency of the F wave (Table 3-1).
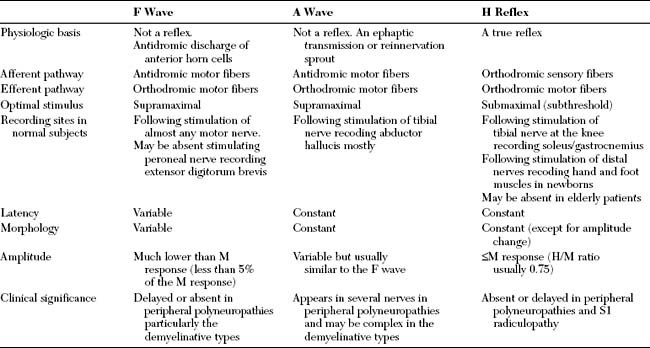
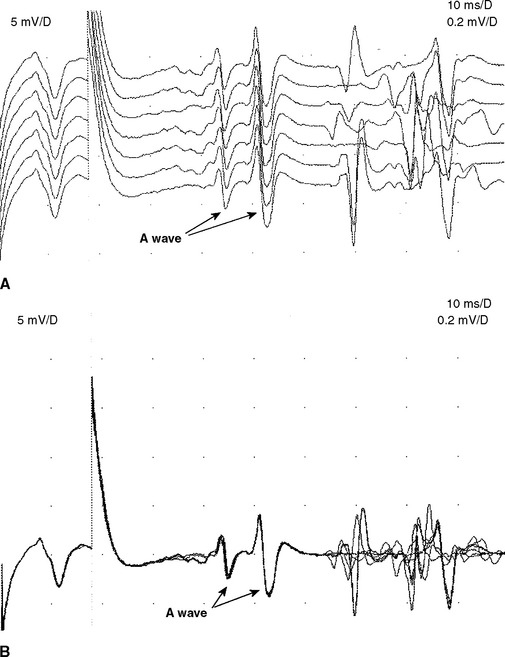
The A wave may be seen in up to 5% of asymptomatic individuals, particularly while studying the tibial nerve (Figure 3-2A and B). In contrast, recording multiple or complex A waves from several nerves is often associated with acquired or inherited demyelinating polyneuropathies (Figure 3-3). A waves are sometimes seen in axon-loss polyneuropathies, motor neuron disease, and radiculopathies. The exact pathway of the A wave is unknown but it may be generated as a result of ephaptic transmission between two axons with the action potential conducting back down the nerve fiber to the muscle. The A wave may also appear following sprouting and reinnervation along the examined nerve. The constant morphology and latency of the A wave is best explained by the fixed point of a collateral sprout or ephapse. When the A wave follows rather than precedes the F response, it suggests that the regenerating collateral fibers are conducting very slowly.
H Reflex
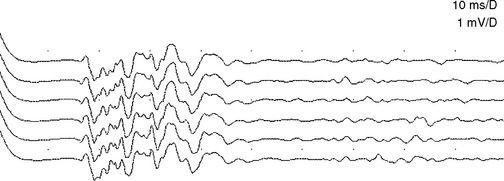
The H reflex, named after Hoffmann for his original description, is an electrical counterpart of the stretch reflex which is elicited by a mechanical tap. Group 1A sensory fibers constitute the afferent arc which monosynaptically or oligosynaptically activate the alpha motor neurons that in turn generate the efferent arc of the reflex through their motor axons. The H reflex amplitude may be occasionally as high as the M amplitude but it is often lower with the H/M amplitude ratio usually not exceeding 0.75.
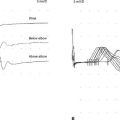
The H reflex and F wave can be distinguished by increasing stimulus intensity (see Table 3-1). The H reflex is best elicited by a long-duration stimulus which is submaximal to produce an M response, whereas the F wave requires supramaximal stimulus Also, the F wave can be elicited from any limb muscle while the H reflex is most reproducible with stimulating the tibial nerve while recording the soleus muscle which assess the integrity of the S1 arc reflex and is equivalent to the Achilles reflex (Figure 3-4). Finally, the H reflex latency (and often amplitude) is constant when elicited by the same stimulus intensity, since it reflects activation of the same motor neuron pool.
Blink Reflex
The blink reflex generally assesses the facial and trigeminal nerves and their connections within the pons and medulla. It has an afferent limb, mediated by sensory fibers of the supraorbital branch of the ophthalmic division of the trigeminal nerve, and an efferent limb mediated by motor fibers of the facial nerve and its superior motor branches.
REPETITIVE NERVE STIMULATION
Repetitive nerve stimulation (RNS) of motor or mixed nerves is performed for the evaluation of patients with suspected neuromuscular junction disorders, including myasthenia gravis, Lambert-Eaton myasthenic syndrome, botulism, and congenital myasthenic syndromes. The design and plans for RNS depends on physiologic facts inherent to the neuromuscular junction that dictate the type and frequency of stimulations utilized in the accurate diagnosis of neuromuscular junction disorders.
Physiology and Principles
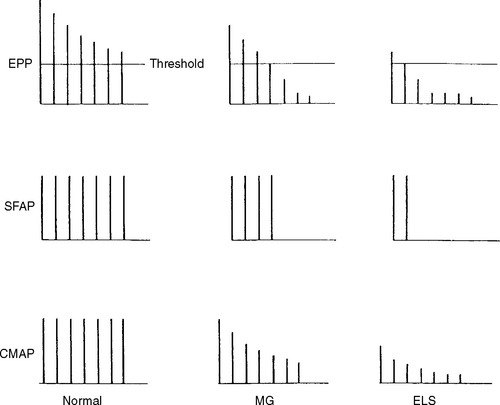
The end plate potential is the potential generated at the postsynaptic membrane following a nerve action potential. Since each vesicle released causes a 1 mV change in the postsynaptic membrane potential, this results in about 60 mV change in the amplitude of the membrane potential.
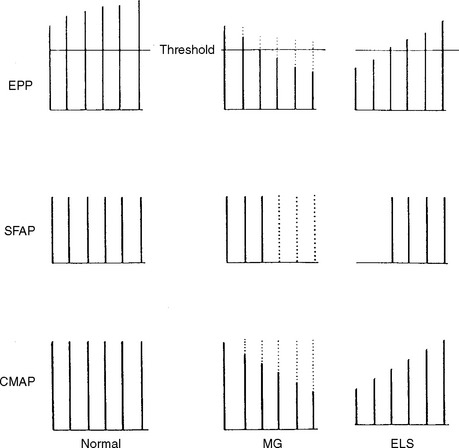
Slow Repetitive Nerve Stimulation
In normal conditions, slow RNS does not cause a CMAP decrement. Although the second to fifth endplate potentials fall in amplitude, they remain above threshold (due to the normal safety factor) and ensure generation of muscle fiber action potential with each stimulation. In addition, the secondary store begins to replace the depleted quanta after the first few seconds with a subsequent rise in the endplate potential. Hence, all muscle fibers generate muscle fiber action potentials and the CMAP does not change (Figures 3-5 and 3-6A). In postsynaptic neuromuscular junction disorders (such as myasthenia gravis), the safety factor is reduced since there are fewer available acetylcholine receptors. Hence, the baseline endplate potential is reduced but usually still above threshold. Slow RNS results in a decrease in endplate potential amplitudes at many neuromuscular junctions. As endplate potentials become subthreshold, there is a decline in the number of muscle fiber action potentials, leading to a CMAP decrement (see Figures 3-5 and 3-6B). In presynaptic disorders (such as Lambert-Eaton myasthenic syndrome), the baseline end plate potential is low, with many endplates not reaching threshold. Hence, many muscle fibers do not fire, resulting in a low baseline CMAP amplitude. With slow RNS, there is further CMAP decrement, due to the further decline of acetylcholine release with the subsequent stimuli, resulting in further loss of many endplate potentials and muscle fiber action potentials (see Figures 3-5 and 3-6A).
Rapid Repetitive Nerve Stimulation
With rapid RNS or postexercise CMAP evaluation, there are two competing forces that are acting on the nerve terminal. First, stimulation tends to deplete the pool of readily available synaptic vesicles. This depletion reduces transmitter release by reduction of the number of vesicles that are released in response to a nerve terminal action potential. Second, calcium accumulates within the nerve terminal, thereby increasing the probability of synaptic vesicle release. In a normal nerve terminal, the effect of depletion of readily available synaptic vesicles usually predominates, so that with rapid RNS, the number of vesicles released decreases. However, the endplate potential does not fall below threshold due to the safety factor. Hence, the supramaximal stimulus generate muscle fiber action potentials at all endplates and no CMAP decrement occurs (Figures 3-7 and 3-8A).
In a presynaptic disorder (such as Lambert-Eaton myasthenic syndrome), very few vesicles are released and many muscle fibers do not reach threshold, resulting in low baseline CMAP amplitude. With rapid RNS, the calcium concentrations in the nerve terminal can rise high enough to stimulate synaptic vesicle fusion for a sufficient number of synaptic vesicles to result in an endplate potential capable of action potential generation. This leads to many muscle fibers reaching threshold and firing and results in a CMAP increment (see Figures 3-7, 3-8B and 3-9). The increment is typically higher than 200% in Lambert-Eaton myasthenic syndrome, and is usually 30–100% in patients with botulism (Table 3-2).
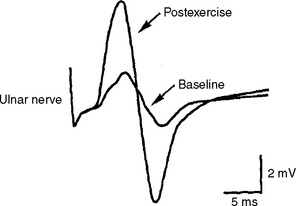
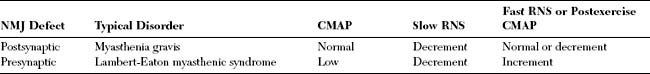
Table 3-2 Baseline Compound Muscle Action Potential (CMAP) and Repetitive Nerve Stimulation (RNS) Findings of Common Neuromuscular Junction Disorders
In a postsynaptic disorder (such as myasthenia gravis), rapid RNS causes no change of CMAP since the depleted stores are compensated by the calcium influx. In severe postsynaptic blockade (such as during myasthenic crisis), the increased quantal release cannot compensate for the marked neuromuscular block resulting in a drop in endplate potential amplitude. Hence, fewer muscle fiber action potentials are generated with an associated CMAP decrement (see Table 3-2).
SINGLE FIBER ELECTROMYOGRAPHY
Single fiber EMG is a tool in which individual muscle fiber action potentials are isolated and analyzed in vivo. There are several technical requirements for performing single fiber EMG:
Fiber Density
Fiber density is determined by the number of single fiber potentials firing almost synchronously with the initially identified single fiber potential. Increased muscle fiber clustering indicates collateral sprouting. Simultaneously firing single fiber potentials within 5 ms after the triggering single fiber unit are counted at 20–30 sites. For example, in the normal extensor digitorum communis muscle, single fibers fire without nearby discharges in 65–70% of random insertions; with only two fibers discharging in 30–35%; and with three fibers discharging in 5% or fewer. An average number of single muscle fiber potentials per recording site can be calculated. In conditions with loss of mosaic distribution of muscle fibers from a motor unit, such as reinnervation, fiber density increases.
Jitter
Jitter analysis is most useful in the assessment of neuromuscular junction disorders. The jitter represents the variability of the time interval between two muscle fiber action potentials (muscle pair) that are innervated by the same motor unit. In other words, it is the variability of the interpotential intervals between repetitively firing paired single fiber potentials (Figure 3-10). Jitter can be determined by using a commercially available computer software program. It is calculated as the mean value of consecutive interval difference, over a number of 50–100 discharges as follows:

where MCD is the mean consecutive difference, IPI 1 is the interpotential interval of the first discharge, IPI 2 of the second discharge, etc., and N is the number of discharges recorded.
The results of single fiber EMG jitter study are expressed by: (1) the mean jitter of all potential pairs, (2) the percentage of pairs with blocking, and (3) the percentage of pairs with normal jitter. Since jitter may be abnormal in 1 of 20 recorded potentials in healthy subjects, the study is considered to indicate defective neuromuscular transmission if (1) the mean jitter value exceeds the upper limit of the normal jitter value for that muscle, (2) more than 10% (more than two pairs) exhibits jitter values above the upper limit of the normal jitter, or (3) there is any neuromuscular blocking.
Jitter analysis is highly sensitive but not specific. Although it is frequently abnormal in myasthenia gravis and other neuromuscular junction disorders (see Figure 3-10), it may also be abnormal in a variety of neuromuscular disorders including motor neuron disease, neuropathies, and myopathies. Thus, the diagnostic value of jitter has to be considered in the contest of the patient’s clinical manifestations, and routine electrodiagnostic findings.
Boonyapisit K, Kaminski HJ, Ruff RL. The molecular basis of neuromuscular transmission disorders. Am J Med. 1999;106:97-113.
Fisher MA. H reflex and F waves. Fundamentals, normal and abnormal patterns. Neurol Clin N Am. 2002;20:339-360.
Katirji B, Weissman JD. The ankle jerk and the tibial H-reflex: a clinical and electrophysiological correlation. Electromyogr Clin Neurophysiol. 1994;34:331-334.
Katirji B, Kaminski HJ. Electrodiagnostic approach to the patient with suspected neuromuscular junction disorder. Neurol Clin N Am. 2002;20:557-586.
Katirji B. Electrodiagnosis of neuromuscular transmission disorders. In: Kaminski HJ, editor. Myasthenia gravis and related disorders. New York: Humana Press; 2003:149-175.
Kimura J. Clinical uses of the electrically elicited blink reflex. Adv Neurol. 1983;39:773-786.
Nishida T, Kompoliti A, Janssen I, et al. H reflex in S-1 radiculopathy: latency versus amplitude controversy revisited. Muscle Nerve. 1996;19:915-917.
Oh SJ. Electromyography: neuromuscular transmission studies. Baltimore, MD: Williams and Wilkins, 1988.
Rowen J, Meriggioli MN. Electrodiagnostic significance of supramaximally stimulated A-waves. Muscle Nerve. 2000;23:1117-1120.
Shields RWJr. Single-fiber electromyography is a sensitive indicator of axonal degeneration in diabetes. Neurology. 1987;37:1394-1397.
Stålberg E, Trontelj JV. The study of normal and abnormal neuromuscular transmission with single fibre electromyography. J Neurosci Meth. 1997;74:145-154.
Tim RW, Sanders DB. Repetitive nerve stimulation studies in the Lambert-Eaton myasthenic syndrome. Muscle Nerve. 1994;17:995-1001.