Solid Organ Transplantation
Introduction
The number of transplant candidates on waiting lists for organs continues to increase each year. The shortage of organs remains a major problem for patients with end-stage liver, renal failure and diabetes mellitus. Graft and patient survival rates following solid organ transplantation continue to improve due to refinements in surgical technique, advances in human leukocyte antigen typing for recipient/donor matching1 new and improved immunosuppressive agents2,3 refinements in national coordinated organ-sharing systems, improvements in recipient immune system desensitisation and advances in non-invasive transplant monitoring. As the number of transplant recipients grows, it is important for anyone responsible for providing imaging services to at least have a basic understanding of transplantation and its complications since there is an increasing incidence of transplant recipients presenting for emergency care to non-transplant centres. Chances for graft survival are significantly improved with timely identification of the aetiology of transplant dysfunction, allowing prompt medical and/or surgical intervention when necessary.
Renal Transplantation
Quality of life after successful renal transplantation significantly improves for patients in dialysis-dependent end-stage renal disease. Renal allograft and patient survival rates continue to improve. In the United States 1-year graft survival currently approximates 91.2% for deceased donor and 96.3% for living-donor kidney transplants.4 When screening laboratory test results indicate renal transplant dysfunction, imaging studies are often required to evaluate renal morphology and perfusion. Doppler ultrasound is an ideal tool for this purpose because it is non-invasive, readily available, and can detect and distinguish many of the vascular complications that can be the cause of transplant dysfunction. The application of Doppler ultrasound to functional problems, such as rejection or acute tubular necrosis, however, is limited.
Examination of the transplant kidney requires careful attention to scan technique and awareness of potential pitfalls. A complete sonographic examination of the renal transplant should cover the points listed in Box 10-1. The most common abnormal findings, which may be demonstrated, are listed in Box 10-2.
ULTRASOUND ANATOMY OF THE RENAL TRANSPLANT
In most cases, the isolated transplant kidney is positioned retroperitoneally in the right iliac fossa with an end-to-side anastomosis of the renal vasculature to the common or external iliac artery and vein (Fig. 10-1). If the patient has undergone a simultaneous renal–pancreas transplant, then the kidney is usually intraperitoneal within the left flank. The transplanted ureter is implanted directly into the superior surface of the bladder or to the native ureter (see Fig. 10-34A). In approximately 20% of transplants, because of variation in donor anatomy, multiple arterial or venous anastomoses may be required. Because numerous technical variations exist in the way kidneys are transplanted, it is very important that the sonologist is familiar with the surgical technique common to their institution and the specific anatomical details of the patient being scanned. If the patient’s surgical anatomy varies from standard, proper documentation and communication of the surgical record is very important in ensuring correct understanding and interpretation of imaging findings and Doppler flow profiles. Ideally, if the transplant has variant vascular anatomy, a drawing is recorded by the surgical team which shows the orientation of the kidney and its vasculature, the number and location of anastomoses, and any other atypical anatomical information.
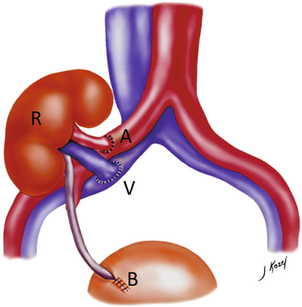
FIGURE 10-1 Artist rendering of a renal transplant (R) located in the right iliac fossa. The transplant renal artery is typically anastomosed to the common iliac artery (A). The transplant renal vein anastomosis is to the common iliac vein (V). The ureter is connected to the urinary bladder (B).
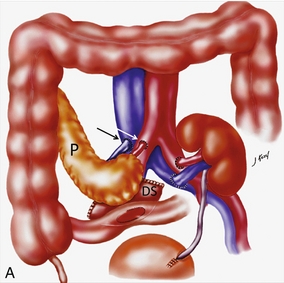
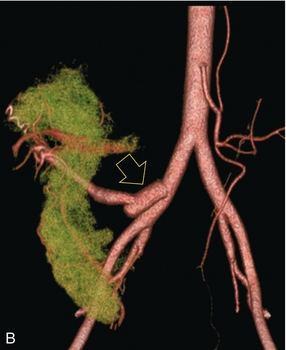
FIGURE 10-34 Artist rendering of a combined renal pancreas transplant. (A) Typically the pancreas (P) is transplanted on the right with an interposed duodenal stump (DS) between pancreas and ileum. The splenic artery and vein, which serve as the vascular pedicle for the pancreas transplant, are anastomosed to the common iliac artery and inferior vena cava. (B) With multiorgan donation harvesting of the vascular pedicle with the liver often leaves the pancreas requiring an interposition graft. This is typically accomplished with donor iliac artery. Branches are connected to the remnants of the splenic and gastroduodenal arteries, perfusing the body and the head of the pancreas respectively. Interposition jump grafts can be quite creative with the goal of establishing good perfusion to the end organ. Again, transmission of the surgical record is critical to the imager trying to understand complex surgical anatomy to the organ they are being asked to study. 3-D CTA of a pancreas transplant with an interposition graft added to establish appropriate length of the arterial conduit.
DOPPLER ULTRASOUND TECHNIQUE
Ultrasound examination of the kidney should first confirm its appropriate location and the absence of any significant fluid collections. Colour Doppler is then used to identify the renal vascular pedicle. Spectral Doppler is applied to the main renal artery, main renal vein and intrarenal segmental or intralobar branches at the mid, upper, and lower poles. If any inflow compromise is suspect to all or part of the kidney, then power Doppler can be applied to confirm uniform vascular perfusion to the organ5 (Fig. 10.2A–D).
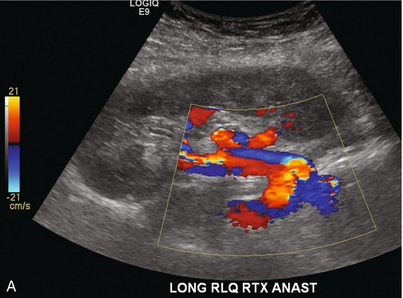
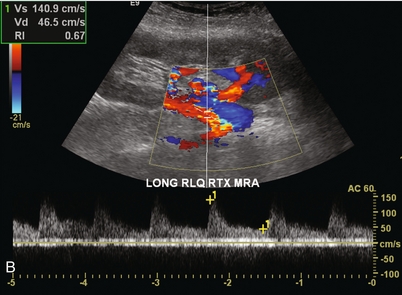
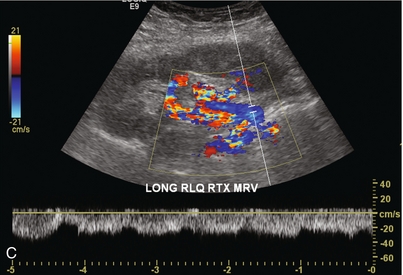
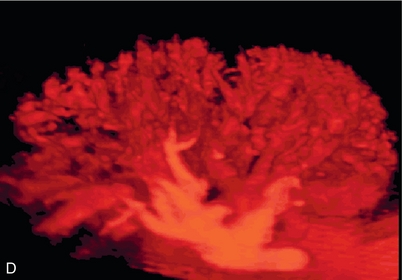
FIGURE 10-2 Longitudinal colour, spectral and power Doppler images of a normal renal transplant. (A) Colour Doppler image of the vascular pedicle reveals the anastomosis. The vessels often become curved in their course as the organ is nestled into the iliac fossa. (B) spectral Doppler tracing of the renal artery shows a brisk upstroke in systole. The resistive index is appropriate at between 60 to 70%. (C) Normally, the renal vein flow profile shows an element of cardiac periodicity. This presence of periodicity in the renal vein helps reinforce anastomotic patency. (D) 3-D rendering of a power Doppler evaluation shows uniform distribution of flow out to the capsular surface of this normal renal transplant.
Doppler Gain
The gain should be set at the highest level possible without creating noise in the image or tracing.
Optimising Angle of Insonation Relative to Vessel Orientation
To ensure proper perception of flow by colour Doppler, or accurate measurement of the spectral velocity, the angle of insonation should be less than 60ᵒ. Finding an appropriate angle can be especially problematic when examining transplanted kidneys because their vessels may be extremely tortuous and a committed search for a suitable Doppler window is required.6
Minimising Transducer Pressure
Often the imaging study is limited because intervening adipose tissue increases the distance from the patient’s skin to the transplanted kidney or there is gas in overlying bowel. By applying sufficient pressure, fat or bowel loops can be displaced. Doing so, however, will compromise the Doppler examination as the renal parenchyma also becomes compressed and inflow can be impeded (Fig. 10-3). This results in elevation of the resistive index. Thus, care must be taken not to apply excess pressure to the kidney or its associated vasculature, so that any diagnosis made on the basis of the resistive index or velocity measurement is accurate.7
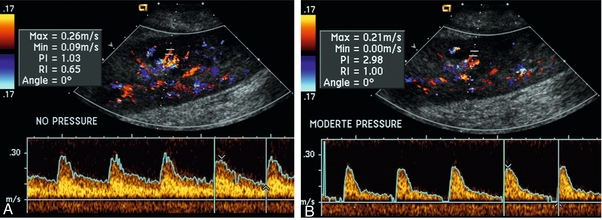
FIGURE 10-3 (A) Renal transplant interlobar artery spectral Doppler tracing acquired with gentle transducer contact. Note the normal waveform and 65% resistive index. (B) When moderate pressure is applied with the transducer, the tracing of the same artery now exhibits an elevated resistive index of 100%. Transducer pressure alone is responsible for this increase in vascular impedance and resultant elevation of resistance.
COMPLICATIONS OF RENAL TRANSPLANTATION
Functional Complications
Functional complications include hyperacute rejection, perioperative ischaemia, acute tubular necrosis, acute rejection, chronic rejection and drug toxicity (most commonly immunosuppressive agents). Imaging techniques, including ultrasound with Doppler, are limited in their ability to identify and distinguish these complications.8
Acute rejection is a cellular-mediated process, whereby the immune system attacks the foreign renal allograft. Acute rejection is controlled by the use of steroids, cyclosporine, tacrolimus, sirolimus and other immunosuppressive agents. Occasional elevation in a transplant recipient’s immune status (triggered by viral illness or non-compliance with the immunosuppressive drug regimen) can result in an acceleration of acute rejection to a critical level. The kidney becomes oedematous and swollen, intracapsular pressure rises, and eventually resistance to vascular perfusion increases (Fig. 10-4). Although early investigators proposed that resistive index elevation was useful in identifying acute rejection as the cause of kidney transplant dysfunction, subsequent laboratory and clinical studies have shown it to be unreliable, and acute rejection remains a pathological diagnosis. Indeed, in a canine study it has been found that resistive index actually decreases in the mild to moderate stages of acute rejection.9 During the early to mid-stages of rejection, the physical effects of increased intrarenal pressure are counteracted by intrarenal hormonal autoregulatory mechanisms. Elevation of resistive index, therefore, does not manifest until the process of acute rejection is quite severe.9 If a scan being performed in anticipation of transplant biopsy identifies the kidney to be oedematous and swollen with loss of central sinus fat echo and very high resistive indices, thought should be given to deferring the biopsy. Puncturing the capsule of a tense rejecting kidney may cause it to rupture.
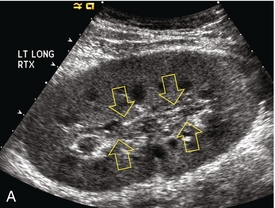
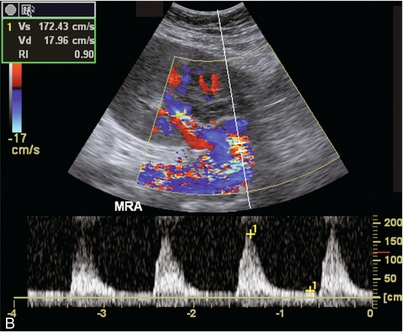
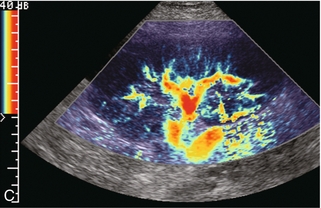
FIGURE 10-4 (A) Longitudinal grey scale image of a transplanted kidney. Note the rounded globular configuration of the kidney. The central hilar space (arrows) is compressed due to oedema and swelling; and the central hilar fat has been displaced. (B) Spectral Doppler tracing at the main renal artery level shows a resistive index of 90%. Biopsy confirmed severe acute rejection. (C) Power Doppler image of a severely rejecting renal transplant shows the main central vasculature and a few interlobar vessels but no flow can be seen out to the periphery. The high resistance generated by the rejection process results in this colour Doppler ‘pruned tree’ appearance. Contrast this to the appearance of normal renal power Doppler flow in Figure 10-2D.
Resistive index is rarely affected in the mild to moderate stages of acute rejection and when it is, its specificity is low. It is not until acute rejection progresses to severe levels that the resistive index becomes consistently elevated. Elevation of resistive index, however, can also occur from many other causes such as hydronephrosis, acute tubular necrosis, infection and compression of the kidney by an adjacent mass or fluid collection. Thus, specificity for the diagnosis of acute rejection by Doppler ultrasound is unacceptably low and renal biopsy is still needed to establish the diagnosis.9,10
Chronic rejection is a multifactorial process, mostly antibody-mediated, but the pathophysiology is not entirely understood. Doppler indices rarely show any significant alteration in flow profiles with chronic rejection.11
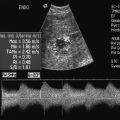
Perioperative ischaemia can result in transient compromise of renal function, particularly at the level of the distal tubules which are most sensitive to hypoxia. This condition is self-limiting and typically resolves within 1–2 weeks of transplantation. The medullary pyramids are oedematous and therefore appear enlarged and hypoechoic, and spectral Doppler shows an increase in the resistive index. Although the imaging and Doppler findings may suggest acute tubular necrosis, specificity is low9 (Fig. 10-5).
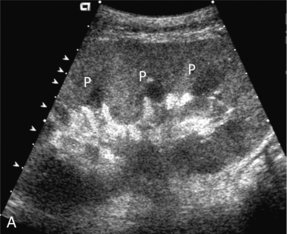
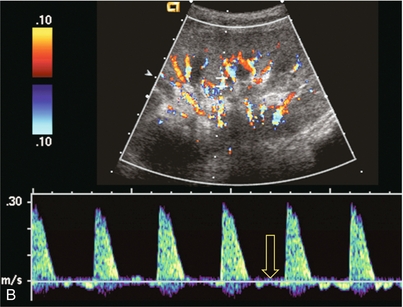
FIGURE 10-5 (A) Longitudinal grey scale image obtained with 24 hours of implantation. This deceased donor organ experienced prolonged ischaemic time. Note that the kidney has an appropriate contour and the sinus fat is preserved. The medullary pyramids (P), however, are prominent, hypoechoic and oedematous. (B) Spectral and colour Doppler image of the same kidney. The resistive index approximates 100%. This combination of findings in the appropriate clinical situation is consistent with acute tubular necrosis. This is common immediately after transplantation but can also be seen with drug toxicity.
Anatomic Complications
These include haematomas, seromas, urinomas, abscesses, lymphoceles, obstructive hydronephrosis, focal masses, arterial and venous stenosis or thrombosis, and intrarenal arteriovenous fistula and pseudoaneurysm.12,13 Unlike functional complications, most anatomic complications are readily identified by ultrasound.
Perinephric fluid is a common sequela of renal transplantation and is not considered significant if it is crescentic in shape, and decreases in size over time. Most fluid collections are haematomas or seromas, which weep from tissue around the transplant. Urinomas are relatively uncommon and usually are the result of breakdown at the ureteral anastomosis to the bladder. Doppler examination is of limited value in these cases. High-pressure collections, such as haematoma after biopsy or organ rupture may exert mass effect upon the kidney and locally affect haemodynamics. In this case, Doppler may reveal a high-resistance spectral tracing adjacent to the fluid pocket (Fig. 10-6).
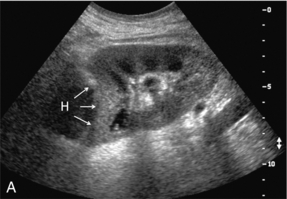
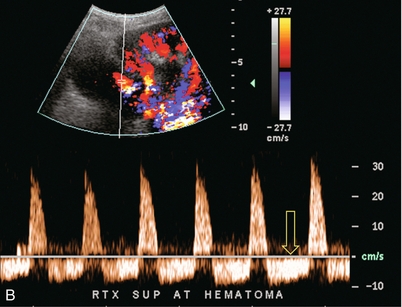
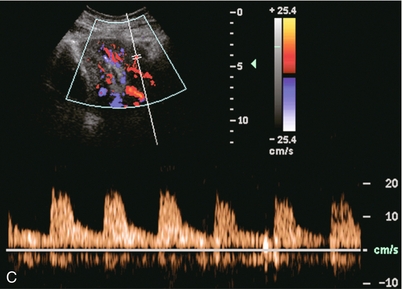
FIGURE 10-6 (A) Longitudinal grey scale image of a renal transplant within 24 hours of an upper pole biopsy. The biopsy was complicated by haemorrhage (H). Blood accumulated in the subcapsular space and severely compressed the upper pole of this kidney (arrows). (B) Spectral Doppler tracing obtained of an interlobar artery just adjacent to the high-pressure haematoma reveals extremely high resistive index with reverse flow in diastole. (C) Spectral Doppler tracing at the opposite (lower pole) of this same kidney shows a normal low resistance flow profile. The compressive haematoma exerts local mass effect and elevates resistance to flow.
Lymphoceles usually manifest at about 6–8 weeks postoperatively and are seen as rounded, lobulated collections near the vascular anastomoses. They are the result of surgical disruption of iliac lymphatic channels when the vascular anastomosis to the transplanted kidney is created. An expanding lymphocele may cause ureteric compression and hydronephrosis. If a lymphocele becomes large enough, it may compress or kink the renal vascular pedicle. In this situation, Doppler examination may show findings similar to arterial or venous stenosis14 (Fig. 10-7).
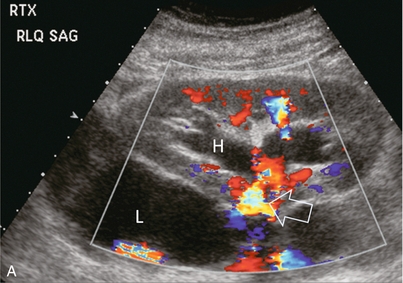
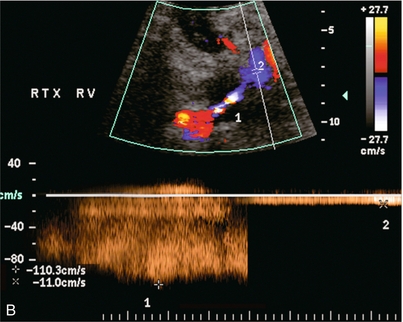
FIGURE 10-7 (A) Longitudinal colour Doppler image of this renal transplant shows a large fluid collection medial to the kidney, surrounding the renal vascular pedicle. This is a lymphocele (L) and it has caused distortion of the pedicle. Colour aliasing can be seen in the renal artery (arrow). There is also obvious hydronephrosis (H) caused by compression of the ureter. (B) Spectral Doppler tracing of the renal vein shows marked compression where it courses past the lymphocele (#1), the measured velocity at this area is 1.1 m/s; whereas within the kidney (proximal to the lymphocele (#2)) the velocity is only 0.1 m/s. This 10-fold velocity gradient identifies this as a significant renal venous outflow obstruction.
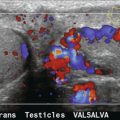
Intraperitoneal renal transplantation typically when combined with pancreas transplantation results in a mobile kidney. Occasionally ptosis or rotation and torsion of the kidney may occur along its vascular pedicle. This may result in arterial inflow and venous outflow narrowing or obstruction15 (Fig. 10-8).
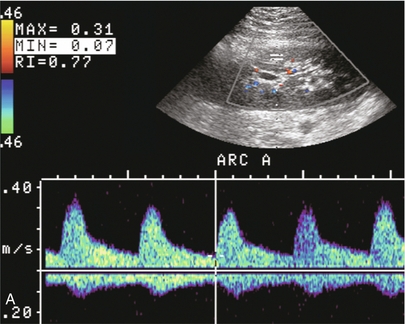
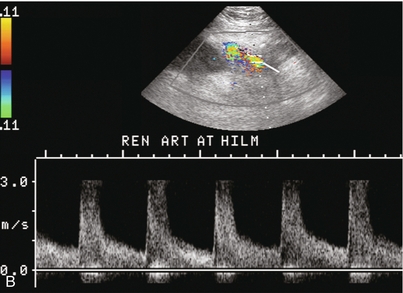
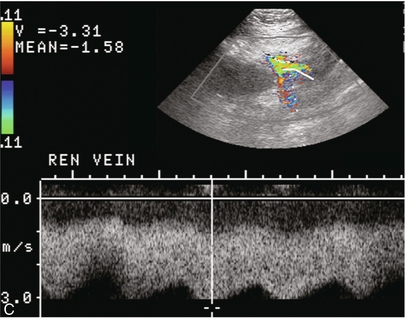
FIGURE 10-8 (A) Colour Doppler image along the long axis of an intraperitoneal renal transplant with a spectral Doppler tracing of an arcuate artery. The waveform shows a tardus parvus configuration indicating arterial inflow compromise. (B) Doppler of the main renal artery at the hilum reveals a high-velocity jet approximating 3 m/s. (C) Immediately adjacent to the main renal artery, the main renal vein tracing also shows turbulent high-velocity flow. This finding of high-velocity, turbulent Doppler tracings in both artery and vein identifies partial torsion of the renal vascular pedicle with a twisting compromise of the main artery and vein. Fortuitously this was only partial torsion of the kidney and was corrected with surgical detorsion and nephropexy. Torsion of an intraperitoneal transplant kidney has been reported to result in infarction.
Transient dilatation of the collecting system as a result of ureteral anastomotic oedema frequently occurs immediately after renal transplantation or removal of the ureteral stent. The presence of a dilated transplant collecting system does not automatically signify an obstructed system under pressure, as the denervated, flaccid collecting system can become markedly dilated, particularly when the urinary bladder is distended. Platt et al.16 proposed that the identification of an elevated resistive index was useful in distinguishing obstructive hydronephrosis from chronic, low-pressure dilatation of the transplant collecting system. Although this observation may be sensitive, its specificity is very poor because of the many other factors that similarly affect renal haemodynamics. Nuclear scintigraphy or the Whitaker test are more specific for differentiating high-pressure obstructive hydronephrosis from low-pressure distention of a flaccid renal transplant collecting system.
The transplanted ureter is normally anastomosed to the superior surface of the bladder. Occasionally, colour Doppler can identify the ureteral jet from the transplanted ureter. The posteriorly directed flow of urine may initially confuse the unexperienced examiner (Fig. 10-9).
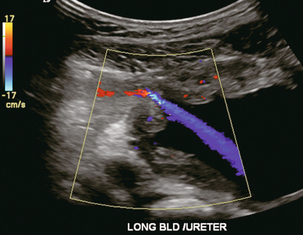
FIGURE 10-9 Colour Doppler image of the urinary bladder. The transplanted ureter is normally anastomosed to the anterior superior bladder wall. Flow of urine is seen through the anastomosis manifesting as a jet, but pointing posteriorly; not in the direction we are accustomed to seeing ureteral jets.
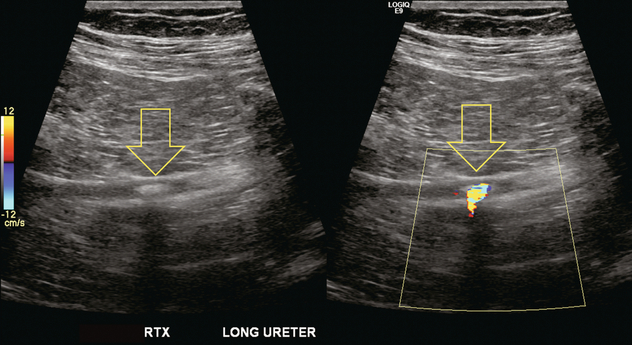
Although uncommon, urinary tract calcifications can develop within a transplant kidney. When evaluating a renal transplant with hydronephrosis, the dilated ureter should be followed toward the anastomosis. If intraluminal debris is identified. The application of colour Doppler may reveal twinkle artifact. This helps identify the abnormality as a calculus (Fig. 10-10).
Vascular Complications
Following renal transplantation, vascular complications are observed in less than 10% of recipients; however, when present, they are associated with a high morbidity and mortality. Complications include renal artery or vein stenosis, compression, kink, thrombosis, intrarenal arteriovenous fistula and pseudoaneurysm. If identified promptly, they can often be successfully repaired prior to transplant failure. Doppler sonography is a very effective, non-invasive tool for identifying significant vascular complications.17–19
Renal Transplant Artery Stenosis
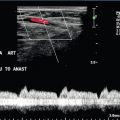
This is most often observed within 1–2 cm of the anastomosis, usually as a result of vessel wall ischaemia due to disruption of the vasa vasorum within the artery wall. Stenosis should be suspected if a tardus parvus waveform and relatively low-resistance flow are noted in the intrarenal branches. A tardus parvus waveform is characterised by a delayed upstroke in systole (prolonged acceleration time > 0.07 s), rounding of the systolic peak and obliteration of the early systolic notch. A flow velocity approximating 2 m/s with associated distal turbulence near the renal artery anastomosis is diagnostic of renal artery stenosis (Fig. 10-11). If an intrarenal tardus parvus waveform is observed, but a stenosis cannot be identified at the level of the renal artery anastomosis, the examiner should conduct a thorough examination from the renal hilum through the iliac artery in search of inflow compromise (Fig. 10-12). With severe renal artery stenosis the intra-arterial waveforms become flattened to the point that systolic diastolic velocity variation becomes difficult to perceive. Subtle pulsatile flow is enough to document the patency of the artery and avoid misdiagnosis of thrombosis. This is further reinforced by identifying outflow in the renal vein (Fig. 10-13).
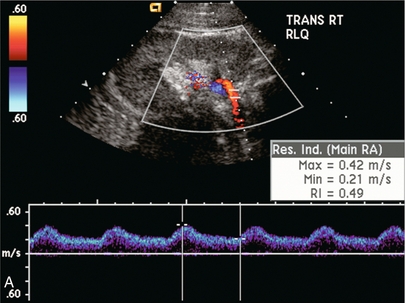
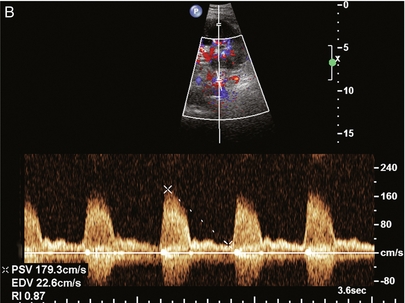
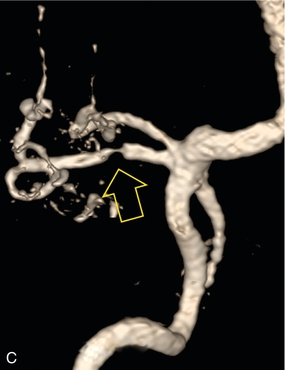
FIGURE 10-11 (A) Renal transplant Doppler tracing in a hypertensive recipient with elevated serum creatinine. The renal arterial waveform manifests tardus parvus configuration with a slow systolic upstroke, and a rounded systolic peak with low resistance. These findings suggest a more proximal stenosis. (B) Spectral Doppler tracing closer to the anastomosis of the main renal artery to the iliac artery. Note the high-velocity (1.79 m/s), turbulent flow characteristic of renal artery stenosis. (C) MR angiogram of this transplanted kidney actually revealed a double arterial anastomosis. The lower pole artery has a high-grade stenosis (arrow) within 1 cm of its anastomosis.
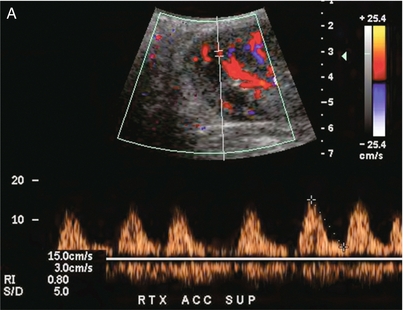
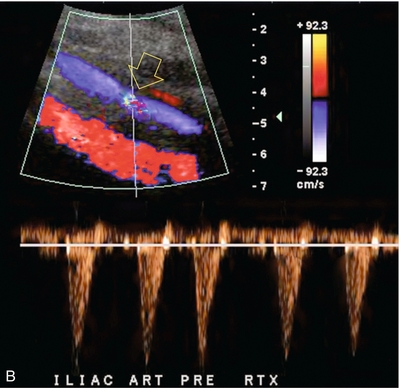
FIGURE 10-12 (A) Spectral Doppler tracing of a transplant main renal artery. Tardus parvus changes were identified but an anastomotic stenosis could not be identified. (B) The exam was extended to include a spectral Doppler tracing of the external iliac artery. A high-velocity jet is identified with velocities of > 3 m/s. An atheromatous lesion in the right iliac artery in this diabetic recipient was responsible for the inflow compromise to the renal transplant.
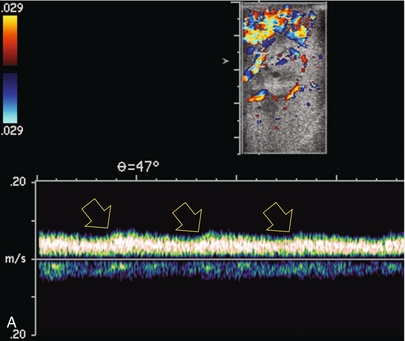
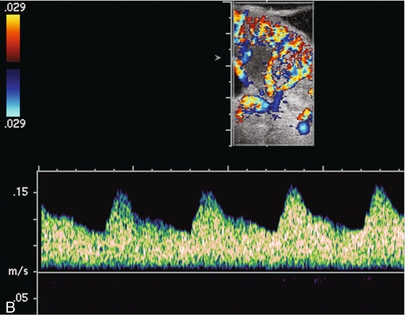
FIGURE 10-13 Intraoperative spectral and colour Doppler ultrasound of a recent renal transplant recipient being reoperated because of poor renal function. Preoperative Doppler examination suggested arterial stenosis. (A) Direct contact scanning on the kidney showed an abnormal spectral Doppler tracing of a segmental artery with only a very subtle undulation in the arterial waveform (towards the transducer). A high-grade proximal inflow compromise wiped out the expected systolic/diastolic arterial velocity variation. (The tracing below the baseline is an adjacent vein.) (B) A kink of the vascular pedicle was identified and as the artery was surgically manipulated the spectral Doppler tracing suddenly normalised.
A long-standing undiagnosed stenosis can develop post-stenotic dilatation. Imaging and colour Doppler reveal a characteristic focal area of expansion of the artery. This usually incorporates the high-velocity post-stenotic jet (Fig. 10-14).
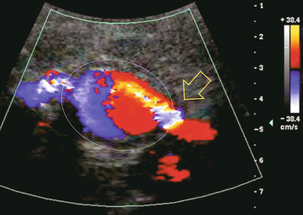
FIGURE 10-14 Colour Doppler image along the long axis of the main renal artery. A focal area of stenosis with a high-velocity jet presents as focal turbulence and aliasing. Sacular dilatation of the transplant artery represents a post-stenotic aneurysm and reveals a swirling flow pattern. Flow continues on towards the kidney in the more distal normal-calibre artery.
Approximately 20% of transplanted kidneys require more than one arterial anastomosis due to the presence of accessory arteries. If one of these vessels becomes compromised, then perfusion to the subtended segment of the kidney is decreased. Again, a tardus parvus waveform is seen, this time limited to the segment perfused by the affected artery. If thrombosis of this artery occurs, then the subtended area shows no flow on colour or power Doppler and an arterial tracing will not be identified by spectral Doppler. The area affected will vary depending on the anatomic vascular distribution (Fig. 10-15).
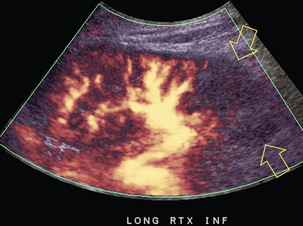
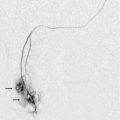
FIGURE 10-15 Longitudinal power Doppler image of the lower pole of a renal transplant recipient with hypertension. There is complete absence of flow at the lower pole. This renal transplant required two arterial anastomoses. Thrombosis of the lower pole artery was suggested and confirmed at angiography.
Renal parenchymal scarring secondary to chronic rejection may result in focal stenosis within branch arteries. This should be suspected if there is irregular distribution of flow on colour Doppler through the kidney. Segmental or interlobar renal artery stenosis can be confirmed by the presence of intrarenal high-velocity flow. Because these lesions are typically multiple and distal, treatment options are limited.20
Renal Transplant Artery Thrombosis
Severe acute rejection may cause microvascular thrombosis. Colour and power Doppler will show no flow within the kidney. Flow may still be present in the segmental or interlobar branches, but spectral Doppler shows very high resistance because the flow has nowhere to go (Fig. 10-16). It may be difficult to differentiate the two aetiologies, but the non-rejecting kidney with arterial thrombosis is typically not as swollen and oedematous as the acutely rejecting thrombosed kidney that is congested with inflammation.21
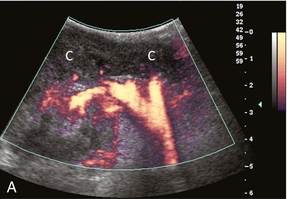
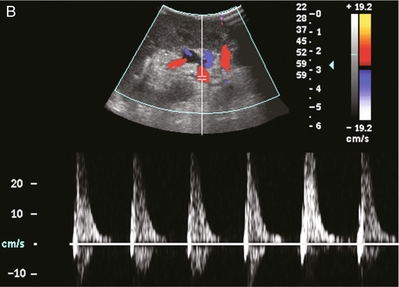
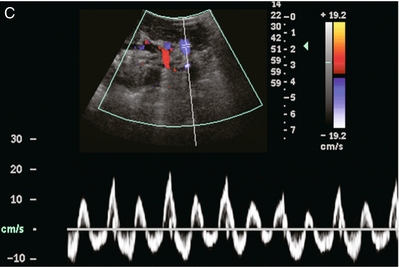
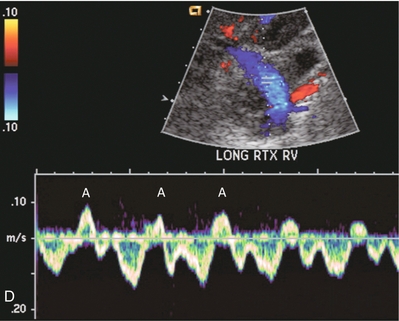
FIGURE 10-16 Longitudinal power, colour and spectral Doppler imaging of a renal transplant recipient with rapidly rising creatinine levels. (A) Power Doppler image shows central flow within the hilum of the kidney, but no flow within the renal parenchyma. (B) Spectral Doppler tracing of the artery shows a brisk spike in systole but no flow during diastole. (C) The renal vein spectral Doppler waveform has a to-and-fro pattern. When comparing relative flow above and below the baseline, it becomes evident that they are relatively equivalent and there is little antegrade flow. Due to renal microvascular thrombosis, the flow within the vein is stagnant, only moving to-and-fro in response to venous pressure changes transmitted from the right atrium. Contrast this to a tracing of a normal renal vein. (D) The retrograde component of flow known as the A-wave (A) occurs during atrial systole. But this component is relatively small in comparison to the flow below the baseline that is returning toward the heart.
Renal Transplant Vein Stenosis
Renal vein stenosis is an uncommon complication following kidney transplantation, but when present, it is a significant cause of graft dysfunction (Figs 10-17 and 10-7B). Venous stenosis may be seen as a focal narrowing with associated dilatation of the proximal vein. However, to confirm the diagnosis of a significant stenosis, there should be at least a four-fold velocity gradient across the lesion. If the gradient is less than four-fold, it is usually not clinically significant, even though it may have a dramatic appearance on the Doppler images.22
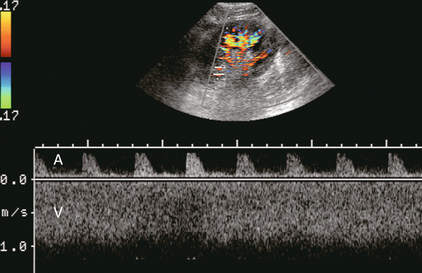
FIGURE 10-17 Spectral Doppler tracing of the renal vascular pedicle incorporating both the main renal artery (above the baseline) and main renal vein (below). Note the high velocity in the vein approximating 1 m/s. Note the corresponding high-resistance arterial waveform. Renal vein stenosis due to scarring was identified at surgery.
Renal Transplant Vein Thrombosis
Renal transplant vein thrombosis is also a relatively rare post-transplantation complication. It typically presents within the first week following surgery. It is more likely to occur when there is technical difficulty with the venous anastomosis. It may occur with preservation injury, or it may evolve during an episode of severe acute allograft rejection. Extremely high resistance (resistive index typically greater than 100%) will be seen on the renal arterial waveforms with spectral Doppler. In most cases, thrombosis results in partial rather than complete occlusion of the vein and some renal venous outflow can be detected with spectral Doppler. To prevent a false-negative diagnosis, it is important that the examiner conduct a careful imaging and colour Doppler evaluation of the vein when arterial resistance greater than 100% is observed23,24 (Fig. 10-18).
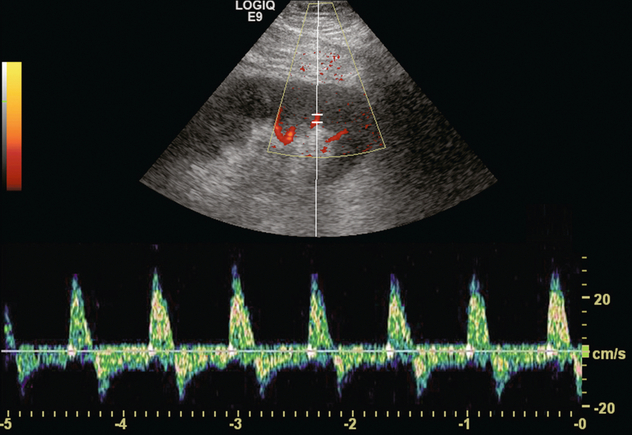
FIGURE 10-18 Spectral Doppler tracing of the main renal transplant artery in a recent recipient with a rapidly rising creatinine. The arterial waveform reveals to-and-fro flow with a large retrograde component. The resistive index measures approximately 140%. No flow could be identified by spectral or colour Doppler in the renal veins. Complete venous thrombosis was confirmed at angiography.
Intrarenal Arteriovenous Fistulae and Pseudoaneurysms
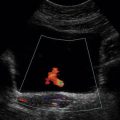
These are typically the result of renal transplant biopsy. The true incidence of these complications varies from centre to centre depending on biopsy technique (operator experience). Arteriovenous fistulae manifest as a flash of colour, or ‘visible thrill’, in the adjacent parenchyma when the kidney is examined at normal colour Doppler settings. This phenomenon is caused by vibration of the surrounding tissues due to the rapidly flowing blood through the fistula. It is often possible to distinguish the feeding artery and the enlarged draining vein by adjusting the colour Doppler to higher velocity settings. Spectral Doppler tracings will demonstrate a high-velocity, low-resistance flow within the feeding artery. Turbulent, pulsatile (arterialised) flow will be present in the draining segmental vein. If the arteriovenous fistula is large enough, it may be possible to observe pulsatile flow within the main renal vein (Fig. 10-19).
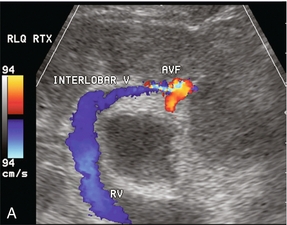
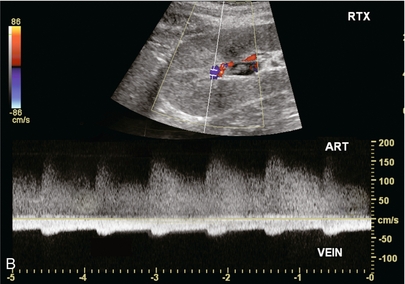
FIGURE 10-19 (A) Colour Doppler image of a renal transplant approximately 2 weeks after biopsy. A focus of increased flow is present in the mid-kidney which is drained by a large vein with robust flow. (B) Spectral Doppler tracing obtained at the biopsy site reveals turbulent, high-velocity low-resistance arterial waveform; and arterialisation of the venous outflow. This is characteristic of an arteriovenous fistula.
Pseudoaneurysms are typically the result of a biopsy that captured partial thickness of an arterial wall. Therefore, they are extremely rare. On imaging they usually appear as a pulsating cyst, or a rounded collection of paravascular fluid. Colour Doppler, however, immediately reveals that the ‘cyst’ is not simple (Fig. 10-20). Spectral Doppler tracings show to-and-fro blood flow at the neck of the pseudoaneurysm and a distorted, turbulent, pulsatile waveform can be observed within the pseudoaneurysm. The majority of intrarenal arteriovenous fistulae and pseudoaneurysms resolve spontaneously, but if they increase in size over a period of time, angiographic embolisation may be necessary. They may steal so much flow as to lead to renal transplant ischaemia.22
Liver Transplantation
Liver transplant outcomes analysis shows continued improvement in survival rates. As of 2011, in the US, 62,500 liver transplant recipients were living with a functioning graft.4 Graft function and survival is enhanced by prompt identification of structural or functional abnormalities by timely imaging and rapid intervention when appropriate.25
PREOPERATIVE ASSESSMENT
Preoperative assessment of a potential transplant candidate consists of confirmation of vascular patency, mapping native vascular anatomy, quantification of diseased liver volume, identification of vascular collaterals secondary to portal hypertension and a search for intra- or extrahepatic malignancy. There are many ways to accomplish this including angiography and ultrasound, but currently CT angiography is the favoured method for the adult. Some centres rely on Doppler and magnetic resonance imaging (MRI), especially for the paediatric candidate.26 A complete sonographic examination of the liver transplant candidate should cover the points listed in Box 10-3.
POSTOPERATIVE ASSESSMENT
A complete sonographic examination of the liver transplant recipient should cover the points listed in Box 10-4. Evaluation of the newly transplanted liver requires a precise understanding of the surgical anatomy. Many variations are possible including segmental or reduced-size transplantation, especially in the paediatric population.27,28 Variations of the arterial anastomoses are necessary when the donor hepatic arterial anatomy is anomalous. Variations of venous anastomoses are necessary when the recipient portal vein is thrombosed. The sonologist must be aware of any variations in surgical anatomy so that a thrombosed accessory hepatic artery or a stenotic jump graft is not overlooked (Fig. 10-21). This is especially important in living related transplants.29
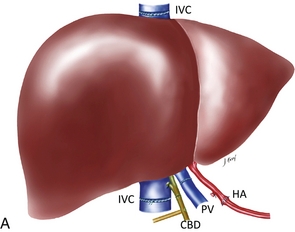
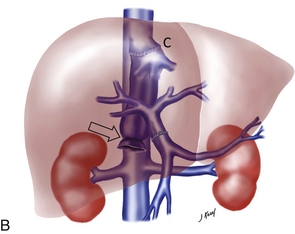
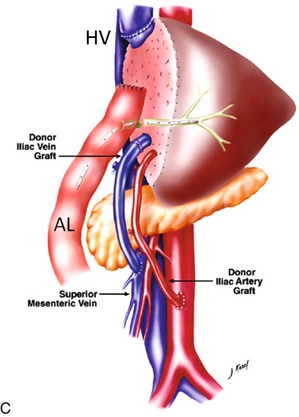
FIGURE 10-21 Three artist renderings of liver transplant variants. (A) An in-line liver transplant has a total of five anastomoses. In the porta hepatis, there are anastomoses of the hepatic artery (HA), portal vein (PV), and bile duct (CBD). The recipient inferior vena cava is resected with the explant liver. The donor inferior vena cava is implanted in-line with an upper and lower IVC anastomosis (IVC). (B) The piggyback technique requires the same three anastomoses in the porta hepatis. The recipient inferior vena cava remains in place. The explant native liver is stripped off of the inferior vena cava. The donor liver is then placed over and hooked up to the recipient inferior vena cava via a cloaca (C) formed from the recipient hepatic vein ostia. The lower end of the donor cava is ligated (arrow) effectively turning it into an accessory hepatic vein. (C) The reduced or donor liver transplant has the most complicated anatomy. The hepatic artery and portal vein frequently require a jump graft (JGs) (an interposed length of donor vasculature). The biliary system is often drained via an afferent loop (AL) of bowel. The hepatic vein draining the transplanted segment is anastomosed to the inferior vena cava usually via a donor hepatic vein (HV).
The liver transplant ultrasound examination should include a general survey of the abdomen and pelvis in order to identify and quantify any haematomas or fluid collections. The liver parenchyma is then examined to rule out any focal abnormality, specifically any fluid collection, area of infarction or possible neoplasm. The biliary system should be evaluated to rule out obstruction or sludge accumulation, especially in a patient with hepatic artery thrombosis. The intra- and extrahepatic arteries are checked to confirm patency and the waveforms are analysed to rule out stenosis. Patency of the portal vein is confirmed and the Doppler waveform analysed, particularly across the anastomosis (Fig. 10-22). Patency of the three hepatic veins is confirmed and their waveforms are evaluated. Finally, the IVC is checked with special attention to the upper anastomosis (Fig. 10-23).
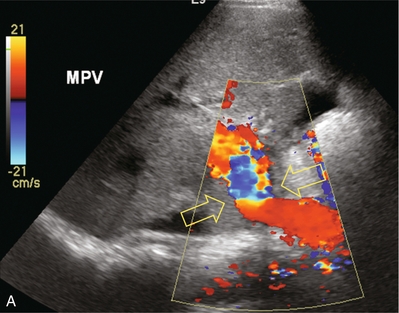
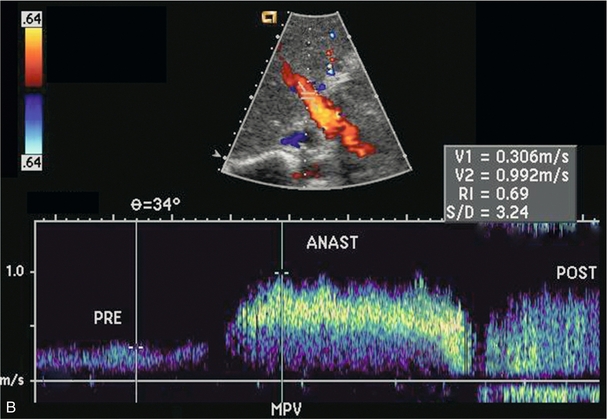
FIGURE 10-22 Colour Doppler image of the porta hepatis (A). The anastomosis between donor and recipient portal vein is evident by the angulation and subtle change in calibre which cause the focal aliasing at that level (arrows). Spectral Doppler tracing (B) across the anastomosis and on either side reveals the velocity changes are relatively insignificant (less than fourfold).
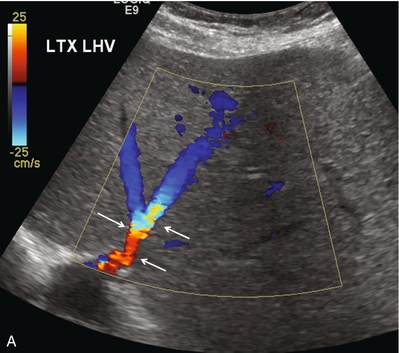
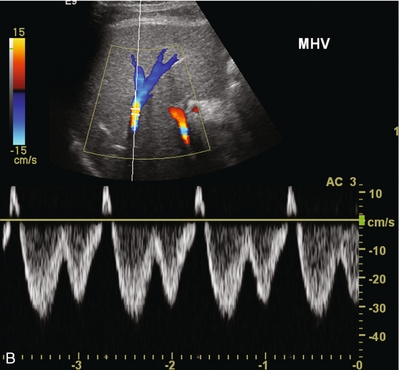
FIGURE 10-23 Longitudinal colour Doppler image of the left hepatic vein as it approaches the IVC anastomosis (A). This vein is patent with flow in the appropriate direction. Aliasing however is evident as the veins narrow near the anastomosis (arrows). Spectral Doppler tracing of the same patient’s middle hepatic vein (B) reveals normal cardiac periodicity transmitting into the liver. Since this waveform must propagate against the direction of flow, its presence within the liver effectively rules out significant hepatic venous outflow obstruction, specifically the caval anastomosis is appropriately patent.
ABNORMAL FINDINGS
The most common abnormal findings encountered in liver transplantation are listed in Box 10-5.
Doppler findings of hepatic artery inflow compromise include an intrahepatic tardus parvus waveform (slow upstroke and low-resistance flow) and a high-velocity jet with turbulence just beyond the point of stenosis or kink. A focal high-velocity jet in the hepatic artery in excess of 200 cm/s or greater than three times the velocity in the prestenotic hepatic artery indicates clinically significant stenosis. The identification of an intrahepatic tardus parvus waveform with low resistance flow (< 60% RI), a prolonged upstroke in systole (> 0.08 s) and rounding of the systolic peak, should force a careful survey along the anticipated course of the hepatic artery for a high-velocity jet (Fig. 10-24). It has been shown that searching for the tardus parvus waveform pattern is highly predictive for hepatic artery inflow compromise.30 In the paediatric population, the finding of hepatic arterial resistive index < 60% is highly predictive of impending hepatic artery thrombosis due to stenosis.31 Although an intrahepatic arterial tracing may be demonstrated, it should be remembered that a severe stenosis may still lead to biliary ischaemia, or may progress to complete thrombosis.
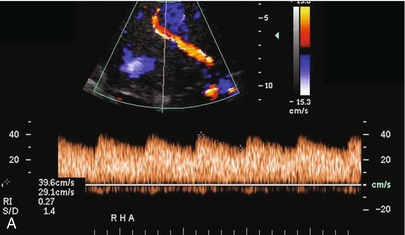
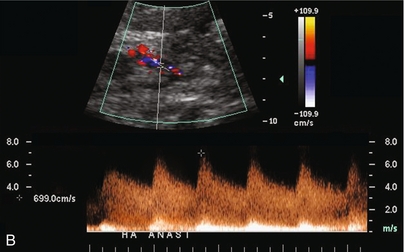
FIGURE 10-24 (A) Colour and spectral Doppler tracing of an intrahepatic arterial flow profile. Tardus parvus pattern with a delayed upstroke in systole, rounded systolic curve and relatively low-resistance flow (0.27) is indicative of insufficient hepatic arterial inflow and suggests stenosis. The examiner should carefully walk the sample volume down the hepatic artery and out of the liver looking for the anticipated point of stenosis. (B) In this case a high-velocity jet measuring almost 7 m/s is identified at the point of stenosis in the subhepatic space.
Absence of an arterial signal in the porta hepatis on spectral and colour Doppler ultrasound should lead one to suspect hepatic artery thrombosis. Since this is a diagnosis based on the absence of the arterial Doppler tracing, great care must be taken to ensure proper Doppler settings. Scanning by a second experienced sonologist is encouraged, since this ultrasound diagnosis usually requires arteriography. Use of ultrasound echo-enhancing agents if available is encouraged to better define a weak arterial signal and hopefully decrease the rate of false-positive diagnosis of hepatic artery thrombosis, thereby reducing the frequency of arteriography.32,33
Early hepatic artery thrombosis (eHAT), defined as occurring within a week of transplantation, has an incidence of 4.4%. It is a major cause of graft loss (53.1%) and mortality (33.3%) in the early postoperative period. The incidence of eHAT is significantly higher in children (8.3%) than in adults (2.9%).34,35
Studies of patients with hepatic artery stenosis and thrombosis have identified certain factors that place patients at a higher risk and warrant more frequent Doppler screening. These factors include bench reconstruction of anatomical variants, the use of an interposition graft, and retransplantation.36
Within the first few days of transplantation, the hepatic artery tracing often shows a relatively high-resistance waveform. This is a common manifestation of ischaemic reperfusion injury (the anoxia and traumatic insult sustained by the liver during recovery, handling, preservation and surgery). It has been shown to be more common with older donor age and more prolonged ischaemic time37 (Fig. 10-25). The high resistance is due to vasospasm and can be reversed with provocative testing with vasodilatory agents such as nifedipine. One must be cautious, however, to ensure that the transplant recipient is stable enough to tolerate this drug as a diagnostic challenge since it causes a systemic drop in blood pressure. Augmenting the Doppler exam with this challenge, however, may obviate the need for an arteriogram if hepatic arterial inflow is compromised to the point where it appears to be occluded (Fig. 10-26). The spasm typically resolves within a few days of transplantation and resistance returns to a normal range.38 A delayed finding of high resistance, beyond 3–5 days, is a poor prognostic indicator and some of these patients will develop arterial thrombosis.39 The exact cause of thrombosis is not always apparent and in numerous cases is presumed to be secondary to immunological causes and rejection.
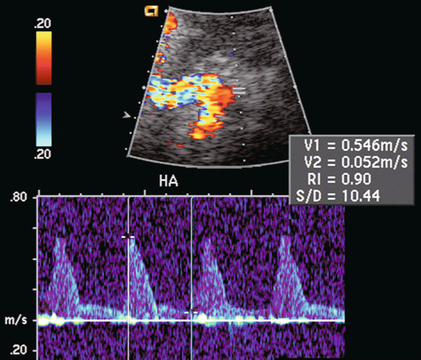
FIGURE 10-25 Spectral Doppler tracing of the hepatic artery on day one after liver transplantation shows a very high-resistance waveform with sharp spikes in systole and very little flow during diastole. Finding high resistance in the hepatic artery soon after surgery is common. It is secondary to ischaemic injury related to the surgical procedure. Rarely does this progress to thrombosis, but more often evolves into a normal-resistance waveform as the oedema and vasospasm subsides.
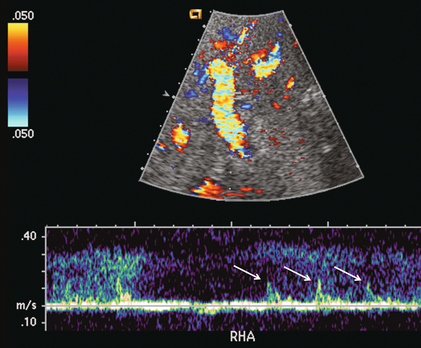
FIGURE 10-26 Spectral Doppler tracing of the porta hepatis on the first postoperative day. The hepatic artery was extremely difficult to identify (arrows). Because of the thready, high-resistance flow due to severe vasospasm this patient should be monitored closely. Ultrasound contrast or a provocative test with vasodilating agents could be considered to more confidently confirm arterial patency.
At the time of implantation, there must be sufficient length of all of the vasculature to create the anastomoses. A longer pedicle is easier to work with, however, if the vessels are too long a kink may occur as the liver is placed into the subdiaphragmatic fossa and the abdominal wall is closed. Clinically the patient presents with liver dysfunction. A stenosis may be suspect on spectral Doppler. Colour or power Doppler may reveal the tortuosity. Three-dimensional CT angiography provides ‘the big picture’ and suggests if a stent or reoperation is the best treatment (Fig. 10-27).
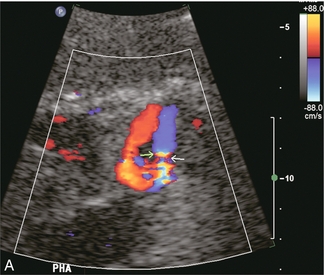
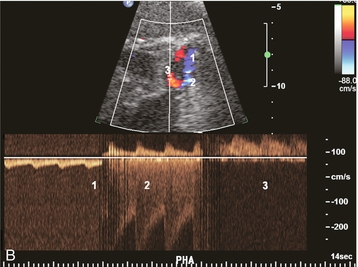
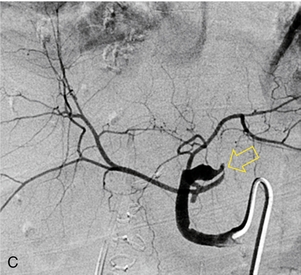
FIGURE 10-27 Intrahepatic Doppler of this liver transplant recipient showed a severe tardus-parvus waveform. (A) Colour Doppler image of the subhepatic space shows an unusual loop of the hepatic artery (B) Spectral Doppler tracing of the hepatic artery across this loop shows slow inflow, followed by an extremely high-velocity jet, followed by the tardus-parvus configuration. (C) A selective catheter angiogram of the hepatic artery reveals a kink (arrow) due to excessive vessel length in the subhepatic space. Reoperation was necessary to straighten the kink and promptly resolved the arterial inflow compromise.
The donor portal vein is usually anastomosed end-to-end with the recipient portal vein. Variations may be required if the recipient portal vein is thrombosed, hypoplastic, or of insufficient length. Because the vessel is relatively large, flow alterations on colour Doppler are rather striking (Fig. 10-28). Not all flow disturbances perceived by colour Doppler are haemodynamically significant and clinically significant compromise of portal vein flow is relatively rare. When it occurs, it is usually due to mismatch between the diameter of the recipient and donor portal veins, to excessive vessel length causing kink, or to a stenosis. If portal vein stenosis is suspected, the velocity gradient across the anastomosis should be measured by spectral Doppler. A velocity gradient of less than fourfold is unlikely to be significant. Nevertheless, anastomotic compromise can lead to portal vein thrombosis. This can be treated by surgical thrombectomy, angioplasty or thrombolytic infusion. Prompt identification is mandatory to avoid retransplantation.40,41
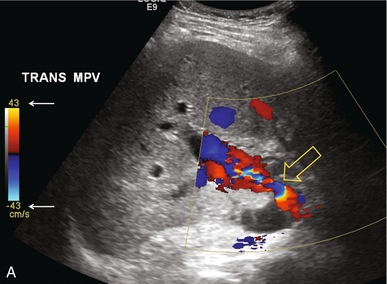
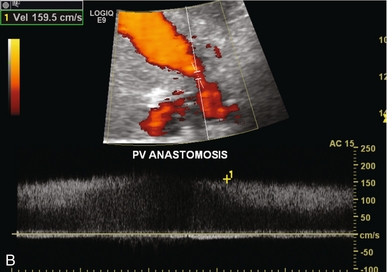
FIGURE 10-28 (A) Colour Doppler image of the portal vein in the region of the anastomosis. Note the area of narrowing at the point of anastomosis where the vein significantly narrows and colour aliasing is present throughout the vessel, despite the relatively high PRF setting (arrows). A post-stenotic jet with turbulence, eddy currents and post-stenotic dilatation is present. (B) Power Doppler does a better job of showing the focal stenosis. Spectral Doppler measured the velocity at 1.6 m/s. This was well over the threshold of the fourfold velocity gradient between pre- and post-stenotic velocities.
Post-transplantation portal vein thrombosis is quite rare and most often attributed to technical factors. It is more likely to occur in the paediatric recipient, especially after split liver transplantation.42,43 Prompt detection with frequent Doppler evaluation and aggressive surgical treatment in selected cases are required to avoid graft loss or mortality.
If slow velocity is identified in the portal vein (< 1 m/s), it may be due to increased intrahepatic resistance from rejection, or to redirected flow from collateral steal phenomenon. This occurs when large varices remain unligated, shunting blood from the portal system to the systemic circulation, bypassing the liver.44
A pulsatile waveform in the portal vein may be observed within the first few weeks after transplantation, especially in patients who received small grafts. This pulsatile flow is due to capillary leak and often disappears without any treatment. It may, however, represent vascular complication such as arterioportal fistula.45
The donor IVC has a long intrahepatic course and is therefore transplanted along with the liver. The IVC may be inserted in-line with both supra- and infrahepatic anastomoses; the native intrahepatic IVC being excised with the diseased liver. Currently the surgical technique of choice retains the native IVC of the recipient in place and the upper end of the donor IVC is anastomosed end-to-side to the native IVC at the confluence of the hepatic veins of the explanted liver. The lower end of the donor IVC is oversewn, which functionally converts it into an accessory hepatic vein. Relative flow volumes through this vessel are much less than when it served as the IVC, therefore clot may be seen partially filling the lumen (Fig. 10-29). This should not cause concern as long as some flow can be perceived. This type of anastomosis is referred to as a ‘piggyback’.46
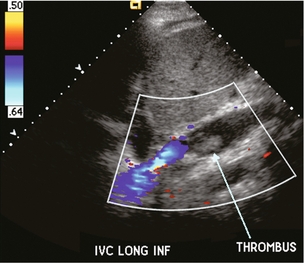
FIGURE 10-29 Longitudinal colour Doppler image of donor inferior vena cava. This liver is anastomosed with a piggy back technique, therefore the flow within the donor inferior vena cava is only a fraction of what it was previously. As a result clot has formed partially filling the lumen (arrow).
The incidence of hepatic vein complications in partial liver transplantation is more frequent than that in whole liver transplantation. Any compromise of the upper caval anastomosis, from either stenosis or kinking, may cause hepatic venous outflow obstruction. This has been reported to occur in about 2% of recipients. In rare cases, poor graft function can cause swelling of the liver with subsequent obstruction and thrombosis of the vena cava. Ultrasound findings include marked damping, or complete flattening of the hepatic vein velocity profile with complete loss of periodicity, distension of the hepatic veins and a high-velocity jet with turbulence just above the caval anastomosis47 (Fig. 10-30).
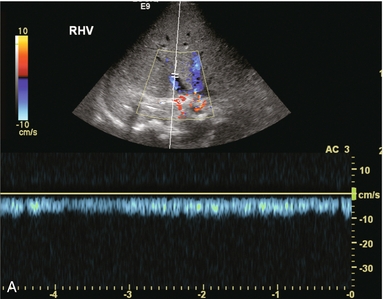
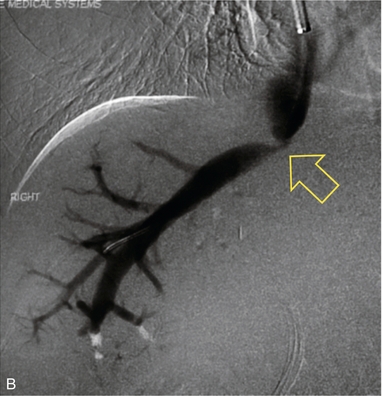
FIGURE 10-30 (A) Spectral Doppler tracing of the right hepatic vein shows complete absence of periodicity. Since this tracing is acquired within a few centimetres of the heart, one should expect to see velocity variation influenced by right atrial contraction. Its absence, along with moderate prominence of the veins, indicates hepatic venous outflow obstruction either due to organ shift and kink or stenosis. (B) A hepatic venogram identified the focal stenosis. Balloon angioplasty was subsequently performed.
Hepatic vein or caval anastomotic stricture may be treated with balloon dilatation or endovascular stent placement. If these fail, then surgical intervention with a patch venoplasty of the anastomosis can be performed.48 Ideally, after a successful procedure hepatic vein calibre should decrease and cardiac periodicity should return to the hepatic vein flow profile.49 Loss of periodicity may also be due to compression of the hepatic veins by the surrounding liver tissue by oedema in the early postoperative period (typically due to preservation injury) or by oedema in the later postoperative period related to rejection.50
Due to the potential for a size mismatch between the donor and recipient cava, it is difficult to confidently diagnose a haemodynamically significant stenosis. A persistent monophasic hepatic vein flow profile is highly suggestive for hepatic outflow obstruction, but it is not specific. On the other hand, the presence of periodicity within the hepatic vein tracing on Doppler ultrasound can confidently exclude the significant outflow obstruction.51 With hepatic vein outflow obstruction, the portal vein flow becomes altered. Increased periodicity may be present in the moderate stage; reversal of flow may occur with severe outflow obstruction.
Several authors have studied the possibility of predicting acute liver transplant rejection by identifying changes in the hepatic vein waveform.52 During rejection, hepatocellular oedema and inflammatory infiltration cause swelling and increase the pressure within Glisson’s capsule. This reduces the compliance of the liver and results in a damped hepatic vein waveform. Unfortunately there are other causes of hepatocellular oedema, such as cholangitis, hepatitis and upper IVC anastomotic stenosis which produce similar damping, thereby limiting the specificity of this finding. The diagnosis of rejection is best made by needle biopsy. Ultrasound and colour Doppler guidance should be used to guide the biopsy needle into the liver, but away from the large central vessels. Nevertheless, a biopsy-related arteriovenous fistula may develop. The majority resolve on their own, but if they persist, it can lead to hepatocellular dysfunction as arterial inflow is shunted away from the liver parenchyma. Doppler evaluation will reveal high-velocity low-resistance arterial inflow to the fistula and arterialisation of the venous outflow (Fig. 10-31).
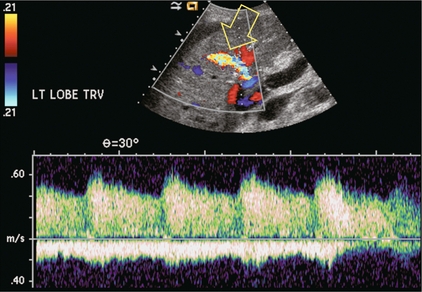
FIGURE 10-31 Colour and spectral Doppler image of the liver transplant recipient that previously had undergone liver transplant biopsy. A prominent artery with markedly increased velocity and aliasing is seen in the mid-liver. Doppler tracing shows markedly increased velocity with turbulence. Venous outflow on the same tracing shows arterialisation of the waveform. This represents a post-biopsy arteriovenous fistula.
Hepatocyte transplantation is now performed at some centres as a temporising bridge until a donor liver can be acquired for the candidate. Patients undergo intraportal infusion of cryopreserved, matched human allogenic hepatocytes. Portal vein thrombosis with liver failure and death has been reported as a complication of this treatment. Portal vein Doppler ultrasound during and after cell infusion is mandatory for these patients.53,54
Pancreas Transplantation
In the USA, the current 1-year pancreas graft survival rate (when combined with a renal transplant) is 84.8%. As of 2011, in the US 9500 pancreas transplant recipients were living with a functioning graft.4 Despite the remarkable improvements made in graft survival rates for all types of pancreatic transplantation, the high prevalence of graft loss caused by immunological rejection and surgical complications continues to be a problem. The technical failure rate approximates 8%, with vascular thrombosis being the dominant cause. Infection, pancreatitis, bleeding, anastomotic leak and rejection are other causes of transplant failure.55
The one intrinsic anatomical landmark helpful in determining that one is indeed looking at the pancreas is the pancreatic duct; but it is not always conspicuous. Identification of the pancreas may be improved by use of colour or power Doppler. It identifies flow within the gland and the adjacent transplanted splenic artery and vein. This helps it stand out against the background of bowel loops (Fig. 10-32 A,B).
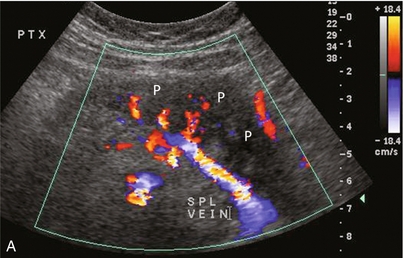
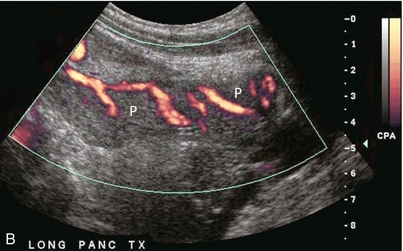
FIGURE 10-32 Colour Doppler image of the transplant pancreas (P). (A) The vascular pedicle to the transplant pancreas is a prominent feature that helps to distinguish it from the surrounding bowel loops. (B) Setting scan parameters for slower velocities can depict branch vasculature within the pancreas transplant. This of course may be difficult when there is robust peristalsis in adjacent bowel loops.
The pancreas transplant is typically implanted intraperitoneally in the right pelvis using a midline incision, simultaneously with the same donor’s kidney in the left pelvis. Organ harvesting of a deceased donor typically sends the major vascular pedicle with the liver. This leaves the pancreas with two unlinked arterial trunks (gastroduodenal and splenic) each requiring an arterial jump-graft. This is accomplished with a Y-graft from the donor’s common, external and internal iliac arteries (Fig. 10-33). One branch of the Y-graft is sutured to the donor superior mesenteric artery, whereas the donor splenic artery is anastomosed to the other limb. Intraoperatively, the common iliac trunk of the donor Y-graft is then anastomosed to the recipient iliac artery. The donor portal vein is anastomosed to either a systemic vein or the portal venous system.56
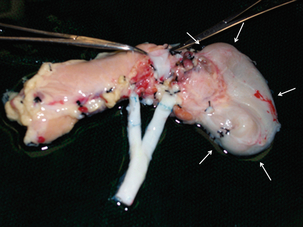
FIGURE 10-33 A photograph of the pancreas transplant prior to implantation, after creation of the donor vascular ‘Y’ graft. The head of the pancreas gets its blood supply from the gastroduodenal artery, and the body and tail from the splenic artery. This graft, harvested from the donor common iliac bifurcation, is created to establish arterial blood supply from a single recipient anastomosis. Note the duodenal stump along the head of the pancreas (arrows).
A complete sonographic examination of the pancreas transplant recipient should cover the points listed in Box 10-6. When examining a pancreas transplant recipient, it is mandatory that the sonologist know the anatomic details of that patient’s transplant (Fig. 10-34 A,B). Urological and metabolic complications occur frequently in the bladder-drained pancreas transplant recipient. Approximately 25% of bladder-drained pancreas allografts ultimately undergo enteric conversion for these complications. Therefore, enteric drainage is now the preferred conduit for managing pancreatic exocrine secretions (amylase and lipase).
Unfortunately, the pancreas allograft is particularly prone to complications and early graft failure. Since the recipients are diabetics, they already have multiple medical and vascular issues. Additionally, the pancreas is a relatively low-flow organ relative to the vascular pedicle supplying it. Since the splenic artery and vein end blindly (the donor spleen is removed), there is an increased possibility of developing clot. If not properly anticoagulated, partial thrombosis may progress to complete organ thrombosis. Consequently, Doppler sonography is mandatory in searching for vascular complications including thrombosis, or anastomotic stricture.57 Non-visualisation of flow within the organ is the ultimate disappointment. The Doppler tracing usually shows pan-diastolic reversal of arterial flow within the graft with an RI greater than 1.0 (Fig. 10-35). If identified promptly, however, thrombolytic therapy alone, or in combination with surgical thrombectomy, has been reported to succeed in restoring transplant perfusion. Early diagnosis of pancreas transplant vascular complications is of paramount importance for appropriate treatment and organ salvage.58,59 Resistive indices (RIs) are otherwise quite variable when acquired within the transplant pancreas, thus limiting its clinical usefulness.
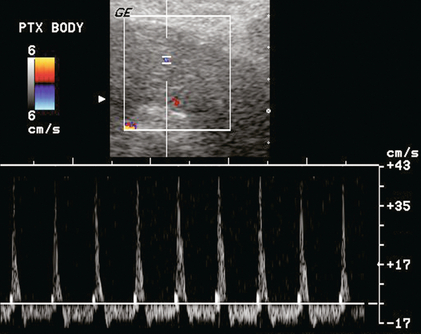
FIGURE 10-35 Power and spectral Doppler image of the pancreas. Despite optimised settings, no colour flow can be identified within the gland. A spectral Doppler tracing of the feeding artery shows extremely high resistance with spike of systolic inflow and reversed outflow throughout diastole. This is usually the result of venous outflow obstruction due to thrombosis or a kink. Microvascular thrombosis, secondary to severe acute rejection, can have a similar appearance.
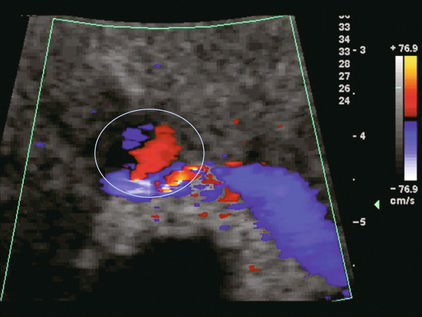
The digestive enzymes are typically drained into the gut via the duodenal stump, but if a leak occurs fluid may extend to the pancreas vasculature predisposing to pseudoaneurysm formation, especially in the region of the anastomosis. Pseudoaneurysms can also develop after biopsy, pancreatitis or graft infection. Arterial flow within a perianastomotic fluid collection, the presence of swirling blood on colour Doppler, and a to-and-fro spectral Doppler waveform indicate a transplant pedicle pseudoaneurysm (Fig. 10-36). Rupture of transplant-associated pseudoaneurysm has been described and is a life-threatening event.60,61
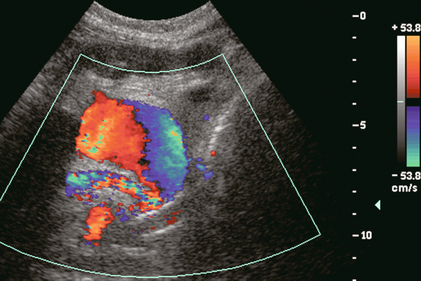
FIGURE 10-36 Colour Doppler image near the anastomosis of the pancreatic vascular pedicle. A rounded collection of colour flow with the classic swirl pattern identifies pseudoaneurysm of the anastomosed splenic artery.
The pancreas, as with any other transplanted organ, requires occasional biopsy and this increases the risk of arteriovenous fistula (AVF). Doppler findings are similar to AVFs in other locations (Fig. 10-37A,B). AVFs are often clinically silent, although pancreatic endocrine insufficiency, pain, and a bruit over the graft can be presenting features. High-flow AVF may compromise graft perfusion, causing a ‘steal phenomenon’. This may result in organ ischaemia.62
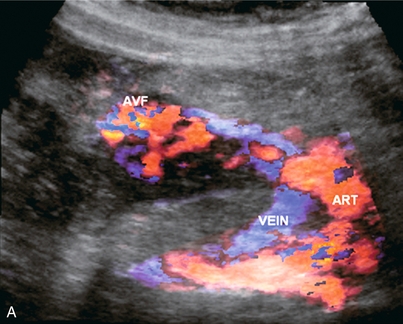
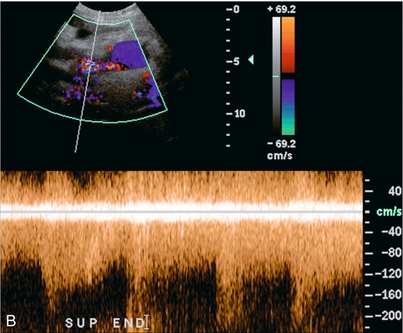
FIGURE 10-37 3-D rendered colour and spectral Doppler image of a pancreas several weeks after a biopsy. (A) The colour Doppler image shows a feeding artery and large draining vein from a focus of tortuous vascularity. (B) Spectral Doppler tracing shows high-velocity, turbulent, low-resistance arterial flow in the area of flash artifact. This was an arteriovenous fistula; a complication of the biopsy.
Although ultrasound is excellent in identifying parapancreatic fluid collections, the finding is basically non-specific. Abscess, haematoma or liquefied phlegmon may all have a similar ultrasound appearance of complicated, debris-filled, irregular collections (Fig. 10-38 A,B). The true extent of these collections is better evaluated by CT since bowel gas does not limit visualisation. Furthermore, follow-up CT examinations can be more reliably compared than ultrasound studies. The source of a fluid collection is best evaluated by a CT contrast study or by aspiration.
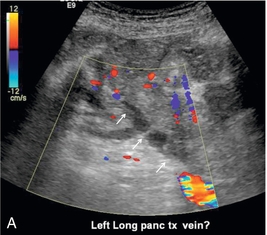
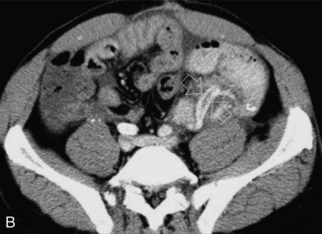
FIGURE 10-38 (A) Colour Doppler image of the pancreas transplant shows a tubular structure with no flow. The feeding artery was easily identified so the sonologist questioned whether this might represent clot within the vein. (B) Venous phase image from a CT angiogram reveals a tubular filling defect within the splenic vein (arrow) draining this pancreas transplant. The small amount of venous outflow from the pancreas is insufficient to flush this large-calibre vein which used to drain the spleen as well.
Rejection affects about 40% of pancreas transplants. Unfortunately, imaging findings lack specificity. Preliminary reports suggested that elevation of the resistive index could predict pancreas transplant rejection. Unfortunately this is not the case, as many rejecting transplants have normal resistive indices. Since the pancreatic graft lacks a capsule, the rejection process will not generate enough intraparenchymal pressure to cause a consistently measurable elevation of vascular resistance. The key role of ultrasound in rejection is to guide the pancreas transplant biopsy. It must identify a safe path to the organ, free of overlying intestine or mesentery. Doppler needs to identify the pancreatic vascular pedicle which must be avoided. The biopsy is monitored in real time, and delayed imaging and Doppler are useful to identify complications.63
Post-Transplantation Lymphoproliferative Disorder
Post-transplantation lymphoproliferative disorder (PTLD) is a rare but serious complication following solid organ transplantation. The most commonly accepted theory for the pathophysiology of PTLD is that Epstein–Barr virus (EBV)-induced B-cell proliferation, unopposed by the pharmacologically suppressed immune system, causes plasma cell hyperplasia, leading to premalignant polymorphic B-cell proliferation and eventually malignant monoclonal lymphoma. If untreated, it can be fatal.64 Reduction or cessation of immunosuppression is the best treatment and usually results in tumour regression. Early diagnosis prior to the development of frank lymphoma is very important and these patients have a much better prognosis. In a large study of PTLD in renal transplant recipients, the incidence was 2% of 1383 patients; but it contributed to death in over 50% of these cases.65
The liver is the organ most frequently involved by PTLD. It can appear as a focal mass, diffuse infiltration, or a periportal mass.66 PTLD can affect the transplanted kidney and may manifest as a focal renal mass or diffuse infiltration.67 The pancreas transplant may be involved, and can present as diffuse enlargement of the allograft or as a focal mass which may be confused with pancreatitis or acute rejection.68
Since ultrasound is often the first imaging study performed when laboratory tests suggest transplant dysfunction, it plays an important role in the early diagnosis of PTLD. It may detect urinary or biliary obstruction associated with adenopathy or may perceive a new ill-defined, typically hypoechoic mass. Doppler may show vascular distortion by the mass or adenopathy.69
Other Imaging Modalities
MR angiography (MRA) has been found to be sensitive but not specific in the detection of significant vascular stenosis, nevertheless, normal MRA findings reliably exclude the possibility of significant stenosis. CT and CT angiography (CTA) are excellent at identifying transplant and peritransplant fluid collections, abscess formation, vascular complications, etc. However, due to the need for nephrotoxic contrast and the radiation dose, ultrasound is the preferred screening test, with CT and CTA used for confirmation and problem solving.70
Summary
These are very rewarding times in the field of organ transplantation. Advances in organ procurement and preservation; better matching of donors and recipients; refined surgical techniques; availability of new, more effective immunosuppressive agents; and improved post-transplant monitoring of organ recipients have contributed to decreased patient morbidity and improved allograft survival. Although Doppler sonography is only able to make a definitive diagnosis in a small percentage of cases, it is extremely useful as a screening tool in the management of transplant complications. All of this has allowed transplant recipients greater opportunity to return to a more normal lifestyle after surgery.71,72
REFERENCES
1. Heeger, P. S., Dinavahi, R. Transplant immunology for non-immunologist. Mt Sinai J Med. 2012; 79(3):376–387.
2. Klipa, D., Mahmud, N., Ahsan, N. Antibody immunosuppressive therapy in solid organ transplant: Part II. mAbs. 2010; 2(6):607–612.
3. Bestard, O., Campistol, J. M., Morales, J. M., et al. Advances in immunosuppression for kidney transplantation: new strategies for preserving kidney function and reducing cardiovascular risk. Nefrologia. 2012; 32(3):374–384.
4. US Department of Health and Human Services PHS OPTN/ SRTR Annual Report: Transplant Data 1999–2008. Health Resources and Services Administration, 2009 [cited 2013 March 19]; Available from:. http://optn.transplant.hrsa.gov/ar2009/survival_rates.htm
5. Irshad, A., Ackerman, S. J., Campbell, A. S., et al. An overview of renal transplantation: current practice and use of ultrasound. Semin Ultrasound CT MR. 2009; 30(4):298–314.
6. Pozniak, M. A., Zagzebski, J. A., Scanlan, K. A. Spectral and color Doppler artifacts. Radiographics. 1992; 12(1):35–44.
7. Pozniak, M. A., Kelcz, F., Stratta, R. J., et al. Extraneous factors affecting resistive index. Invest Radiol. 1988; 23(12):899–904.
8. Cosgrove, D. O., Chan, K. E. Renal transplants: what ultrasound can and cannot do. Ultrasound Q. 2008; 24(2):77–87.
9. Pozniak, M. A., Kelcz, F., D’Alessandro, A., et al. Sonography of renal transplants in dogs: the effect of acute tubular necrosis, cyclosporine nephrotoxicity, and acute rejection on resistive index and renal length. AJR Am J Roentgenol. 1992; 158(4):791–797.
10. Tublin, M. E., Bude, R. O., Platt, J. F. Review. The resistive index in renal Doppler sonography: where do we stand? AJR Am J Roentgenol. 2003; 180(4):885–892.
11. Ekberg, H., Johansson, M. E. Challenges and considerations in diagnosing the kidney disease in deteriorating graft function. Transpl Int. 2012; 25(11):1119–1128.
12. Friedewald, S. M., Molmenti, E. P., Friedewald, J. J., et al. Vascular and nonvascular complications of renal transplants: sonographic evaluation and correlation with other imaging modalities, surgery, and pathology. J Clin Ultrasound. 2005; 33(3):127–139.
13. Rivera, M., Villacorta, J., Jimenez-Alvaro, S., et al. Asymptomatic large extracapsular renal pseudoaneurysm following kidney transplant biopsy. Am J Kidney Dis. 2011; 57(1):175–178.
14. Minetti, E. E. Lymphocele after renal transplantation, a medical complication. J Nephrol. 2011; 24(6):707–716.
15. Lucewicz, A., Isaacs, A., Allen, R. D., et al. Torsion of intraperitoneal kidney transplant. ANZ J Surg. 2012; 82(5):299–302.
16. Platt, J. F., Ellis, J. H., Rubin, J. M. Renal transplant pyelocaliectasis: role of duplex Doppler US in evaluation. Radiology. 1991; 179(2):425–428.
17. Pozniak, M. A., Dodd, G. D., 3rd., Kelcz, F. Ultrasonographic evaluation of renal transplantation. Radiol Clin North Am. 1992; 30(5):1053–1066.
18. Jimenez, C., Lopez, M. O., Gonzalez, E., et al. Ultrasonography in kidney transplantation: values and new developments. Transplant Rev (Orlando). 2009; 23(4):209–213.
19. Lockhart, M. E., Robbin, M. L. Renal vascular imaging: ultrasound and other modalities. Ultrasound Q. 2007; 23(4):279–292.
20. Stavros, A. T., Parker, S. H., Yakes, W. F., et al. Segmental stenosis of the renal artery: pattern recognition of tardus and parvus abnormalities with duplex sonography. Radiology. 1992; 184(2):487–492.
21. Ponticelli, C., Moia, M., Montagnino, G. Renal allograft thrombosis. Nephrol Dial Transplant. 2009; 24(5):1388–1393.
22. Hedegard, W., Saad, W. E., Davies, M. G. Management of vascular and nonvascular complications after renal transplantation. Tech Vasc Interv Radiol. 2009; 12(4):240–262.
23. Baxter, G. M., Morley, P., Dall, B. Acute renal vein thrombosis in renal allografts: new Doppler ultrasonic findings. Clin Radiol. 1991; 43(2):125–127.
24. Kribs, S. W., Rankin, R. N. Doppler ultrasonography after renal transplantation: value of reversed diastolic flow in diagnosing renal vein obstruction. Can Assoc Radiol J. 1993; 44(6):434–438.
25. McEvoy, S., Stunell, H., Ramadan, T., et al. A review of the imaging and intervention of liver transplant complications. JBR-BTR. 2010; 93(5):235–241.
26. Ravindra, K. V., Guthrie, J. A., Woodley, H., et al. Preoperative vascular imaging in pediatric liver transplantation. J Pediatr Surg. 2005; 40(4):643–647.
27. Kluger, M. D., Memeo, R., Laurent, A., et al. Survey of adult liver transplantation techniques (SALT): an international study of current practices in deceased donor liver transplantation. HPB. 2011; 13(10):692–698.
28. Berrocal, T., Parron, M., Alvarez-Luque, A., et al. Pediatric liver transplantation: a pictorial essay of early and late complications. Radiographics. 2006; 26(4):1187–1209.
29. Nakamura, T., Tanaka, K., Kiuchi, T., et al. Anatomical variations and surgical strategies in right lobe living donor liver transplantation: lessons from 120 cases. Transplantation. 2002; 73(12):1896–1903.
30. Sidhu, P. S., Ellis, S. M., Karani, J. B., et al. Hepatic artery stenosis following liver transplantation: significance of the tardus parvus waveform and the role of microbubble contrast media in the detection of a focal stenosis. Clin Radiol. 2002; 57(9):789–799.
31. Kaneko, J., Sugawara, Y., Akamatsu, N., et al. Prediction of hepatic artery thrombosis by protocol Doppler ultrasonography in pediatric living donor liver transplantation. Abdom Imaging. 2004; 29(5):603–605.
32. Sidhu, P. S., Shaw, A. S., Ellis, S. M., et al. Microbubble ultrasound contrast in the assessment of hepatic artery patency following liver transplantation: role in reducing frequency of hepatic artery arteriography. Eur Radiol. 2004; 14(1):21–30.
33. Herold, C., Reck, T., Ott, R., et al. Contrast-enhanced ultrasound improves hepatic vessel visualization after orthotopic liver transplantation. Abdom Imaging. 2001; 26(6):597–600.
34. Bekker, J., Ploem, S., de Jong, K. P. Early hepatic artery thrombosis after liver transplantation: a systematic review of the incidence, outcome and risk factors. Am J Transplant. 2009; 9(4):746–757.
35. Pareja, E., Cortes, M., Navarro, R., et al. Vascular complications after orthotopic liver transplantation: hepatic artery thrombosis. Transplant Proc. 2010; 42(8):2970–2972.
36. Vivarelli, M., Cucchetti, A., La Barba, G., et al. Ischemic arterial complications after liver transplantation in the adult: multivariate analysis of risk factors. Arch Surg. 2004; 139(10):1069–1074.
37. Garcia-Criado, A., Gilabert, R., Salmeron, J. M., et al. Significance of and contributing factors for a high resistive index on Doppler sonography of the hepatic artery immediately after surgery: prognostic implications for liver transplant recipients. AJR Am J Roentgenol. 2003; 181(3):831–838.
38. Stell, D., Downey, D., Marotta, P., et al. Prospective evaluation of the role of quantitative Doppler ultrasound surveillance in liver transplantation. Liver Transpl. 2004; 10(9):1183–1188.
39. Propeck, P. A., Scanlan, K. A. Reversed or absent hepatic arterial diastolic flow in liver transplants shown by duplex sonography: a poor predictor of subsequent hepatic artery thrombosis. AJR Am J Roentgenol. 1992; 159(6):1199–1201.
40. Doria, C., Marino, I. R. Acute portal vein thrombosis secondary to donor/recipient portal vein diameter mismatch after orthotopic liver transplantation: a case report. Int Surg. 2003; 88(4):184–187.
41. Rodriguez-Castro, K. I., Porte, R. J., Nadal, E., et al. Management of nonneoplastic portal vein thrombosis in the setting of liver transplantation: a systematic review. Transplantation. 2012; 94(11):1145–1153.
42. Cheng, Y. F., Chen, C. L., Huang, T. L., et al. Risk factors for intraoperative portal vein thrombosis in pediatric living donor liver transplantation. Clin Transplant. 2004; 18(4):390–394.
43. Corno, V., Torri, E., Bertani, A., et al. Early portal vein thrombosis after pediatric split liver transplantation with left lateral segment graft. Transplant Proc. 2005; 37(2):1141–1142.
44. Nishida, S., Kadono, J., DeFaria, W., et al. Gastroduodenal artery steal syndrome during liver transplantation: intraoperative diagnosis with Doppler ultrasound and management. Transpl Int. 2005; 18(3):350–353.
45. Tang, S. S., Shimizu, T., Kishimoto, R., et al. Analysis of portal venous waveform after living-related liver transplantation with pulsed Doppler ultrasound. Clin Transplant. 2001; 15(6):380–387.
46. Salizzoni, M., Andorno, E., Bossuto, E., et al. Piggyback techniques versus classical technique in orthotopic liver transplantation: a review of 75 cases. Transplant Proc. 1994; 26(6):3552–3553.
47. Darcy, M. D. Management of venous outflow complications after liver transplantation. Tech Vasc Interv Radiol. 2007; 10(3):240–245.
48. Akamatsu, N., Sugawara, Y., Kaneko, J., et al. Surgical repair for late-onset hepatic venous outflow block after living-donor liver transplantation. Transplantation. 2004; 77(11):1768–1770.
49. Totsuka, E., Hakamada, K., Narumi, S., et al. Hepatic vein anastomotic stricture after living donor liver transplantation. Transplant Proc. 2004; 36(8):2252–2254.
50. Lee, H. J., Kim, K. W., Mun, H. S., et al. Uncommon causes of hepatic congestion in patients after living donor liver transplantation. AJR Am J Roentgenol. 2009; 193(3):772–780.
51. Ko, E. Y., Kim, T. K., Kim, P. N., et al. Hepatic vein stenosis after living donor liver transplantation: evaluation with Doppler US. Radiology. 2003; 229(3):806–810.
52. Jequier, S., Jequier, J. C., Hanquinet, S., et al. Orthotopic liver transplants in children: change in hepatic venous Doppler wave pattern as an indicator of acute rejection. Radiology. 2003; 226(1):105–112.
53. Baccarani, U., Adani, G. L., Sanna, A., et al. Portal vein thrombosis after intraportal hepatocytes transplantation in a liver transplant recipient. Transpl Int. 2005; 18(6):750–754.
54. Fitzpatrick, E., Mitry, R. R., Dhawan, A. Human hepatocyte transplantation: state of the art. J Intern Med. 2009; 266(4):339–357.
55. Nikolaidis, P., Amin, R. S., Hwang, C. M., et al. Role of sonography in pancreatic transplantation. Radiographics. 2003; 23(4):939–949.
56. Dillman, J. R., Elsayes, K. M., Bude, R. O., et al, Imaging of pancreas transplants: postoperative findings with clinical correlation. J Comput Assist Tomogr. 2009; 33(4):609–617, doi: 10. 1097/RCT. 0b013e3181966988.
57. Foshager, M. C., Hedlund, L. J., Troppmann, C., et al. Venous thrombosis of pancreatic transplants: diagnosis by duplex sonography. AJR Am J Roentgenol. 1997; 169(5):1269–1273.
58. Boggi, U., Vistoli, F., Signori, S., et al. Surveillance and rescue of pancreas grafts. Transplant Proc. 2005; 37(6):2644–2647.
59. Muthusamy, A. S., Giangrande, P. L., Friend, P. J. Pancreas allograft thrombosis. Transplantation. 2010; 90(7):705–707.
60. Delis, S., Dervenis, C., Bramis, J., et al. Vascular complications of pancreas transplantation. Pancreas. 2004; 28(4):413–420.
61. Green, B. T., Tuttle-Newhall, J., Suhocki, P., et al. Massive gastrointestinal hemorrhage due to rupture of a donor pancreatic artery pseudoaneurysm in a pancreas transplant patient. Clin Transplant. 2004; 18(1):108–111.
62. Buttarelli, L., Capocasale, E., Marcato, C., et al. Embolization of pancreatic allograft arteriovenous fistula with the Amplatzer Vascular Plug 4: case report and literature analysis. Transplant Proc. 2011; 43(10):4044–4047.
63. Wong, J. J., Krebs, T. L., Klassen, D. K., et al. Sonographic evaluation of acute pancreatic transplant rejection: morphology–Doppler analysis versus guided percutaneous biopsy. AJR Am J Roentgenol. 1996; 166(4):803–807.
64. Nalesnik, M. A. The diverse pathology of post-transplant lymphoproliferative disorders: the importance of a standardized approach. Transpl Infect Dis. 2001; 3(2):88–96.
65. Bates, W. D., Gray, D. W., Dada, M. A., et al. Lymphoproliferative disorders in Oxford renal transplant recipients. J Clin Pathol. 2003; 56(6):439–446.
66. Kamdar, K. Y., Rooney, C. M., Heslop, H. E. Posttransplant lymphoproliferative disease following liver transplantation. Curr Opin Org Transplant. 2011; 16(3):274–280.
67. Vrachliotis, T. G., Vaswani, K. K., Davies, E. A., et al. CT findings in posttransplantation lymphoproliferative disorder of renal transplants. AJR Am J Roentgenol. 2000; 175(1):183–188.
68. Meador, T. L., Krebs, T. L., Cheong, J. J., et al. Imaging features of posttransplantation lymphoproliferative disorder in pancreas transplant recipients. AJR Am J Roentgenol. 2000; 174(1):121–124.
69. Scarsbrook, A. F., Warakaulle, D. R., Dattani, M., et al. Post-transplantation lymphoproliferative disorder: the spectrum of imaging appearances. Clin Radiol. 2005; 60(1):47–55.
70. Saad, W. E., Lin, E., Ormanoski, M., et al. Noninvasive imaging of liver transplant complications. Tech Vasc Interv Radiol. 2007; 10(3):191–206.
71. Lim, K. B., Schiano, T. D. Long-term outcome after liver transplantation. Mt Sinai J Med. 2012; 79(2):169–189.
72. Vandermeer, F. Q., Manning, M. A., Frazier, A. A., et al. Imaging of whole-organ pancreas transplants. Radiographics. 2012; 32(2):411–435.