Chapter 5 Single-Photon Emission Computed Tomography Artifacts
TECHNICAL ARTIFACTS
Flood Field Nonuniformity
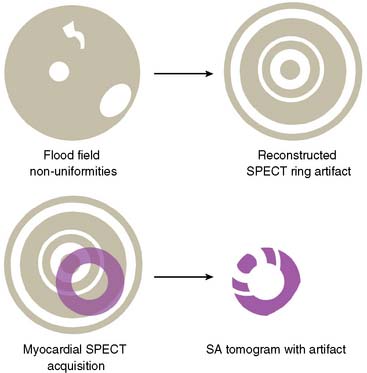
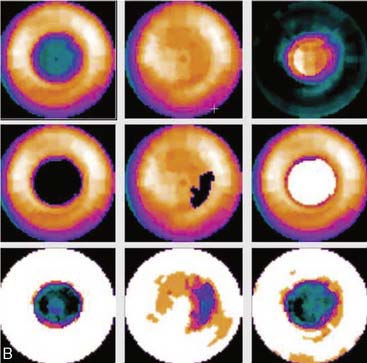
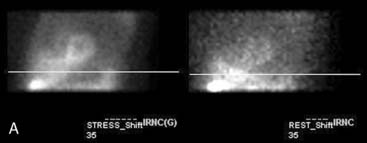
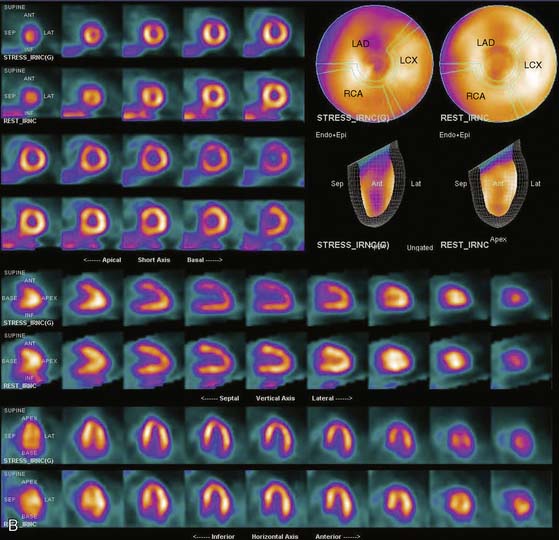
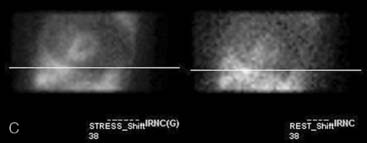
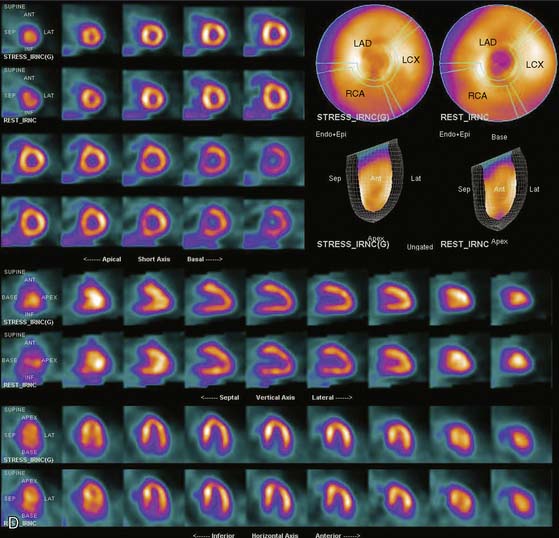
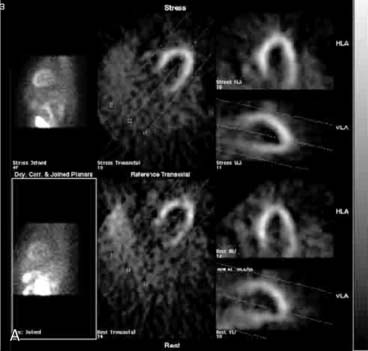
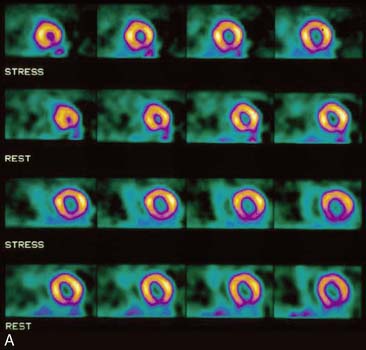
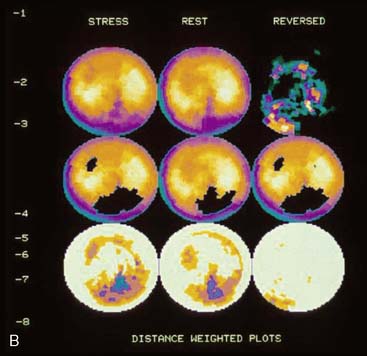
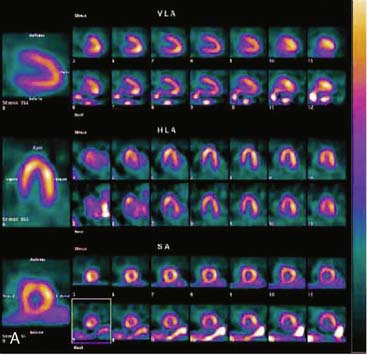
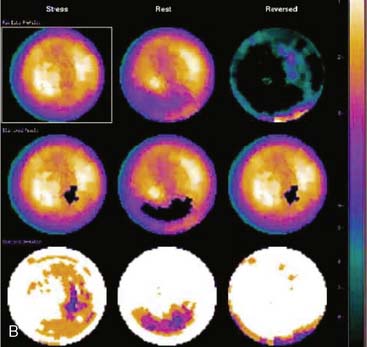
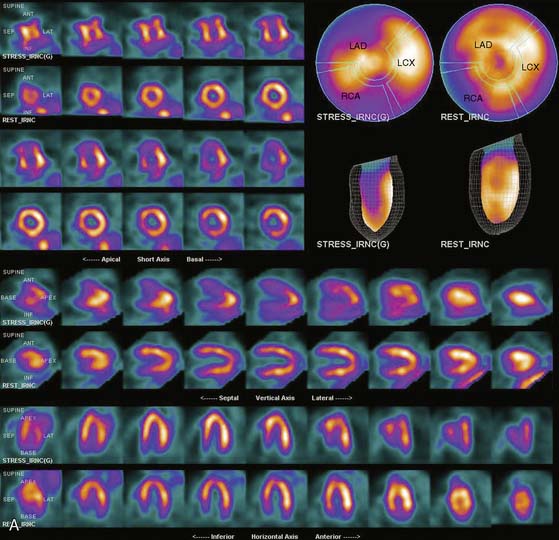
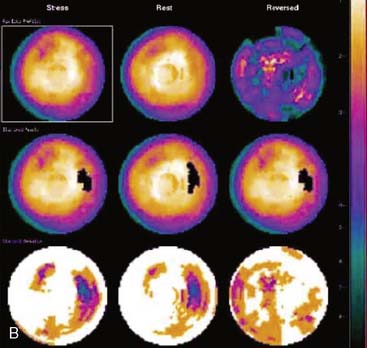
Flood field nonuniformity will result in “ring” artifacts in reconstructed SPECT images. These relatively photon-deficient rings may be apparent in tomographic slices and in severe cases may also appear in polar coordinate maps (Fig. 5-1). Because patients are frequently positioned differently within the camera field for rest and stress scans, flood field artifacts may occur in differents of the myocardium, mimicking reversible or partially reversible defects. Therefore, routine acquisition and inspection of intrinsic and extrinsic flood fields acquired according to vendor recommendations are absolutely critical to avoid such artifacts. Flood fields are routinely acquired the first thing in the morning each working day. However, if ring artifacts appear in clinical SPECT images, it may be necessary to reacquire flood field images in the middle of the day.
Center of Rotation and Camera-Held Alignment Errors
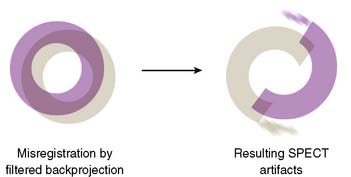
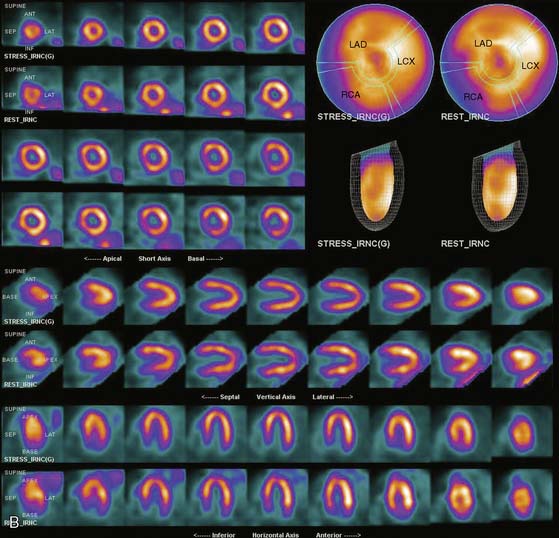
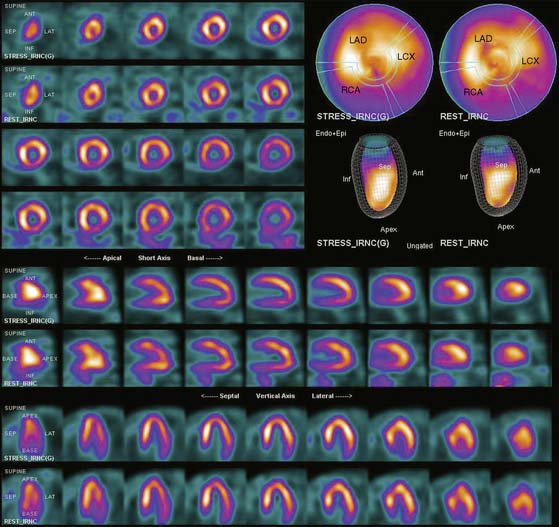
If the camera center of rotation (COR) is incorrect, filtered backprojection during SPECT reconstruction will result in image misregistration and apparent misalignment of the myocardial walls (Fig. 5-2). Technically, this is similar to the error created by cardiac motion. However, unlike motion artifacts, those due to COR error are usually more systematic and predictable. The severity of the apparent defect is directly proportional to the magnitude of the COR error. An error similar to that produced by the wrong center of rotation is produced when the detector is not aligned perpendicular to the radius of rotation.
Errors in Selecting Oblique Cardiac Axes and Subsequent Polar Map Reconstruction
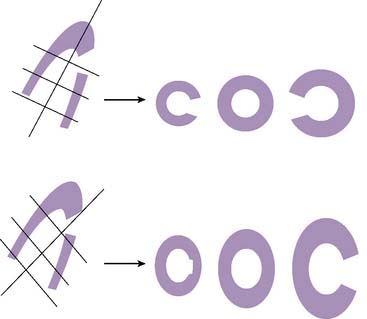
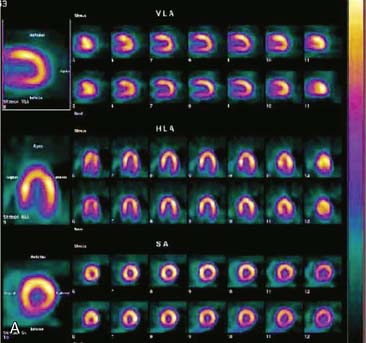
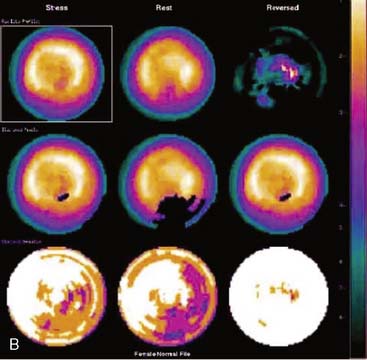
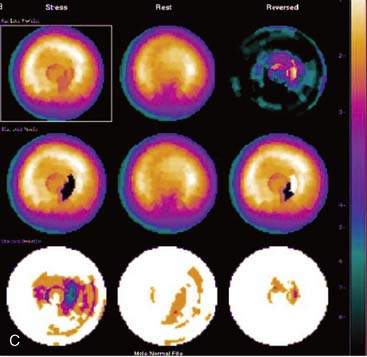
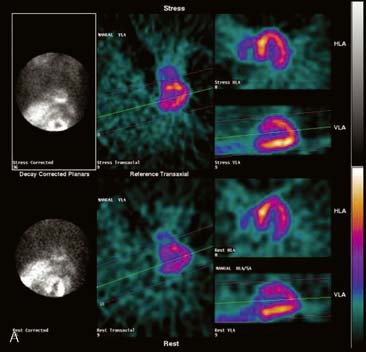
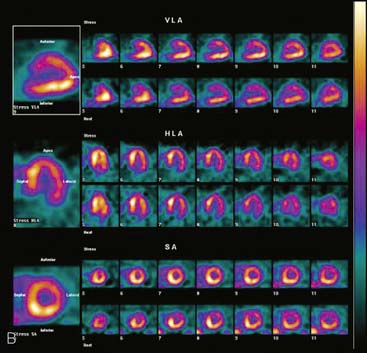
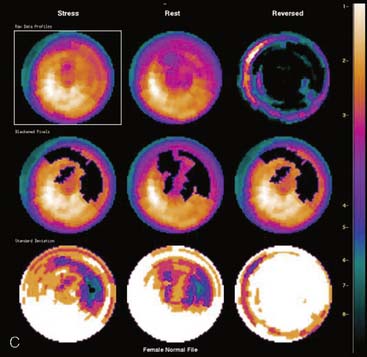
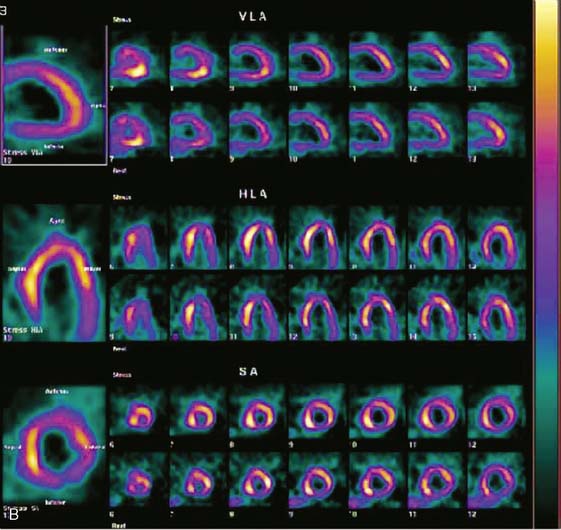
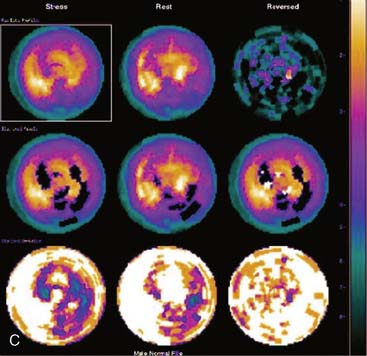
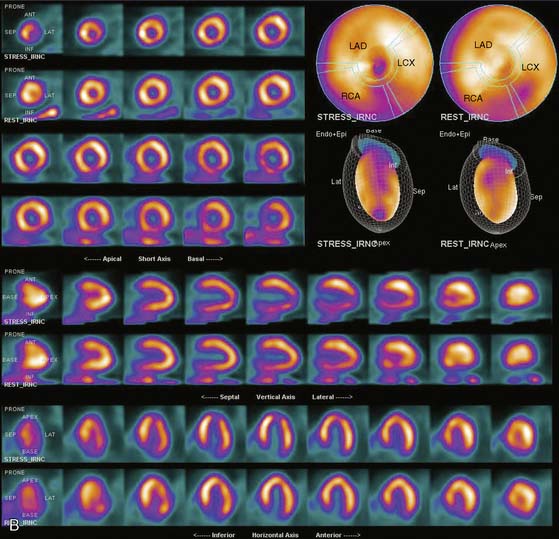
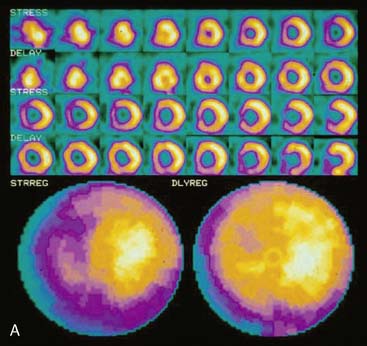
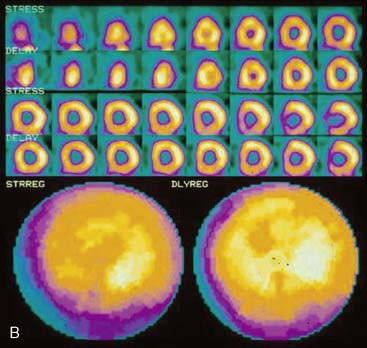
If the long axis of the left ventricle (LV) is defined incorrectly on either the transaxial or midventricular vertical long-axis slice, the geometry of the heart in subsequently reconstructed orthogonal tomographic slices can be distorted. Consequently, the apparent regional count density can be altered in polar maps, resulting in apparent perfusion defects. These may be accentuated by quantitative analyses in which patient data are compared to normal files (Fig. 5-3). In polar map reconstruction, such errors most often occur in basal myocardial regions at the periphery of the bull’s-eye plot, owing to foreshortening of one of the myocardial walls (Fig. 5-4). Also, the apex, which often demonstrates physiologic thinning and decreased count density, is displaced from the exact center of the polar plot. The displaced apex may also consequently result in an artifact. Misregistration of perfusion defects in short-axis slices and polar maps is not infrequently encountered in patients with sizable severe infarcts.
Selection of Apex and Base for Polar Map Reconstruction
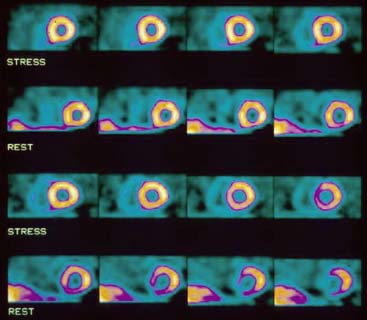
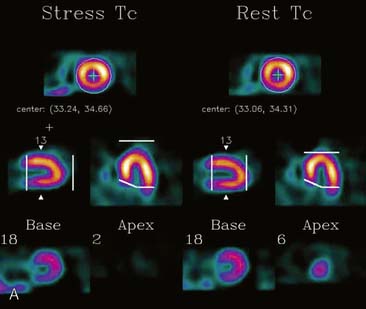
Accurate and reproducible selection of the apex and base of the LV myocardium is necessary in stress and rest images. Positioning limits for slice selection that lie too far apically or basally will result in apparent perfusion defects (Fig. 5-5). In contrast, positioning slice limits too tightly, so that they do not encompass the entire heart, will potentially result in underestimation of the size and extent of a defect. Likewise, in regions of normal myocardium, maximal myocardial count density may not be correctly sampled.
Arrhythmias and Gating Errors
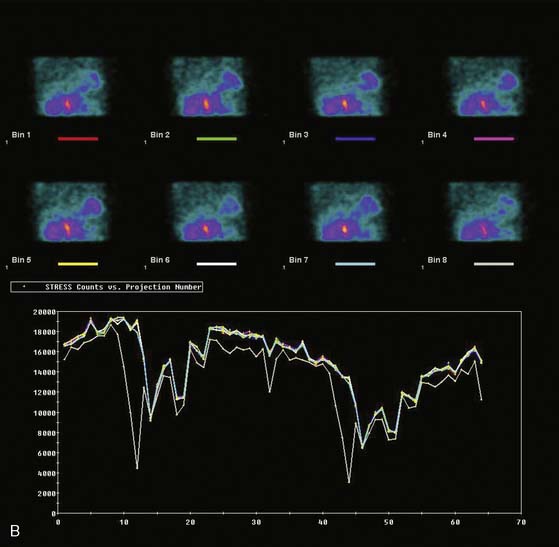
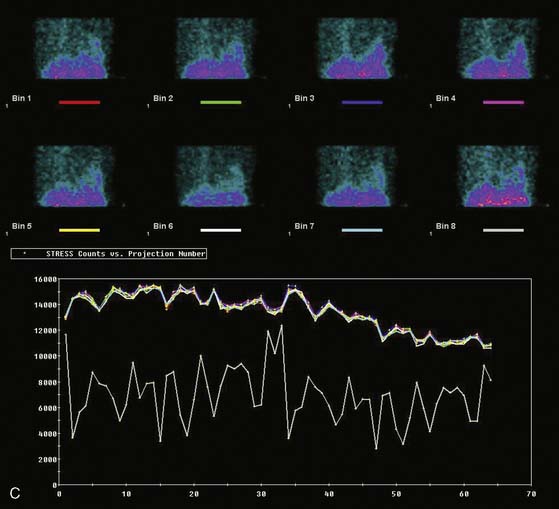
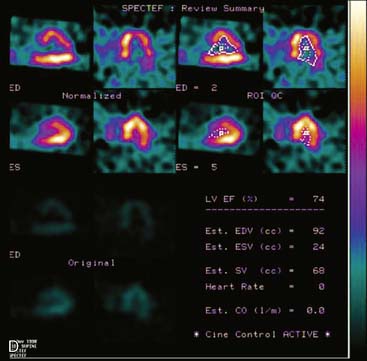
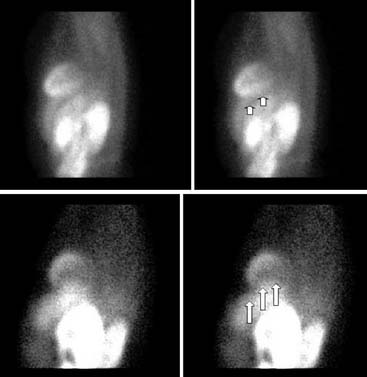
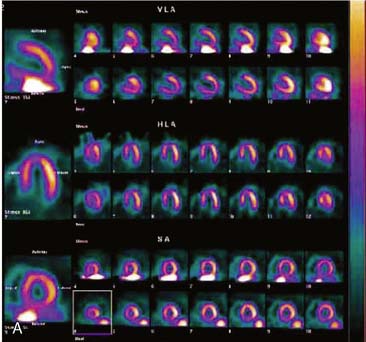
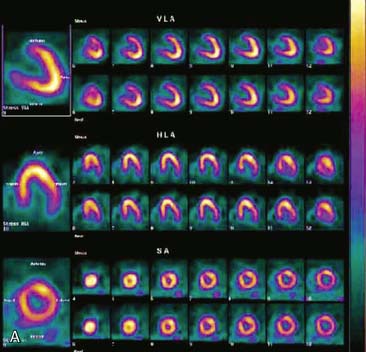
Displays of cardiac image count density from individual planar projection images is now possible using some commercially available software programs (Fig. 5-6). Errors in LV volume and ejection fraction may result from gating errors, but these are beyond the scope of this chapter.1
PATIENT-RELATED ARTIFACTS
Soft-Tissue Attenuation (See Chapters 6 and 7)
The location of the attenuation artifact depends on the position of the soft-tissue attenuator in relation to the left ventricle. The severity of the artifact depends on the size and density of the attenuator in relation to adjacent tissue. Within the resultant SPECT image, the artifact may appear as a fixed or reversible defect or may mimic “reverse redistribution,” depending on whether the attenuator is in a constant or variable position in stress and delayed image acquisitions. The severity of the attenuation artifact also depends on the energy of the incident photon. Attenuation artifacts for technetium (99mTc)-labeled myocardial perfusion agents will be somewhat less marked than for thallium (201Tl).3 However, for either isotope, evaluation of regional wall motion is helpful in differentiating attenuation artifacts from myocardial scarring as a source of fixed perfusion defects.4–6
Breast Attenuation
Because breasts vary in size, position, configuration, and density, breast attenuation artifacts are extremely variable in appearance. In addressing the characteristics of breast attenuation, it is always necessary to consider the position and configuration of the breasts with the patient in the supine position, because patients are imaged in this position with most commercially available SPECT systems. In women of average body habitus, the left breast overlies the anterolateral wall of the heart. In women with large, pendulous breasts, the breasts lie adjacent to the lateral chest wall and more often result in a lateral attenuation artifact. In some women with very large, pendulous breasts, the attenuation artifact may create apparent inferior or inferolateral perfusion defects. In women with very large breasts, the breast tissue may overlie the entire LV. In this instance, the resulting attenuation artifact may be diffuse and less discrete or may primarily involve the apex. In addition to breast position, the caudal angulation of the heart within the thorax will affect the appearance of the attenuation artifact.2–3 Thus, in summary, the severity of breast attenuation artifacts is not necessarily directly proportional to breast size or chest circumference but may vary considerably according to the position, configuration, and density of the breast, body habitus of the patient, and orientation of the heart within the thorax. Additionally, when women are imaged upright or in a semi-upright, “reclining” position, the breasts are usually more pendulous than in the supine position. Therefore, apical and inferior breast attenuation artifacts are more frequent when women are imaged in these positions.
Attenuation correction for SPECT is now commercially available but is still a topic of intense interest and research. The methods for accomplishing it have used either scatter correction or attenuation correction using a separate radionuclide or x-ray transmission image. This approach has been demonstrated to significantly reduce breast and other attenuation artifacts in phantom and patient studies.7–18 However, whereas attenuation correction may minimize attenuation artifacts created by overlying breast tissue, breast artifacts are frequently not totally eliminated.
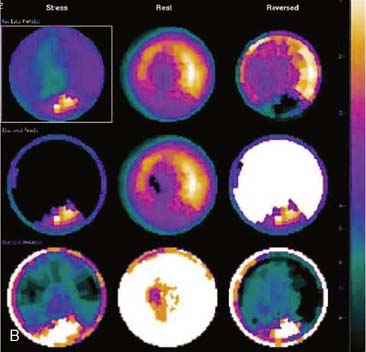
Certain breast attenuation artifacts are unique to quantitative analysis in cardiac SPECT. The most common is an apparent inferior perfusion defect incorrectly identified by quantitative analysis in women who have had a left mastectomy. After removal of the breast, there is little or no anterior soft-tissue attenuation. In such cases, the anterior and inferior myocardial count densities are nearly the same as they are for males. Since the normal female file anticipates that the inferior wall will be more intense than the anterior wall, and in the patient study the inferior wall has an identical or lower intensity than the anterior wall, the inferior wall will be identified as abnormal (Fig. 5-7). This quantitative error can be circumvented by comparison of the patient’s data to the normal male file instead. Similar inferior artifacts have been observed in quantitative plots in women with very small breasts, and it might be argued that data from such patients should be compared to normal male limits. However, small breasts may be quite dense, and the assumption that they do not produce photon attenuation may be incorrect. Therefore, in most laboratories, the normal male file is used routinely only for women who have undergone left mastectomy.
The position of the breast may vary from stress to rest if a woman wears different clothing at the time of the two SPECT acquisitions. Breast position varies considerably with a bra on and off. The position of the breast may also vary depending upon the degree of elevation of the left arm, which is preferably positioned above the head for a SPECT acquisition. A shifting breast attenuation artifact can mimic a reversible perfusion defect (i.e., ischemia). For example, if during stress SPECT acquisition, the breast lies high over the anterior chest wall, an anterior attenuation artifact may result. However, if during the resting acquisition, the breast lies more laterally and inferiorly, the artifact will involve the inferolateral wall of the LV. The resulting attenuation artifacts are therefore different in the stress and rest images, so artifactual defect reversibility as well as artifactual “reverse distribution” may result. In this example, the anterior defect will appear to be reversible, whereas there will appear to be “reverse distribution” in the inferolateral wall (Fig. 5-8).
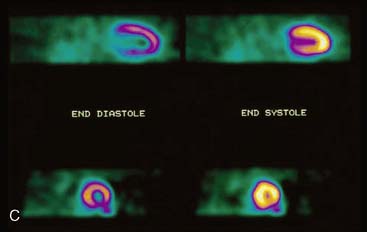
Gated myocardial perfusion SPECT is helpful in differentiating breast attenuation artifacts from scar, since artifacts will demonstrate normal wall motion and wall thickening, whereas infarcts, if they are transmural and sizable, will be hypokinetic with decreased wall thickening (Fig. 5-9).4,5 However, patients with nontransmural myocardial infarctions might have normal wall motion, depending on the thickness of the infarct zone. For artifacts created by a breast that shifts in position from stress to rest, gating is less helpful to differentiate artifact from ischemia as a cause of the reversible or partially reversible defect.
Lateral Chest-Wall Fat Attenuation
Diffuse Depth-Dependent Soft-Tissue Attenuation
In some obese patients, soft-tissue attenuation may be diffuse. Under these circumstances, the entire myocardium may be attenuated. Because attenuation within soft tissue is distance dependent, the more basal portions of the LV myocardium will be attenuated to the greatest degree. Therefore, in obese patients, an apparent circumferential decrease in trace concentration may be present at the base. The artifact may be most pronounced at the base of the inferior and posterolateral walls, which, considering the normal anatomic position of the heart within the thorax, are furthest from the detector (Fig. 5-10). As for other attenuation artifacts, gating may be helpful to differentiate soft-tissue attenuation from scar. Normal wall motion and thickening of fixed basal perfusion defects in an obese patient favor the presence of attenuation artifacts rather than scar. Resolution recovery with or without attenuation correction likewise is helpful in circumventing this artifact.
Diaphragmatic Attenuation
The inferior wall of the LV of both men and women normally exhibits a decreased count density. This is most likely due to the attenuation of photons from the inferior wall of the LV by both the left hemidiaphragm and to a lesser degree the overlying right ventricle and right ventricular blood pool. In normal men, the anterior-to-inferior count-density ratio with 201Tl SPECT is 1.2:1.6 For 99mTc, the ratio is approximately 1:1.1 In women, the ratio is approximately unity with both 201Tl and 99mTc. This has been postulated to be due to the counterbalancing of inferior wall attenuation caused by the left hemidiaphragm in women by breast attenuation. However, it is doubtful whether that alone explains the difference, since the inferior-to-lateral wall ratio is also higher in women.
Infrequently, densities above or below the diaphragm may overlie the LV in planar projections used for SPECT reconstruction and result in attenuation artifacts. A left pleural effusion may attenuate the inferior and lateral walls of the LV. In patients with ascites, such as those with liver disease and those undergoing peritoneal dialysis, ascites fluid may accumulate below the left hemidiaphragm, elevating it and resulting in attenuation of photons from the inferior wall of the LV.19 Patients with chest pain often undergo a battery of diagnostic tests that may include an upper gastrointestinal series with barium contrast. Occasionally, a loop of bowel containing barium may be superimposed on a portion of the left ventricle in the planar images used for SPECT reconstruction. Although very uncommon, such attenuation artifacts may be localized and mimic inferior wall perfusion defects.
SPECT image acquisitions in which the patient’s position is altered to shift the level of the diaphragm and thereby minimize diaphragmatic attenuation have helped to increase diagnostic specificity. Upright imaging will cause the diaphragm to shift downward. Imaging in the prone position is generally well tolerated by patients.21 In the prone position, the heart shifts anteriorly to a slight degree, and the diaphragm and subdiaphragmatic contents are pushed down. There is also generally less motion of the anterior portion of the chest in the prone position and less upward creep.21 Furthermore, the depth of respiration decreases, minimizing respiratory motion of the heart. Inferior myocardial perfusion defects noted with the patient supine but that are absent from prone images most likely represent diaphragmatic attenuation artifacts (Fig. 5-13).
Tracer washout and redistribution occur rapidly in stress 201Tl SPECT, making it infeasible to repeat stress images in the prone position. Delayed redistribution images can be repeated with the patient in the prone position without appreciable tracer washout. However, this does not permit the differentiation of an attenuation artifact from a reversible ischemic abnormality. For that reason, some investigators have advocated prone imaging as an alternative to supine imaging in selected patients in whom diaphragmatic attenuation is anticipated.21,22 However, the physician must be cautious in interpreting routine prone SPECT myocardial perfusion images, because in the prone position, the heart lies more anteriorly than in the supine position, and there may be alterations in the geometric relationships between the detector and the heart. With the more anterior position of the heart, the anterior wall and septum may lie closer to the detector, thereby increasing the apparent anterior and septal count density. Because of this, supine SPECT studies should not be compared to a normal supine SPECT database for purposes of quantitative analysis. Also, artifactual perfusion decrease in the anteroseptal wall, probably secondary to increased sternal attenuation, has been reported.22
APPARENT WORSENING OF ATTENUATION ARTIFACTS IN LOW-DOSE REST IMAGES
Apart from the systematic approach of inspecting rotating projection images, viewing tomographic slices and polar plots or three-dimensional reconstructions, and observing wall motion and wall thickening in gated tomograms, another clue to a defect being attributable to soft-tissue attenuation is “pseudo–reverse distribution” in low-dose resting images (see Fig. 5-9).23 The cause of this apparent worsening of attenuation artifacts in lower-dose resting images is most likely attributable to the filters routinely used to process data using filtered backprojection. In obese patients with low count-density images, it has been demonstrated that both breast and diaphragmatic attenuation artifacts may appear more marked in the lower count-density resting images acquired using a rest/stress 1-day protocol employing 99mTc-myocardial perfusion radiopharmaceuticals.
ADVANTAGES AND POTENTIAL DISADVANTAGES OF ATTENUATION CORRECTION IN RESOLVING ATTENUATION ARTIFACTS (See Chapters 6 and 7)
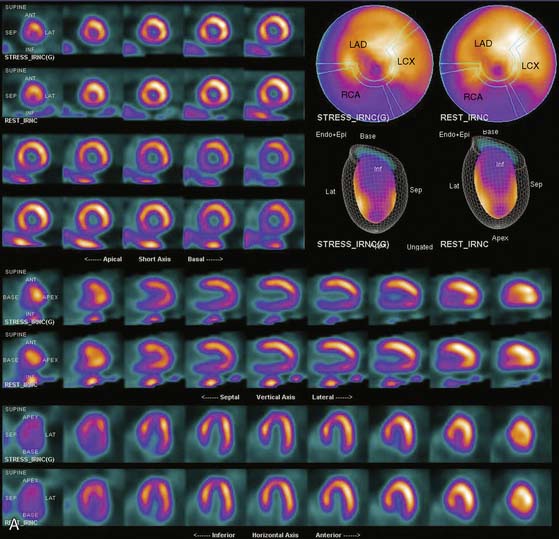
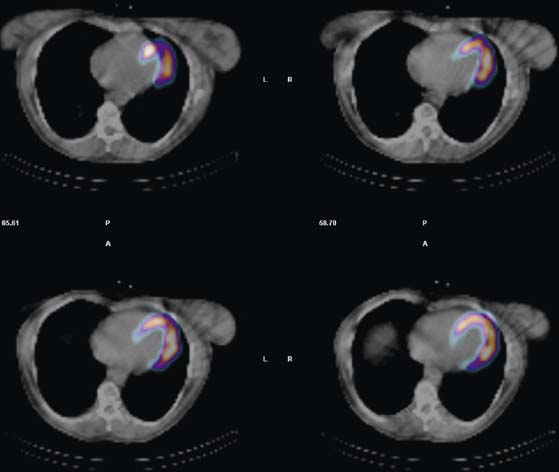
Attenuation correction using Gd-153 line sources or x-ray transmission sources are beneficial in differentiating attenuation artifacts from true perfusion defects. Currently, however, attenuation correction is in limited use because of the cost of the transmission sources or additional equipment and the fact that the method is presently not reimbursed by third-party payers. Also, there are artifacts unique to attenuation correction. If the emission and transmission scans are misregistered, significant myocardial perfusion artifacts may occur that mimic CAD24,25 (Fig 5-14). This is particularly problematical for x-ray attenuation methods where the transmission and emission scans are acquired sequentially as opposed to scanning line sources where the scans are “interleaved.” Therefore, careful quality control of image registration is essential. In addition, scatter from subdiaphragmatic structures (see later) may be accentuated with attenuation correction, further confounding evaluation of the inferior wall of the LV.
SCATTERED ABDOMINAL VISCERAL ACTIVITY
In polar maps and some visual displays, as well as with quantitative analysis, SPECT images are normalized to the region of the myocardium having the greatest count density. If liver, stomach, or other abdominal visceral activity is superimposed upon the inferior wall, images will be incorrectly normalized to this area, making other areas of the heart appear count deficient. Therefore, visual or quantitative analysis may incorrectly identify defects in areas remote from the superimposed abdominal visceral activity (Fig. 5-15).
For exercise images, abdominal tracer concentration can be minimized by ensuring that patients perform maximal exercise, resulting in the shunting of blood from the liver to the working skeletal musculature. For adenosine or dipyridamole, the added performance of dynamic, submaximal exercise (walking, pedaling, etc.) has been shown to significantly decrease tracer concentration in the liver in immediate images.26 Exercise is performed during adenosine infusion or immediately after the infusion of dipyridamole, and the radiotracer is injected during exercise, at least 1 minute before its cessation. For 99mTc-sestamibi imaging, concentration in the liver decreases progressively after tracer injection, and injection-to-imaging times of 40 to 45 minutes for rest studies are recommended with this agent. For exercise 99mTc-tetrofosmin studies, the liver uptake is less problematic, and imaging at 20 to 30 minutes after injection is possible.
Compton scatter of photons by overlying soft tissue significantly degrades cardiac image resolution, decreases image contrast, and decreases spatial resolution, thereby potentially decreasing test sensitivity in detecting CAD. Software methods are under development that estimate and correct for the distribution of scatter from the energy spectrum of detected photons. A “triple energy window” is used, selecting not only the 99mTc photopeak but also two narrow windows above and below that photopeak. This scatter correction method has been demonstrated to improve myocardial perfusion contrast in SPECT scans acquired with and without attenuation correction and processed with either filtered backprojection or maximum-likelihood expectation maximum (MLEM).27–30
THE RAMP FILTER ARTIFACT
As an inherent component of filtered backprojection, the Ramp filter is used to eliminate the “star artifact” associated with reconstruction of a finite number of projection images. This filtering process minimizes count density adjacent to an intense object, thereby better delineating its borders and increasing its contrast. However, when the Ramp filter is applied to intense tracer concentration adjacent to the heart—frequently present in the liver, stomach, or bowel—there may be an artifactual decrease in count density in the inferior wall of the LV (Fig. 5-16). Because the distribution and intensity of subdiaphragmatic activity often varies between stress and resting images (like the artifact due to scattered activity), the Ramp filter artifact is likewise variable. Therefore, both scatter of subdiaphragmatic activity and the Ramp filter may produce fixed, reversible, or reverse-distribution inferior artifacts.
Because iterative reconstruction does not incorporate the Ramp filter, it has been proposed as a means to avoid the Ramp filter artifact. Preliminary results have demonstrated, for instance, that 99mTc-sestamibi images may be acquired early (15 minutes) after resting tracer injection and processed with iterative reconstruction without artifactual inferior-wall defects, despite considerable liver radiotracer concentration.31 However, not all nuclear medicine computer systems, particularly older models, are equipped with iterative reconstruction, so at the present time this alternative processing algorithm is not widely available.
MOTION ARTIFACTS (See Chapter 4)
Because of the process of filtered backprojection used for reconstructing SPECT images, cardiac motion relative to the detector can create image misregistration and artifact. Cardiac motion has several sources. As it contracts, the heart rotates physiologically on its axis. It is unlikely that such motion creates artifacts large enough to be recognized or misconstrued as perfusion abnormalities. A reversible 201Tl SPECT artifact may result from “upward creep” of the heart.32 A patient’s rate and depth of respiration increase markedly during dynamic exercise, resulting in more marked diaphragmatic excursion, increased lung volume, and a lower position of the diaphragm. If SPECT image acquisition is begun while the rate and depth of respiration are still increased, the position of the diaphragm and thus of the heart will be low. During the acquisition, as the depth of respiration decreases, the height of the diaphragm will progressively rise, with a gradual upward shift of the heart. Such cardiac motion will not be present in delayed resting images, when the rate of respiration is slower and more regular. Diaphragmatic creep artifacts are common with exercise 201Tl, in which exercise SPECT images are acquired immediately after dynamic exercise. A 15-minute delay between exercise and 201Tl image acquisition helps to allow for the respiratory rate to return to baseline. Diaphragmatic creep artifacts are avoided with pharmacologic stress, which does not significantly increase respiration, and with 99mTc-sestamibi or tetrofosmin SPECT, for which there is a delay between exercise and stress image acquisition.
Artifact location, configuration, and severity will depend on all of these factors.33–36 Cooper and colleagues evaluated the effect of patient motion in creating 201Tl SPECT image artifacts.34 The visual detectability of artifacts by experienced observers was directly proportional to the magnitude of motion. One-half pixel (3.25 mm) of motion was not visually detectable, 1 pixel of motion was recognized but judged to be clinically insignificant, and 2 pixels of motion resulted in artifacts potentially misconstrued as true perfusion defects. By quantitative analysis, 2 pixels of motion in the axial direction resulted in clinically significant artifacts in 5% of interpretations.
Patient motion is particularly problematic, because the location and severity of the resultant artifact depend not only on the magnitude of motion but also on its direction and the location within the 180-degree imaging arc. Cooper and coworkers observed that motion artifacts are more noticeable when axial motion occurs at the midpoint of the 180-degree acquisition.34 They postulated that this was because the backprojected images were more evenly split between projections of two different distributions of radioactivity, one before and one after movement. These authors also observed that sideways motion results in more marked artifacts when it occurs in the anterior view, when the heart is parallel to the camera, and results in the least artifacts in the lateral projection, when the heart is more oblique or perpendicular to the camera.
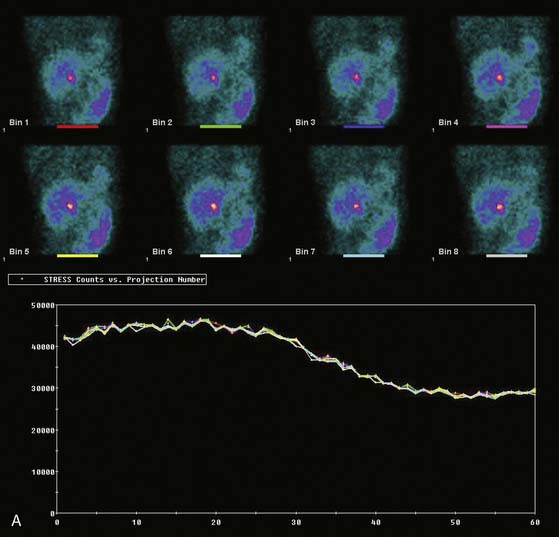
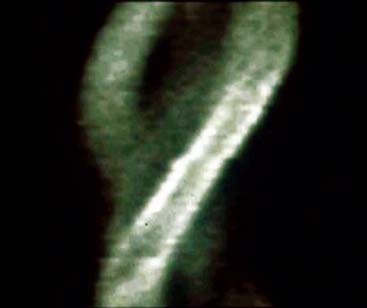
The most reliable method for detecting the degree, direction, and frequency of cardiac motion is to inspect the rotating planar images at the computer console. An alternate, somewhat less reliable method is to add the individual planar frames to produce a summed image in which the heart forms a horizontal “stripe” as it moves left (45-degree right anterior oblique [RAO] projection) to right (45-degree LPO projection) across the field of view. Although abrupt downward or upward motion and diaphragmatic creep are reliably detected by this technique, it is difficult to detect sideways motion, z-direction motion, “cardiac bounce,” or erratic up-and-down motion throughout the acquisition. A third method for detecting cardiac motion is by inspection of the cardiac sinogram (Fig. 5-17). The sinogram can be thought of as a “stack” of planar views in which the y axis has been compressed. In the initial 45-degree RAO projection, the vertically compressed cardiac activity is therefore positioned in the lower left corner of the image. As the heart moves rightward across the field of view, subsequent compressed cardiac images are “stacked” in a sinusoidal configuration (reflecting a one-dimensional projection of an object rotating in a circular or elliptical orbit). Discontinuity of the sinogram indicates abrupt patient motion. However, gradual continuous motion is usually not apparent on the sinogram.
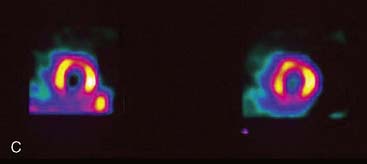
When cardiac motion occurs, misalignment of data by filtered backprojection often results in telltale artifacts in tomographic slices. The anterior and posterior walls of the LV may appear to be misaligned, with curvilinear tails of activity extending from the myocardium into adjacent background regions (Fig. 5-18).
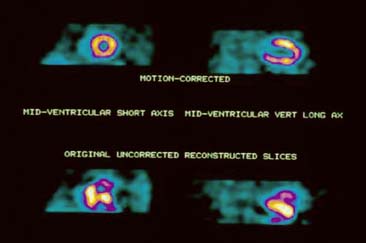
One method of correcting studies for motion is to manually shift individual image frames, so that the heart remains within a constant, horizontal plane. However, this technique is relatively tedious and time-consuming and not available on all computer workstations. Automated computer methods to correct cardiac motion are now commercially available.37–41 Their applicability may be limited if there is considerable concentration of tracer in the liver, which confounds the detection of myocardial borders.37,38 In addition, whereas motion in the vertical direction is reliably corrected either by manual or computer methods, horizontal, rotational, and z-direction motion are not reliably corrected. Importantly, studies can often be salvaged with motion correction, obviating the need for repeat acquisition, and in some cases, reinjection (Fig. 5-19). Nevertheless, despite the development of these methods, to date, visual inspection of the rotating planar images remains the most important physician- and technologist-dependent method of quality control in cardiac SPECT.
ARTIFACTS RELATED TO NONCORONARY HEART DISEASE
Myocardial Hypertrophy
Diffuse myocardial hypertrophy often results from systemic hypertension or the increased volume or pressure overload associated with valvular heart disease. Such hypertrophy results in a generalized increase in uptake of the radiopharmaceuticals used for studying myocardial perfusion. Regional myocardial hypertrophy will appear as a localized increase in image count density.42 If the tomographic slice or polar map is normalized to this region of increased count density, regions adjacent to and distant from the “hot spot” will appear to have relatively decreased count densities. Papillary muscle hypertrophy may occur in patients with LV hypertrophy, creating localized hot spots in the anterolateral and inferolateral wall. Occasionally there may be localized apical hypertrophy, in which case there may be an apical hot spot with a consequent relative decrease in count density in the more basal aspects of the LV (Fig. 5-20). Additionally, a relative increase in septal-wall count density is common in hypertensive patients.43 It is not clear whether this relative increase in septal count density is due to some degree of selective septal hypertrophy or to alterations in regional blood flow or metabolism in hypertensive patients. In patients with long-standing hypertension, a significant decrease in the lateral-to–septal wall count-density ratio as compared to that in normotensive controls has been reported.43 Thus, in tomographic slices, raw polar maps, and quantitative plots, the lateral wall often displays a relative decrease in count density, simulating CAD in the territory of the circumflex coronary artery (Fig. 5-21). This defect is usually “fixed” in stress and rest images obtained with either 201Tl or 99mTc-labeled agents, mimicking myocardial infarction. However, occasionally the septum may appear slightly less intense in resting images, rendering the defect partly reversible and raising a clinical suspicion of ischemia.
The physician interpreting the scan should anticipate this artifact in patients with hypertension. Therefore, it is important to obtain appropriate historical information. Similarly, the medical record should be examined for historical or echocardiographic evidence of idiopathic hypertrophic subaortic stenosis (IHSS) or asymmetric septal hypertrophy (ASH), which may produce a similar artifact. Moreover, inspection of the electrocardiograph (ECG) for evidence of LV hypertrophy is worthwhile. However, the standard voltage criteria are relatively insensitive to hypertrophy.44 In gated SPECT studies in hypertensive patients without CAD, areas of relatively decreased count density, usually involving the lateral wall, will move and thicken vigorously.
Left Bundle Branch Block (See Chapter 16)
In exercise myocardial perfusion studies, reversible septal perfusion defects occur in patients with left bundle branch block (LBBB), mimicking exercise-induced septal ischemia. Such artifacts have been reported to occur in 30% to 90% of cases of LBBB, depending on whether visual or quantitative analysis was applied.45,46 Hirzel and associates demonstrated in dog experiments that increased heart rates associated with right ventricular pacing, thus mimicking LBBB, result in a relative decrease in blood flow to the septum.47 This decrease was not seen in experiments using atrial pacing, which mimics the sinus tachycardia of exercise. These investigators postulated that the decrease in septal blood flow is due to asynchronous relaxation of the septum, which is out of phase with diastolic filling of the remainder of the ventricle, during which coronary perfusion is maximal. At higher heart rates, the degree of septal asynchrony relative to the ECG R-R interval is greater than at rest, making septal perfusion defects appear reversible (Fig. 5-22). It has been reported that the severity of reversible perfusion defects is most marked in LBBB patients who achieve very high heart rates (>170 beats/min).45
It has been observed that perfusion defects associated with LBBB in patients without CAD spare the apex.48 Thus, if an apical defect is present in a patient with LBBB, disease of the left anterior descending (LAD) coronary artery should be suspected. Also, quantitative techniques that analyze relative count density in only the more basal aspect of the septum have been reported to increase the specificity of detection of LAD CAD.49 Perfusion abnormalities in the territories of the right and circumflex arteries carry a high sensitivity for the presence of CAD, despite the presence of LBBB.45 Similar artifacts have not been reported for right bundle branch block (RBBB) or left anterior hemiblock. Thus, to anticipate reversible septal perfusion artifacts, it is imperative that the interpreting physician inspect the ECG tracing or report for the presence of LBBB.
It has been reported that septal artifacts associated with LBBB can be minimized by substituting pharmacologic stress with intravenous dipyridamole for exercise.50,51 Because dipyridamole and adenosine have only a slight positive chronotropic effect, increasing the heart rate by only approximately 10 beats/min in most patients, there is little increase in septal asynchrony relative to the R-R interval. Thus, septal perfusion is kept relatively constant with dipyridamole and adenosine stress, and septal artifacts are avoided. In contrast, dobutamine has a positive inotropic effect, so this pharmacologic agent should be avoided in LBBB patients. However, it should be cautioned that patients undergoing dipyridamole occasionally have high resting heart rates due to underlying medical conditions, and that in other individuals there may be a marked increase in heart rate associated with the infusion of pharmaceuticals. Therefore, septal artifacts may nonetheless be expected to occur if such patients also have LBBB. In most patients, it is advisable to perform low-level exercise in conjunction with dipyridamole and adenosine pharmacologic stress to minimize side effects and shunt blood away from the abdominal viscera to the working musculature. However, because of the associated increase in heart rate effected by low-level exercise, it should be avoided in LBBB patients.
SUMMARY
The list of technical and clinical circumstances that can result in SPECT image artifacts is considerable.52 To avoid artifacts and optimize test specificity, both the technologist and interpreting physician must be aware of factors potentially contributing to the creation of artifacts.
1. Nichols K., Yao S.S., Kamran M., et al. Clinical impact of arrhythmias on gated SPECT cardiac myocardial perfusion and function assessment. J Nucl Cardiol. 2001;37:458.
2. Maddahi J., Kiat H., Van Train K., et al. Myocardial perfusion imaging with technetium-99m sestamibi SPECT in the evaluation of coronary artery disease. Am J Cardiol. 1990;66:55E-62E.
3. Manglos S.H., Thomas F.D., Gagne G.M., et al. Phantom study of breast tissue attenuation in myocardial imaging. J Nucl Med. 1993;34:992-996.
4. DePuey E.G., Rozanski A. Using gated technetium-99m sestamibi SPECT to characterize fixed myocardial defects as infarct or artifact. J Nucl Med. 1995;36:952-955.
5. Smanio P.E., Watson D.D., Segalla D.L., et al. Value of gating of technetium-99m sestamibi single-photon emission computed tomographic imaging. J Am Coll Cardiol. 1997;29:69-77.
6. DePasquale E.E., Nody A.C., DePuey E.G., et al. Quantitative rotational thallium-201 tomography for identifying and localizing coronary artery disease. Circulation. 1988;77:316-327.
7. Malko J.A., Van Heertum R.L., Gullberg G.T., et al. SPECT liver imaging using an iterative attenuation correction algorithm and an external flood source. J Nucl Med. 1986;27:701-705.
8. Bailey D.L., Hutton B.F., Walter P.J. Improved SPECT using simultaneous emission and transmission tomography. J Nucl Med. 1987;28:844-851.
9. Galt J.R., Cullum S.J., Garcia E.V. SPECT quantification: A simplified method of attenuation and scatter correction for cardiac imaging. J Nucl Med. 1992;33:2232-2237.
10. Manglos S.H., Bassano D.A., Thomas F.D. Cone-beam transmission CT for nonuniform attenuation compensation of SPECT images. J Nucl Med. 1991;32:1813-1820.
11. Tung C.-H., Gullberg G.T., Zeng G.L., et al. Nonuniform attenuation correction using simultaneous transmission and emission converging tomography. IEEE Trans Nucl Sci. 1992;39:1134-1143.
12. Manglos S.H., Bassano D.A., Thomas F.D., et al. Imaging of the human torso using cone beam transmission CT implementation on a rotating gamma camera. J Nucl Med. 1992;33:150-156.
13. Corbett J.R., Ficaro E.P. Clinical review of attenuation-corrected cardiac SPECT. J Nucl Cardiol. 1999;6:54-68.
14. Kluge R., Seese A., Sattler B., Knapp W.H. Non-uniform attenuation correction for myocardial SPECT using two Gd-153 line sources. Nuklearmedizin. 1996;35:205-211.
15. Kluge R., Sattler B., Seese A., et al. Attenuation correction by simultaneous emission-transmission myocardial single-photon emission tomography using a technetium-99m-labelled radiotracer: Impact on diagnostic accuracy. Eur J Nucl Med. 1997;24:1107-1114.
16. He Z.X., Lakkis N.M., America Y., et al. Qualitative and quantitative comparison of sestamibi SPECT without and with attentuation correction for detection of coronary artery disease in patients with large body habitus [abstract]. J Am Coll Cardiol. 1997;29:302A.
17. Hendel R.C., Berman D.S., Cullom S.J., et al. Multicenter trial to evaluate the efficacy of correction for photon attenuation and scatter in SPECT myocardial perfusion imaging. Circulation. 1999;99:2742-2749.
18. Links J.M., DePuey E.G., Taillefer R., et al. Attenuation correction and gating synergistically improve the diagnostic accuracy of myocardial perfusion SPECT. J Nucl Cardiol. 2001;8:G1-G58.
19. Rab S.T., Alazraki N.P., Guertler-Krawczynska E. Peritoneal fluid causing inferior attenuation on SPECT thallium-201 myocardial imaging in women. J Nucl Med. 1988;29:1860-1864.
20. Johnstone D., Wakers F., Berger H., et al. Effect of patient positioning on left lateral thallium-201 myocardial images. J Nucl Med. 1979;20:183-188.
21. Machac J., George T. Effect of 360 SPECT prone imaging on Tl-201 myocardial perfusion studies. J Nucl Med. 1990;31:812.
22. Kiat H., Van Train K.F., Friedman J.D., et al. Quantitative stress-redistribution thallium-201 SPECT using prone imaging: Methodologic development and validation. J Nucl Med. 1992;33:1509-1515.
23. Araujo W., DePuey E.G., Kamran M., et al. Artifactual reverse distribution pattern in myocardial perfusion SPECT with Tc-99m sestamibi. J Nucl Cardiol. 2000;7:633-638.
24. Goetze S., Wahl W.L. Prevalence of misregistration between SPECT and CT for attenuation-corrected myocardial perfusion SPECT. J Nucl Cardiol. 2007;14:200-206.
25. Goetz S., Brown T.L., Lavely W.C., et al. Attenuation correction in myocardial perfusion SPECT/CT: Effects of misregistration and value of reregistration. J Nucl Med. 2007;48:1090-1095.
26. Stern S., Greenberg D., Corne R. Effect of exercise supplementation on dipyridamole thallium 201 image quality. J Nucl Med. 1992;33(Suppl):1559.
27. Zaidi H., Koral K.F. Quantitative Analysis in Nuclear Medicine Imaging. New York: Springer-Verlag, 2005.
28. Kojima A., Matsumoto M., Tomiguchi S., et al. Accurate scatter correction for transmission computed tomography using an uncollimated line array source. Ann Nucl Med. 2004;18:45-50.
29. Changizi V., Takavar A., Babakhani A., Sohrabi M. Scatter correction for heart SPECT images using TEW method. J Appl Clin Med Phys. 2008;9:136-140.
30. Khalil M., Brown E., Heller E. Does scatter correction of cardiac SPECT improve image quality in the presence of high extracardiac activity? J Nucl Cardiol. 2004;11:424-434.
31. Lewin H.C., Hyun M.E., DePuey E.G., et al. Validation of a very rapid rest/stress 1 day Tc-99m sestamibi stress protocol. J Nucl Cardiol. 2003;10:24S.
32. Friedman J., Van Train K., Maddahi J., et al. “Upward creep” of the heart: A frequent source of false-positive reversible defects during thallium-201 stress-redistribution SPECT. J Nucl Med. 1989;30:1718-1722.
33. Friedman J., Berman D.S., Van Train K., et al. Patient motion in thallium-201 myocardial SPECT imaging. An easily identified frequent source of artifactual defect. Clin Nucl Med. 1988;13:321-324.
34. Cooper J.A., Neumann P.H., McCandless B.K. Effect of patient motion on tomographic myocardial perfusion imaging. J Nucl Med. 1992;13:1566-1571.
35. Botvinick E.H., Zhu Y.Y., O’Connell W.J., et al. A quantitative assessment of patient motion and its effect on myocardial perfusion SPECT images. J Nucl Med. 1993;34:303-310.
36. Prigent F.M., Hyun M., Berman D.S., et al. Effect of motion on thallium-201 SPECT studies: A simulation and clinical study. J Nucl Med. 1993;34:1845-1850.
37. Eisner R.L., Churchwell A., Noever T., et al. Quantitative analysis of the tomographic thallium-201 myocardial bullseye display: Critical role of correcting for patient motion. J Nucl Med. 1988;29:91-97.
38. Geckle W.J., Frank T.L., Links J.M., et al. Correction for patient and organ movement in SPECT: Application to exercise thallium-201 cardiac imaging. J Nucl Med. 1986;27:899.
39. Eisner R.L., Noever T., Nowak D., et al. Use of cross-correlation function to detect patient motion during SPECT imaging. J Nucl Med. 1987;28:97-101.
40. Cooper J.A., Neumann P.H., McCandless B.K. Detection of patient motion during tomographic myocardial perfusion imaging. J Nucl Med. 1993;34:1341-1348.
41. Germano G., Chua T., Kavanagh P.B., et al. Detection and correction of patient motion in dynamic and static myocardial SPECT using a multi-detector camera. J Nucl Med. 1993;34:1349-1355.
42. Galt J.R., Robbins W.L., Eisner R.L., et al. Thallium-201 myocardial SPECT quantitation: Effect of wall thickness. J Nucl Med. 1987;27:577.
43. DePuey E.G., Guertler-Krawczynska E., Perkins J.V., et al. Alterations in myocardial thallium-201 distribution in patients with chronic systemic hypertension undergoing single-photon emission computed tomography. Am J Cardiol. 1988;62:234-238.
44. Devereux R.B., Alonso D.R., Lutas E.M., et al. Echocardiographic assessment of left ventricular hypertrophy: Comparison of necropsy findings. Am J Cardiol. 1986;57:450-458.
45. DePuey E.G., Krawczynska E.G., Robbins W.L. Thallium-201 SPECT in coronary artery disease patients with left bundle branch block. J Nucl Med. 1988;29:1479-1485.
46. Burns R.J., Galligan L., Wright L.M., et al. Improved specificity of myocardial thallium-201 single-photon emission computed tomography in patients with left bundle branch block by dipyridamole. Am J Cardiol. 1991;68:504-508.
47. Hirzel H.O., Senn M., Nuesch K., et al. Thallium-201 scintigraphy in complete left bundle branch block. Am J Cardiol. 1984;53:764-769.
48. Matzer L.A., Kiat H., Friedman J.D., et al. A new approach to the assessment of tomographic thallium-201 scintigraphy in patients with left bundle branch block. J Am Coll Cardiol. 1991;17:1309-1317.
49. Civelek A.C., Gozukara I., Durski K., et al. Detection of left anterior descending coronary artery disease in patients with left bundle branch block. Am J Cardiol. 1992;70:1565-1570.
50. Rockett J.F., Chadwick W., Moinuddin M., et al. Intravenous dipyridamole thallium-201 SPECT imaging in patients with left bundle branch block. Clin Nucl Med. 1990;6:401-407.
51. Larcos G., Brown M.L., Gibbons R.J. Role of dipyridamole thallium-201 imaging in left bundle branch block. Am J Cardiol. 1991;68:1097-1098.
52. DePuey E.G., Garcia E.V. Optimal specificity of thallium-201 SPECT through recognition of imaging artifacts. J Nucl Med. 1989;30:441-449.

