[level-membership-for-critical-care-medicine-category]
222 Severity-of-Illness Indices and Outcome Prediction
Development and Evaluation
And he will manage the cure best who has foreseen what is to happen from the present state of matters.1
 Background
Predicting outcome is a time-honored duty of physicians, dating back at least to the time of Hippocrates.1 The need for a quantitative approach to outcome prediction, however, is more recent. Although the patient or family members will still want to know the prognosis, there is increasing pressure to measure and publicly report medical care outcomes. In today’s highly competitive healthcare environment, such information may be used to award contracts for care. Information of variable quality2 is readily available on the Internet. The U.S. Department of Health and Human Services maintains a hospital comparison website,3 and comparative information is also available from sites such as www.healthcarechoices.org.4 Local and regional initiatives to assess quality of care are also common. Some “report cards” specifically address the performance of intensive care units (ICUs) by adjusting outcomes using risk stratification systems, so it is essential that the clinician understand the science behind these systems5 and how risk adjustment models may properly be applied. A focus on performance assessment, however, may detract from other potential uses for risk stratification, including more precise risk-benefit decisions, prognostication, resource allocation, efficient assessment of new therapy and technology, and modifications to individual patient management based on severity of illness.
Prognostication based on clinical observation is affected by memory of recent events, inaccurate estimation of the relative contribution of multiple factors, false beliefs, and human limitations such as fatigue.6 An outcome prediction model, on the other hand, will always produce the same estimate from a given dataset and will correctly value the importance of relevant data. In an environment in which clinical judgment may later be reviewed for financial or legal issues, an objective prediction of outcome becomes especially important. Yet, even the best risk stratification tools can generate misleading data when misapplied.7 Discussed in this chapter are the methods by which models are developed, the application of commonly used models in clinical practice, and common reasons why observed outcome may not match predicted outcome in the absence of differences in the quality of care.8
Well-established general methods for stratifying clinical outcomes by the presenting condition of the patient include the ASA Physical Status Classification9 and the Glasgow Coma Scale (GCS).10 ICU-specific systems typically adjust for patient physiology, age, and chronic health condition; and they may also assess admitting diagnosis, location before ICU admission or transfer status, cardiopulmonary resuscitation before admission, surgical status, and use of mechanical ventilation. An ideal approach to comparing outcomes would use variables that characterize a patient’s initial condition, can be statistically and medically related to outcome, are easy to collect, and are independent of treatment decisions.
 Outcome of Interest
Mortality is a commonly chosen outcome because it is easily defined and readily available. Mortality is insufficient as the sole outcome measure, however, because it does not reflect important issues such as return to work, quality of life, or even costs, because early death results in a lower cost than prolonged hospitalization. There is poor correlation between hospital rankings based on death and those based on other complications.7,11 ICU length of stay is difficult to use as a proxy for quality of care, because the frequency of distribution is usually skewed and mean length of stay is always higher than median owing to long-stay outliers.12 Morbidities such as myocardial infarction, prolonged ventilation, stroke or other central nervous system complications, renal failure, and serious infection can be difficult to collect accurately, and administrative records may not reflect all relevant events.8 There is also little standardization on how morbidity should be defined.
Other potential outcomes include ICU or hospital length of stay, resource use, return to work, quality of life, and 1- or 5-year survival. Patient satisfaction is an outcome highly valued by purchasers of health care, but it is subjective13 and requires substantial effort to accomplish successfully.14 Evaluation of ICU performance may require a combination of indicators, including severity of illness and resource utilization.15
 Databases and Definitions
The quality of a risk stratification system depends on the database on which it was developed. Outcome analysis can either be retrospective, relying on existing medical records or administrative databases, or developed prospectively from data collected concurrently with patient care. Retrospective studies using existing data are quicker and less expensive to conduct but may be compromised by missing data,8 imprecise definitions, interobserver variability,16 and changes in medical practice over time.17
Data derived from discharge summaries or insurance claims do not always capture the presence of comorbid disease18 and may be discordant with data that are clinically collected.19 Because some administrative discharge reports truncate the number of reportable events, diagnoses may be missed, and this coding bias is most apparent in severely ill patients.12 Coding errors and use of computer programs to optimize diagnosis-related group reimbursement can also reduce the validity of claims-derived data. Augmentation of administrative data with laboratory values improves model performance.20
A variety of methods can assess the quality of the database, such as reabstraction of a sample of charts by personnel blinded to the initial results and comparison to an independent database. Kappa analysis is a method for quantifying the rate of discrepancies between measurements (values) of the same variable in different databases (i.e., original and reabstracted). A kappa value of 0 represents no (or random) agreement, and 1.0 is perfect agreement, but this statistic must be interpreted in light of the prevalence of the factor being abstracted.21
 Model Development
Once data integrity is ensured, there are a number of possible approaches to relating outcome to presenting condition. The empirical approach is to use a large database and subject the data to a series of statistical manipulations (Box 222-1). Typically, death, a specific morbidity, and resource consumption are chosen as outcomes (dependent variables). Factors (independent variables) thought to affect outcome are then evaluated against a specific outcome using univariate tests (chi-square, Fisher’s exact, or Student t-test) to establish the magnitude and significance of any relationship.
Independent variables should ideally reflect patient condition independent of therapeutic decisions. Measured variables such as “cardiac index” or “hematocrit” are preferred over “use of inotropes” or “transfusion given,” because the criteria for intervention may vary by provider or hospital. Widely used models rely on common measured physiologic variables (heart rate, blood pressure, and neurologic status) and laboratory values (serum creatinine level and white blood cell count). In addition, variables may consider age, physiologic reserve, and chronic health status. Items chosen for inclusion in a scoring system should be readily available and relevant to clinicians involved in the care of these patients, and variables that lack either clinical or statistical bearing on outcome should not be included. This requirement may necessitate specialized scoring systems for patient populations (pediatric, burn and trauma, and possibly acute myocardial infarction patients) exhibiting different characteristics than the general ICU population. For example, left ventricular ejection fraction and reoperative status are important predictors of outcome in the cardiac surgical population but are not routinely measured or not directly relevant to other population groups.22 If the independent variable is dichotomous (yes/no, male/female), a two-by-two table can be constructed to examine the odds ratio and a chi-square test performed to assess significance (Table 222-1). If multiple variables are being considered, the level of significance is generally set smaller than P = .05, using a multiple comparison (e.g., Bonferroni) correction23 to determine a more appropriate P value.
TABLE 222-1 Two-by-Two Contingency Table Examining Relationship of MOF After Open Heart Surgery (Outcome) to a History of CHF (Predictor) in 3830 Patients*
| Predictor Variable: History of CHF | Outcome Variable: MOF | |
|---|---|---|
| YES | NO | |
| Yes | 121 | 846 |
| No | 166 | 2697 |
CHF, congestive heart failure; MOF, multiple organ failure.
* The odds ratio is defined by cross-multiplication (121 × 2697) ÷ (846 × 166). The odds ratio of 2.3 indicates patients with CHF are 2.3 times as likely to develop postoperative organ system failure as those without prior CHF. This univariate relationship can then be tested by chi-square for statistical significance.
Data from Higgins TL, Estafanous FG, Loop FD et al. ICU admission score for predicting morbidity and mortality risk after coronary artery bypass grafting. Ann Thorac Surg 1997;64:1050–8.
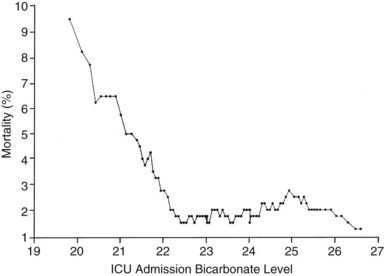
If the independent variable under consideration is a continuous variable (e.g., age) a Student’s t-test is one appropriate choice for statistical comparison. With continuous variables, consideration must be given to the possibility that the relationship of the variable to outcome is not linear. Figure 222-1 demonstrates the relationship of ICU admission serum bicarbonate to mortality outcome in cardiac surgical patients,24 where the data points have been averaged with adjacent values to produce a locally weighted smoothing scatterplot graph.25 Serum bicarbonate values above 22 mmol/L at ICU admission imply a relatively constant risk. Below this value, the risk of death rises sharply. Analysis of this locally weighted smoothing scatterplot graph suggests two ways for dealing with the impact of serum bicarbonate on mortality. One would be to make admission bicarbonate a dichotomous variable (i.e., >22 mEq or <22 mEq). The other would be to transform the data via a logarithmic equation to make the relationship more linear. Cubic splines analysis,26 another statistical smoothing technique, may also be used to assign weight to physiologic variables.
Univariate analysis assesses the forecasting ability of variables without regard to possible correlations or interactions between variables. Linear discriminant and logistic regression techniques can evaluate and correct for overlapping influences on outcome. For example, a history of heart failure and depressed left ventricular ejection fraction are both empirical predictors of poor outcome in patients presenting for cardiac surgery.27 As might be expected, there is considerable overlap between the population with systolic heart failure and those with low ejection fraction. The multivariate analysis in this specific instance eliminates history of heart failure as a variable and retains only measured ejection fraction in the final equation.
Because linear discriminant techniques require certain assumptions about data, logistic techniques are more commonly utilized.4 Subjecting the data to multiple logistic regression will produce an equation with a constant, a β coefficient and standard error, and an odds ratio that represents each term’s effect on outcome. Table 222-2 displays the results of the logistic regression used in the Mortality Probability Model III ICU admission model (MPM0 III). There are 17 variable terms, and a constant term, each with a β value that when multiplied by presence or absence of a factor, becomes part of the calculation of mortality probability using a logistic regression equation. The odds ratios reflect the relative risk of mortality if a factor is present. The challenge in building a model is to include sufficient terms to deliver reliable prediction while keeping the model from being cumbersome to use or too closely fitted to its unique development population. Generally accepted practice is to limit the number of terms in the logistic regression model to 10% of the number of patients having the outcome of interest to avoid “overfitting” the model to the developmental dataset. It is important to identify interaction between variables that may be additive, subtractive (canceling), or synergistic and thus require additional terms in the final model. In the earlier example, seven interaction items were added to reflect important observations in elderly patients,28 who frequently have better outcomes than expected.
TABLE 222-2 Variables in the MPM0 III Logistic Regression Model
| Variable | Odds Ratios (95% Confidence Intervals) | Coefficients (Robust Standard Errors) |
|---|---|---|
| Constant | NA | −5.36283 (0.103) |
| Physiology | ||
| Coma/deep stupor (GCS 3 or 4) | 7.77* (5.921, 10.201) | 2.050514 (0.139) |
| Heart rate ≥150 bpm | 1.54 (1.357,1.753) | 0.433188 (0.065) |
| Systolic BP ≤90 mm Hg | 4.27* (3.393, 5.367) | 1.451005 (0.117) |
| Chronic Diagnoses | ||
| Chronic renal insufficiency | 1.71 (1.580, 1.862) | 0.5395209 (0.042) |
| Cirrhosis | 7.93* (4.820, 13.048) | 2.070695 (0.254) |
| Metastatic neoplasm | 24.65* (15.970, 38.056) | 3.204902 (0.222) |
| Acute Diagnoses | ||
| Acute renal failure | 2.32 (2.137, 2.516) | 0.8412274 (0.042) |
| Cardiac dysrhythmia | 2.28* (1.537, 3.368) | 0.8219612 (0.200) |
| Cerebrovascular incident | 1.51 (1.366, 1.665) | 0.4107686 (0.051) |
| GI bleed | 0.85 (0.763, 0.942) | −0.165253 (0.054) |
| Intracranial mass effect | 6.39* (4.612, 8.864) | 1.855276 (0.166) |
| Other | ||
| Age (per year) | 1.04* (1.037, 1.041) | 0.0385582 (0.001) |
| CPR prior to admission | 4.47* (2.990, 6.681) | 1.497258 (0.205) |
| Mechanical ventilation within 1 hour of admission | 2.27* (2.154, 2.401) | 0.821648 (0.028) |
| Medical or unscheduled surgical admit | 2.48 (2.269, 2.719) | 0.9097936 (0.046) |
| Zero factors (no factors other than age from list above) | 0.65 (0.551, 0.777) | −0.4243604 (0.088) |
| Full code | 0.45 (0.416, 0.489) | −0.7969783(0.041) |
| Interaction Terms | ||
| Age x Coma/deep stupor | 0.99 (0.988,0.997) | −0.0075284 (0.002) |
| Age x Systolic BP ≤ 90 | 0.99 (0.988, 0.995) | −0.0085197 (0.002) |
| Age x Cirrhosis | 0.98 (0.970, 0.986) | −0.0224333 (0.004) |
| Age x Metastatic neoplasm | 0.97 (0.961, 0.974) | −0.0330237 (0.003) |
| Age x Cardiac dysrhythmia | 0.99 (0.985, 0.995) | −0.0101286 (0.003) |
| Age x Intracranial mass effect | 0.98 (0.978, 0.988) | −0.0169215 (0.003) |
| Age x CPR prior to admission | 0.99 (0.983, 0.995) | −0.011214 (0.003) |
Odds ratios for variables with an asterisk (*) are also affected by the associated interaction terms.
CPR, cardiopulmonary resuscitation within 24 hours preceding admission; BP, blood pressure; bpm, beats per minute; GCS, Glasgow Coma Scale; “x” denotes interaction between each pair of variables listed.
Reprinted with permission from Higgins TL, Teres D, Copes WS et al. Assessing contemporary intensive care unit outcome: an updated mortality probability admission model (MPM0-III). Crit Care Med 2007;35:827–35.
The patient’s diagnosis is an important determinant of outcome,17 but conflicting philosophies exist on how disease status should be addressed by a severity adjustment model. One approach is to define principal diagnostic categories and add a weighted term to the logistic regression equation for each illness. This approach acknowledges the different impact of physiologic derangement by diagnosis. For example, patients with diabetic ketoacidosis have markedly altered physiology but a low expected mortality; a patient with an expanding abdominal aneurysm may show little physiologic abnormality and yet be at high risk for death or morbidity. Too many diagnostic categories, however, may result in too few patients in each category to allow statistical analysis for a typical ICU, and such systems are difficult to use without sophisticated (and often proprietary) software.
The other approach is to ignore disease status and assume that factors such as age, chronic health status, and altered physiology will suffice to explain outcome in large groups of patients. This method avoids issues with inaccurate labeling of illness in patients with multiple problems and the need for lengthy lists of coefficients but could result in a model that is more dependent on having an “average” case mix.29,30 Regardless of the specific approach, age and comorbidities (metastatic or hematologic cancer, immunosuppression, and cirrhosis) are given weight in nearly all ICU models to help account for the patient’s physiologic reserve or ability to recover from acute illness.
 Validation and Testing Model Performance
Models may be validated on an independent dataset or by using the development set with methods such as jackknife or bootstrap validation.31 Two criteria are essential in assessing model performance: calibration and discrimination. Calibration refers to how well the model tracks outcomes across its relevant range. A model may be very good at predicting good outcome in healthy patients and poor outcomes in very sick patients yet unable to distinguish outcome for patients in the middle range. The Hosmer-Lemeshow goodness-of-fit test32 assesses calibration by stratifying the data into categories (usually deciles) of risk. The number of patients with an observed outcome is compared with the number of predicted outcomes at each risk level. If the observed and expected outcomes are very close at each level across the range of the model, the sum of chi-squares will be low, indicating good calibration. The P value for the Hosmer-Lemeshow goodness-of-fit increases with better calibration and should be nonsignificant (i.e., >.05). Special precautions apply to using the Hosmer-Lemeshow tests with very large databases.33
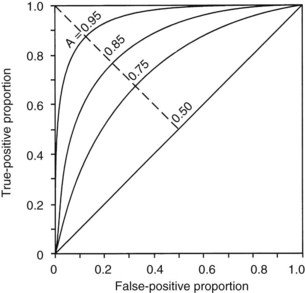
The second measurement of model performance is discrimination, or how well the model predicts the correct outcome. A classification table (Table 222-3) displays four possible outcomes that define sensitivity and specificity of a model with a binary (died/survived) prediction and outcome. Sensitivity (the true-positive rate) and specificity (the true-negative rate, or 1—the false-positive rate) are measures of discrimination but will vary according to the decision point chosen to distinguish between outcomes when a model produces a continuous range of possibilities. The sensitivity and specificity of a model when using 50% as the decision point will differ from that using 95% as the decision point. The classification table can be recalculated for a range of outcomes by choosing various decision points: for example, 10%, 25%, 50%, 75%, and 95% mortality risk. At each decision point, the true-positive rate (proportion of observed deaths predicted correctly) and the false-negative (proportion of survivors incorrectly predicted to die) and overall correct classification rate can be presented. The C-statistic, or area under a receiver-operating characteristic (ROC) curve, is a convenient way to summarize sensitivity and specificity at all possible decision points. A graph of the true-positive proportion (sensitivity) against the false-positive proportion (1—specificity) across the range of the model produces the ROC curve (Figure 222-2). A model with equal probability of producing the correct or incorrect result (e.g., flipping a coin) will produce a straight line at a 45-degree angle that encompasses half of the area (0.5) under the “curve.” Models with better discrimination will incorporate increasingly more area under the curve to a theoretical maximum of 1.0. Most ICU models have ROC areas of 0.8 to 0.9 in the development set, although the ROC area usually decreases when models are applied prospectively to new datasets. The ROC analysis is valid only if the model has first been shown to calibrate well.
| Predicted Outcome | Actual Outcome | |
|---|---|---|
| DIED | SURVIVED | |
| Died | a | c |
| Survived | b | d |
| True-positive ratio = a/(a + b) (sensitivity) | ||
| False-positive ratio = c/(c + d) | ||
| True-negative ratio = d/(c + d) (specificity) | ||
| False-negative ratio = b/(a + b) | ||
| Accuracy (total correct prediction) = (a + d)/a + b + c + d | ||
Adapted from Ruttiman UE. Severity of illness indices: development and evaluation. In: Shoemaker WC, editor. Textbook of critical care medicine. 2nd ed. Philadelphia: Saunders; 1989.
A model may discriminate and calibrate well on its development dataset yet fail when applied to a new population. Discrepancies in performance can relate to differences in surveillance strategies and definitions34 and can occur when a population is skewed by an unusual number of patients having certain risk factors, as could be seen in a specialized ICU.29 Large numbers of low-risk ICU admissions will result in poor predictive accuracy for the entire ICU population.35 The use of sampling techniques (i.e., choosing to collect data randomly on 50% of patients rather than all patients) also appears to bias results.36 Models can also deteriorate over time, owing to changes in populations and medical practice. These explanations should be considered before concluding that quality of care is different between the original and later applications of a model.37
 Standardized Mortality Ratio
Application of a severity-of-illness scoring system involves comparison of observed outcomes with those predicted by the model. The standardized mortality ratio is defined as observed divided by expected mortality and is generally expressed as a mean value ± 95% confidence intervals (CIs), which will depend on the number of patients in the sample. Standardized mortality ratio values of 1.0 (± the CI) indicate that the mortality rate, adjusted for presenting illness, is at the expected level. Standardized mortality ratio values significantly lower than 1.0 indicate performance better than expected. Small differences in scores, as could be caused by consistent errors in scoring elements, timing of data collection, or sampling rate, have been shown to cause important changes in the standardized mortality ratio.36,38
 Models Based on Physiologic Derangement
Three widely utilized general-purpose ICU outcome systems are based on changes in patient physiology: the Acute Physiology and Chronic Health Evaluation (APACHE II,39 APACHE III,40 APACHE IV41), the Mortality Probability Models (MPM I,42 MPM II,43 MPM24,44 MPM0 III45), and the Simplified Acute Physiology Score (SAPS I,46 SAPS II,47 SAPS III48,49). These models are all based on the premise that as illness increases, patients will exhibit greater deviation from physiologic normal for a variety of common parameters such as heart rate, blood pressure, neurologic status, and laboratory values. Risk is also assigned for advanced age and chronic illness.
Acute Physiology and Chronic Health Evaluation
APACHE II was developed from data on 5815 medical and surgical ICU patients at 13 hospitals between 1979 and 1982. Severity of illness was assessed with 12 routine physiologic measurements plus the patient’s age and previous health status.39 Scoring was based on the most abnormal measurements during the first 24 hours in the ICU, and the maximum score is 71 points, although more than 80% of patients have scores of 29 or less.39 Although the developers consider APACHE II to have significant limitations based on its age, it is still in widespread use. APACHE II was developed on a database of medical and surgical patients that excluded patients undergoing coronary artery bypass grafting and coronary care, burn, and pediatric patients. The authors note that “it is crucial to combine the APACHE II score with a precise description of disease” and provide coefficients to adjust the score for 29 nonoperative and 16 postoperative diagnostic categories.39 They also caution that disease-specific mortality predictions be derived from at least 50 patients in each diagnostic category. These appropriate precautions have not always been observed in application of APACHE II.
Another common misunderstanding is to use APACHE II, calibrated for unselected ICU admissions, to assess outcome in a patient sample selected by other criteria, such as severe sepsis. The acute physiology score from APACHE III or a specifically developed model predicting 28-day mortality in sepsis are preferable for risk stratification of septic patients.50 APACHE II does not control for pre-ICU management, which could restore a patient’s altered physiology and lead to a lower score and thus underestimate a patient’s true risk. In a study of 235 medical patients scored with APACHE II, actual mortality was the same as predicted mortality only for patients admitted directly from the emergency department.51 The mortality rate was higher than predicted for transfers from hospital floors, step-down units, or other hospitals. Inclusion of data from the period before ICU admission increases severity of illness scores and thus increases estimated mortality risk, and this effect is greatest with medical patients and emergency admissions.52 Failure to consider the source of admission could thus lead to erroneous conclusions about the quality of medical care.51,52
APACHE III, published in 1991,40 addressed the limitations of APACHE II, including the impact of treatment time and location before ICU admission. The number of separate disease categories was increased from 45 to 78. APACHE III was developed on a representative database of 17,440 patients at 40 hospitals, including 14 tertiary facilities that volunteered for the study and 26 randomly chosen hospitals in the United States. As data accumulated from APACHE III users, the database expanded, and adjustments to coefficients were made to keep data relevant to current practice.17 APACHE III went through several iterations between 1991 and 2003 as part of this continuous updating. Compared with APACHE II, the ranges of physiologic “normal” are narrower with APACHE III and deviations are asymmetrically weighted to be more clinically relevant. Interactions between variables were considered, and five new variables (blood urea nitrogen, urine output, serum albumin, bilirubin, and glucose) were added, and version II variables serum potassium and bicarbonate were dropped. Information was also collected on 34 chronic health conditions, of which 7 (AIDS, hepatic failure, lymphoma, solid tumor with metastasis, leukemia/multiple myeloma, immunocompromised state, and cirrhosis) were significant in predicting outcome.
APACHE III scores range from 0 to 299, and a 5-point increase represents a significant increase in risk of hospital death. In addition to the APACHE III score, which provides an initial risk estimate, there is an APACHE III predictive equation that uses the APACHE III score and proprietary reference data on disease category and treatment location before ICU admission to provide individual risk estimates for ICU patients. Customized models were created for patient populations (e.g., cardiac surgical patients)53 excluded from the APACHE II. Overall correct classification for APACHE III at a 50% cut-point for mortality risk is 88.2%, with an ROC area of 0.90, significantly better than APACHE II.40 Sequential APACHE III scoring can update the risk estimate daily, allowing for real-time decision support, for example, predicting likelihood of ICU interventions over the next 24-hour period. The single most important factor determining daily risk of hospital death is the updated APACHE III score, but the change in the APACHE III score, the admission diagnosis, the age and chronic health status of the patient, and prior treatment are also important. A predicted risk of death in excess of 90% on any of the first 7 days is associated with a 90% mortality rate. APACHE III scores also can be tied to predictions for ICU mortality, length of stay, need for interventions, and nursing workload.
APACHE IV was published in 200641 to address deterioration in APACHE III performance that had developed despite periodic updating over 15 years. APACHE IV has excellent discrimination (ROC area = 0.88) and impressive calibration (Hosmer-Lemeshow C statistic 16.8, P = 0.08) with a sample size of 110,558 patients in the United States. The model includes 142 variables (Table 222-4), many of which were rescaled or revised compared with APACHE III. Using data from 2002-2003 with an observed mortality rate of 13.51, APACHE IV predicted a mortality rate of 13.55, whereas earlier versions of APACHE III predicted 14.64% and 16.90% mortality. A hospital using APACHE III software based on 1988-89 data would have congratulated themselves on a superb SMR of 0.799, where using APACHE IV would have revealed the true SMR to be a respectable but average 0.997, not significantly different than 1.0.
TABLE 222-4 Variables Used in Acute Physiology and Chronic Health Evaluation IV
| Variable | Coefficient | Odds Ratio |
|---|---|---|
| Emergency surgery | 0.2491 | 1.28 |
| Unable to access GCS | 0.7858 | 2.19 |
| Ventilated on ICU day 1 | 0.2718 | 1.31 |
| Thrombolytic therapy for acute myocardial infarction | −0.5799 | 0.56 |
| Rescaled GCS (15-GCS) | 0.0391 | 1.04 |
| 15-GCS = 0 | 1.00 | |
| 15-GCS = 1, 2, 3 | 1.04-1.12 | |
| 15-GCS = 4, 5, 6 | 1.17-1.26 | |
| 15-GCS = 7, 8, 9 | 1.31-1.42 | |
| 15-GCS = 10, 11, 12 | 1.48-1.60 | |
| PaO2/FIO2 ratio: | −0.00040 | 1.00 |
| ≤200 | 1.00-0.92 | |
| 201-300 | 0.92-0.89 | |
| 301-400 | 0.89-0.85 | |
| 401-500 | 0.85-0.82 | |
| 501-600 | 0.82-0.79 | |
| Chronic health items: | ||
| AIDS | 0.9581 | 2.61 |
| Cirrhosis | 0.8147 | 2.26 |
| Hepatic failure | 1.0374 | 2.82 |
| Immunosuppressed | 0.4356 | 1.55 |
| Lymphoma | 0.7435 | 2.10 |
| Myeloma | 0.9693 | 2.64 |
| Metastatic cancer | 1.0864 | 2.96 |
| Admission source: | ||
| Floor | 0.0171 | 1.02 |
| Other hospital | 0.0221 | 1.02 |
| Operating/recovery room | −0.5838 | 0.56 |
AIDS, acquired immunodeficiency syndrome; GCS, Glasgow Coma Scale; ICU intensive care unit.
Adapted with permission from Zimmerman JE, Kramer AA, McNair DS, Malila FM. Acute Physiology and Chronic Health Evaluation (APACHE) IV: hospital mortality assessment for today’s critically ill patients. Crit Care Med 2006;34:1297–1310.
APACHE IV relies on physiologic abnormalities to account for 66% of the model’s explanatory power. ICU admission diagnosis (using 116 categories) accounts for about 17%, with the remainder accounted for by age, chronic illness, location prior to admission, and interaction terms. As with any model, there are limitations to the use of APACHE IV. First, the increased complexity of the model makes it impossible to use without dedicated software. The data entry burden, however, can be mitigated by porting data into APACHE from a hospital’s clinical information system. Secondly, APACHE IV was developed and validated in ICUs in the United States, and international differences in ICU resources, triage policies, models of care, and bed availability would logically have an impact on benchmarking performance in a new environment.54,55 The authors also stress that “prediction for an individual contains variance” and that “a prediction is only an approximate indicator of an individual’s probability of mortality.”41 As an example, they mention that the 95% CIs around a predicted mortality of 5% would be 3.9% to 6.5%, and that the absolute ranges of CIs widen as the predicted rate increases. Furthermore, the aggregate SMR as a performance benchmark is affected by factors not directly related to quality of care, such as limitations on treatment, early discharge to subacute sites, and care prior to and following the ICU stay.41 APACHE IV produces a prediction once the patient has been in the ICU for 4 hours. If the patient should die, even before the 24-hour admission window, the prediction and outcome are still counted.
Mortality Probability Models
The original Mortality Probability Model (MPM) was developed on 755 patients at a single hospital using multiple logistic regression to assign weights to variables predicting hospital mortality.42 The MPM II models were developed on an international sample of 12,610 patients and then validated on a subsequent sample of 6514.43 MPM, like APACHE II, excludes pediatric, burn, coronary, and cardiac surgical patients and estimates hospital mortality risk based partly on physiologic derangement, using a smaller number of variables. However, MPM puts more weight on chronic illness, comorbidities, and age and less on acute physiologic derangement compared to APACHE. MPM models can use data obtained at ICU admission (MPM0) and also at the end of the first 24-hour period (MPM24), the latter being more comparable to APACHE. While APACHE generates a score and then with additional information converts that score into a probability estimate of survival, MPM directly calculates a probability of survival from the available data. Because this involves a logistic regression equation, it is difficult to accomplish at bedside without a computer or programmable calculator. The MPM24 variables account for differences in patients who remain in the ICU for 24 hours or longer versus those who die early or recover rapidly. This line of reasoning has been further extended to create 48- and 72-hour models.44 Additional variables in MPM24, MPM48, and MPM72 but not MPM0 are prothrombin time, urine output, creatinine, arterial oxygenation, continuing coma or deep stupor, confirmed infection, mechanical ventilation, or intravenous vasoactive drug therapy. Probability of death increases at 48 and 72 hours even if the MPM variables and coefficients are unchanged, implying that mortality risk is increasing in patients whose clinical profile remains unchanged over time.44 MPM48 and MPM72 adjust for this observation by changing the β0 (constant term) in the MPM24 equation. The most important difference between MPM and other systems is that the MPM0 produces a probability estimate that is available at ICU presentation and is independent of ICU treatment. MPM also does not require specifying a diagnosis, which can be an advantage in complex ICU patients but may also make it more susceptible to error with changes in case mix29 and generates, on average, a lower area under the ROC curve.
MPM0 II became the mortality benchmarking component for the Society of Critical Care Medicine’s (SCCM) Project IMPACT database, launched at the SCCM annual symposium in 1996. By 2002, it was apparent that mortality predictions based on mid-1980s results were outdated, at least in Project IMPACT hospitals where average SMRs had drifted to 0.85.56 MPM0 III was developed on a population of 124,855 patients in 135 ICUs at 98 Project IMPACT hospitals. Hospital mortality in this population was 13.8% versus 20.8% in the MPM0 II cohort.45 All of the 15 variables from MPM0 II remained associated with mortality, but the relative impact had changed. For example, gastrointestinal bleeding was no longer as serious a risk factor, presumably because of advances in resuscitation, endoscopic procedures, treatment of H. pylori, and availability of proton pump inhibitors since the original study. Two new variables were added: “full code” resuscitation status at ICU admission and “zero factor” or absence of all MPM0 II risk factors except age. Seven age interaction terms were added to reflect the declining marginal contribution of acute and chronic medical conditions to mortality risk in the elderly.28 Location and time prior to ICU admission were evaluated but did not improve model performance. With these changes, MPM0 III calibrated well (Hosmer-Lemeshow goodness-of-fit 11.62; P = 0.31) and had an area under the ROC curve of 0.823, similar to that of MPM0 II. While the ROC area is lower than with APACHE, MPM users do not need to specify a particular diagnosis, which may be difficult in a complex patient with multiple problems. The simplicity of data collection and ability to generate a prognosis soon after arrival (rather than at 24 hours) are advantages. Limitations of the MPM0 III include lower discrimination, use of a self-selected population of Project IMPACT participants in North America, and as with all models, applicability to groups of patients rather than individuals. While in theory, extreme case-mix differences might affect MPM performance, in practice, SMRs obtained using MPM0 III versus specially constructed subgroup models were nearly identical in the 135 ICUs studied.57 MPM0 III has been prospectively validated on an additional 55,459 patients at 103 adult ICUs in North America and calibrates well with more contemporary Project IMPACT hospitals (78 units participating in both studies plus 25 new participants).58 The Project IMPACT database was also used to update the resource utilization “Rapoport Teres” graph that plots severity-adjusted mortality versus severity-adjusted length of stay.59 The result of this update is that results from Project IMPACT hospitals are now centered around the 0,0 coordinates, reflecting mortality and resource utilization as expected instead of being skewed to the upper right corner, indicating most hospitals performing better than expected.
Simplified Acute Physiology Score
The Simplified Acute Physiology Score (SAPS) was developed on a population of 679 consecutive patients admitted to 8 multidisciplinary ICUs in France and, like the APACHE systems, uses the most abnormal values collected during the first 24 hours after ICU admission.46 SAPS II was developed on 13,152 patients at 137 adult medical or surgical ICUs in Europe and North America, sharing the MPM II dataset. Like MPM and APACHE II, SAPS excludes burn patients, patients younger than 18 years, coronary care patients, and cardiac surgery patients. The outcome measure for SAPS II is vital status at hospital discharge. Seventeen variables were used in the SAPS II model: 12 physiologic variables, age, type of admission, and the presence of AIDS, metastatic cancer, or hematologic malignancy.
Not surprisingly, the SAPS II model also drifted out of calibration over time.48 SAPS III, a multicenter, multinational study, collected data on 19,577 patients from 307 ICUs during the fall of 2002.48 Data were collected at admission, on ICU days 1, 2, and 3, and the last day of ICU stay. SAPS II, when applied to this cohort, underestimated hospital mortality, and whereas it discriminated well (ROC area 0.83), calibration was poor, and model performance also differed by geographic region. The final SAPS III model (Box 222-2), created on 16,784 patients using logistic regression methods, contains 20 variables and has good discrimination (ROC area 0.848) and calibration (Hosmer-Lemeshow C = 14.29; P = 0.16).49 Customized models were generated for seven worldwide regions to address geographic variation in population outcomes, thought to be driven in part by availability of resources.60
Icnarc Model
As SAPS III and other studies61,62 have shown, risk-adjustment models require validation and recalibration if they are to be applied in a new geographic setting. The Intensive Care National Audit and Research Center (ICNARC) collected data on 216,626 critical care admissions in 163 adult general critical care units in England, Wales, and Northern Ireland from December 1996 to August 2003.63 Logistic regression techniques were used to create the ICNARC model (Box 222-3), which includes 12 physiologic variables, age, source of admission, diagnostic category, and CPR status. This model has an ROC area of 0.863 and a Hosmer-Lemeshow C statistic of 64.2, which, although significant, must be interpreted in light of known issues with this test when applied to extremely large samples.33 This study also evaluated performance of APACHE II, APACHE III, SAPS II and MPM II on the same population. The ICNARC outperformed all other models in terms of discrimination (ROC area), but SAPS II had better calibration, while MPM II had the best accuracy of average prediction, although these differences were all relatively minor. ICNARC, having no exclusions, may be applied to all critical care admissions regardless of diagnosis, and it calibrates well in the United Kingdom.
Adapted with permission from Harrison DA, Gareth JP, Carpenter JR et al. A new risk prediction model for critical care: the Intensive Care National Audit & Research Centre (ICNARC) model. Crit Care Med 2007;35:1091-8.
Veterans Affairs Icu Risk Adjustment Model
Arguably, the Veterans Affairs (VA) population in the United States could represent a specialized population, owing to being predominantly male (>97%). The VA developed its own automated ICU risk adjustment tool in 1996-9764 and validated, updated, and recalibrated this model recently.65 Risk predictors include age, mutually exclusive ICD-9 diagnosis/procedure groups, comorbid disease groups, admission source, and 11 laboratory values measured during the 24 hours surrounding ICU admission. Revisions to the model refit the predictor coefficients and expanded the number of diagnostic categories from 38 to 84. The model has an impressive ROC area (0.874-0.877) in two data cohorts and calibrates well by Hosmer-Lemeshow statistics. SMRs derived from the VA ICU model correlate well (r2 = 0.74) with those of the National Surgical Quality Improvement Performance (developed for surgical postoperative assessment). The model, however, has not yet been tested outside of the VA population or internationally.
Specialized Models
APACHE II, MPM, and SAPS, although useful for general medical/surgical ICUs, exclude patients younger than age 18, burn patients, coronary care, and cardiac surgical patients. Murphy-Filkins and colleagues29 demonstrated that performance of severity of illness models deteriorates when critical population values are reached for individual scoring variables, as might be seen in a highly specialized ICU. Twenty percent of the patients in the MPM II database were aged 75 or older. When this percentage of elderly patients was experimentally increased to 42%, the model became unstable. Similar changes were seen if the proportion of patients with cardiac dysrhythmias, cerebrovascular disease, intracranial mass effects, coma, cardiopulmonary resuscitation before ICU admission, emergency admission, or gastrointestinal bleeding rose above their individual critical values.29 Thus, severity-of-illness scoring systems should be used with caution when units become highly specialized to care for subsets of patients. The European Consensus Conference recommends that severity indices be validated and customized if needed when applied to a new setting such as a particular country or specialized type of ICU.66
To address this problem, specific models have been developed for pediatric,67 trauma,68,69 and cardiac surgical populations.24,70 The cardiac surgical population differs from the general ICU population because admission physiology data can be misleading in a population routinely subjected to hypothermia, hemodilution, and deliberate control of hemodynamics by the operating room team. Important variables for predicting outcome in cardiac surgery include ventricular function, coronary anatomy, and heart valve pathology and reoperation status.24 The Cooperative CABG Database Project, analyzing 172,000 patients, identified seven core variables (urgency of operation, age, prior heart surgery, gender, ejection fraction, percent stenosis of the left main coronary artery, and number of major coronary arteries with greater than 70% stenosis) to be predictive of mortality.70 An additional 13 variables influence outcome to a lesser extent. These variables include recent angioplasty or myocardial infarction, history of angina, ventricular arrhythmias, CHF, mitral regurgitation, and coexisting diseases such as diabetes, cerebral vascular disease, peripheral vascular disease, chronic obstructive pulmonary disease, and renal dysfunction. At least 10 cardiac surgical models exist22,24,27,53,70–72; head-to-head comparisons have demonstrated international differences in sensitivity and specificity and marked discrepancies in individual patient prediction.73,74 The independent variables predicting morbidity do not perfectly overlap those predicting mortality or length of stay, suggesting that multiple risk scores may be required to best predict various outcomes. The preoperative cardiac surgical models are useful for evaluating the results of an entire hospitalization but do not specifically address the ICU component of care. Operating room events can neutralize or amplify preoperative risk, depending on such events as reopening the chest, hemodynamic management in an emergency patient, and the degree of myocardial protection. In 5000 patients undergoing CABG, 8 risk factors available at ICU admission appeared to predict hospital mortality and an additional 5 factors also predict morbidity.26 These 13 mortality or morbidity variables, identified by logistic regression, are available in a clinical score that can be used in patients undergoing isolated coronary artery bypass grafting alone or combined with a valve or carotid procedure. A modified APACHE III has also been successfully used for cardiac surgical patients in a prospective multicenter study of 2435 patients.53 Independent predictors of hospital mortality included the APACHE score, age, emergency or reoperation status, number of bypass grafts, and gender of the patient. Risk prediction for cardiac surgical patients is incorporated into the APACHE III and IV software packages.
 Comparisons Between Models
A number of papers have investigated the relative performance of the three most widely-used systems,54,55,61–63,75–78 although to date there is no head-to-head comparison of the three most current versions. In a retrospective chart review of 11,300 patients from 35 hospitals in the California Intensive Care Outcomes (CALICO) Project, SMRs were calculated using APACHE IV, MPM0 III and SAPS II.75 All models had adequate discrimination and calibration; data abstraction times ranged from 11.1 minutes with MPM0 III to 37.3 minutes for APACHE IV. Substantial variation occurred in ICU risk-adjusted mortality rates between ICUs, regardless of the model used. The authors concluded that APACHE IV offers the best predictive accuracy with unlimited resources, and that MPM0 III offered “a viable alternative without a substantial loss in accuracy.”75
Performance of three models based on 24-hour data (APACHE II, APACHE III-J, and SAPS II) was compared to that of three models based on admission data (MPM II, SAPS III, and SAPS III-A using Australian coefficients) for 1741 patients in an urban university-affiliated teaching hospital in Australia.76 SAPS II and SAPS III-A fulfilled predetermined calibration and discrimination criteria, APACHE II failed both criteria, and the remaining models discriminated well but overpredicted mortality risk. There did not appear to be an advantage in using 24-hour data versus data available at admission. The improved results with SAPS III-A versus SAPS III again underscores the benefit of customizing models with local coefficients.
SAPS II, SAPS III, APACHE II and customized prognostic models were evaluated in 1851 patients in a German surgical ICU.77 Discrimination was good for all models, but the native models had poor calibration by Hosmer-Lemeshow goodness of fit, which improved after customization. SAPS III customized for Europe had the best calibration curve. A Swiss study investigated SAPS II, MPM0 II and MPM24 II, and the Injury Severity Score (ISS) in 960 emergency surgical patients (severe head injury, multiple injuries, abdominal aortic aneurysm and spontaneous subarachnoid hemorrhage). In this particular population, MPM24 II had the best predictive accuracy and discrimination, but calibration was poor for all models. Surprisingly, the ISS was the worst model for mortality prediction in trauma patients.78
Moreno and Morais79 compared the performance of SAPS II with APACHE II in an independent database of 1094 patients in 19 Portuguese ICUs. Discrimination by ROC analysis was better for SAPS II, but neither model calibrated well by Hosmer-Lemeshow goodness-of-fit testing. In a comparison of the APACHE systems in 1144 British ICU patients, APACHE II had better calibration, but APACHE III had better discrimination.80 Hospital mortality was higher than predicted with either model, agreement being best in respiratory patients and worst in trauma patients. Differences in trauma care infrastructure between the United States and the United Kingdom might account for some of this discrepancy. APACHE II had superior risk estimates for surgical patients.
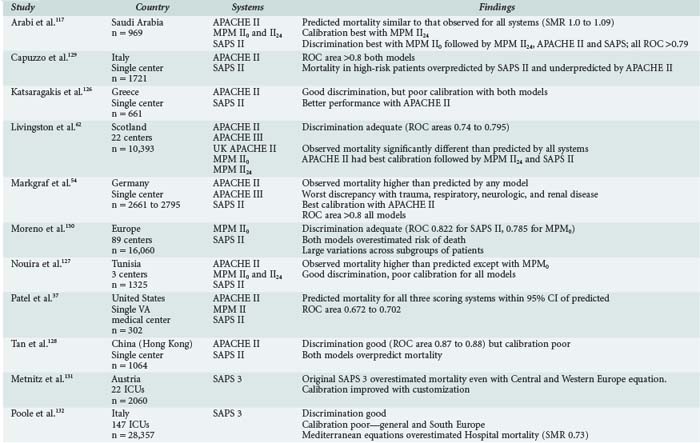
Table 222-5 summarizes the results of nine studies in which two or more of the risk-adjustment models were applied to a specific regional population. There is no consistent pattern to accuracy-of-outcome prediction (discrimination), with examples of observed mortality higher than predicted, lower than predicted, as predicted, or predicted differently by different systems. There is no consistent leader in calibration; it tends to be poor in many studies. Ratios of observed-to-expected mortality rates are influenced by case mix as well as quality of care,81 which argues for caution when using ratios such as the standardized mortality ratio for quality of care comparisons. Application of APACHE III to an Australian ICU underestimated mortality in a population that was younger, more male, and had more comorbidities than the APACHE III developmental set. Agreement was closer when Australian results were compared with the APACHE U.S. database or when the APACHE III model was adjusted for hospital characteristics.82 This suggests that cross-hospital comparisons for quality assessment require adjustment for hospital characteristics as well as patient severity of illness. As of this writing, there have been no comparisons of the newest models (APACHE IV, MPM0 III, SAPS III) on a large independent database.
 Uses For Severity-of-Illness Indices
There are four major applications for severity-of-illness scoring systems:
 Quality Improvement and Benchmarking
Meaningful evaluation of ICU performance must consider both severity of illness of the patient population and characteristics of the institution. Benchmarking refers to the process of comparing an individual unit’s performance either against established case mix-adjusted standards with similar ICUs or with the units’ own data over time. Benchmarking need not be for morbidity and mortality outcomes alone, and severity adjustment has been successfully used to explain variations in cost83 and ICU length of stay.84 Outlier length-of-stay status is only partially predicted by severity of illness, and factors such as long ward stays before ICU admission and absence of an intensivist-directed multidisciplinary care team increase length of stay.85
The mortality rate86 and length of stay for patients transferred to a referral hospital is higher than that of nontransferred patients, and this referral bias87 has implications in profiling hospital quality. Medical patients transferred from another hospital have higher acute physiology scores but, even after adjustment for case mix and severity of illness, experience longer hospital and ICU lengths of stay and have more than twice the risk of hospital mortality compared with directly admitted patients.7 The authors of these studies suggest that a referral hospital with a 25% transfer rate would suffer a penalty when undergoing profiling, and public policy should take this into account to reduce the disincentive for tertiary care centers to accept these patients.
 Predicting and Planning Resource Utilization
The Therapeutic Intervention Scoring System (TISS) was developed as a method for quantifying patient care and severity of illness.88 As a prognostic measure, it was supplanted by the newer scoring systems once it was realized that application of technology depended on local availability and local practice. The TISS score does reflect ICU workload and costs89 and has been used to measure nursing workload.90 TISS is available in an abbreviated version91 and can be correlated to APACHE III and IV scores.40,41 APACHE III and SAPS II have also been applied to measuring severity of illness in intermediate care units.92,93
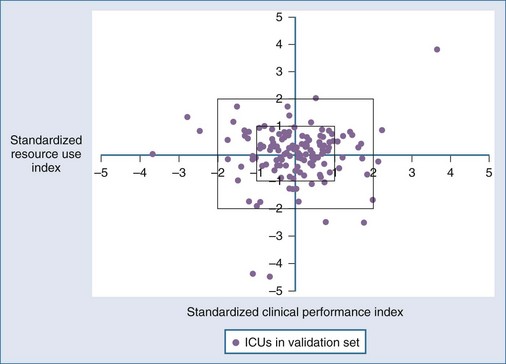
Although it seems intuitive that ICU length of stay and mortality should both be predictable from the same admission risk factors, the correlations between mortality and lengths of stay are less predictable. In part, this may be due to the censoring effect of early death in extremely ill individuals, but it also reflects considerable interhospital variability in practice, including the use of intermediate beds and long-term ventilation facilities. The CALICO project94 found that APACHE IV and MPM0 III were more accurate than SAPS II for prediction of ICU length of stay—not surprising given that the California population would be more similar geographically and temporally to the newer models than the older international SAPS II. A “weighed hospital days” model with four variables (mortality rate, percentage of unscheduled surgical patients, mechanical ventilation within 1 hour of ICU admission, and percent discharged to a post–acute care facility) was developed from the MPM III database59 and has reasonable performance (r2 = 0.47 between score and length of stay) but only at an ICU rather than individual patient level. Figure 222-3 demonstrates a method for displaying MPM-adjusted mortality (x-axis) versus resource use (y-axis).59 Similarly, Campbell and colleagues could identify factors associated with death and readmission to ICU but could not produce a definitive model based on these risk factors for individual patients.95 There does appear to be a predictable relationship between increasing severity of illness (using SAPS, SAPS II, and APACHE II or III) and risk of ICU readmission.96
 Use of Severity Indices in Clinical Research
Existing databases and severity adjustment make possible hypothesis-generating observations and conclusions about therapeutic choices in situations where randomized, prospective evaluations might not be permitted or funded. For prospective studies, severity scoring indices can be used to “risk stratify” the population before randomization, thus reducing the number of patients and cost of clinical trials. Clinical studies have also used scoring systems as part of inclusion criteria and to demonstrate that control and study groups have similar disease burden. Representative examples of this approach include risk stratification for comparison of different antibiotic regimens97 and anticytokine therapies.98 Acute physiologic abnormalities are important prognostic factors influencing outcome in patients meeting criteria for severe sepsis.50 Correlations have been noted between the MPM0 II sepsis score99 and interleukin (IL)-6 plasma levels and between APACHE III scores and plasma levels of tumor necrosis factor (TNF)-sR, IL-6, and C-reactive protein.100 Nonsurvivors appear to have significantly higher MPM or APACHE scores at any time during sepsis.
 Uses of Severity Adjustment for Individual Predictions
The difficulty in using scoring systems for individuals arises from attempts to apply a probability estimate, which may range from 0 to 1, to an individual for whom the result will be 0 or 1. No model is accurate enough to predict that a given patient will certainly survive or invariably die, so the use of scoring systems alone to direct or withhold therapy is not recommended. It is unlikely that any score calculated within 24 hours of ICU admission could ever perfectly predict outcome, because the patient’s individual response to therapy clearly plays a role. APACHE III alone could not independently predict survival in 114 patients with perforated gastrointestinal viscus, and only the development of overt multiple organ failure predicted death.101 Sequential prognostic estimates, an approach explored by both APACHE102 and MPM,44 may improve prognosis by incorporating response to therapy, but this application of scoring systems should not create a vicious cycle in which a declining risk of survival could precipitate withdrawal or limitation of care. Objective predictions of the need for next-day life support are used by APACHE III and IV to guide triage and discharge decisions.103 Although space does not permit a full discussion, there are a number of tools to quantify organ failure in ICU patients, including the Sequential Organ Failure Assessment (SOFA) score,104 the Multiple Organ Dysfunction (MOD) score,105 and the Logistic Organ Dysfunction Score.106 In contrast to the outcome prediction scores, organ dysfunction scores were not designed to predict mortality, but they do capture the timing and severity of organ failure, typically examining six or seven discrete systems (respiratory, cardiovascular, renal, hepatic, coagulation, central nervous system, and sometimes gastrointestinal). Increases in scores following admission generally carry a poor prognosis,107,108 although others have reported limited ability of the SOFA or MOD score to discriminate outcome.109
Use of scoring systems to guide therapy has not been well studied. The package insert for recombinant human activated protein C (rhAPC) suggests APACHE II scores greater than 25 as a criterion for drug administration. This recommendation is based in part on post hoc subgroup analysis of PROWESS trial110 patients showing that patients with higher APACHE II scores were more likely to benefit from this therapy than those with lower scores. Problems with limiting administration therapy to patients with low severity scores include wide variability in severity score between those obtained at ICU admission versus at the time of drug administration.111 Because the APACHE II score is weighted for age and chronic health status, younger patients and those with less chronic disease burden will have lower scores for an equal amount of physiologic derangement. The Australian APACHE study quoted earlier82 indirectly suggests that younger, healthier patients may be improperly categorized. An efficient emergency department may well stabilize the patients and lower the APACHE score before arrival in the ICU.112 These same general concerns would apply to many situations in which a severity score could be used to decide on ICU admission or to administer or withhold interventions for an individual patient.113 Admission scores do well at predicting outcomes in groups of patients, not individuals. Neither sequential evaluations44,102 nor organ failure scores are sufficiently sensitive or specific in individuals that they could be used in isolation for therapeutic decisions.
Objectively calculated severity scores are not necessarily more accurate than physician or nurse intuition when dealing with individual patients.114 Sensitivity, specificity, correct prediction, and area under the ROC curve were compared, and no significant differences were noted between ROC areas for APACHE II versus the clinical assessment of nurses, fellows, residents, or interns.115 Accurate prognosis may be most difficult for patients with the highest risk of death. A multicenter study addressing the issue of medical futility found that divergent judgments on patient prognosis by doctors and nurses increased with higher SAPS II scores and longer ICU stays.116 ICU physicians, in fact, discriminate between survivors and nonsurvivors more accurately than SAPS II, MPM I or APACHE II.114
 Pitfalls in the Application of Severity-of-Illness Indices
Like any tool, severity-of-illness indices can be misused. The use (and abuse) of databases for profiling ICUs and/or individual physicians is growing despite flaws in administrative databases and problems identified with application of statistical models18,19,29 and physician profiling.117,118 Assuming a properly developed model is applied, potential pitfalls in application fall into four major categories: data collection and entry errors,119 misapplication of the model,7,29,36 use of mortality as the sole criterion of outcome, and failure to account for sample size and chance variability34,75,81 when reporting results (Box 222-4). Determination of the diagnosis is prone to bias.120 Models that assess performance using a patient’s condition at 24 hours are not truly independent of treatment. If the characteristics of an ICU’s patients are markedly different from a general population’s, the resulting case mix will alter model performance.29 Less obvious is the fact that all models start the clock with ICU admission, the timing of which is not standardized121 and is frequently influenced by local conditions such as ICU bed availability.122 ICUs also do not function in isolation in the process of care,112 and the recent trend toward aggressive use of step-down facilities and off-site chronic ventilation and rehabilitation units raises the question of whether hospital mortality is valid when patients may be transferred to other facilities alive but still technology dependent.122 The issue of lead-time bias (pre-ICU stabilization) has been mentioned earlier; assessment is further complicated for patients with multiple ICU admissions.123,124 Which ICU stay, for example, should be counted for a patient who has ICU observation after an uneventful vascular procedure and then develops complications requiring ICU readmission on the fifth postoperative day? It is increasingly necessary to evaluate the performance of an ICU system, which includes pre-ICU, ICU, and post-ICU care. Rules for starting times and endpoints of evaluation have to be better defined.121,122
 Conclusion
None of the models can perfectly predict the outcome for an individual patient.125 However, this limitation is true of almost any test utilized in medicine and need not preclude the use of prognostic estimates for clinical decision support. Physicians must be alert to the limitations of severity-adjustment models in performance-based assessment, because case-mix differences, inadequate sample sizes, or systemic errors in data collection can generate erroneous conclusions about the quality of care.
Key Points
Zimmerman JE, Kramer AA, McNair DS, Malila FM. Acute Physiology and Chronic Health Evaluation (APACHE) IV: hospital mortality assessment for today’s critically ill patients. Crit Care Med. 2006;34:1297-1310.
Metnitz PGH, Moreno RP, Almeida E, et alSAPS 3 Investigators. SAPS 3—From evaluation of the patient to evaluation of the intensive care unit. Part 1: objectives, methods and cohort description. Intensive Care Med. 2005;31:1336-1344.
Moreno RP, Metnitz PGH, Almeida E, et alSAPS 3 Investigators. SAPS 3—From evaluation of the patient to evaluation of the intensive care unit. Part 2: development of a prognostic model for hospital mortality at ICU admission. Intensive Care Med. 2005;31:1345-1355.
Higgins TL, Teres D, Copes WS, et al. Assessing contemporary intensive care unit outcome: an updated Mortality Probability Admission Model (MPM0-III). Crit Care Med. 2007;35:827-835.
Harrison DA, Parry GJ, Carpenter JR, Short A, Rowan K. A new risk prediction model for critical care: the Intensive Care National Audit and Research Centre (ICNARC) model. Crit Care Med. 2007;35:1091-1098.
Render ML, Deddens J, Freyberg R, et al. Veterans Affairs intensive care unit risk adjustment model: validation, updating, recalibration. Crit Care Med. 2008;36:1031-1042.
Sinuff T, Adhikari NKJ, Cook DJ, et al. Mortality predictions in the intensive care unit: comparing physicians with scoring systems. Crit Care Med. 2006;34:878-885.
Vincent JL, Opal SM, Marshall JC. Ten reasons why we should NOT use severity scores as entry criteria for clinical trials or in our treatment decisions. Crit Care Med. 2010;38:283-287.
Sefarian EG, Afessa B, Gajic O, Keegan MT, Hubmayr RD. Comparison of community and referral intensive care unit patients in a tertiary medical center: evidence for referral bias in the critically ill. Crit Care Med. 2008;36:2779-2786.
Nathanson BH, Higgins TL. An introduction to statistical methods used in binary outcome modeling. Semin Cardiothorac Vasc Anesth. 2008;12:153-166.
1 Hippocrates. On the Prognostics, I (translated by Francis Adam) as quoted in Strauss MB: Familiar Medical Quotations. Boston: Little, Brown; 1968. p. 460
2 Eysenbach G, Powell J, Kuss O, Sa E-R. Empirical studies assessing the quality of health information for consumers on the World Wide Web. JAMA. 2002;287:2691-2700.
3 US DHHS Website www.hospitalcompare.hhs.gov Accessed on March 25, 2010
4 Available at: www.healthcarechoices.org Accessed on March 25, 2010
5 Nathanson BH, Higgins TL. An Introduction to statistical methods used in binary outcomes modeling. Semin Cardiothorac Vasc Anesth. 2008;12:153-166.
6 Dawers RM, Faust D, Meehl PE. Clinical versus actuarial judgment. Science. 1989;243:1668-1674.
7 Rosenberg AL, Hofer TP, Strachan C. Accepting critically ill transfer patients: Adverse effect on a referral center’s outcome and benchmark measures. Ann Intern Med. 2003;138:882-890.
8 Zimmerman JE, Wagner DP. Prognostic systems in intensive care: How do you interpret an observed mortality that is higher than expected? Crit Care Med. 2000;28:258-260.
9 Owens WD, Felts JA, Spitznagal EL. ASA Physical Status Classification: A study of consistency of ratings. Anesthesiology. 1978;49:239-243.
10 Teasdale G, Jennett B. Assessment of coma and impaired consciousness: A practical scale. Lancet. 1974;2:81.
11 Silber JH, Rosenbaum PR, Schwartz JS, et al. Evaluation of the complication rate as a measure of quality of care in coronary artery bypass graft surgery. JAMA. 1995;274:317-323.
12 Weissman C. Analyzing intensive care unit length of stay data: Problems and possible solution. Crit Care Med. 1997;25:1594-1600.
13 Gill TM, Feinstein AR. A critical appraisal of the quality of quality-of-life measurements. JAMA. 1994;272:619-626.
14 Barr JK, Boni CE, Kochurka KA, et al. Public reporting of hospital patient satisfaction: the Rhode Island experience. Health Care Financ Rev. 2002;23:51-70.
15 Zimmerman JE, Alzola C, Von Rueden KT. The use of benchmarking to identify top performing critical care units: A preliminary assessment of their policies and practices. Crit Care. 2003;18:76-86.
16 Chen LM, Martin CM, Morrison TL, Sibbald WJ. Interobserver variability in data collection of the APACHE-II score in teaching and community hospitals. Crit Care Med. 1999;27:1999-2004.
17 Zimmerman JE, Wagner DP, Draper EA, et al. Evaluation of Acute Physiology and Chronic Health Evaluation III predictions of hospital mortality in an independent database. Crit Care Med. 1998;26:1317-1326.
18 Greenfield S, Aronow HU, Elashoff RM, Watanabe D. Flaws in mortality data: The hazards of ignoring comorbid disease. JAMA. 1988;260:2253-2255.
19 Jollis JG, Ancukiewicz M, DeLong ER, et al. Discordance of databases designed for claims payment versus clinical information systems. Ann Intern Med. 1993;119:844-850.
20 Pine M, Norusis M, Jones B, Rosenthal GE. Predictions of hospital mortality rates: A comparison of data sources. Ann Intern Med. 1997;126:347-354.
21 Berry CC. The κ statistic. JAMA. 1992;18:2513.
22 Higgins TL. Cardiac surgery “report card” modeling. Curr Opin Crit Care. 1997;3:169-174.
23 Meinert CL. The multiple comparison problems. In: clinical trails, design, conduct and analysis. New York: Oxford University Press; 1986:213-214.
24 Higgins TL, Estafanous FG, Loop FD, et al. ICU admission score for predicting morbidity and mortality risk after coronary artery bypass grafting. Ann Thorac Surg. 1997;64:1050-1058.
25 Cleveland WS. Robust locally weighted regression and smoothing scatterplots. J Am Stat Assoc. 1979;74:829-836.
26 Durrleman S, Simon R. Flexible regression models with cubic splines. Stat Med. 1989;8:551-561.
27 Higgins TL, Estafanous FG, Loop FD, et al. Stratification of morbidity and mortality outcome by preoperative risk factors in coronary artery bypass patients: A clinical severity score. JAMA. 1992;267:2344-2348.
28 Higgins TL, Brennan M, Jodka P, et al. Elderly patients without MPM-III risk factors fare surprisingly well. Crit Care Med. 2007;32:A171.
29 Murphy-Filkins RL, Teres D, Lemeshow S, Hosmer DW. Effect of changing patient mix on the performance of an intensive care unit severity-of-illness model: How to distinguish a general from a specialty intensive care unit. Crit Care Med. 1996;24:1968-1973.
30 Glance LG, Osler TM, Papadakos P. Effect of mortality rate on the performance of the Acute Physiology and Chronic Health Evaluation II: A simulation study. Crit Care Med. 2000;28:3424-3428.
31 Efron B, Tibshirani RJ. An Introduction to the Bootstrap. New York: Chapman and Hall; 1993. p. 141-52
32 Lemeshow S, Hosmer DW. A review of goodness-of-fit statistics for use in the development of logistic regression models. Am J Epidemiol. 1982;115:92-106.
33 Kramer AA, Zimmerman JE. Assessing the calibration of mortality benchmarks in critical care: The Hosmer-Lemeshow test revisited. Crit Care Med. 2007;35:2052-2056.
34 Charlson ME, Ales KL, Simon R, MacKenzie R. Why predictive indexes perform less well in validation studies. Is it magic or methods? Arch Intern Med. 1987;147:2155-2161.
35 Beck DH, Smith GB, Taylor BL. The impact of low-risk intensive care unit admissions on mortality probabilities by SAPS-II, APACHE-II and APACHE-III. Anaesthesia. 2002;57:21-26.
36 Suistomaa M, Kari A, Ruokonen E, Takala J. Sampling rate causes bias in APACHE-II and SAPS-II scores. Intensive Care Med. 2000;26:1773-1778.
37 Patel PA, Grant BJ. Application of mortality prediction systems to individual intensive care units. Intensive Care Med. 1999;25:977-982.
38 Goldhill DR, Withington PS. Mortality predicted by APACHE-II: The effect of changes in physiological values and post-ICU hospital mortality. Anesthesia. 1996;51:719-723.
39 Knaus WA, Draper EA, Wagner DP, Zimmerman JE. APACHE-II: A severity-of-disease classification system. Crit Care Med. 1985;13:818-829.
40 Knaus WA, Wagner DP, Draper EA, et al. The APACHE-III Prognostic System: Risk prediction of hospital mortality for critically ill hospitalized adults. Chest. 1991;100:1619-1636.
41 Zimmerman JE, Kramer AA, McNair DS, et al. Acute physiology and chronic health evaluation (APACHE) IV: Hospital mortality assessment for today’s critically ill patients. Crit Care Med. 2006;34:1297-1310.
42 Lemeshow S, Teres D, Pastides H, et al. A method for predicting survival and mortality of ICU patients using objectively derived weights. Crit Care Med. 1985;13:519-525.
43 Lemeshow S, Teres D, Klar J, et al. Mortality Probability Model (MPM II) based on an international cohort of intensive care unit patients. JAMA. 1993;270:2478-2486.
44 Lemeshow S, Klar J, Teres D, et al. Mortality probability models for patients in the intensive care unit for 48 or 72 hours: A prospective, multicenter study. Crit Care Med. 1994;22:1351-1358.
45 Higgins TL, Teres D, Copes WS, et al. Assessing contemporary intensive care unit outcome: An updated mortality probability admission model (MPM0-III). Crit Care Med. 2007;35:827-835.
46 Le Gall J-R, Loirat P, Alperovitch A, et al. A simplified acute physiology score for ICU patients. Crit Care Med. 1984;12:975-977.
47 Le Gall J-R, Lemeshow S, Saulnier F. A new Simplified Acute Physiology Score (SAPS-II) based on a European/North American Multicenter study. JAMA. 1993;270:2957-2963.
48 Metnitz PG, Moreno RP, Almeida E, et al. SAPS 3-From evaluation of the patient to evaluation of the intensive care unit. Part 1: Objectives, methods and cohort description. Intensive Care Med. 2005;31:1336-1344.
49 Moreno RP, Metnitz PG, Almeida E, et al. SAPS 3-From evaluation of the patient to evaluation of the intensive care unit. Part 2: Development of a prognostic model for hospital mortality at ICU admission. Intensive Care Med. 2005;31:1345-1355.
50 Knaus WA, Harrell FE, LaBrecque JF, et al. Use of predicted risk of mortality to evaluate the efficacy of anticytokine therapy in sepsis. The rhIL-1ra Phase III Sepsis Syndrome Study Group. Crit Care Med. 1996;24:46-56.
51 Escarsce JJ, Kelley MA. Admission source to the medical intensive care unit predicts hospital death independent of APACHE-II score. JAMA. 1990;264:2389-2394.
52 Tunnell RD, Millar BW, Smith GB. The effect of lead time bias on severity of illness scoring, mortality prediction and standardized mortality ratio in intensive care: A pilot study. Anesthesia. 1998;53:1045-1053.
53 Becker RB, Zimmerman JE, Knaus WA, et al. The use of APACHE-III to evaluate ICU length of stay, resource use, and mortality after coronary artery bypass surgery. J Cardiovasc Surg. 1995;36:1-11.
54 Markgraf R, Deutschinoff G, Pientka L, Scholten T. Comparison of Acute Physiology and Chronic Health Evaluations II and III and Simplified Acute Physiology Score II: A prospective cohort study evaluating these methods to predict outcome in a German interdisciplinary intensive care unit. Crit Care Med. 2000;28:26-33.
55 Rowan KM, Kerr JH, Major E, et al. Intensive Care Society’s Acute Physiology and Chronic Health Evaluation (APACHE-II) study in Britain and Ireland: A prospective, multicenter, cohort study comparing two methods for predicting outcome for adult intensive care patients. Crit Care Med. 1994;22:1392-1401.
56 Glance LG, Turner MO, Dick AW. Identifying quality outliers in a large, multiple-institution database by using customized versions of the Simplified Acute Physiology Score II and the Mortality Probability Model II0. Crit Care Med. 2002;30:1995-2002.
57 Nathanson BH, Higgins TL, Kramer AA, et al. Subgroup mortality probability models: Are they necessary for specialized intensive care units? Crit Care Med. 2009;37:2375-2386.
58 Higgins TL, Kramer AA, Nathanson BH, et al. Prospective validation of the intensive care unit admission Mortality Probability Model. Crit Care Med. 2009;37:1619-1623.
59 Nathanson BH, Higgins TL, Teres D, et al. A revised method to assess intensive care unit clinical performance and resource utilization. Crit Care Med. 2007;35:1853-1862.
60 Bastos PG, Knaus WA, Zimmerman JE, et al. The importance of technology for achieving superior outcomes from intensive care. Brazil APACHE-III Study Group. Intensive Care Med. 1996;22:664-669.
61 Harrison DA, Brady AR, Gareth JP, et al. Recalibration of risk prediction models in a large multicenter cohort of admissions to adult, general critical care units in the United Kingdom. Crit Care Med. 2006;34:1378-1388.
62 Livingston BM, MacKirdy FN, Howie JC, et al. Assessment of the performance of five intensive care scoring models within a large Scottish database. Crit Care Med. 2000;28:1820-1827.
63 Harrison DA, Gareth JP, Carpenter JR, et al. A new risk prediction model for critical care: The intensive care national audit & research centre (ICNARC) model. Crit Care Med. 2007;35:1091-1098.
64 Render ML, Kim HM, Welsh DE, et al. Automated intensive care unit risk adjustment: Results from a national Veterans Affairs study. Crit Care Med. 2003;31:1638-1646.
65 Render ML, Deddens J, Freyberg R, et al. Veterans Affairs intensive care unit risk adjustment model: Validation, updating, recalibration. Crit Care Med. 2008;36:1031-1042.
66 Second European Consensus Conference in Intensive Care Medicine. Predicting outcome in intensive care unit patients. Clin Intensive Care. 1994;11:148-151.
67 Pollack MM, Ruttimann UE, Getson PR. Pediatric risk of mortality (PRISM) score. Crit Care Med. 1988;16:1110-1116.
68 Baker SP, O’Neil B, Haddon W, Long WB. The Injury Severity Score: A method for describing patients with multiple injuries and evaluating emergency care. J Trauma. 1974;14:187-196.
69 Dossett LA, Redhage LA, Sawyer RG, et al. Revisiting the validity of APACHE-II in the trauma ICU: Improved risk stratification in critically inured adults. J Injury. 2009;4:993-998.
70 Jones RH, Hannon EL, Hammermeister KE, et al. Identification of preoperative variables needed for risk adjustment of short term mortality after coronary artery bypass graft surgery. J Am Coll Cardiol. 1996;28:1478-1487.
71 Nashef SAM, Roques F, Michel P, et al. European system for cardiac operative risk evaluation (EuroSCORE). Eur J Cardiothorac Surg. 1999;16:9-13.
72 Shroyer ALW, Coombs LP, Peterson ED, et al. The society of thoracic surgeons: 30-Day operative mortality and morbidity risk models. J Soc Thorac Surg. 2003;75:1856-1865.
73 Orr RK, Maini BS, Sottile FD, et al. A comparison of four severity-adjusted models to predict mortality after coronary artery bypass graft surgery. Arch Surg. 1995;130:301.
74 Geissler HJ, Hölzl P, Marohl S, et al. Risk stratification in heart surgery: Comparison of six score systems. Eur J Cardiothorac Surg. 2000;17:400-406.
75 Kuzniewicz MW, Vasilevskis EE, Lane R, et al. Variation in ICU risk-adjusted mortality. Impact of methods of assessment and potential confounders. Chest. 2008;133:1319-1327.
76 Duke GJ, Piercy M, DiGiantomasso D, et al. Comparison of intensive care outcome prediction models based on admission scores with those based on 24-hour data. Anaesth Intensive Care. 2008;36:845-849.
77 Sakr Y, Krauss C, Amaral ACKB, et al. Comparison of the performance of SAPS-II, SAPS 3, APACHE-II, and their customized prognostic models in a surgical intensive care unit. Br J Anaesth. 2008;101:798-803.
78 Fischler L, Lelais F, Young J, et al. Assessment of three different mortality prediction models in four well-defined critical care patient groups at two points in time: a prospective cohort study. Eur J Anaesth. 2007;24:676-683.
79 Moreno R, Morais P. Outcome prediction in intensive care: Results of a prospective, multicenter, Portuguese study. Intensive Care Med. 1997;23:177-186.
80 Beck DH, Taylor BL, Millar B, Smith GB. Prediction of outcome from intensive care: A prospective cohort study comparing Acute Physiology and Chronic Health Evaluation II and III prognostic systems in a United Kingdom intensive care unit. Crit Care Med. 1997;25:9-15.
81 Metnitz PG, Lang T, Vesely H, et al. Ratios of observed to expected mortality are affected by differences in case mix and quality of care. Intensive Care Med. 2000;26:1466-1472.
82 Cook DA. Performance of APACHE-III models in an Australian ICU. Chest. 2000;118:1732-1738.
83 Thomas JW, Ashcraft MLF. Measuring severity of illness: Six severity systems and their ability to explain cost variations. Inquiry. 1991;28:39-55.
84 Rosenberg AL, Zimmerman JE, Alzola C, et al. Intensive care unit length of stay: Recent changes and future challenges. Crit Care Med. 2000;28:3465-3473.
85 Higgins TL, McGee WT, Steingrub JS, et al. Early indicators of prolonged intensive care unit stay: Impact of illness severity, physician staffing, and pre–intensive care unit length of stay. Crit Care Med. 2003;31:45-51.
86 Combes A, Chrles-Edouard L, Trouillet J-L, et al. Adverse effect on a referral intensive care unit’s performance of accepting patients transferred from another intensive care unit. Crit Care Med. 2005;33:705-710.
87 Seferian ED, Bekele A, Ognjen G, et al. Comparison of community and referral intensive care unit patients in a tertiary medical center: Evidence for referral bias in the critically ill. Crit Care Med. 2008;36:2779-2786.
88 Cullen DJ, Civetta JM, Briggs BA, et al. Therapeutic Intervention Scoring System: A method for quantitative comparison of patient care. Crit Care Med. 1974;2:57.
89 Malstam J, Lind L. Therapeutic Intervention Scoring System (TISS): A method for measuring workload and calculating costs in the ICU. ACTA Anaesthesiol Scand. 1992;36:758.
90 Miranda DR, Marino R, Iapichino G. Nine equivalents of nursing manpower use score (NEMS). Intensive Care Med. 1997;23:760.
91 Miranda DR, DeRijk A, Schaufeli W. Simplified Therapeutic Intervention Scoring System. The TISS-28 Items: Results from a multicenter study. Crit Care Med. 1996;24:64.
92 Auriant I, Vinatier I, Thaler F, et al. Simplified Acute Physiology Score II for measuring severity of illness in intermediate care units. Crit Care Med. 1998;26:1368-1371.
93 Zimmerman JE, Wagner DP, Knaus WA, et al. The use of risk predictions to identify candidates for intermediate-care units: Implications for intensive care utilization and cost. Chest. 1995;108:490-499.
94 Vasilevskis EE, Kuzniewicz W, Cason BA, et al. Mortality probability model III and simplified acute physiology score II. Chest. 2009;136:89-101.
95 Campbell AJ, Cook JA, Adey G, et al. Predicting death and readmission after intensive care discharge. Br J Anaesth. 2008;100:656-662.
96 Frost SA, Alexandrou E, Bogdanovski T, et al. Severity of illness and risk of readmission to intensive care: A meta-analysis. J Resuscitation. 2009;80:505-510.
97 Solomkin JS, Dellinger EP, Christou NV, Busuttil RW. Results of a multicenter trial comparing imipenem/cilastatin to tobramycin/clindamycin for intra-abdominal infections. Ann Surg. 1990;212:581-591.
98 Knaus WA, Harrell FE, Fisher CJ, et al. The clinical evaluation of new drugs for sepsis: A prospective study design based on survival analysis. JAMA. 1993;270:1233-1241.
99 Le Gall J-R, Lemeshow S, Leleu G, et al. Customized probability models for early severe sepsis in adult intensive care patients. JAMA. 1995;273:644-650.
100 Presterl E, Staudinger T, Pettermann M, et al. Cytokine profile and correlation to the APACHE-III and MPM II scores in patients with sepsis. Am J Respir Crit Care Med. 1997;156:825-832.
101 Barie PS, Hydo LJ, Fischer E. Development of multiple organ dysfunction syndrome in critically ill patients with perforated viscus. Arch Surg. 1996;131:37-43.
102 Wagner DP, Knaus WA, Harrell FE, et al. Daily prognostic estimates for critically ill adults in intensive care units: Results from a prospective, multicenter, inception cohort analysis. Crit Care Med. 1994;22:1359-1372.
103 Zimmerman JE, Wagner DP, Draper EA, Knaus WA. Improving intensive care unit discharge decisions: Supplementing physician judgment with predictions of next-day risk for life support. Crit Care Med. 1994;22:1373-1384.
104 Ferreira FL, Bota DP, Bross A, et al. Serial evaluation of the SOFA score to predict outcome in critically ill patients. JAMA. 2001;286:1754-1758.
105 Marshall JC, Cood DJ, Christou NV, et al. Multiple organ dysfunction score: A reliable descriptor of a complex clinical. Crit Care Med. 1995;23:1638-1652.
106 LeGall JR, Klar J, Lemeshow S, et al. The logistic organ dysfunction system. JAMA. 1996;276:802-810.
107 Cook R, Cook D, Tilley J, et al. Multiple organ dysfunction: Baseline and serial component scores. Crit Care Med. 2001;29:2046-2050.
108 Cabre L, Mancebo J, Solsona JF, et al. Multicenter study of the multiple organ dysfunction syndrome in intensive care units: the usefulness of sequential organ failure assessment scores in decision making. Intensive Care Med. 2005;31:927-933.
109 Zygun DA, Laupland KB, Fick GH, et al. Limited ability of SOFA and MOD scores to discriminate outcome: a prospective evaluation in 1,436 patients. Can J Anesth. 2005;52:302-308.
110 Bernard GR, Vincent J-L, Laterre P-F, et al. Efficacy and safety of recombinant human activated Protein C for severe sepsis. N Engl J Med. 2001;344:699-709.
111 Higgins TL, Steingrub JS, Tereso GJ, et al. Drotrecogin alfa (activated) in sepsis: Initial experience with patient selection, cost and clinical outcomes. J Intensive Care Med. 2005;20:291-297.
112 Nguyen HB, Rovers EP, Havstad S, et al. Critical care in the emergency department: A physiologic assessment and outcome evaluation. Acad Emerg Med. 2000;7:1354-1361.
113 Vincent J-L, Steven MO, Marshall JC. Ten reasons why we should NOT use severity scores as entry criteria for clinical trials or in our treatment decisions. Crit Care Med. 2010;38:283-287.
114 Sniuff T, Adhikari NKJ, Cook DJ, et al. Mortality predictions in the intensive care unit: Comparing physicians with scoring systems. Crit Care Med. 2006;34:878-885.
115 Kruse JA, Thill-Baharozian MC, Carlson RW. Comparison of clinical assessment with APACHE-II for predicting mortality risk in patients admitted to a medical intensive care unit. JAMA. 1988;260:1739-1742.
116 Frisk S, Uchlinger DE, Zuercher Zenklusen RM. Medical futility: Predicting outcome of intensive care unit patients by nurses and doctors-a prospective comparative study. Crit Care Med. 2003;31:646-648.
117 Kassirer JP. The use and abuse of practice profiles (editorial). N Engl J Med. 1994;330:634-635.
118 Adams JL, Mehrotra A, Thomas JW, et al. Physician cost profiling–reliability and risk of misclassification. N Engl J Med. 2010;262:1014-1021.
119 Chen L, Martin C, Morrison TL, Sibbald WJ. Interobserver variability in data collection of the APACHE-II score in teaching and community hospitals. Crit Care Med. 1999;27:1999-2004.
120 Cowen JS, Kelley MA. Errors and bias in using predictive scoring system. Crit Care Clin. 1994;10:53-72.
121 Marik PE, Hedman L. What’s in a day? Determining intensive care unit length of stay. Crit Care Med. 2000;28:2090-2093.
122 Teres D, Higgins T, Steingrub J, et al. Defining a high-performance ICU system for the 21st century: A position paper. J Intensive Care Med. 1998;13:195-205.
123 Chen LM, Martin CM, Keenan SP, Sibbald WJ. Patients readmitted to the intensive care unit during the same hospitalization: Clinical features and outcomes. Crit Care Med. 1998;26:1834-1841.
124 Rosenberg AL, Hofer TP, Hayward RA, et al. Who bounces back? Physiologic and other predictors of intensive care unit readmission. Crit Care Med. 2001;29:511-518.
125 Booth FV, Short M, Shorr AF, et al. Application of a population-based severity scoring system to individual patients results in frequent misclassification. Crit Care. 2005;9:R522-R529.
126 Katsaragakis S, Papadimitropoulos K, Antonakis P, et al. Comparison of Acute Physiology and Chronic Health Evaluation II (APACHE-II) and Simplified Acute Physiology Score II (SAPS-II) scoring systems in a single Greek intensive care unit. Crit Care Med. 2000;28:426-432.
127 Nouira S, Belghith M, Elatrous S, et al. Predictive value of severity scoring systems: Comparison of four models in Tunisian adult intensive care units. Crit Care Med. 1998;26:812-813.
128 Tan IK. APACHE-II and SAPS-II are poorly calibrated in a Hong Kong intensive care unit. Ann Acad Med Singapore. 1998;27:318-322.
129 Capuzzo M, Valpondi V, Sgarbi A, et al. Validation of severity scoring systems SAPS-II and APACHE-II in a single-center population. Intensive Care Med. 2000;26:1779-1785.
130 Moreno R, Miranda DR, Fidler V, Van Schilfgaarde R. Evaluation of two outcome prediction models on an independent database. Crit Care Med. 1998;26:50-61.
131 Metnitz B, Schaden E, Moreno R, et al. Austrian validation and customization of the SAPS 3 admission score. Intensive Care Med. 2009;35:616-622.
132 Poole D, Rossi C, Anghileri A, et al. External validation of the simplified acute physiology score (SAPS) 3 in a cohort of 28,357 patients from 147 Italian intensive care units. Intensive Care Med. 2009;35:1916-1924.
[/level-membership-for-critical-care-medicine-category][not-level-membership-for-critical-care-medicine-category]
222 Severity-of-Illness Indices and Outcome Prediction
Development and Evaluation
And he will manage the cure best who has foreseen what is to happen from the present state of matters.1
Background
Predicting outcome is a time-honored duty of physicians, dating back at least to the time of Hippocrates.1 The need for a quantitative approach to outcome prediction, however, is more recent. Although the patient or family members will still want to know the prognosis, there is increasing pressure to measure and publicly report medical care outcomes. In today’s highly competitive healthcare environment, such information may be used to award contracts for care. Information of variable quality2 is readily available on the Internet. The U.S. Department of Health and Human Services maintains a hospital comparison website,3 and comparative information is also available from sites such as www.healthcarechoices.org.4 Local and regional initiatives to assess quality of care are also common. Some “report cards” specifically address the performance of intensive care units (ICUs) by adjusting outcomes using risk stratification systems, so it is essential that the clinician understand the science behind these systems5 and how risk adjustment models may properly be applied. A focus on performance assessment, however, may detract from other potential uses for risk stratification, including more precise risk-benefit decisions, prognostication, resource allocation, efficient assessment of new therapy and technology, and modifications to individual patient management based on severity of illness.
Prognostication based on clinical observation is affected by memory of recent events, inaccurate estimation of the relative contribution of multiple factors, false beliefs, and human limitations such as fatigue.6 An outcome prediction model, on the other hand, will always produce the same estimate from a given dataset and will correctly value the importance of relevant data. In an environment in which clinical judgment may later be reviewed for financial or legal issues, an objective prediction of outcome becomes especially important. Yet, even the best risk stratification tools can generate misleading data when misapplied.7 Discussed in this chapter are the methods by which models are developed, the application of commonly used models in clinical practice, and common reasons why observed outcome may not match predicted outcome in the absence of differences in the quality of care.8
Well-established general methods for stratifying clinical outcomes by the presenting condition of the patient include the ASA Physical Status Classification9 and the Glasgow Coma Scale (GCS).10 ICU-specific systems typically adjust for patient physiology, age, and chronic health condition; and they may also assess admitting diagnosis, location before ICU admission or transfer status, cardiopulmonary resuscitation before admission, surgical status, and use of mechanical ventilation. An ideal approach to comparing outcomes would use variables that characterize a patient’s initial condition, can be statistically and medically related to outcome, are easy to collect, and are independent of treatment decisions.
Outcome of Interest
Mortality is a commonly chosen outcome because it is easily defined and readily available. Mortality is insufficient as the sole outcome measure, however, because it does not reflect important issues such as return to work, quality of life, or even costs, because early death results in a lower cost than prolonged hospitalization. There is poor correlation between hospital rankings based on death and those based on other complications.7,11 ICU length of stay is difficult to use as a proxy for quality of care, because the frequency of distribution is usually skewed and mean length of stay is always higher than median owing to long-stay outliers.12 Morbidities such as myocardial infarction, prolonged ventilation, stroke or other central nervous system complications, renal failure, and serious infection can be difficult to collect accurately, and administrative records may not reflect all relevant events.8 There is also little standardization on how morbidity should be defined.
Other potential outcomes include ICU or hospital length of stay, resource use, return to work, quality of life, and 1- or 5-year survival. Patient satisfaction is an outcome highly valued by purchasers of health care, but it is subjective13 and requires substantial effort to accomplish successfully.14 Evaluation of ICU performance may require a combination of indicators, including severity of illness and resource utilization.15
Databases and Definitions
The quality of a risk stratification system depends on the database on which it was developed. Outcome analysis can either be retrospective, relying on existing medical records or administrative databases, or developed prospectively from data collected concurrently with patient care. Retrospective studies using existing data are quicker and less expensive to conduct but may be compromised by missing data,8 imprecise definitions, interobserver variability,16 and changes in medical practice over time.17
Data derived from discharge summaries or insurance claims do not always capture the presence of comorbid disease18 and may be discordant with data that are clinically collected.19 Because some administrative discharge reports truncate the number of reportable events, diagnoses may be missed, and this coding bias is most apparent in severely ill patients.12 Coding errors and use of computer programs to optimize diagnosis-related group reimbursement can also reduce the validity of claims-derived data. Augmentation of administrative data with laboratory values improves model performance.20
A variety of methods can assess the quality of the database, such as reabstraction of a sample of charts by personnel blinded to the initial results and comparison to an independent database. Kappa analysis is a method for quantifying the rate of discrepancies between measurements (values) of the same variable in different databases (i.e., original and reabstracted). A kappa value of 0 represents no (or random) agreement, and 1.0 is perfect agreement, but this statistic must be interpreted in light of the prevalence of the factor being abstracted.21
Model Development
Once data integrity is ensured, there are a number of possible approaches to relating outcome to presenting condition. The empirical approach is to use a large database and subject the data to a series of statistical manipulations (Box 222-1). Typically, death, a specific morbidity, and resource consumption are chosen as outcomes (dependent variables). Factors (independent variables) thought to affect outcome are then evaluated against a specific outcome using univariate tests (chi-square, Fisher’s exact, or Student t-test) to establish the magnitude and significance of any relationship.
Independent variables should ideally reflect patient condition independent of therapeutic decisions. Measured variables such as “cardiac index” or “hematocrit” are preferred over “use of inotropes” or “transfusion given,” because the criteria for intervention may vary by provider or hospital. Widely used models rely on common measured physiologic variables (heart rate, blood pressure, and neurologic status) and laboratory values (serum creatinine level and white blood cell count). In addition, variables may consider age, physiologic reserve, and chronic health status. Items chosen for inclusion in a scoring system should be readily available and relevant to clinicians involved in the care of these patients, and variables that lack either clinical or statistical bearing on outcome should not be included. This requirement may necessitate specialized scoring systems for patient populations (pediatric, burn and trauma, and possibly acute myocardial infarction patients) exhibiting different characteristics than the general ICU population. For example, left ventricular ejection fraction and reoperative status are important predictors of outcome in the cardiac surgical population but are not routinely measured or not directly relevant to other population groups.22 If the independent variable is dichotomous (yes/no, male/female), a two-by-two table can be constructed to examine the odds ratio and a chi-square test performed to assess significance (Table 222-1). If multiple variables are being considered, the level of significance is generally set smaller than P = .05, using a multiple comparison (e.g., Bonferroni) correction23 to determine a more appropriate P value.
TABLE 222-1 Two-by-Two Contingency Table Examining Relationship of MOF After Open Heart Surgery (Outcome) to a History of CHF (Predictor) in 3830 Patients*
| Predictor Variable: History of CHF | Outcome Variable: MOF | |
|---|---|---|
| YES | NO | |
| Yes | 121 | 846 |
| No | 166 | 2697 |
CHF, congestive heart failure; MOF, multiple organ failure.
* The odds ratio is defined by cross-multiplication (121 × 2697) ÷ (846 × 166). The odds ratio of 2.3 indicates patients with CHF are 2.3 times as likely to develop postoperative organ system failure as those without prior CHF. This univariate relationship can then be tested by chi-square for statistical significance.
Data from Higgins TL, Estafanous FG, Loop FD et al. ICU admission score for predicting morbidity and mortality risk after coronary artery bypass grafting. Ann Thorac Surg 1997;64:1050–8.
If the independent variable under consideration is a continuous variable (e.g., age) a Student’s t-test is one appropriate choice for statistical comparison. With continuous variables, consideration must be given to the possibility that the relationship of the variable to outcome is not linear. Figure 222-1 demonstrates the relationship of ICU admission serum bicarbonate to mortality outcome in cardiac surgical patients,24 where the data points have been averaged with adjacent values to produce a locally weighted smoothing scatterplot graph.25 Serum bicarbonate values above 22 mmol/L at ICU admission imply a relatively constant risk. Below this value, the risk of death rises sharply. Analysis of this locally weighted smoothing scatterplot graph suggests two ways for dealing with the impact of serum bicarbonate on mortality. One would be to make admission bicarbonate a dichotomous variable (i.e., >22 mEq or <22 mEq). The other would be to transform the data via a logarithmic equation to make the relationship more linear. Cubic splines analysis,26 another statistical smoothing technique, may also be used to assign weight to physiologic variables.
Univariate analysis assesses the forecasting ability of variables without regard to possible correlations or interactions between variables. Linear discriminant and logistic regression techniques can evaluate and correct for overlapping influences on outcome. For example, a history of heart failure and depressed left ventricular ejection fraction are both empirical predictors of poor outcome in patients presenting for cardiac surgery.27 As might be expected, there is considerable overlap between the population with systolic heart failure and those with low ejection fraction. The multivariate analysis in this specific instance eliminates history of heart failure as a variable and retains only measured ejection fraction in the final equation.
Because linear discriminant techniques require certain assumptions about data, logistic techniques are more commonly utilized.4 Subjecting the data to multiple logistic regression will produce an equation with a constant, a β coefficient and standard error, and an odds ratio that represents each term’s effect on outcome. Table 222-2 displays the results of the logistic regression used in the Mortality Probability Model III ICU admission model (MPM0 III). There are 17 variable terms, and a constant term, each with a β value that when multiplied by presence or absence of a factor, becomes part of the calculation of mortality probability using a logistic regression equation. The odds ratios reflect the relative risk of mortality if a factor is present. The challenge in building a model is to include sufficient terms to deliver reliable prediction while keeping the model from being cumbersome to use or too closely fitted to its unique development population. Generally accepted practice is to limit the number of terms in the logistic regression model to 10% of the number of patients having the outcome of interest to avoid “overfitting” the model to the developmental dataset. It is important to identify interaction between variables that may be additive, subtractive (canceling), or synergistic and thus require additional terms in the final model. In the earlier example, seven interaction items were added to reflect important observations in elderly patients,28 who frequently have better outcomes than expected.
TABLE 222-2 Variables in the MPM0 III Logistic Regression Model
| Variable | Odds Ratios (95% Confidence Intervals) | Coefficients (Robust Standard Errors) |
|---|---|---|
| Constant | NA | −5.36283 (0.103) |
| Physiology | ||
| Coma/deep stupor (GCS 3 or 4) | 7.77* (5.921, 10.201) | 2.050514 (0.139) |
| Heart rate ≥150 bpm | 1.54 (1.357,1.753) | 0.433188 (0.065) |
| Systolic BP ≤90 mm Hg | 4.27* (3.393, 5.367) | 1.451005 (0.117) |
| Chronic Diagnoses | ||
| Chronic renal insufficiency | 1.71 (1.580, 1.862) | 0.5395209 (0.042) |
| Cirrhosis | 7.93* (4.820, 13.048) | 2.070695 (0.254) |
| Metastatic neoplasm | 24.65* (15.970, 38.056) | 3.204902 (0.222) |
| Acute Diagnoses | ||
| Acute renal failure | 2.32 (2.137, 2.516) | 0.8412274 (0.042) |
| Cardiac dysrhythmia | 2.28* (1.537, 3.368) | 0.8219612 (0.200) |
| Cerebrovascular incident | 1.51 (1.366, 1.665) | 0.4107686 (0.051) |
| GI bleed | 0.85 (0.763, 0.942) | −0.165253 (0.054) |
| Intracranial mass effect | 6.39* (4.612, 8.864) | 1.855276 (0.166) |
| Other | ||
| Age (per year) | 1.04* (1.037, 1.041) | 0.0385582 (0.001) |
| CPR prior to admission | 4.47* (2.990, 6.681) | 1.497258 (0.205) |
| Mechanical ventilation within 1 hour of admission | 2.27* (2.154, 2.401) | 0.821648 (0.028) |
| Medical or unscheduled surgical admit | 2.48 (2.269, 2.719) | 0.9097936 (0.046) |
| Zero factors (no factors other than age from list above) | 0.65 (0.551, 0.777) | −0.4243604 (0.088) |
| Full code | 0.45 (0.416, 0.489) | −0.7969783(0.041) |
| Interaction Terms | ||
| Age x Coma/deep stupor | 0.99 (0.988,0.997) | −0.0075284 (0.002) |
| Age x Systolic BP ≤ 90 | 0.99 (0.988, 0.995) | −0.0085197 (0.002) |
| Age x Cirrhosis | 0.98 (0.970, 0.986) | −0.0224333 (0.004) |
| Age x Metastatic neoplasm | 0.97 (0.961, 0.974) | −0.0330237 (0.003) |
| Age x Cardiac dysrhythmia | 0.99 (0.985, 0.995) | −0.0101286 (0.003) |
| Age x Intracranial mass effect | 0.98 (0.978, 0.988) | −0.0169215 (0.003) |
| Age x CPR prior to admission | 0.99 (0.983, 0.995) | −0.011214 (0.003) |
Odds ratios for variables with an asterisk (*) are also affected by the associated interaction terms.
CPR, cardiopulmonary resuscitation within 24 hours preceding admission; BP, blood pressure; bpm, beats per minute; GCS, Glasgow Coma Scale; “x” denotes interaction between each pair of variables listed.
Reprinted with permission from Higgins TL, Teres D, Copes WS et al. Assessing contemporary intensive care unit outcome: an updated mortality probability admission model (MPM0-III). Crit Care Med 2007;35:827–35.
The patient’s diagnosis is an important determinant of outcome,17 but conflicting philosophies exist on how disease status should be addressed by a severity adjustment model. One approach is to define principal diagnostic categories and add a weighted term to the logistic regression equation for each illness. This approach acknowledges the different impact of physiologic derangement by diagnosis. For example, patients with diabetic ketoacidosis have markedly altered physiology but a low expected mortality; a patient with an expanding abdominal aneurysm may show little physiologic abnormality and yet be at high risk for death or morbidity. Too many diagnostic categories, however, may result in too few patients in each category to allow statistical analysis for a typical ICU, and such systems are difficult to use without sophisticated (and often proprietary) software.
The other approach is to ignore disease status and assume that factors such as age, chronic health status, and altered physiology will suffice to explain outcome in large groups of patients. This method avoids issues with inaccurate labeling of illness in patients with multiple problems and the need for lengthy lists of coefficients but could result in a model that is more dependent on having an “average” case mix.29,30 Regardless of the specific approach, age and comorbidities (metastatic or hematologic cancer, immunosuppression, and cirrhosis) are given weight in nearly all ICU models to help account for the patient’s physiologic reserve or ability to recover from acute illness.
Validation and Testing Model Performance
Models may be validated on an independent dataset or by using the development set with methods such as jackknife or bootstrap validation.31 Two criteria are essential in assessing model performance: calibration and discrimination. Calibration refers to how well the model tracks outcomes across its relevant range. A model may be very good at predicting good outcome in healthy patients and poor outcomes in very sick patients yet unable to distinguish outcome for patients in the middle range. The Hosmer-Lemeshow goodness-of-fit test32 assesses calibration by stratifying the data into categories (usually deciles) of risk. The number of patients with an observed outcome is compared with the number of predicted outcomes at each risk level. If the observed and expected outcomes are very close at each level across the range of the model, the sum of chi-squares will be low, indicating good calibration. The P value for the Hosmer-Lemeshow goodness-of-fit increases with better calibration and should be nonsignificant (i.e., >.05). Special precautions apply to using the Hosmer-Lemeshow tests with very large databases.33
The second measurement of model performance is discrimination, or how well the model predicts the correct outcome. A classification table (Table 222-3) displays four possible outcomes that define sensitivity and specificity of a model with a binary (died/survived) prediction and outcome. Sensitivity (the true-positive rate) and specificity (the true-negative rate, or 1—the false-positive rate) are measures of discrimination but will vary according to the decision point chosen to distinguish between outcomes when a model produces a continuous range of possibilities. The sensitivity and specificity of a model when using 50% as the decision point will differ from that using 95% as the decision point. The classification table can be recalculated for a range of outcomes by choosing various decision points: for example, 10%, 25%, 50%, 75%, and 95% mortality risk. At each decision point, the true-positive rate (proportion of observed deaths predicted correctly) and the false-negative (proportion of survivors incorrectly predicted to die) and overall correct classification rate can be presented. The C-statistic, or area under a receiver-operating characteristic (ROC) curve, is a convenient way to summarize sensitivity and specificity at all possible decision points. A graph of the true-positive proportion (sensitivity) against the false-positive proportion (1—specificity) across the range of the model produces the ROC curve (Figure 222-2). A model with equal probability of producing the correct or incorrect result (e.g., flipping a coin) will produce a straight line at a 45-degree angle that encompasses half of the area (0.5) under the “curve.” Models with better discrimination will incorporate increasingly more area under the curve to a theoretical maximum of 1.0. Most ICU models have ROC areas of 0.8 to 0.9 in the development set, although the ROC area usually decreases when models are applied prospectively to new datasets. The ROC analysis is valid only if the model has first been shown to calibrate well.
| Predicted Outcome | Actual Outcome | |
|---|---|---|
| DIED | SURVIVED | |
| Died | a | c |
| Survived | b | d |
| True-positive ratio = a/(a + b) (sensitivity) | ||
| False-positive ratio = c/(c + d) | ||
| True-negative ratio = d/(c + d) (specificity) | ||
| False-negative ratio = b/(a + b) | ||
| Accuracy (total correct prediction) = (a + d)/a + b + c + d | ||
Adapted from Ruttiman UE. Severity of illness indices: development and evaluation. In: Shoemaker WC, editor. Textbook of critical care medicine. 2nd ed. Philadelphia: Saunders; 1989.
A model may discriminate and calibrate well on its development dataset yet fail when applied to a new population. Discrepancies in performance can relate to differences in surveillance strategies and definitions34 and can occur when a population is skewed by an unusual number of patients having certain risk factors, as could be seen in a specialized ICU.29 Large numbers of low-risk ICU admissions will result in poor predictive accuracy for the entire ICU population.35 The use of sampling techniques (i.e., choosing to collect data randomly on 50% of patients rather than all patients) also appears to bias results.36 Models can also deteriorate over time, owing to changes in populations and medical practice. These explanations should be considered before concluding that quality of care is different between the original and later applications of a model.37
Standardized Mortality Ratio
Application of a severity-of-illness scoring system involves comparison of observed outcomes with those predicted by the model. The standardized mortality ratio is defined as observed divided by expected mortality and is generally expressed as a mean value ± 95% confidence intervals (CIs), which will depend on the number of patients in the sample. Standardized mortality ratio values of 1.0 (± the CI) indicate that the mortality rate, adjusted for presenting illness, is at the expected level. Standardized mortality ratio values significantly lower than 1.0 indicate performance better than expected. Small differences in scores, as could be caused by consistent errors in scoring elements, timing of data collection, or sampling rate, have been shown to cause important changes in the standardized mortality ratio.36,38
Models Based on Physiologic Derangement
Three widely utilized general-purpose ICU outcome systems are based on changes in patient physiology: the Acute Physiology and Chronic Health Evaluation (APACHE II,39 APACHE III,40 APACHE IV41), the Mortality Probability Models (MPM I,42 MPM II,43 MPM24,44 MPM0 III45), and the Simplified Acute Physiology Score (SAPS I,46 SAPS II,47 SAPS III48,49). These models are all based on the premise that as illness increases, patients will exhibit greater deviation from physiologic normal for a variety of common parameters such as heart rate, blood pressure, neurologic status, and laboratory values. Risk is also assigned for advanced age and chronic illness.
Acute Physiology and Chronic Health Evaluation
APACHE II was developed from data on 5815 medical and surgical ICU patients at 13 hospitals between 1979 and 1982. Severity of illness was assessed with 12 routine physiologic measurements plus the patient’s age and previous health status.39 Scoring was based on the most abnormal measurements during the first 24 hours in the ICU, and the maximum score is 71 points, although more than 80% of patients have scores of 29 or less.39 Although the developers consider APACHE II to have significant limitations based on its age, it is still in widespread use. APACHE II was developed on a database of medical and surgical patients that excluded patients undergoing coronary artery bypass grafting and coronary care, burn, and pediatric patients. The authors note that “it is crucial to combine the APACHE II score with a precise description of disease” and provide coefficients to adjust the score for 29 nonoperative and 16 postoperative diagnostic categories.39 They also caution that disease-specific mortality predictions be derived from at least 50 patients in each diagnostic category. These appropriate precautions have not always been observed in application of APACHE II.
Another common misunderstanding is to use APACHE II, calibrated for unselected ICU admissions, to assess outcome in a patient sample selected by other criteria, such as severe sepsis. The acute physiology score from APACHE III or a specifically developed model predicting 28-day mortality in sepsis are preferable for risk stratification of septic patients.50 APACHE II does not control for pre-ICU management, which could restore a patient’s altered physiology and lead to a lower score and thus underestimate a patient’s true risk. In a study of 235 medical patients scored with APACHE II, actual mortality was the same as predicted mortality only for patients admitted directly from the emergency department.51 The mortality rate was higher than predicted for transfers from hospital floors, step-down units, or other hospitals. Inclusion of data from the period before ICU admission increases severity of illness scores and thus increases estimated mortality risk, and this effect is greatest with medical patients and emergency admissions.52 Failure to consider the source of admission could thus lead to erroneous conclusions about the quality of medical care.51,52
APACHE III, published in 1991,40 addressed the limitations of APACHE II, including the impact of treatment time and location before ICU admission. The number of separate disease categories was increased from 45 to 78. APACHE III was developed on a representative database of 17,440 patients at 40 hospitals, including 14 tertiary facilities that volunteered for the study and 26 randomly chosen hospitals in the United States. As data accumulated from APACHE III users, the database expanded, and adjustments to coefficients were made to keep data relevant to current practice.17 APACHE III went through several iterations between 1991 and 2003 as part of this continuous updating. Compared with APACHE II, the ranges of physiologic “normal” are narrower with APACHE III and deviations are asymmetrically weighted to be more clinically relevant. Interactions between variables were considered, and five new variables (blood urea nitrogen, urine output, serum albumin, bilirubin, and glucose) were added, and version II variables serum potassium and bicarbonate were dropped. Information was also collected on 34 chronic health conditions, of which 7 (AIDS, hepatic failure, lymphoma, solid tumor with metastasis, leukemia/multiple myeloma, immunocompromised state, and cirrhosis) were significant in predicting outcome.
APACHE III scores range from 0 to 299, and a 5-point increase represents a significant increase in risk of hospital death. In addition to the APACHE III score, which provides an initial risk estimate, there is an APACHE III predictive equation that uses the APACHE III score and proprietary reference data on disease category and treatment location before ICU admission to provide individual risk estimates for ICU patients. Customized models were created for patient populations (e.g., cardiac surgical patients)53 excluded from the APACHE II. Overall correct classification for APACHE III at a 50% cut-point for mortality risk is 88.2%, with an ROC area of 0.90, significantly better than APACHE II.40 Sequential APACHE III scoring can update the risk estimate daily, allowing for real-time decision support, for example, predicting likelihood of ICU interventions over the next 24-hour period. The single most important factor determining daily risk of hospital death is the updated APACHE III score, but the change in the APACHE III score, the admission diagnosis, the age and chronic health status of the patient, and prior treatment are also important. A predicted risk of death in excess of 90% on any of the first 7 days is associated with a 90% mortality rate. APACHE III scores also can be tied to predictions for ICU mortality, length of stay, need for interventions, and nursing workload.
APACHE IV was published in 200641 to address deterioration in APACHE III performance that had developed despite periodic updating over 15 years. APACHE IV has excellent discrimination (ROC area = 0.88) and impressive calibration (Hosmer-Lemeshow C statistic 16.8, P = 0.08) with a sample size of 110,558 patients in the United States. The model includes 142 variables (Table 222-4), many of which were rescaled or revised compared with APACHE III. Using data from 2002-2003 with an observed mortality rate of 13.51, APACHE IV predicted a mortality rate of 13.55, whereas earlier versions of APACHE III predicted 14.64% and 16.90% mortality. A hospital using APACHE III software based on 1988-89 data would have congratulated themselves on a superb SMR of 0.799, where using APACHE IV would have revealed the true SMR to be a respectable but average 0.997, not significantly different than 1.0.
TABLE 222-4 Variables Used in Acute Physiology and Chronic Health Evaluation IV
| Variable | Coefficient | Odds Ratio |
|---|---|---|
| Emergency surgery | 0.2491 | 1.28 |
| Unable to access GCS | 0.7858 | 2.19 |
| Ventilated on ICU day 1 | 0.2718 | 1.31 |
| Thrombolytic therapy for acute myocardial infarction | −0.5799 | 0.56 |
| Rescaled GCS (15-GCS) | 0.0391 | 1.04 |
| 15-GCS = 0 | 1.00 | |
| 15-GCS = 1, 2, 3 | 1.04-1.12 | |
| 15-GCS = 4, 5, 6 | 1.17-1.26 | |
| 15-GCS = 7, 8, 9 | 1.31-1.42 | |
| 15-GCS = 10, 11, 12 | 1.48-1.60 | |
| PaO2/FIO2 ratio: | −0.00040 | 1.00 |
| ≤200 | 1.00-0.92 | |
| 201-300 | 0.92-0.89 | |
| 301-400 | 0.89-0.85 | |
| 401-500 | 0.85-0.82 | |
| 501-600 | 0.82-0.79 | |
| Chronic health items: | ||
| AIDS | 0.9581 | 2.61 |
| Cirrhosis | 0.8147 | 2.26 |
| Hepatic failure | 1.0374 | 2.82 |
| Immunosuppressed | 0.4356 | 1.55 |
| Lymphoma | 0.7435 | 2.10 |
| Myeloma | 0.9693 | 2.64 |
| Metastatic cancer | 1.0864 | 2.96 |
| Admission source: | ||
| Floor | 0.0171 | 1.02 |
| Other hospital | 0.0221 | 1.02 |
| Operating/recovery room | −0.5838 | 0.56 |
AIDS, acquired immunodeficiency syndrome; GCS, Glasgow Coma Scale; ICU intensive care unit.
[/not-level-membership-for-critical-care-medicine-category]
