Serpiginous Choroiditis
Clinical Features:
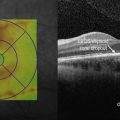
Lesions most commonly start in the peripapillary region (Fig. 17.3.1). Active lesions are yellow to grayish with associated overlying retinal edema. These spread in a centripetal, helicoid, map-like or snake-like pattern, from the initial area of involvement. Active lesions become atrophic in weeks to months, with atrophy of the retinal pigment epithelium, choriocapillaris, and choroid. New lesions arise at the edge of the atrophic ones. Choroidal neovascularization, subretinal hemorrhage and serous retinal detachment can complicate the course. The disease is typically chronic and remitting with quiescent periods of up to several years between active episodes.
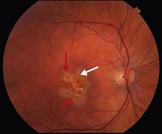
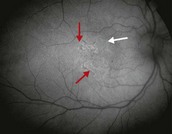
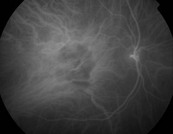
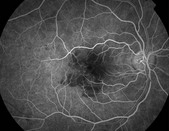
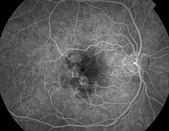
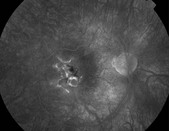
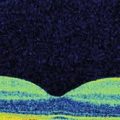
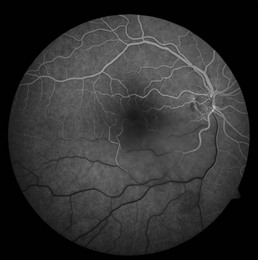
Figure 17.3.1 Color photographs and autofluorescence show macular serpiginous, with old inactive lesion (red arrow) and active lesion at the margin (white arrow). Indocyanine green angiography shows choroidal hypofluorescence consistent with areas of activity. Fluorescein angiography shows early hypofluorescence and late hyperfluorescence.
OCT Features:
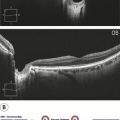
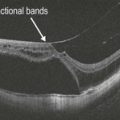
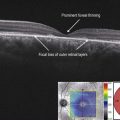
The characteristic active lesion of serpiginous choroiditis shows hyper-reflectivity and thickening of the outer retina, and increased reflectance of the choroid. This has been referred to as the ‘waterfall’ effect (Fig. 17.3.2). There is also disruption of the photoreceptor inner and outer segment junction in both active and inactive lesions (Fig. 17.3.3).
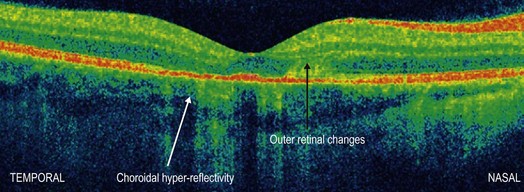
Figure 17.3.2 OCT shows choroidal hyper-reflectivity (white arrow), outer retinal thickening (black arrow) and disruption of the ellipsoid IS–OS layer.
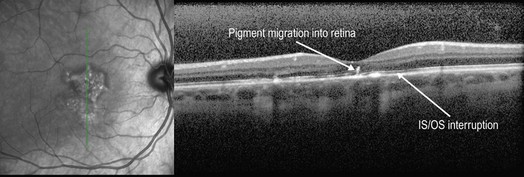
Figure 17.3.3 The same patient in Figure 17.3.2 after treatment with steroids. Note resolution of the choroidal hyper-reflectivity and retinal thickening.
Ancillary Testing:
Visual field examination reveals central or paracentral scotoma. Fluorescein angiography of the active lesions show early hypofluorescence and late hyperfluorescence in a typical geographic pattern. Retinal vessels may stain adjacent to the active lesions. Old lesions show window defects, and late staining (see Figs 17.3.1D–F). Indocyanine green angiography reveals choroidal non-perfusion (see Fig. 17.3.1C).