3 Sensing and Detection
 Electrograms
Surface Electrocardiogram vs. Intracardiac Electrogram
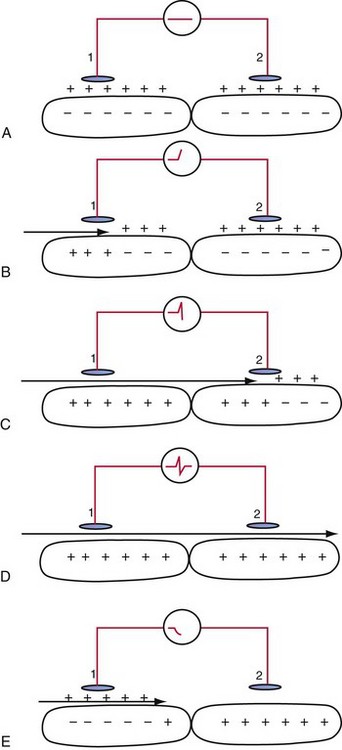
An electrogram (EGM) is a graphic display of the potential difference between two points in space over time. During the upstroke of a myocardial action potential, the inside of the cell abruptly changes from its resting negative potential (with respect to the outside of the cell) to a neutral or slightly positive potential. After about 250 to 400 milliseconds (msec), the cell membrane is then repolarized, with the inside of the cell returning to its resting, negatively charged state. Figure 3-1 illustrates how an EGM is recorded between two electrodes in contact with the myocardium.
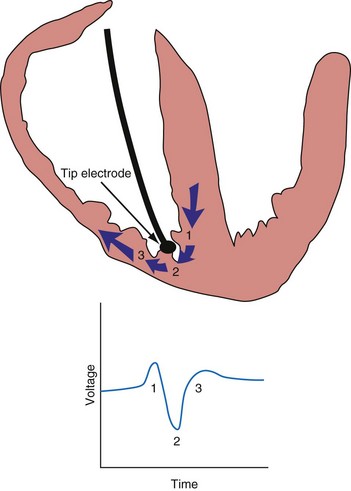
The electrocardiogram (ECG) is recorded from two electrodes on the surface of the body at some distance from the heart. The typical amplitude of its QRS complex is about 1 millivolt (mV). The locations of the two electrodes determine the vectorial “viewpoint” from which the electrical activity of the entire heart is observed from the body surface. In contrast, the ventricular endocardial unipolar EGM typically is 5 to 20 mV in amplitude when recorded from a small electrode on the tip of a lead placed in direct contact with the apex of the right ventricle (Fig. 3-2). The second electrode needed to record this unipolar EGM is the pacemaker or ICD metal “can,” which is located some distance from the heart. The location of this distant second electrode, sometimes called the “indifferent electrode,” has a much smaller effect on the signal’s properties, although it may record noncardiac electric potentials (e.g., from pectoral muscle). The ECG records electrical activity from the entire heart, whereas the EGM records only local wavefronts of depolarization and repolarization. The EGM depends on the viability of approximately 1 or 2 cm3 of myocardium immediately under the tip electrode,1,2 as depicted in Figure 3-2.
Electrode Systems
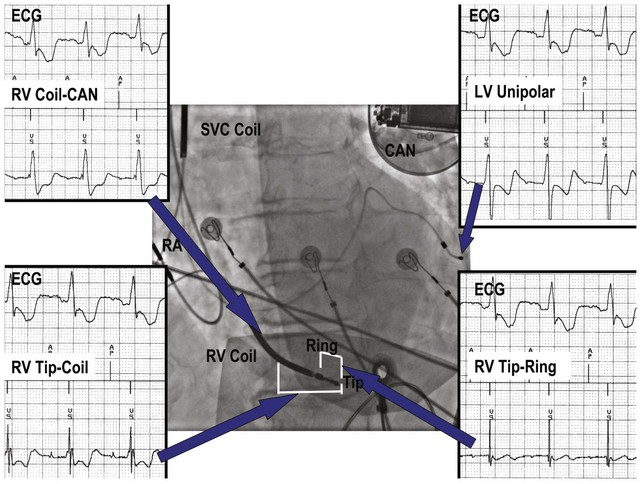
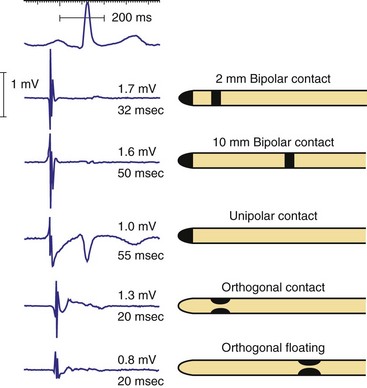
Figure 3-3 contrasts endocardial unipolar (tip-to-can), bipolar (tip-to-ring), and integrated bipolar (tip-to-coil) electrode systems, and Figure 3-4 shows representative examples. Epicardial electrode systems may be either unipolar (tip-to-can) or bipolar (tip-to-tip). These different electrode configurations have EGMs with similar R-wave amplitudes and slew rates, provided that the interelectrode spacing is at least 10 mm, as is true of almost all commercial pacemaker and defibrillator leads. Because they are more likely to oversense than bipolar EGMs, unipolar electrode systems are contraindicated for ICDs and are used infrequently for modern pacemakers. ICD integrated bipolar electrodes sense between the right ventricular tip electrode and right ventricular high-voltage coil, with sensing characteristics closer to the bipolar than the unipolar configuration. Compared with true bipolar electrodes, integrated ICD bipolar electrodes are more likely to oversense myopotentials and electromagnetic interference (EMI).3,4 In one study, oversensing occurred in 40% of patients with integrated bipolar sensing, compared with 8% of patients with true bipolar systems.4
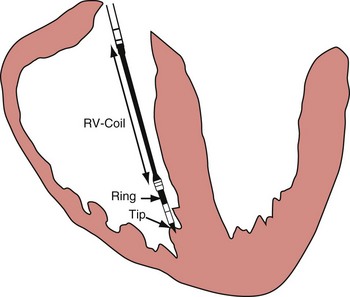
Figure 3-3 The three practical endocardial electrode configurations used by most pacemakers and ICDs.
The distant and indifferent or “can” electrode is not shown because it is out of the field of view. The unipolar configuration used in Figure 3-1 to explain EGM formation simply records the signal between the tip electrode and the can. The tip electrode can be an active-fixation screw or a small-surface-area tip electrode with various geometries. This unipolar configuration is subject to considerable noise and interference signals and is not suitable for ICDs. The bipolar configuration uses the Tip and Ring electrodes shown in this figure. The interelectrode spacing is typically 12 to 15 mm, and the ring electrode may or may not make contact with the endocardium. The integrated bipolar configuration uses the Tip and RV-Coil electrodes shown in the figure. EGMs recorded from bipolar and integrated bipolar configurations are very similar, and one less conductor is needed for the integrated bipolar configuration. The main disadvantages of the integrated bipolar configuration are susceptibility to diaphragmatic myopotentials, undesired atrial EGMs in small hearts, and slower postshock recovery times caused by electrode polarization. RV, Right ventricular.
Amplitude, Slew Rate, and Waveshape
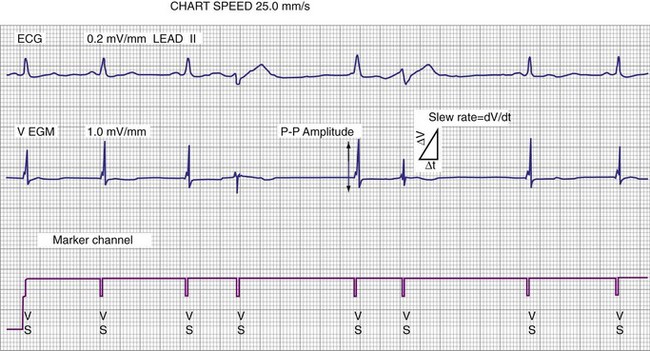
The largest and steepest deflection on the local EGM, called the intrinsic deflection, occurs when the wavefront of depolarization passes the small-tip electrode. The EGM amplitude traditionally is defined as the peak-to-peak amplitude of the intrinsic deflection (measured in mV), as shown in Figure 3-5. The duration of a ventricular EGM usually is less than that of the QRS of the surface ECG, because the EGM is a local signal. The amplitude of an atrial electrogram (AEGM) or ventricular electrogram (VEGM) is determined primarily by the excitable tissue near the tip electrode and therefore is usually similar for unipolar and bipolar signals. Typical amplitudes are 5 to 30 mV for VEGMs and 1.5 to 6 mV for AEGMs.1,2,5
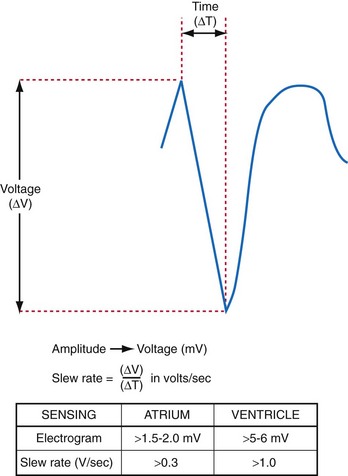
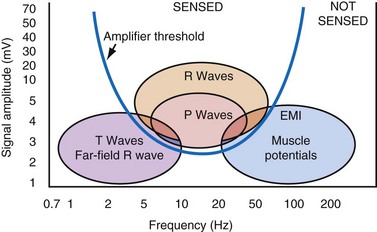
The maximum slope of the intrinsic deflection is the slew rate, measured in volts per second, which represents the maximum rate of change of EGM voltage. Mathematically, it is the first derivative of the voltage, dV/dt, so it depends on both the amplitude and the duration of the EGM, and it provides a crude representation of the frequency content. The frequency content of ventricular and atrial EGMs is similar and in the range of 5 to 50 Hz. T waves and far-field R waves have lower frequency content, whereas most myopotentials and EMI have higher frequency content (Fig. 3-6). Typical values for slew rates are 2 to 3 V/sec for VEGMs and 1 to 2 V/sec for AEGMs.3,4 Usually, an EGM with acceptable amplitude also has an acceptable minimum slew rate (>1 V/sec for VEGMs, >0.3 V/sec for AEGMs). EGMs with very low amplitude will not be sensed, regardless of the slew rate.
Increasing the size of the tip electrode in the range of 2 to 10 millimeters (mm) has minimal effect on atrial EGM amplitude but increases EGM duration (Fig. 3-7). For short ventricular bipolar interelectrode spacing of 5 mm or less, the R-wave amplitude decreases, because the difference between the two unipolar EGMs from each electrode causes cancellation in the net bipolar signal. The slew rate increases, because the time between arrival of the wavefront at the two electrodes decreases more than the EGM amplitude. When two electrodes are widely separated, as in early Y-adapted cardiac resynchronization electrode systems, two distinct intrinsic deflections may be recorded on the EGM—one representing right ventricular (RV) activation and the other left ventricular (LV) activation. The interval between these deflections is determined by the conduction delay between the ventricles near the two electrodes.
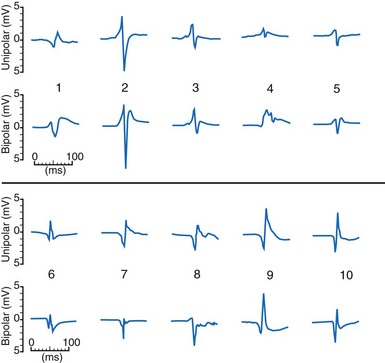
The waveshapes of EGMs are quite variable (Fig. 3-8), probably because geometry of the trabecular endocardium adjacent to the tip electrode is complex. In one study at pacemaker lead implantation, 58% of unipolar EGMs were biphasic, with an initial upstroke followed by a roughly equal downstroke; 30% were predominantly monophasic negative, and 12% were predominantly monophasic positive.1
The ventricular depolarization recorded on the atrial electrode is referred to as the far-field R wave (FFRW). Oversensing of the FFRW confounds interpretation of the atrial rhythm. The amplitude of the FFRW depends on the location of the atrial electrode. It is greatest near the septum, intermediate in the right atrial appendage, and least on the right atrial free wall. Even if the FFRW has comparable amplitude to the P wave, its slew rate usually is much lower. In one series, the mean slew rate was 1.2 V/sec for AEGMs and 0.13 V/sec for FFRWs.1
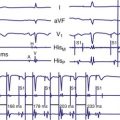
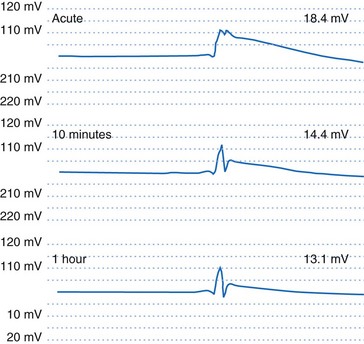
If an active-fixation, screw-in tip electrode is successfully attached to the myocardium, the acute VEGM has a current of injury, with an elevated ST segment (Fig. 3-9) that is usually greatly reduced within 10 minutes after electrode fixation. During this 10-minute period, the EGM amplitude and slew rate usually do not change despite changes in waveshape, but the pacing threshold decreases by an average of 40%.2
Acute to Chronic Changes and Fixation
The amplitude and slew rate of intracardiac EGMs typically decline during the first several days to weeks after lead implantation and then increase to chronic values that are slightly lower than those measured at implantation.6 The initial decrease in EGM amplitude is caused by the inflammatory response and edema at the electrode-tissue interface. This gradually resolves and is followed by development of a small, inexcitable fibrotic zone surrounding the electrode tip (Fig. 3-10). This inflammation and fibrotic tissue effectively increases the distance between the surface of the electrode and excitable myocardium that generates the EGM signal. Although chronic EGM amplitudes usually are reduced by less than 10% compared with acute amplitudes, chronic slew rates are reduced by 30% to 40%.7
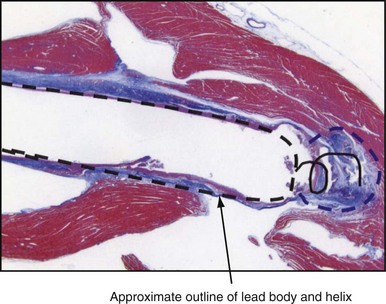
The large dotted line shows where the lead body was located, and the colored staining shows a thin, fibrotic sheath around the lead body. The approximate location of the helical screw-tip electrode is shown by the solid coiled line. The oval shape (dotted line) shows the size of the fibrotic capsule that formed around the helical extended-tip electrode. Most of the tissue outside the dotted lines stained red, indicating that it was active myocardium capable of conducting depolarizations. The tip region of this electrode is similar to that of the tip electrode in Figure 3-1, so propagation of depolarization wavefronts must travel around the tip electrode, in tissue largely out of the field of view on the right side of this figure.
The method of lead tip stabilization, active screw-in or passive tines, has had no significant effect on sensing characteristics in most studies.8,9 Steroid-eluting electrodes reduce chronic pacing thresholds substantially, but also have no significant effects on sensing.10–13
Metabolic, Ischemic, Aging, and Drug Effects
The effects of metabolic abnormalities and drugs on pacing thresholds are well described. Much less information is available concerning their effects on EGMs and sensing. Factors that reduce EGM amplitude, slow conduction velocity, or diminish slew rate may produce either oversensing or undersensing. By prolonging the intracardiac EGM duration beyond blanking periods, ischemia or antiarrhythmic drugs can produce double-counting of the QRS complex.14 Similarly, drugs that prolong the PR or QT interval beyond the refractory period may result in oversensing.15,16
Undersensing may result from reduction in EGM amplitude or slew rate after myocardial infarction at the electrode-tissue interface, from drug and electrolyte effects,15,16 or from progression of conduction system disease. Acute ischemia causes ST-segment changes that can be detected on VEGMs. Monitoring of EGM ST-segment shifts has been proposed as a method for monitoring ischemia for pacemakers and ICDs.17 The likelihood of recording abnormal AEGMs (defined as ≥100 msec in duration or having ≥8 fragmented deflections) correlates with age of the patient (r = 0.34; P < .0005).18
Exercise, Respiratory, and Postural Effects
The effect of exercise on the AEGM amplitude and slew rate is variable. Some studies have reported statistically significant decreases in amplitude that average 10% to 20% but may reach 40% in some patients.19,20 Other studies did not find significant changes between rest and exercise.21,22 Decreases in AEGM amplitude were not caused by atrial rate alone or by beta blockade.23 VDD/R lead studies with “floating” atrial electrodes showed particularly large decreases with exercise.24,25 Decreases in AEGM amplitude with lead maturation support the programming of a large safety margin for sensing at implantation to offset effects of lead maturation.
P-wave amplitude increases significantly during full inspiration, during full expiration, and with erect posture.22 Respiratory variation averaged 9.7% for unipolar AEGMs and 11.5% for bipolar AEGMs.25,26 The effect of respiration on VEGMs was less, especially with the unipolar configuration.26
Ventricular Electrograms during Premature Ventricular Complexes, Ventricular Tachycardia, and Ventricular Fibrillation
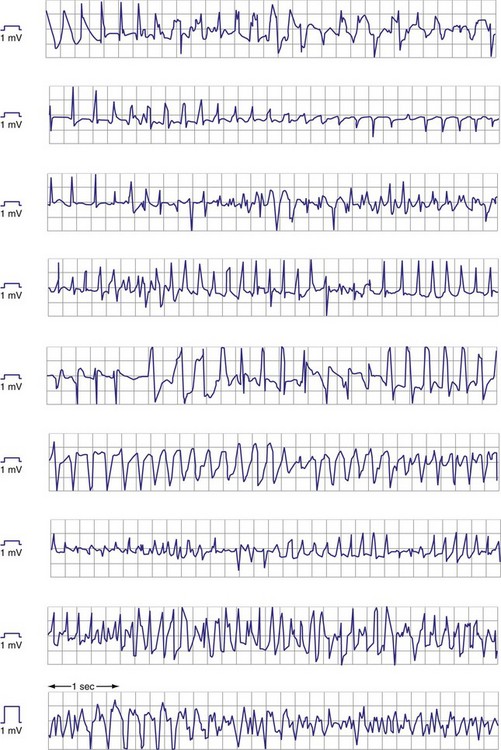
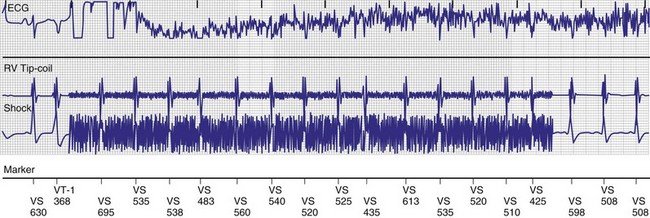
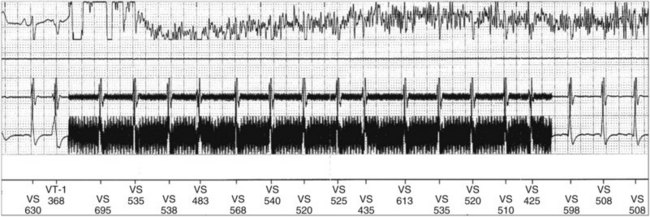
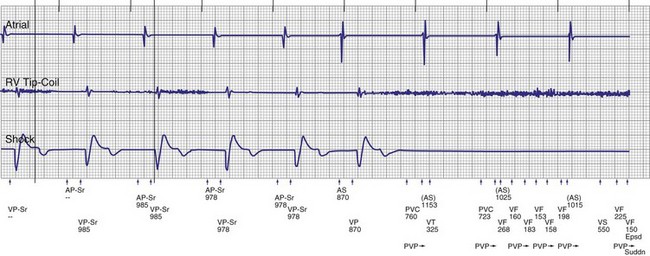
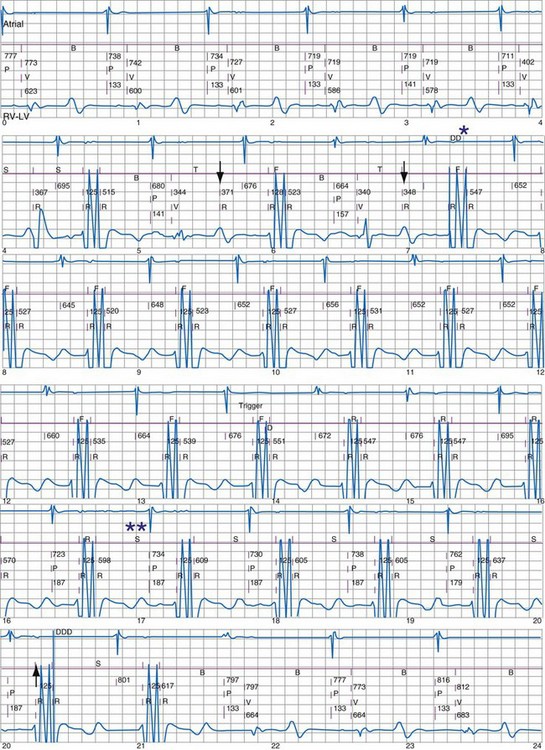
Premature ventricular complexes (PVCs) may have lower-amplitude R waves than sinus-rhythm R waves, as shown in Figure 3-11, but the reverse may also be true. For monomorphic ventricular tachycardia (VT), mean amplitude decreased only slightly from values in sinus rhythm—14% for epicardial EGMs and 5% for endocardial EGMs.27 In contrast, EGM amplitudes during ventricular fibrillation (VF) decreased by 25% for epicardial and 41% for endocardial EGMs. More importantly, EGMs in VF often have low, highly variable, and rapidly changing amplitudes and slew rates. Figure 3-12 shows endocardial spontaneous VF EGMs from different patients, illustrating variability in intrinsic deflections, amplitudes, slew rates, and morphologies. In a study of induced VF reproducibility, 50% of the variability was caused by interpatient differences and the other 50% occurred among repeated episodes in the same patient.28 In another study, the VEGM amplitude in VF was 1 mV or less in at least one VF episode in 29% of patients.27 If VF lasts for minutes, the amplitude and slew rate of the EGMs decrease.
Atrial Electrograms during Rhythms Other Than Sinus
Atrial activation from ectopic sites or atrial arrhythmias can alter the amplitude, frequency content, slew rate, and morphology of the AEGM. Retrograde atrial activation during ventricular pacing reduces AEGM amplitude and slew rate by up to 50%.29 These EGM changes are more pronounced in the high right atrium than in the right atrial appendage or low right atrium.30 The frequency content of the AEGM is not significantly altered by retrograde atrial activation.31 Analysis of EGM turning-point morphology or the first-differential coefficient of slew rate has been used to discriminate sinus EGMs from those recorded during retrograde and ectopic atrial activation in small groups of patients.32
Atrial EGMs during atrial fibrillation (AF) are characterized by extreme temporal and spatial variability. EGMs tend to be most organized in the trabeculated right atrial appendage and more disorganized in the smooth right atrium or coronary sinus.33–35 Thus electrode spacing and positioning of atrial leads influence EGM characteristics during AF36–38 and may cause inconsistent diagnosis of AF based on rate criteria.
The amplitude of chronic, unipolar pacemaker EGMs was 40% less in AF than in sinus rhythm.39 A comparison of acute AEGM amplitudes recorded with temporary pacing catheters showed that the mean sinus-rhythm EGM amplitude decreased only slightly in atrial flutter but decreased by about 50% in AF.35 Antiarrhythmic drugs may also interfere with sensing during AF by reducing atrial rate, median frequency, and EGM amplitude.40
Subcutaneous Electrocardiography
The subcutaneous ECG is similar to the surface ECG because the two subcutaneous electrodes are sufficiently distant from the heart that they record electrical activity from the entire heart. As with the surface ECG, the amplitude of subcutaneous ECG signals usually is 1 mV or less. Simultaneous recordings of subcutaneous ECG signals and surface ECG signals from electrodes placed directly over the subcutaneous locations have similar amplitude and signal-to-noise ratio.41 Practical implantation considerations usually limit the subcutaneous electrode separation distance to 4 to 8 cm, compared with the typical surface ECG limb lead electrode separation of 40 to 60 cm.
The orientation of the two subcutaneous electrodes relative to the heart can affect the amplitude of the signal recorded.42 Mapping studies on the chest skin with 4-cm electrode spacing in the range used by implantable loop recorders (ILRs) show larger intrinsic QRS amplitudes of 0.5 ± 0.1 mV for vertical orientation in the left parasternal zone and for horizontal orientation near the apex of the heart. Subcutaneous ECGs are used to detect arrhythmias in ILRs, to obviate the need for surface ECG electrodes during follow-up of pacemakers and ICDs, and to detect VT/VF in an ICD without intravascular electrodes.
 Sensing
General Concepts
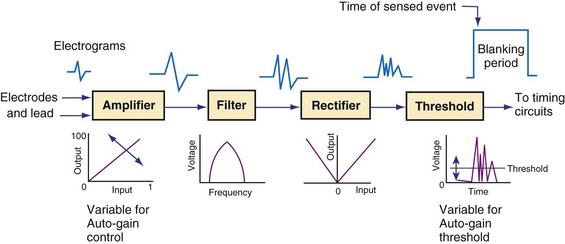
Figure 3-13 shows the primary functional operations of sensing systems used by pacemakers and ICDs. The raw signal passes from the leads to the connector, through hermetic feedthroughs with high-frequency filters and high-voltage protection circuitry, before reaching the sensing amplifier. After the signal is amplified, a band-pass filter processes it to reduce T waves, myopotentials, and EMI (filtering). Then, it is rectified to nullify effects of signal polarity (rectification). Finally, it is compared with the sensing-threshold voltage. At the instant the processed signal exceeds the sensing-threshold voltage, a sensed event is declared to the timing circuits and indicated by a marker pulse on the programmer marker channel. The sense amplifier in the same chamber is turned off or “blanked” for a short blanking period (20-250 msec) after each spontaneous depolarization or pacing stimulus, to prevent a single depolarization resulting in multiple sensed events. In the refractory period that follows the blanking period, the sense amplifier remains enabled. Sensed events occurring in refractory periods do not alter pacemaker timing cycles but may be sensed for tachyarrhythmia detection algorithms.
Blanking and Refractory Periods
Blanking periods and refractory periods are used to prevent undesirable behavior caused by oversensing or double-counting of cardiac activity (Figs. 3-14 and 3-15). The specifications of blanking/refractory periods have substantial impact on ICD sensing and pacing functions (Fig. 3-16). Same-chamber blanking/refractory periods after sensed events reduce double-counting of intrinsic cardiac depolarizations that may result in escape pacing at a rate slower than the programmed lower rate in pacemakers or inappropriate detection of VF in ICDs. After paced events, the same-chamber blanking/refractory periods are typically longer and prevent oversensing of the pacing artifact and evoked response. The blanking/refractory periods in the ventricle after atrial sensed or paced events and in the atrium after ventricular sensed or paced events are called cross-chamber blanking/refractory periods. Cross-chamber blanking periods help to prevent oversensing of the pacing artifact after a paced event in the opposite chamber.
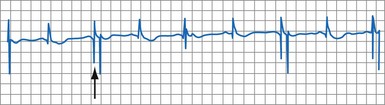
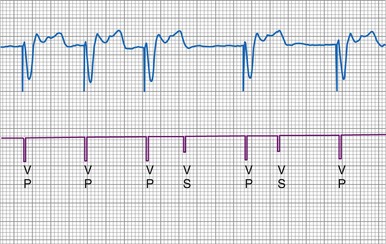
Figure 3-16 Basic blanking and refractory periods for DDDR mode (Medtronic Marquis DR ICD and EnPulse DR pacemakers).
Implantable cardioverter-defibrillators that require tachyarrhythmia detection typically have shorter blanking and refractory periods than standard pacemakers, so that short cardiac cycles can be sensed reliably. As shown in the bottom marker diagrams of Figure 3-16, blanking periods may be adaptively extended based on noise-sampling windows (30-60 msec) if suprathreshold activity (due to cardiac or extracardiac sources such as EMI) is identified on the EGM immediately after a sensed event. If noise is seen in consecutive windows after a sensed event, the blanking period is “retriggered” for that beat to avoid double-counting or continuous oversensing. This operation may result in paradoxical undersensing of the cardiac rhythm when more sensitive sensing levels are programmed if noise is oversensed.43,44
The duration of the total atrial refractory period (TARP), equal to the atrioventricular (AV) delay plus the PVARP, in DDD pacing modes limits atrial tracking of the atrium at high sinus rates without affecting atrial sensing, as shown in Figure 3-17. Because the AV delay of most dual-chamber pacemakers shortens in response to increasing atrial rates or sensor input, the TARP also shortens. Several manufacturers now offer dual-chamber pacemakers that shorten the PVARP with increasing atrial or sensor-indicated rates, further reducing the TARP during exercise. The result of these newer algorithms is that the programmed upper tracking rate can be safely increased while providing protection at lower heart rates from initiation of pacemaker-mediated tachycardia caused by retrograde conduction.
Sensing Thresholds in Pacemakers
Unipolar sensing thresholds typically are set higher (less sensitive) than bipolar sensing thresholds to reduce oversensing of far-field cardiac and extracardiac signals that can lead to inappropriate pacemaker inhibition or tracking. Newer pacemakers automatically adjust the sensitivity setting to adapt to changes in EGM amplitude over time. Typically, these functions operate to modify sensing thresholds based on a series of 10 to 20 ventricular beats. One such algorithm employs two simultaneous sensing levels: the programmed sensitivity (inner target) and a value twice the programmed value (outer target) (Fig. 3-18).45 Sensed EGMs exceeding both target values decrease the sensitivity. Signals exceeding only the inner target increase the sensitivity. In this manner, a 2 : 1 sensing margin is maintained. Rapid, automated sensitivity adjustments may be desired when EGM amplitudes can be expected to change over a brief period, such as beat-to-beat variations from respiration, body position changes, or fluctuating EGM morphologies during AF.46
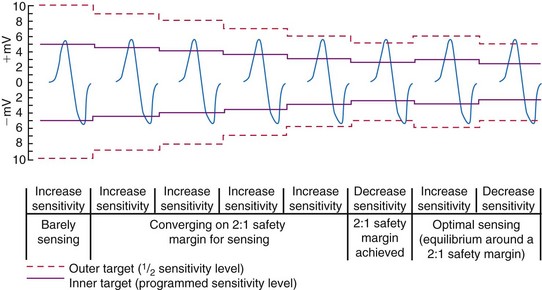
Figure 3-18 Autosensing algorithm to maintain a 2 : 1 sensing safety margin.
(From Castro A, Liebold A, Vincente J, et al: Evaluation of autosensing as an automatic means of maintaining a 2:1 sensing safety margin in an implanted pacemaker. Autosensing Investigation Team. Pacing Clin Electrophysiol 19:1708-1713, 1996.)
Far-field R-wave oversensing can be minimized by (1) selecting an atrial lead with a closely spaced bipolar electrode pair (≤10 mm), (2) choosing an implantation location that yields an FFRW/P-wave ratio of less than 0.5,47 (3) titrating programmed sensitivity to reject FFRWs without undersensing P waves and low-amplitude AF, and (4) using PVAB.
Ventricular Sensing in Ventricular ICDs
Automatic Adjustment of Sensitivity
Adjustment of Sensitivity in Normal Rhythm
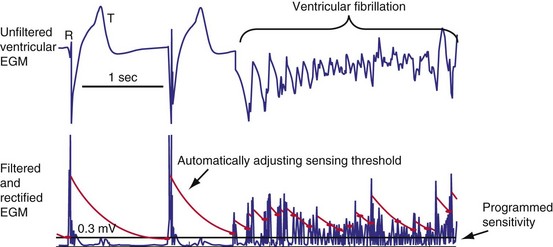
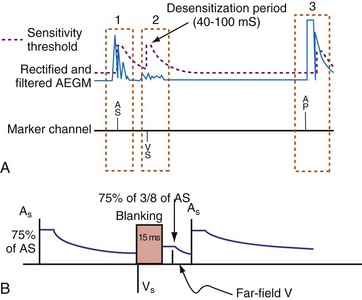
All ICDs automatically adjust sensitivity in relation to the amplitude of each sensed R wave (Fig. 3-19). At the end of the blanking period after each sensed ventricular event, the sensing threshold is set to a high value. It then decreases with time until a minimum value is reached. Compared with a fixed sensing threshold, automatic adjustment of sensitivity increases the likelihood of sensing low-amplitude and varying EGMs, while minimizing the likelihood of T-wave oversensing.
The methods of the different manufacturers for automatic adjustment of sensitivity perform similarly after small R waves but differently after large R waves. Figure 3-20 shows that after large R waves, the Boston Scientific ICDs increase the sensing floor. In the Cognis/Teligen family, the sensing floor is set to one-eighth the amplitude of the measured R wave if that value is greater than the programmed sensitivity. This prevents T-wave oversensing in the setting of large R waves and reduces oversensing of low-amplitude noncardiac signals (e.g., diaphragmatic myopotentials, EMI). However, it may increase the risk of undersensing during rare episodes of VF with highly variable EGM amplitude.48
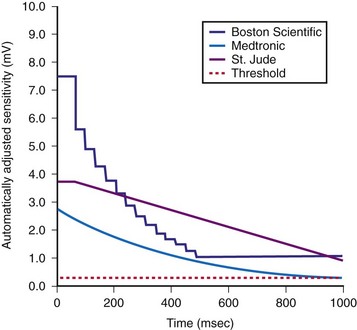
The programmed sensing threshold is approximately 0.3 mV. After sensed ventricular events, Medtronic ICDs reset the sensing threshold to 8 to 10 times the programmed sensitivity, up to a maximum of 75% of the sensed R wave. The value of Auto-Adjusting Sensitivity then decays exponentially from the end of the (sense) blanking period, with a time constant of 450 msec, until it reaches the programmed (maximum) sensitivity. At the nominal sensitivity of 0.3 mV, there is little difference between the sensitivity curves of Medtronic ICDs after large and small spontaneous R waves. If the R wave is large, the entire Auto-Adjusting Sensitivity curve can be altered substantially by changing the programmed value of maximum sensitivity (see Fig. 3-19). At nominal settings, the St. Jude Threshold Start begins at 62.5% of the measured R wave for values between 3 and 6 mV. If the R-wave amplitude is greater than 6 mV or less than 3 mV, the Threshold Start is set to 62.5% of these values (3.75 mV and 1.875 mV, respectively). The sensing threshold remains constant for a Decay Delay period of 60 msec and then decays linearly with a slope of 3 mV/sec. Both the Threshold Start percent and the Decay Delay are programmable, over the range of 50% to 75% and 0 to 220 msec, respectively (see Fig. 3-21). Boston Scientific Cognis-Telegin ICDs set the starting threshold to 75% of sensed R waves with a maximum limit of 3/2 · Peak Running Average. Sensitivity then decays using digital steps, each seven-eighths the amplitude of the previous step. For sensed events, the duration of the first step is 65 msec, and the duration of subsequent steps is 35 msec. This results in a sensitivity of one-half the peak R wave in about 170 msec. (See text for further details.) After a paced ventricular event, all ICDs also adjust sensitivity dynamically, starting at the end of the (pace) blanking period, but the threshold starts at a more sensitive setting.
(Modified from Swerdlow C, Friedman P: Advanced ICD troubleshooting. Part I. Pacing Clin Electrophysiol 28:1322-1346, 2005.)
Postpacing Automatic Adjustment of Sensitivity
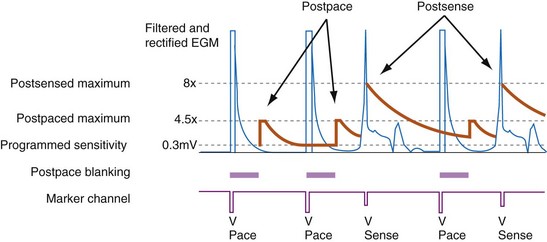
After ventricular pacing, all ICDs set ventricular sensitivity to a highly sensitive value to prevent pacing during VF. The sensitivity threshold then decays to the programmed sensitivity level (Fig. 3-21). Thus ICDs are especially vulnerable to oversensing of low-amplitude signals late in diastole during pacing, when the amplifier sensitivity or gain is maximal. Clinically, the most important manifestation is the oversensing of diaphragmatic myopotentials.3
Ventricular Blanking Periods
Short Same-Chamber Blanking Periods and R-wave Double-Counting
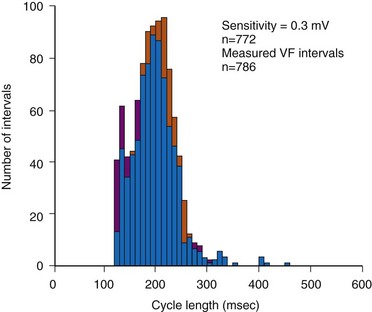
In adults who are not taking antiarrhythmic drugs, inter-EGM intervals for filtered EGMs in VF vary from about 130 to 300 msec, with a peak near 200 msec (Fig. 3-22). Therefore, fixed or nominal blanking ICD periods after ventricular sensed events range from 120 to 135 msec. R-wave double-counting occurs if the duration of the sensing EGM exceeds the ventricular blanking period.
Cross-Chamber Blanking Periods and Undersensing of VT/VF
Under most conditions, ICDs apply only the minimum cross-chamber ventricular blanking required to prevent “crosstalk” resulting from an atrial pacing stimulus. During high-rate atrial or dual-chamber pacing, ventricular sensing may be restricted to short periods of the cardiac cycle because of the combined effects of ventricular blanking after ventricular events and cross-chamber ventricular blanking after atrial pacing. If a sufficient fraction of the cardiac cycle is blanked, systematic undersensing of VT or VF may occur. When pacing and blanking events occur at intervals that are multiples of a VT cycle length, ventricular complexes may be repeatedly undersensed, delaying or preventing detection.52–54 This occurs most often with rate-smoothing algorithms.
“Sensing” Other Ventricular Electrograms
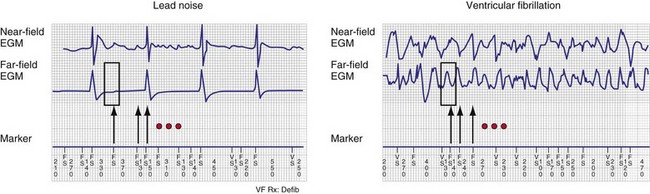
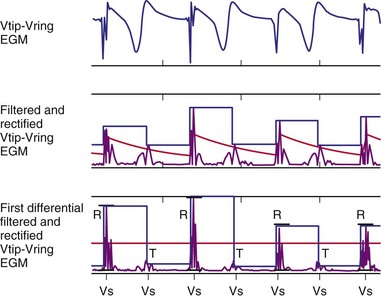
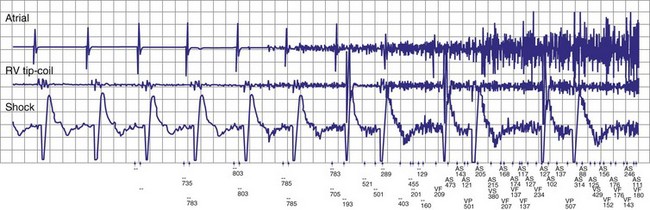
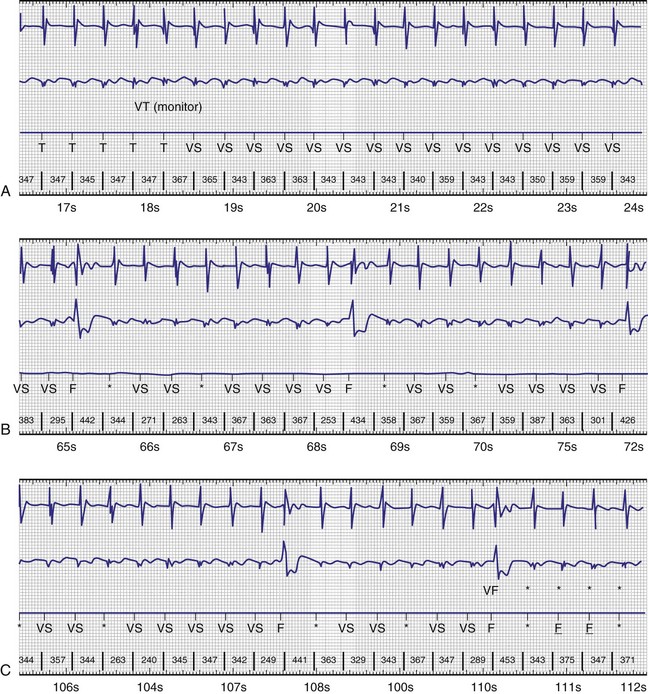
Automatic analysis of the far-field EGM has also been proposed as a method to identify oversensing in ICDs resulting from lead fracture or sensing-lead connection problem. In one approach, the peak-peak far-field EGM amplitude is measured in a small window centered around each sensed event (on near-field channel) to discriminate rapid oversensing from true VT/VF. Oversensing is identified when sensed events on the near-field channel correspond to isoelectric periods on the far-field channel.55,56 In true VF, isoelectric periods are rare on the far-field channel (Fig. 3-23).
Evaluating Sensing of Ventricular Fibrillation at Implantation
Increasing interest in implanting ICDs without assessing defibrillation efficacy has focused attention on the extent to which adequacy of VF sensing can be determined from EGMs recorded in baseline rhythm. Although the statistical correlation between R-wave amplitude in VF and baseline rhythm is weak,57,58 two studies reported that sensing of VF is adequate with nominal sensitivities near 0.3 mV if the baseline R wave is sufficiently large (≥5 mV or ≥7 mV).59 Rarely, clinically significant undersensing of VF or polymorphic VT may occur despite adequate sinus-rhythm R waves.48,60 In these cases, undersensing occurs because auto-adjusting sensitivity criteria respond inadequately to variations in R-wave amplitude, rather than consistently low-amplitude R waves. The reproducibility of this phenomenon is unknown, as is its predicted extent at implantation.
Therefore, it is uncertain whether clinically appropriate testing at implantation can detect this infrequent cause of undersensing. During ICD implant with true bipolar sensing and current digital sensing amplifiers, clinically significant undersensing of VF is rare and unrelated to sinus-rhythm R-wave amplitude.61 Undersensing of spontaneous VT/VF in the VF zone is similarly rare. Reliable sensing of VF cannot be predicted from baseline EGMs if the baseline ventricular rhythm is paced. Sensitivity is programmed to a less sensitive value than nominal (e.g., to avoid T-wave oversensing), or patients have other implanted electronic ICDs, such as pacemakers, cardiac contractility modulation devices, or transcutaneous electrical nerve stimulation (TENS) units, that could cause device-device interactions.
Postshock Sensing
Postshock sensing is critical for redetection of VF after unsuccessful shocks and for accurate detection of episode termination. Electroporation, the process by which strong electric fields create microscopic holes in the cardiac cell membranes, has been proposed as the mechanism for postshock distortion of EGMs recorded from high-voltage electrodes.62 Because EGMs of dedicated bipolar sensing electrodes are minimally affected by shocks,63 they became standard for early epicardial ICDs. For transvenous ICDs, postshock sensing recovers more rapidly with true bipolar sensing configurations than with integrated bipolar sensing.64,65 This is a minor issue for current integrated bipolar leads with a pacing tip electrode–to–distal coil spacing of approximately 12 mm.66
Atrial Sensing in Dual-Chamber ICDs and Atrial ICDs
Postventricular Atrial Blanking and Rejection of Far-Field R Waves
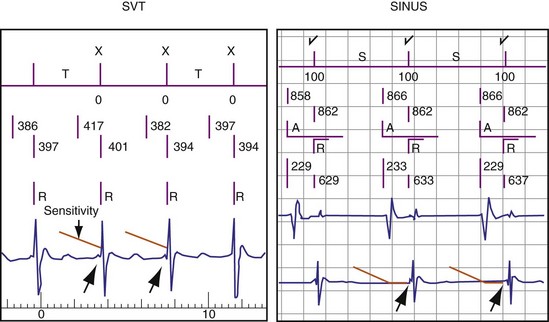
To prevent oversensing of FFRWs, older dual-chamber ICDs had fixed PVAB periods, similar to those in pacemakers (Fig. 3-24). With a fixed blanking period, the blanked proportion of the cardiac cycle increases with the ventricular rate. Atrial undersensing caused by PVAB causes underestimation of the atrial rate during rapidly conducted atrial flutter or AF, resulting in inappropriate detection of VT67 (Fig. 3-24, lower panel). Without PVAB, however, atrial oversensing of FFRWs could cause overestimation of the atrial rate during tachycardias with a 1 : 1 AV relationship.68 This may result in either inappropriate rejection of VT as SVT, if FFRWs are counted consistently as atrial EGMs, or inappropriate detection of SVT as VT, if FFRWs are counted inconsistently.69
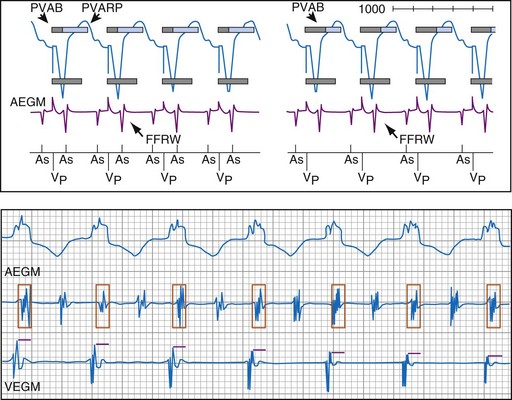
Medtronic ICDs also reject FFRWs algorithmically by identifying a specific pattern of atrial and ventricular events that fulfill specific criteria (Fig. 3-25). Intermittent sensing of FFRWs or frequent premature atrial events may disrupt this pattern, resulting in misclassification of a tachycardia. Therefore, it is preferable to reject FFRWs after sensed ventricular events by decreasing atrial sensitivity, if this can be done without undersensing of AF. Atrial sensitivity can be reduced to 0.45 mV with a low risk of undersensing AF. Less sensitive values should be programmed only if the likelihood of rapidly conducted AF is low. FFRW oversensing that occurs only after paced ventricular events (when auto-adjusting atrial sensitivity is maximal) does not cause inappropriate detection of SVT as VT, but it may cause inappropriate mode switching and can contribute to inappropriate detection of AF or atrial flutter.
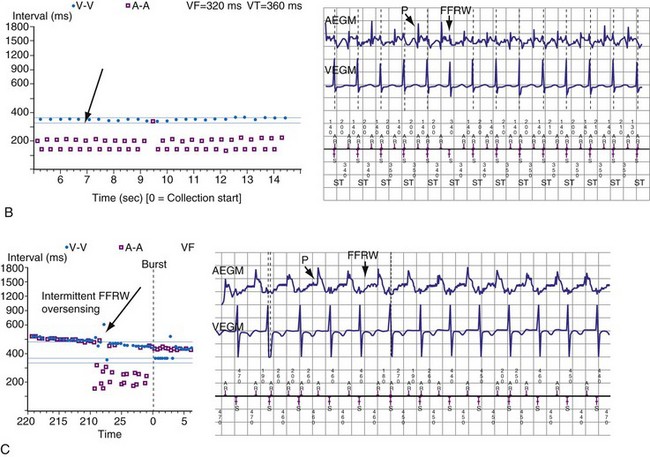
Medtronic ICDs (starting with Entrust) and Boston Scientific ICDs (starting with Vitality) may use brief atrial blanking or a period of reduced, automatically-adjusting sensitivity (or both) to reject FFRWs without preventing detection of AF (Fig. 3-26). St. Jude ICDs and Medtronic ICDs starting with Entrust provide programmable atrial blanking after sensed ventricular events to individualize the trade-off between oversensing of FFRWs and undersensing of AEGMs in AF. St. Jude ICDs also provide programmable atrial sensing Threshold Start and Decay Delay, corresponding to the same features in the ventricular channel.
Sensing in Cardiac Resynchronization ICDs
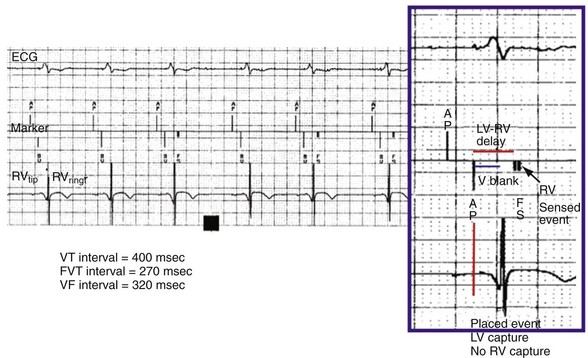
Left ventricular PVCs may activate the left ventricle but may not be sensed in the right ventricle before pacing is delivered. In this case, LV pacing could be delivered during the vulnerable period of the PVC. Boston Scientific cardiac resynchronization ICDs also sense in the left ventricle to reduce ventricular proarrhythmia by preventing pacing into the LV vulnerable period. The left ventricular protection period (LVPP) is a programmable interval (300-500 msec) following an LV event when the ICD will not pace in the left ventricle (Fig. 3-27). This prevents inadvertent delivery of an LV pacing pulse during the LV vulnerable period. The LVPP differs from other pacing refractory periods, which are designed to prevent inappropriate inhibition of pacing.
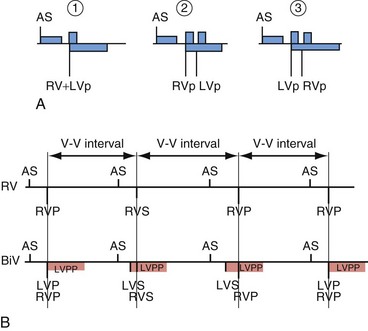
Figure 3-27 Event markers illustrate blanking periods in cardiac resynchronization ICDs.
(Courtesy Boston Scientific, Indianapolis; B from Kay G: Troubleshooting and programming of cardiac resynchronization therapy. In Ellenbogen K, Kay G, Wilkoff B, editors: ICD therapy for congestive heart failure. Philadelphia, 2004, Elsevier.)
 Ventricular Oversensing: Recognition and Troubleshooting
Oversensing is defined as sensing of unintended nonphysiologic signals or of physiologic signals that do not accurately reflect local depolarization. Nonphysiologic signals usually arise from extracardiac EMI (e.g., ungrounded electrical equipment, antitheft detectors, surgical electrocautery) or mechanical problems in the sensing circuit, which may occur in the lead (insulation failure or fracture), connection between lead and header, or feedthrough wires from the header to the inside of the pulse generator. Rarely, electrical artifacts arise from retained fragments of abandoned intracardiac leads. Physiologic signals may be intracardiac (P, R, or T waves) or extracardiac myopotentials. Oversensing often results in characteristic patterns of stored EGMs and associated markers70,71 (Fig. 3-28). In pacemakers, oversensing may manifest as either failure to deliver an expected pacing stimulus or inappropriate tracking of nonphysiologic signals in the atrial channel of a dual-chamber ICD. In ICDs, oversensing usually manifests as inappropriate detection of VT or VF. This section focuses on oversensing in ICDs.
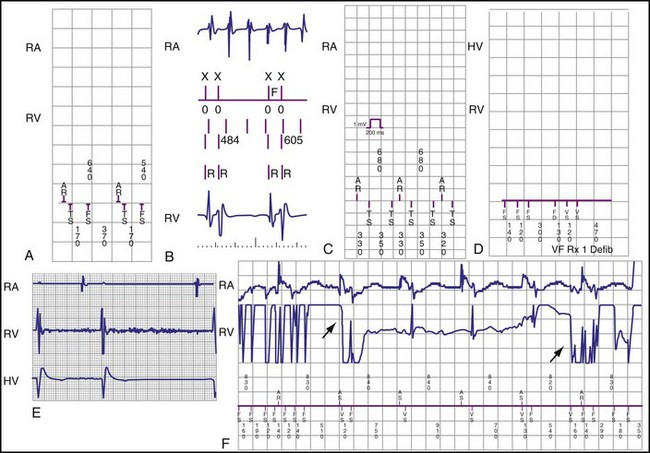
Figure 3-28 Types of oversensing resulting in inappropriate detection of ventricular tachycardia/fibrillation (VT/VF).
(From Swerdlow C, Shivkumar K: Implantable cardioverter defibrillators: clinical aspects. In Zipes DP, Jalife J, editors: Cardiac electrophysiology: from cell to bedside, ed 4, Philadelphia, 2004, Saunders.)
Intracardiac Signals
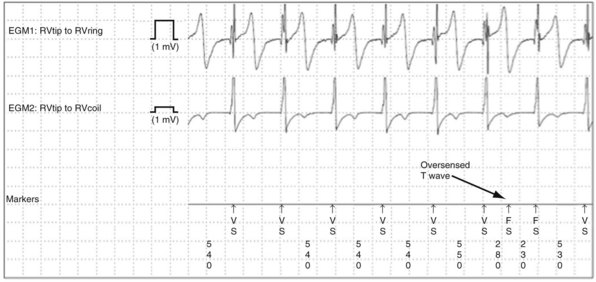
T-wave Oversensing
T-wave oversensing is the most common clinically-significant cause of intracardiac oversensing. Oversensing of spontaneous T waves may cause inappropriate detection of either VT or VF, depending on the sensed R wave–to–T wave interval and the programmed VF detection interval. T-wave oversensing is typically identified by alternating EGM morphologies.70 Device-measured intervals during T-wave oversensing may also alternate, but the degree of alternation often is small and difficult to recognize, especially during sinus tachycardia or if the QT interval is prolonged.
T-wave oversensing may be divided into three classes: postpacing, large R wave (>3 mV) in spontaneous rhythm, and small R wave (<3 mV) in spontaneous rhythm (Fig. 3-29). Postpacing T-wave oversensing can inhibit bradycardia pacing49,72 or cause antitachycardia pacing to be delivered at the wrong cycle length.49 It does not typically cause inappropriate detection of VT but may increment VT or VF counters, making detection of nonsustained VT more likely. It is corrected by increasing the postpacing ventricular blanking period.
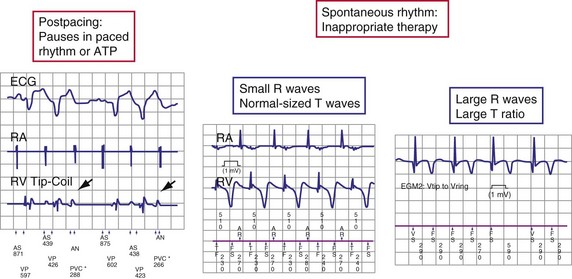
Oversensing of spontaneous T waves often occurs in the setting of low-amplitude R waves because the sensing threshold decays from a fraction of the preceding low-amplitude R wave.73 To compound the problem, patients with low-amplitude R waves may require lower minimum sensing thresholds to ensure reliable sensing of VF. T-wave oversensing in these patients is a warning that detection of VF may be unreliable. The ventricular lead should be revised or a separate pace/sense lead added if the safety margin for sensing VF is insufficient.
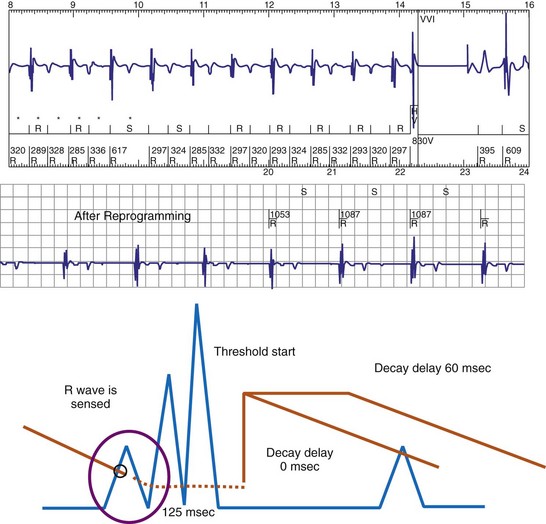
Figure 3-30 Specific programmable features to correct T-wave oversensing.
(From Swerdlow CD, Friedman PA: Advanced ICD troubleshooting. Part I. Pacing Clin Electrophysiol 28:1322-1346, 2005.)
R-wave Double-Counting
R-wave double-counting occurs if the duration of the sensed EGM exceeds the short ventricular blanking period in ICDs; currently, this is a rare clinical problem. Consistent R-wave double-counting may result from local ventricular delays in the baseline state in native rhythm or those resulting from use-dependent effects of sodium channel–blocking antiarrhythmic drugs or of hyperkalemia. Double-counting may also occur with loss of RV capture in cardiac resynchronization ICDs: The ICD counts both the paced ventricular event and the conducted wavefront arriving at the RV bipole as a result of LV capture, if the interventricular conduction delay exceeded the ventricular blanking period. R-wave double-counting was a common problem in early ICDs that used Y-adapted or extended bipolar sensing between RV and LV electrodes.75 The composite ventricular EGM included deflections from the right ventricle and the left ventricle, both of which could be counted as separate R waves. Occasional R-wave double-counting may occur during PVCs and is more common with integrated bipolar than true bipolar leads.76
R-wave double-counting results in alternation of ventricular cycle lengths that produces a characteristic “railroad track” pattern on a plot of stored ventricular intervals. Because the second component of the R wave is sensed as soon as the blanking period terminates, the double-counted RV-RV or RV-LV interval measures within 20 msec of the ventricular blanking period and is always classified in the VF zone (Fig. 3-33). Inappropriate detection of VF may occur despite a true ventricular rate below the VT detection interval.
P-wave Oversensing
P-wave oversensing may occur if the distal coil of an integrated bipolar lead is close to the tricuspid valve and if the sensed P-R interval exceeds the cross-chamber ventricular blanking period4 (Fig. 3-34). It is rare in adults with ventricular sensing electrodes near the RV apex, but it may occur in children or in adults if the RV electrode dislodges or is positioned in the proximal septum or inflow portion of the right ventricle. If P-wave oversensing occurs during a 1 : 1 rhythm, the sensed “R-R” pattern is similar to that of R-wave double-counting, provided that the sensed P-R or R-P interval is less than the VF detection interval. However, oversensing of P waves as R waves can cause inappropriate detection of VF during AF or atrial flutter, independent of the ventricular rate.
Extracardiac Signals
The distinctive feature of oversensing of extracardiac signals is replacement of the isoelectric baseline with high-frequency noise that does not have a constant relationship to the cardiac cycle.70,71,75,77
External Electromagnetic Interference
With oversensing of external electromagnetic interference, signal amplitude is greater on the high-voltage EGM recorded from widely spaced electrodes than on the sensing EGM recorded from closely spaced electrodes. Although the interference signal may be continuous, oversensing is often intermittent because of auto-adjusting sensitivity. Clinical data may suggest a specific identifiable cause (Fig. 3-35). Some manufacturers (St. Jude, Sorin, Boston Scientific) have specific ICD algorithms to prevent inappropriate detection of VF in the presence of EMI (Fig. 3-36).
Lead/Connector Problems
Oversensing caused by lead insulation failure or conductor fracture, lead-lead mechanical interactions (“chatter”),76 or connector (header, adapter, set-screw) problems is intermittent and may occur only during a small fraction of the cardiac cycle. In ICDs, it is limited to the sensing EGM unless the problem relates to the RV coil in an integrated bipolar lead or to both sensing and high-voltage conductors/connectors. The rate of oversensed signals is always in the VF zone. Intervals below 200 msec are typical. Signals almost always display substantial variability in amplitude or frequency. High-frequency components are common, and high-amplitude signals often saturate the amplifier (Figs. 3-37 to 3-39).
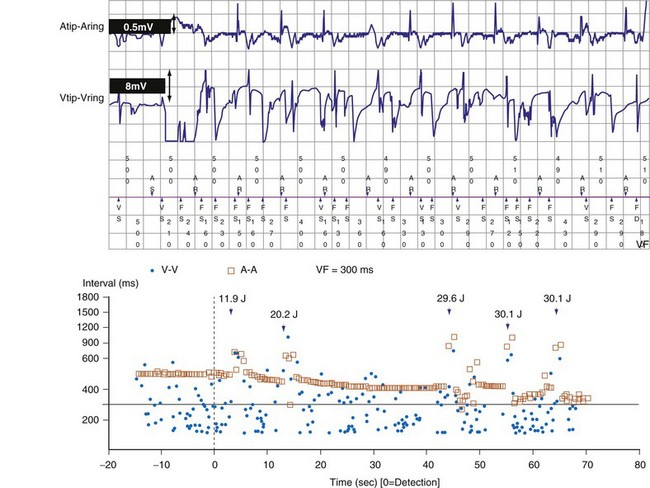
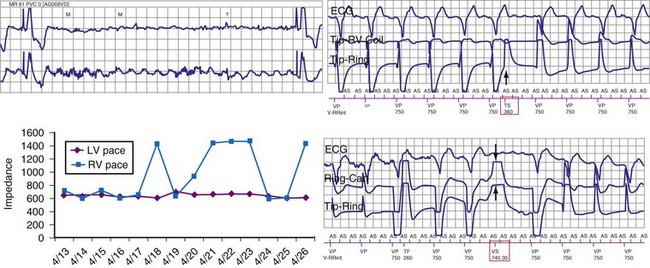
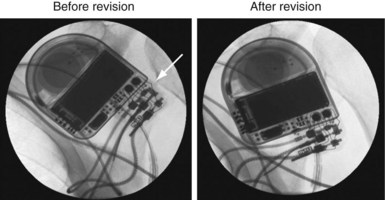
Figure 3-39 Intraoperative fluoroscopic images corresponding to the data presented in Figure 3-38.
The ICD has been removed from the pocket to enhance image quality. Before revision, the lead connector pin was not advanced completely into the header (arrow). The proximal connection between the ring electrode and the header was intermittent, accounting for the high impedance and oversensing illustrated in Figure 3-38. After revision, the ventricular electrode is advanced completely into the header.
In ICDs, extremely short R-R intervals near the ventricular blanking period (120-150 msec) do not represent successive cardiac depolarizations, except occasionally during VF. Medtronic ICDs count these very short intervals as a measure of nonphysiologic oversensing to provide early warning of lead fracture; they store this count as the sensing integrity counter (SIC). A high or rapidly accumulating Sensing Integrity Count (total >300 or 10/day for 3 consecutive days) is a sensitive indicator of pace-sense lead fracture,3,21,22 but in isolation is nonspecific. The most common cause of isolated, extremely short “R-R” intervals is a combination of an oversensed physiologic event and appropriately sensed R wave.
In P-wave oversensing, the nonphysiologic short interval is the P-R interval. In R-wave double-counting, it is the interval between initial and terminal deflections of a true ventricular EGM. In T-wave oversensing, the interval is bounded by an oversensed T-wave and a PVC.76 However, these nonphysiologic combinations of physiologic signals rarely result in repetitive oversensing, which is common in lead or connector problems. Repetitive, transient oversensing may be identified by stored “nonsustained tachycardias.” The combination of isolated, extremely short RR intervals and repetitive rapid oversensing (defined as at least two nonsustained tachycardias with duration ≥5 intervals and mean cycle length ≤220 msec) has a positive predictive value for lead or connector problems of about 80%,76,78 even with a normal pace-sense impedance. Unusual cases of true VF76 and other unusual conditions, such as device-device interactions or header seal-plug problems shortly after implant,79 can produce both isolated, very short intervals and rapid, repetitive oversensing.
Role of lead impedance
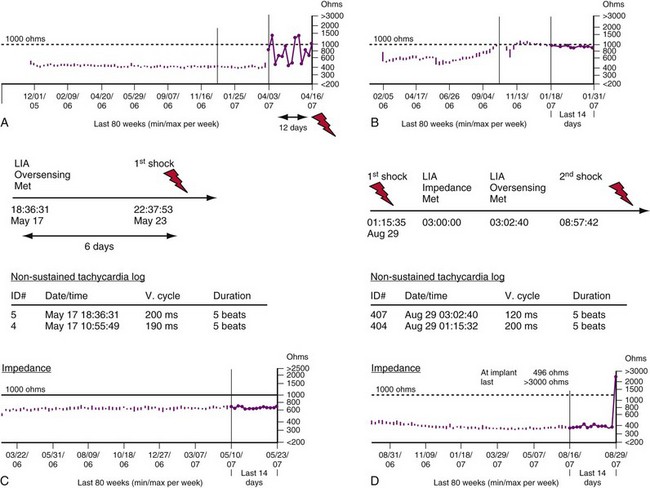
Modern pacemakers and ICDs perform daily, automated measurements of impedance in lead conductors. A large, abrupt change in impedance associated with rapid oversensing is, for practical purposes, diagnostic of a lead or header-connector problem. However, pace-sense conductor fractures typically present as rapid, repetitive oversensing without abnormal impedance.78 A fracture may generate sufficient oversensing to cause inappropriate shocks without an impedance increase or with an impedance increase in the interval between daily impedance measurements.78,80–82 Rarely, pacing precipitates lead-related oversensing.81 Lead fractures or header-connector problems also present frequently as abrupt increases in impedance without oversensing.
The Medtronic Lead Integrity Alert (LIA) is triggered by either abnormally high impedance relative to the patient’s baseline impedance or rapid oversensing unlikely to represent a physiologic event55,78 (Figs. 3-40 and 3-41). Once an alert is triggered, an audible tone sounds immediately and every 4 hours thereafter. LIA alerts also reprogram the number of intervals to detect VF (NID) from the value programmed at the physician’s discretion (nominally 18/24) to 30/40; EGMs are stored for any interval shorter than 200 msec. The purpose of the high NID is to reduce inappropriate shocks caused by transient, fracture-induced oversensing.78 The stored EGMs provide a diagnostic clue to determine the cause of rapid oversensing based on EGM characteristics.76 In newer ICDs with wireless telemetry, alerts in both groups may also initiate Internet notifications.
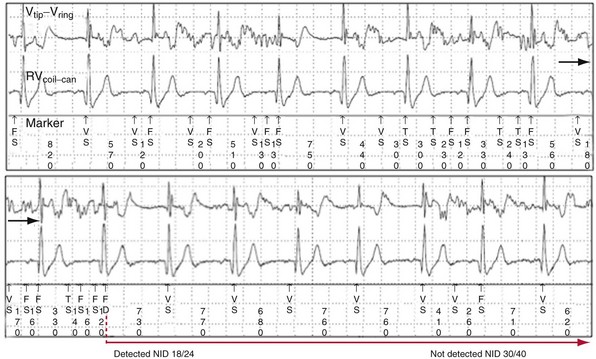
Figure 3-40 Stored electrogram shows intermittent oversensing caused by lead fracture.
(From Swerdlow CD, Gunderson BD, Ousdigian KT, et al: Downloadable algorithm to reduce inappropriate shocks caused by fractures of implantable cardioverter-defibrillator leads. Circulation 118:2122-2129, 2008.)
Myopotential Oversensing
Myopotential oversensing may persist for variable fractions of the cardiac cycle. Diaphragmatic myopotentials are most prominent on the sensing EGM. Oversensing usually occurs after long diastolic intervals or after ventricular paced events when amplifier sensitivity or gain is maximal. It often ends with a sensed R wave, which abruptly reduces sensitivity. In pacemaker-dependent patients, diaphragmatic oversensing causes inhibition of pacing, resulting in persistent oversensing and inappropriate detection of VF (Fig. 3-42). Clinically, this may manifest as syncope from inhibition of pacing followed by an inappropriate shock. This is an exception to the clinical rule that antecedent syncope usually indicates an appropriate shock. A short time constant for automatic adjustment of sensitivity increases the probability of this type of oversensing. It is most common in male patients who have integrated bipolar leads in the RV apex.3,4 Oversensing of diaphragmatic myopotentials may be corrected by reducing ventricular sensitivity, provided that VF sensing and detection are reliable at the reduced level of sensitivity. In pacemaker-dependent patients, oversensing may also be reduced by pacing at a faster rate. Occasionally, correction requires insertion of a new rate-sensing lead away from the diaphragm.
Detection Algorithms for Automatic Optimization of Pacemaker Function
Ventricular Safety Pacing and Noise Reversion
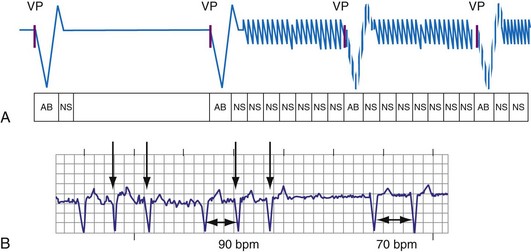
Pacemakers also contain algorithms to protect against prolonged inhibition of ventricular pacing caused by oversensing. Noise-sampling windows (30-60 msec in duration) are used during the blanking periods to identify spurious signals and cause the ICD to change to an asynchronous “reversion” pacing mode, to ensure ventricular backup pacing.83 Noise-reversion operation is particularly important for unipolar sensing, which is more likely than bipolar sensing to exhibit oversensing of extracardiac signals84 (Fig. 3-43).
Automatic Mode Switching to Avoid Ventricular Tracking of Atrial Tachyarrhythmias
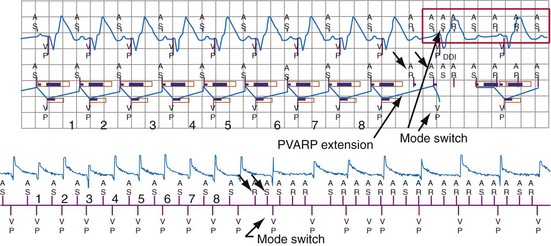
Pacemakers programmed to dual-chamber synchronous pacing modes may use automatic “mode switching” algorithms to initiate a temporary change to a nontracking pacing mode during paroxysmal atrial tachyarrhythmias, to avoid inappropriately high ventricular pacing rates. Methods of mode switching differ among pacemakers and ICDs and can be classified into five different categories85,86 (Fig. 3-44). Accurate atrial sensing is critical to appropriate mode switching, because all methods depend on measurement of atrial rate, A-V patterns, or both. The atrial sensing configuration (unipolar vs. bipolar), programmed atrial sensitivity, and atrial blanking periods influence the methods used by the various manufacturers and their performance for detection of atrial tachyarrhythmias. Algorithms to recognize repetitive blanking of atrial events during atrial flutter allow mode switching to occur more rapidly when this condition is confirmed (Fig. 3-45). Whatever method is employed, unreliable atrial sensing, whether from low-amplitude P waves or insensitive programming to avoid FFRW oversensing, will degrade performance of these algorithms.85–88 ICDs with long PVAB periods or low atrial sensitivity may fail to switch modes if a substantial fraction of atrial events are undersensed.
Algorithms to Reduce Ventricular Pacing
Unnecessary ventricular pacing contributes to adverse clinical outcomes (e.g., heart failure hospitalizations) and increased risk of AF.89,90 Algorithms that lengthen AV intervals adaptively to promote intrinsic conduction reduce ventricular pacing.91–94 Medtronic and Sorin developed new pacing modes (MVP and SafeR) that operate in AAI(R) mode, with mode switching to DDD(R) to prevent excessive ventricular pauses or asystole.19,95,96 Single beats of AV conduction failure are allowed by both algorithms, with switching to DDD mode occurring only if higher levels of AV conduction block occurs (Medtronic) or if the PR interval is excessive. Once switched to DDD mode, both algorithms test for AV conduction periodically, to avoid unnecessary ventricular pacing for transient AV block. However, these pacing modes may be associated with pacemaker syndrome in patients with marked first-degree AV block, resulting in unnecessary pauses if complete heart block develops.97–99
Automatic Assessment of Pacemaker Capture (“Capture Management”)
Automatic sensing of the evoked response (local myocardial depolarization) that results from a pacing stimulus allows for verification of myocardial capture. However, sensing of the evoked response is obscured by the decaying polarization afterpotential that follows the pacing stimulus.100 This polarization artifact can be attenuated by using high-capacitance, low-polarization leads or using multiphasic pacing impulses to neutralize the postpacing polarization. Figure 3-46 shows an example of the evoked response signal combined with polarization artifact after a pacing stimulus.100 To minimize the afterpotential from ventricular pacing stimuli and improve detection of the evoked response, some manufacturers use a smaller-output capacitor. This approach further enhances the accuracy of evoked response detection.
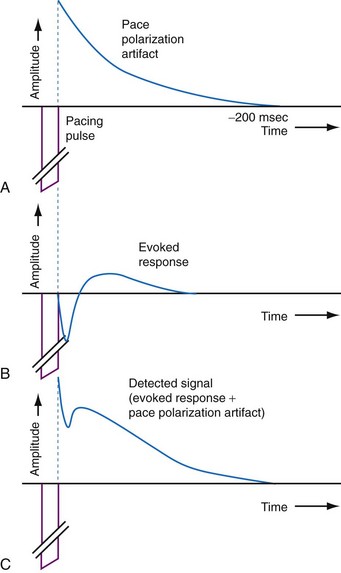
Figure 3-46 Local myocardial depolarization (evoked response) is obscured by the postpacing polarization artifact.
(From de Voogt WG, Vonk BF, Albers BA, et al: Understanding capture detection. Europace 6:561-569, 2004.)
Pacemakers use one of two different ventricular capture verification schemes: beat-to-beat approaches that monitor capture almost continuously and periodic approaches that test pacing thresholds intermittently (e.g., once every few hours). Algorithms that perform periodic capture threshold measurements typically set the pacing output at 1.5 to 2.0 times the threshold to avoid transient loss of capture until the next test. Beat-to-beat capture management algorithms adjust pacing outputs to values that are just above pacing threshold but deliver higher-output backup pulses if loss of capture occurs.101
Ventricular capture verification has been incorporated into some ICDs and resynchronization ICDs. Algorithms for RV capture management use essentially the same methods as pacemakers, except that polarization artifact that challenges evoked response detection in bipolar pacing leads is eliminated or reduced by use of the RV coil-to-can EGM available in ICD systems.102 LV capture management may be achieved by pacing on the LV lead and analyzing the intraventricular conduction time sensed in the right ventricle. This method has been demonstrated to be safe, reliable, and clinically equivalent to operator-performed LV threshold tests.103
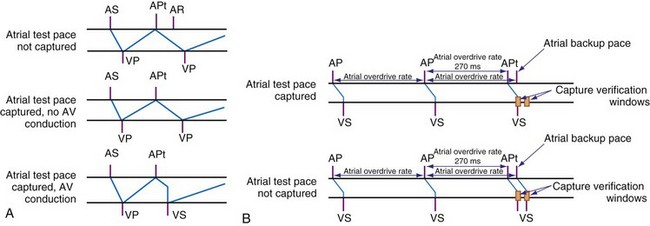
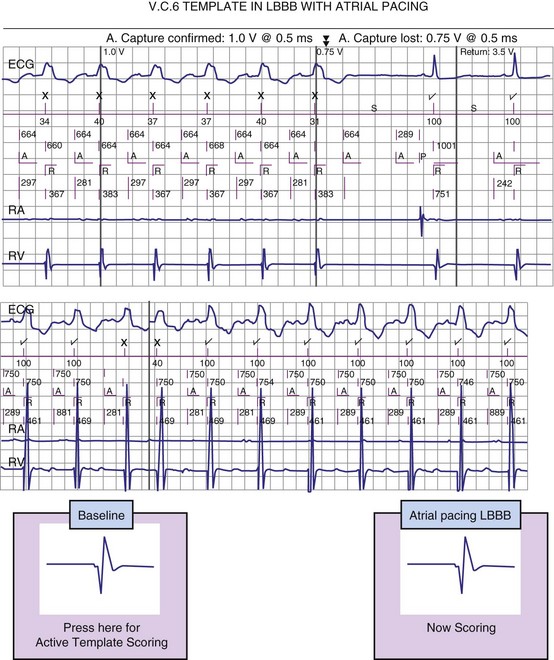
Atrial capture management is more challenging than ventricular management because the atrial evoked response is much smaller than the ventricular response. Thus, reliable detection of the evoked response is difficult, and atrial capture detection using the evoked response method can be performed only using low-polarization electrodes.104 An alternative method relies on critical timing of the atrial and ventricular response to atrial pacing stimuli during normal sinus rhythm (Fig. 3-47). In ambulatory patients, this method has been reported to perform comparably with operator-performed atrial pacing threshold measurements without causing atrial proarrhythmia.105
 Basics of Detection of Ventricular Tachycardia/Fibrillation
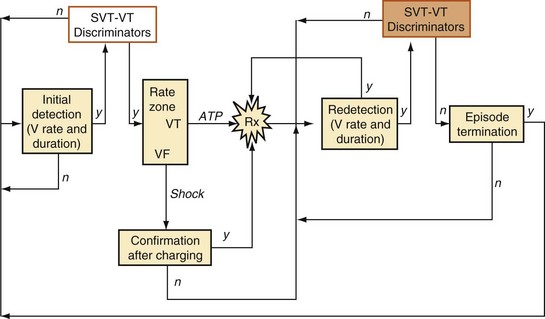
Figure 3-48 provides an overview of the structure of VT/VF detection algorithms. Initial detection of tachycardia is based on rate and duration. The minimum duration of tachycardia required for detection is programmable, either directly (in seconds) or indirectly by setting the number of ventricular intervals required. A tachycardia episode begins when the minimum rate and duration criteria are satisfied. Computationally intensive features of detection algorithms, such as morphology analysis, are activated only after initial detection occurs, to conserve power.
Ventricular Rate and Counting Methods
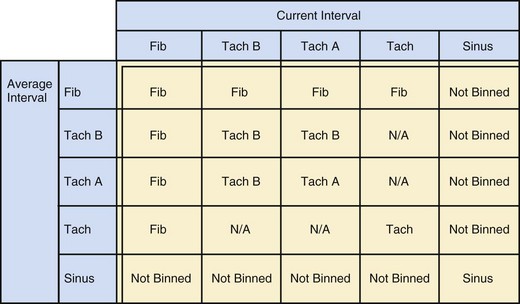
The specific methods used to count ventricular intervals vary and influence the sensitivity and specificity of VT detection. Initial detection in the VF zone must be tolerant of undersensing. Detection usually occurs when a certain percentage (typically 70%-80%) of intervals in a sliding window (usually 10-40 intervals) fulfill the programmed rate criterion. Most ICD manufacturers also use this “X out of Y” counting in the slower (VT) zones, although Medtronic requires that all intervals exceed the rate criterion to detect VT. This consecutive-interval method diminishes inappropriate detection of AF without compromising sensitivity for detection of regular, monomorphic VT.106–108 St. Jude ICDs classify intervals based both on the last interval and on the average of the last four intervals (Figs. 3-49 and 3-50). A potential advantage of this method is that averaging minimizes the effects of intermittent undersensing by providing a “smoothing effect.”106 A disadvantage is that averaging exaggerates the effect of extremely short, oversensed intervals or extremely long, undersensed intervals. To satisfy tachycardia criteria, “binned” intervals do not need to be consecutive. As long as sinus rhythm is not redetected, the counter will continue to increment. This may be particularly problematic when the slowest VT zone is used as a monitoring zone: During sinus tachycardia in the monitoring zone, PVCs increment the VT counter, but the counter is not reset until the sinus rate decreases out of the monitoring zone, providing the potential for inappropriate therapy of sinus tachycardia109 (Fig. 3-51). Sorin ICDs first classify the rhythm on the basis of the ventricular cycle length. This algorithm relies on the “majority criterion,” which excludes the initial two, short ventricular cycles from analysis to withdraw cycles that may have unstable R-R intervals at the beginning of an arrhythmia.
Ventricular Tachycardia/Fibrillation Rate Detection Zones
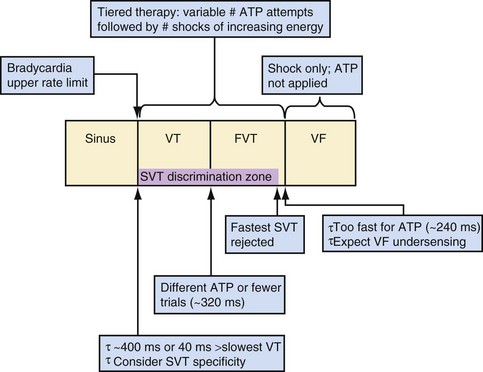
Tiered-therapy ICDs have up to three ventricular rate detection zones that permit programming of zone-specific therapies and SVT-VT discriminators (Fig. 3-52). The duration of a rapid ventricular rate required for detection is programmable independently in at least the slowest and fastest zone (see Zones and Zone Boundaries). The two slower zones are classified as VT zones, and the fastest one as a VF zone. All ICDs use strategies to minimize the risk of prolonged detection if successive VT intervals are classified in different zones. Except for Medtronic ICDs, sensed events in one zone increment counters in all slower zones. To avoid delays in detecting rhythms that straddle zone boundaries, Medtronic ICDs utilize a combined-count (summation) feature, which is satisfied if a sufficient fraction of intervals is in either zone.106
Monitor-only Zones
Programmable monitor-only zones store EGMs of tachycardias based on rate and duration even if they are slower than the slowest zone in which VT therapy is programmed. If therapy is not programmed “on” for slow VT, the slowest rate zone may be programmed as a “monitor only” zone, with detection “on” and therapies “off.” However, interactions between the counters in the VT zone serving as a monitor zone and the next zone may restrict use of SVT-VT discriminators or decrease the number of intervals required for detection in the therapy zone. ICDs with dedicated monitor-only zones may avoid these potential interactions. However, as noted previously, in St. Jude ICDs the combination of counting method and criteria for resetting the VT counter during sinus tachycardia in the monitor-only zone may result in inappropriate therapy.109,110
 Discriminators
Confirmation, Redetection, and Episode Termination
If a tachycardia is classified as ventricular, ATP may be delivered immediately; but shocks require capacitor charging, which takes 6 to 15 seconds for maximum-energy shocks. The first shock in a shock sequence is “noncommitted,” meaning that it may be aborted during charging if the detection algorithm identifies termination of the arrhythmia during or immediately after charging of the high-energy capacitors (Fig. 3-53). In contrast, a “committed shock” is always delivered if the capacitor charges. Confirmation or reconfirmation is the brief process that occurs after charging by which ICDs determine whether to deliver or abort the first shock in a sequence. In all ICDs, the confirmation algorithm delivers the stored shock if a few intervals immediately after charge completion are shorter than the programmed VT interval (St. Jude, Boston Scientific, Sorin, Biotronik) or are within 60 msec of the VT interval (Medtronic ICDs before Protecta) (Fig. 3-54). Therefore, the first VF shock is effectively “committed” if the VT interval (or, in some ICDs, the monitor-only interval) is programmed to a long cycle length.111,112 A new shock confirmation algorithm in Medtronic ICDs (investigational, Protecta) aborts a defibrillation shock when ventricular cycle lengths increase by at least 60 msec relative to the detected tachycardia cycle length and exceed the VF detection interval, and the ventricular cycle length at the point of detection is regular. Tachycardias detected in the VF zone that do not have regular cycle length are judged against the VF interval plus 60 msec. Shocks for VT will abort on a 60-msec increase in cycle length relative to the point in detection, regardless of cycle length regularity.
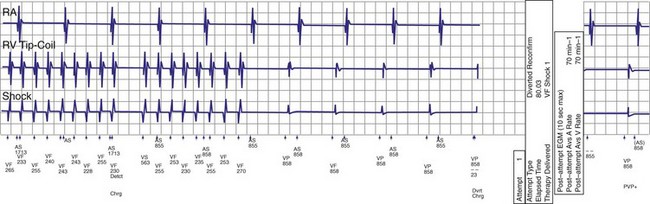
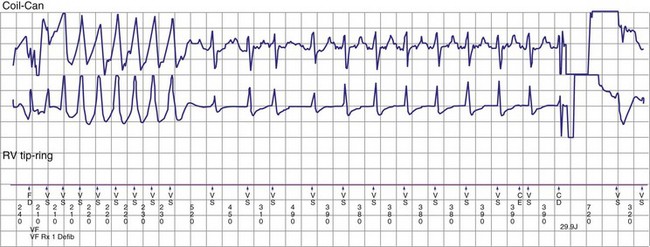
Figure 3-54 Confirmation failure.
(From Swerdlow CD, Friedman PA: Advanced ICD troubleshooting. Part II. Pacing Clin Electrophysiol 29:70-96, 2006.)
Once a shock is aborted, the device continues to apply tachycardia redetection and episode termination criteria. Depending on the manufacturer and programming, each shock after the first shock may be either noncommitted or committed. A shock is also committed if VT or VF is detected after a diverted shock and before episode termination.83
 SVT-VT Discrimination in Ventricular ICDs
Building Blocks for Discrimination
The ICDs analyze information derived from a sequence of sensed atrial and ventricular EGMs to detect VT/VF and discriminate ventricular arrhythmias from SVT. These algorithms operate in a stepwise manner, using a series of physiologically relevant, logical “building blocks” (Table 3-1) based on the timing relationships and morphology of sensed EGMs. We focus on the “tool kit” provided by these building blocks rather than on the specific details of proprietary algorithms, reviewed elsewhere in detail.113 Detection algorithms combine complementary building blocks to form the final detection decision. Each building block has advantages and limitations. Some are redundant, and some interact. Interactions vary depending on the order in which blocks are applied. Clinicians and algorithm designers must consider these issues to understand trade-offs in clinical performance.
| Tachyarrhythmia Detection Building Blocks | Purpose/Information | Potential Weaknesses |
|---|---|---|
| Single-Chamber Ventricular Building Blocks | ||
| R-R interval + duration | Identifies sustained high ventricular rates | SVT with high ventricular rates that overlap with VT/VF rates |
| R-R regularity | Discrimination of monomorphic VT (regular cycle lengths) from rapid AF (irregular cycle lengths) | May lose effectiveness as ventricular rates during AF increase; 2 : 1 atrial flutter has regular R-R intervals; may cause underdetection of VT with irregular R-R intervals |
| R-R onset | Identifies sudden ventricular rate changes | Not specific for atrial or ventricular tachyarrhythmias; may miss VT arising during sinus tachycardia |
| VEGM morphology | Abnormal VEGM morphology may indicate ventricular tachyarrhythmias | Confounded by conduction aberrancy or changes in “normal” VEGM morphology |
| Burst ventricular pacing | Intervals after entrainment of VT by burst pacing are less variable than intervals after burst pacing during SVT | Sensitive to single interval measurement, potential detection time delay, and potential proarrhythmia |
| Key Dual-Chamber Building Block | ||
| Comparison of atrial vs. ventricular rate | VT diagnosed if atrial rate is less than ventricular rate | Confounded by atrial undersensing or far-field R-wave oversensing |
| Dual-Chamber Building Blocks | ||
| P-R dissociation | P-R dissociation usually indicates VT | AV reentrant tachycardia; VT with 1 : 1 retrograde conduction; AF that conducts rapidly with apparent P-R dissociation |
| P-R patterns/relationships | Consistent P-R patterns/relationships usually indicate SVT | AV reentrant tachycardia and VT with 1 : 1 retrograde conduction |
| Chamber of acceleration | Identifies whether tachycardia initiates in atrium or ventricle | A single oversensed/undersensed event may result in misclassification. |
| Atrial or ventricular pacing, response in opposite chamber | Discrimination of 1 : 1 rhythms using ventricular response to atrial extrastimuli | Primarily aids diagnosis for 1 : 1 rhythms; concerns for VT detection delay and proarrhythmia |
| Single-Chamber Atrial Building Blocks | ||
| P-P intervals | Identifies high atrial rates | High atrial rates may be present during true VT/VF. |
| P-P regularity | Regular atrial rate indicates organized atrial activity | Minimal benefit for ventricular tachyarrhythmia characterization |
| P-P onset | Identifies sudden atrial rate changes | Not specific for atrial or ventricular tachyarrhythmias (e.g., VT with 1 : 1 retrograde association) |
| AEGM morphology | Identifies atrial tachyarrhythmias and/or retrograde conduction | Confounded by far-field R waves and changes in “normal” AEGM morphology |
AEGM, Atrial electrogram; AF, atrial fibrillation; AV, atrioventricular; SVT, supraventricular tachycardia; VEGM, ventricular electrogram VF, ventricular fibrillation; VT, ventricular tachycardia.
Single-Chamber Ventricular Building Blocks
The first five building blocks in Table 3-1 apply to single-chamber ICDs or the ventricular component of dual-chamber ICDs. The R-R interval + duration analysis building block classifies ventricular intervals into zones by programmable cycle length (or rate) thresholds. All single- and dual-chamber ICDs use cycle length or rate in combination with tachyarrhythmia duration as the most basic method of detection. When used alone, R-R interval + duration analysis provides the highest sensitivity for detection of VT/VF, but cannot discriminate VT/VF from SVT. The R-R regularity building block is used to discriminate between regular ventricular intervals caused by monomorphic VT and irregular ventricular intervals caused by rapidly conducted AF. The R-R onset building block is used to discriminate sudden-onset VT from gradual-onset sinus tachycardia. The VEGM morphology building block classifies tachyarrhythmias as SVT if morphologic characteristics of the ventricular EGM are similar to those of beats of known supraventricular origin. Otherwise, it classifies the rhythm as VT.
Dual-Chamber Building Block: Atrial vs. Ventricular Rate
Direct or indirect comparison of atrial and ventricular rates is the cornerstone of most dual-chamber algorithms. In most studies, the ventricular rate exceeds the atrial rate in more than 80% of VTs in the VT zone of dual-chamber ICDs and a higher fraction of VTs in the VF zone.68,114 Thus, algorithms that compare atrial and ventricular rates as their first step (Boston Scientific Rhythm ID, St. Jude, Biotronik) apply SVT discriminators to fewer than 20% of VTs; this reduces the risk that they will misclassify VT as SVT, provided that the atrial rate is measured correctly. The Medtronic algorithm indirectly compares atrial and ventricular rates using dual-chamber pattern analysis as the first step to achieve a comparable result. The Sorin algorithm uses a conceptually different approach, by initially detecting tachyarrhythmia based on cycle length, then further classifying the arrhythmia as VT or SVT based on the stability of R-R intervals and an analysis of AV association and tachycardia onset.
Dual-Chamber Building Blocks
The next four building blocks in Table 3-1 are based on combinations of atrial and ventricular information. Their primary role is to discriminate VT with 1 : 1 ventricular-atrial (V-A, VA) conduction from SVT. Their secondary roles are to classify rhythms with stable N:1 atrial-ventricular (A-V, AV) relationships (stable ratio of N atrial events for each ventricular event) as SVT and to classify isorhythmic tachycardias (with AV dissociation and similar ventricular rate) as VT. The P-R dissociation building block can detect the presence of VT during SVT. The P-R patterns/relationships building block applies to stable associations of atrial and ventricular events. For tachycardias with 1 : 1 AV relationships, it analyzes the relative timing of P-R and R-P intervals to classify the rhythm as SVT or VT. It also identifies consistent N:1 AV patterns that occur primarily during atrial flutter. The chamber of origin building block discriminates between VT and SVT with 1 : 1 P-R association by identifying whether the tachycardia originates in the atrium or in the ventricle. In ICD patients, SVT usually begins with an intrinsic atrial event in the interval between the last ventricular event in the sinus rate zone and the first ventricular event in the VT zone. Conversely, at the start of spontaneous VT, there is usually no atrial event in this interval. The response of the opposite chamber to atrial or ventricular pacing has long been a critical tool in the electrophysiology laboratory for diagnosing tachycardias with 1 : 1 AV relationship. A novel ICD algorithm based on this premise has been shown to terminate or discriminate 1 : 1 tachycardias by using simultaneous atrial and ventricular ATP.115
SVT-VT Discrimination in Single-Chamber ICDs
R-R Interval Regularity
Measures of R-R interval regularity usually are referred to as measures of R-R interval “stability” or “stability algorithms.” Technical details and optimal programmed values differ among manufacturers. Specific measures of R-R regularity interact with the method of counting R-R intervals and the duration required for detection. Requiring consecutive R-R intervals or a higher number of intervals to fulfill the rate and regularity criteria improves rejection of AF but increases the risk that detection of VT will be delayed.107,108,116–120
Regularity criteria can reject AF with ventricular rates slower than 170 beats per minute (bpm) in the absence of antiarrhythmic drugs. At faster rates, these criteria cannot discriminate AF from VT reliably, because R-R intervals in AF are more regular;116–120 and the criteria may prevent detection of VT in the presence of amiodarone or type IC antiarrhythmic drugs.117,119 These drugs may cause regular VT to become irregular, or they may cause rapid polymorphic VT to slow from the VF zone, where discriminators do not apply, to the VT zone, where regularity discriminators do apply. R-R regularity may also be used to select the first VT therapy: ATP for regular VT and shock for irregular and presumed VF or polymorphic VT.
Sudden Onset
Measures of abruptness of onset of a tachycardia have high specificity for rejecting sinus tachycardia,116,118–120 but may prevent detection of VT that originates during SVT or VT that starts abruptly with an initial rate below the VT detection limit. In the latter case, the ICD misclassifies the “onset” of the arrhythmia as the gradual acceleration of the VT rate across the VT rate boundary. This criterion does not prevent SVT with sudden onset from being treated inappropriately.
Ventricular EGM Morphology
Analysis of ventricular EGM morphology,114,120–123 alone or in combination with stability, probably provides the best single-chamber SVT-VT discrimination for initial detection of VT. The morphology building block is the key element of single-chamber algorithms and the central single-chamber component of dual-chamber algorithms with this feature. For this reason, a more detailed analysis is provided.
Ventricular Egm Morphology for SVT-VT Discrimination
General
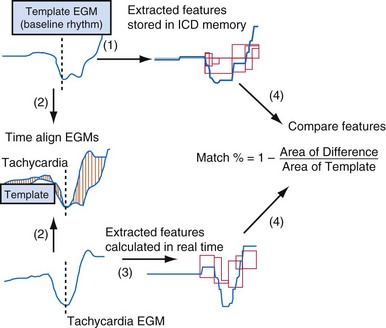
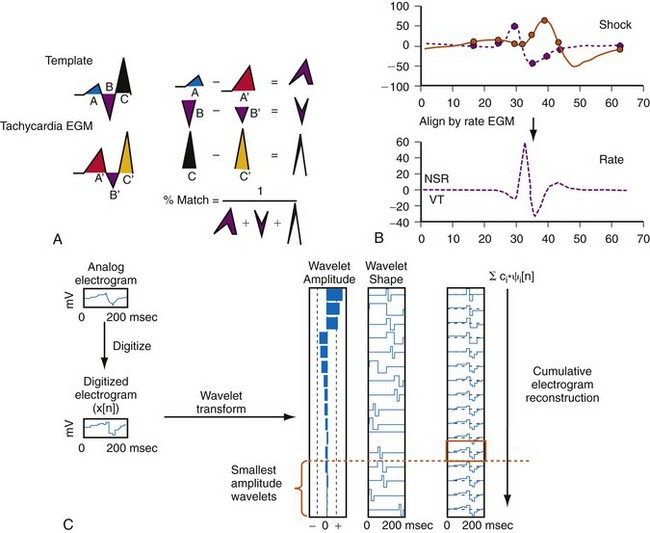
Electrogram morphology algorithms are the most complex and effective building blocks in single-chamber detection algorithms. All morphology algorithms share common steps (Fig. 3-55): (1) record a template EGM of baseline rhythm; (2) construct and store a quantitative representation of this template; (3) record EGMs from an unknown tachycardia; (4) time-align the template and tachycardia EGMs; (5) construct a quantitative, normalized representation of each tachycardia EGM; (6) compare the representation of each tachycardia EGM with that of the template to determine its degree of morphologic similarity; (7) classify each tachycardia EGM as a morphology match or nonmatch with the template; and (8) classify the tachycardia rhythm as VT or SVT based on the fraction of EGMs that match the template. Steps 3 through 8 are performed in real time. Morphology algorithms differ according to EGM source or sources, methods of filtering and alignment, and details of quantitative representations. The features of specific algorithms are described in Figure 3-56.
Limitations of Morphology Algorithms
The START study (SAFARI trial) of arrhythmias recorded at ICD implant reported individual differences for the performance of single-chamber discrimination algorithms based primarily on EGM morphology.124 Morphology algorithms share common failure modes for inappropriate detection of SVT as VT: (1) inaccurate template, (2) EGM truncation, (3) alignment errors, (4) oversensing of pectoral myopotentials, (5) rate-related aberrancy, (6) SVT soon after shocks, and (7) inappropriate classification of VT as SVT.
Electrogram Truncation
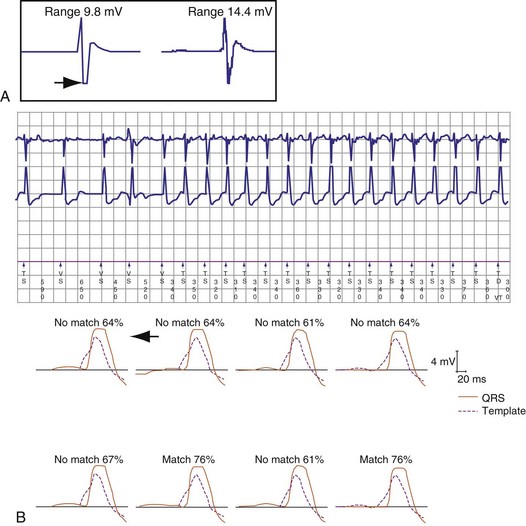
EGM truncation (“clipping”) occurs when the recorded EGM signal amplitude exceeds the range of the EGM amplifier so that the maximum or minimum portion of the EGM is clipped. This removes EGM features for analysis and alters the timing of the tallest peak, which can affect alignment. The amplitude scale in Medtronic and St. Jude ICDs should be adjusted so that the EGM used for morphology analysis is 25% to 75% of the dynamic range (Fig. 3-57).
Alignment Errors
Alignment errors prevent match between a tachycardia EGM and a morphologically similar stored EGM. Mechanisms depend on the method used for EGM alignment (Fig. 3-58). Accurate alignment in the St. Jude algorithm is sensitive to the value of the sensing threshold at the onset of the ventricular EGM, as determined by Automatic Sensitivity Control. If a template EGM is acquired at the most sensitive setting of Automatic Sensitivity Control (either because of a slow sinus rate or after a ventricular paced beat), a low-amplitude peak at the onset of the ventricular EGM may be used for alignment. During tachycardia, the next R wave may occur before Automatic Sensitivity Control reaches its sensitive value. In this case, the low-amplitude peak at the onset of the ventricular EGM may not be used for alignment. If identical template and tachycardia EGMs are then compared, their representations in the morphology algorithm will not match. Usually, they are assigned morphology match scores of 0% (see Fig. 3-58). In patients who have dual-chamber ICDs and intact AV conduction, the most reliable template is acquired or verified during atrial pacing at a rate close to the VT rate. In single-chamber ICDs, options may include acquiring or verifying the template during exercise testing and altering the minimum sensitivity, Threshold Start, or Threshold Delay. If a template is acquired during atrial pacing or exercise testing, automatic template updating should be disabled to prevent overwriting the template with one acquired in baseline rhythm.
Medtronic ICDs align EGMs based on their tallest (positive or negative) peaks. If an EGM has two peaks of near-equal amplitude, or if such peaks are caused artificially by truncation of large EGMs that exceed the programmed dynamic range, minor variations in their relative amplitudes may result in an alignment error.120 An alternative EGM source should be selected.
The Boston Scientific morphology algorithm (Rhythm ID) simultaneously collects data from two different channels: the local bipolar rate-sense EGM and shock EGM.125,126 It considers the vector of depolarization wavefront (with shock EGM as the reference), the timing of the peak signal recorded on the rate-sense EGM, and alignment of eight characteristic points of the shock EGM. A correlation equation aligns peaks on the rate-sense EGM for each QRS complex of the unknown rhythm with the rate-sense EGM peak of the sinus template, then compares the eight captured points with the template.
Rate-Related Aberrancy
If complete bundle branch aberrancy occurs reproducibly, the template may be recorded during rapid atrial pacing (Fig. 3-59). However, subtle and varying aberrancy can confound templates acquired during baseline rhythm (Fig. 3-60). If a template is acquired at a fast rate, automatic template updating should be deactivated to prevent subsequent auto-acquisition of a slow, baseline template without aberrancy. During rapidly conducted AF, subtle degrees of aberration often distort the terminal portion of the EGM sufficiently that the percent match is less than the nominal threshold. In St. Jude ICDs, reducing the fraction of EGMs required to exceed the match threshold from 5 of 8 beats to 3 or 4 of 8 beats may reduce this problem without compromising detection of monomorphic VT. Reducing the match percent required to exceed the match threshold may also prevent misclassification of aberrantly conducted SVT as VT, but it results in a greater chance of misclassifying monomorphic VT as SVT than does reducing the fraction of EGMs.
Supraventricular Tachycardia Soon after Shock
After a shock, ICD detection algorithms reclassify the rhythm as “sinus” and revert to their initial detection mode within a few seconds, but postshock distortion of EGM morphology may persist for 30 seconds to several minutes.60,120 No SVT-VT discrimination algorithm relies on EGM morphology after shocks until the arrhythmia episode terminates. However, algorithms revert to their initial detection mode within a few seconds after a shock. If postshock SVT starts after the rhythm has been classified as sinus but before postshock EGM distortion dissipates, any morphology algorithm may misclassify SVT as VT.120 Therefore, distortion of the EGM after a shock could result in a repetitive sequence of inappropriate classification of SVT as VT, inappropriate shocks for SVT, and perpetuation of postshock EGM changes in SVT by each successive shock.
Inappropriate Classification of Ventricular Tachycardia as Supraventricular Tachycardia
The St. Jude morphology algorithm, which analyzes only the rate-sensing electrode, continuously misclassifies up to 6% of VTs as SVT (Fig. 3-61). However, if it is restricted to tachycardias (with ventricular rate ≤ atrial rate in dual-chamber ICDs), only 2% of VTs are misclassified.114 The Medtronic morphology algorithm, which usually analyzes high-voltage EGMs, misclassifies about 1% of VTs as SVT.127 If misclassification occurs, an alternative EGM source may provide adequate discrimination. Limited data indicate that the corresponding error rate for the Boston Scientific algorithm is comparable or lower. When the St. Jude morphology algorithm is used in a single-chamber ICD, the sustained-duration time-out (Maximum Time to Diagnosis, Section V.F) should be programmed unless the algorithm is known to classify all clinical VTs correctly. Opinions differ about whether comparable features are required for Medtronic and Boston Scientific algorithms.
SVT-VT Discrimination in Dual-Chamber and Cardiac Resynchronization ICDs
The integration of dual-chamber building blocks into detection algorithms may be considered in terms of the relative rates of the atrium and ventricle (Fig. 3-62).
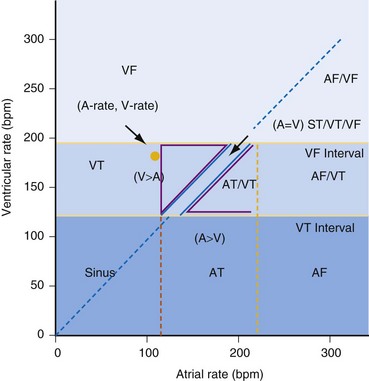
Figure 3-62 Dual-chamber “rate plane” highlights power of atrial versus ventricular rate.
(Modified from Morris M, Marcovecchio A, KenKnight B, et al: Retrospective evaluation of detection enhancements in a dual-chamber implantable cardioverter defibrillator: implications for ICD programming [abstract]. Pacing Clin Electrophysiol 22:849, 1999.)
Operation for Atrial Rate Equal to Ventricular Rate
The vast majority of tachycardias with 1 : 1 AV relationship are SVT, primarily sinus tachycardia. VT with 1 : 1 VA conduction accounts for less than 10% of VTs detected by ICDs. The building blocks used by each manufacturer for distinguishing 1 : 1 AV conduction of SVT from 1 : 1 VA conduction are summarized in Table 3-2. A dual-chamber onset rule that evaluates both P-R and R-R interval onset improves specificity of R-R interval onset-type building blocks for sinus tachycardia with minimal loss of sensitivity for VT.128 Sorin ICDs classify the 1 : 1 tachycardias based on “chamber of acceleration”: the first accelerated cycle is classified as “supraventricular” if two ventricular events are classified as “conducted,” if the R-R interval is greater than 75% of the preceding P-P interval. If the two ventricular events defining the first accelerated interval are ‘ ‘conducted,’ ’ the origin of the acceleration is declared “atrial.” Conversely, if the first accelerated beat is nonconducted, it is considered ventricular in origin. Individual examples are shown in Figures 3-63 to 3-66.
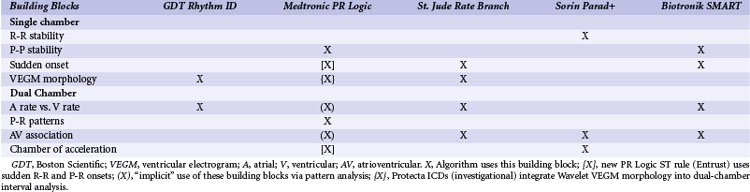
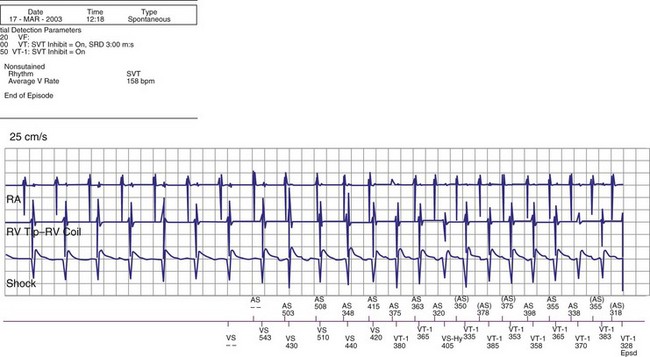
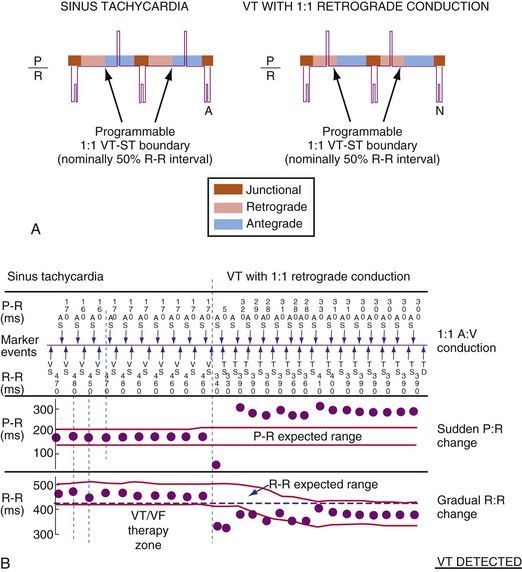
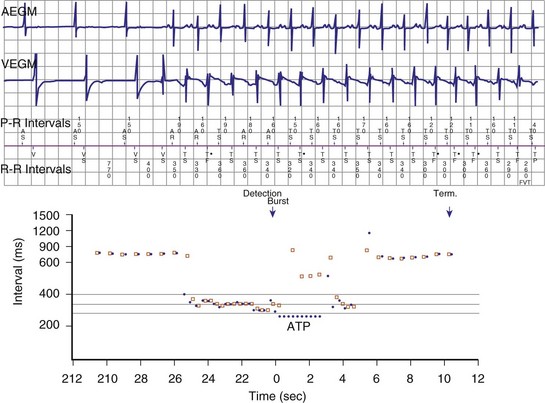
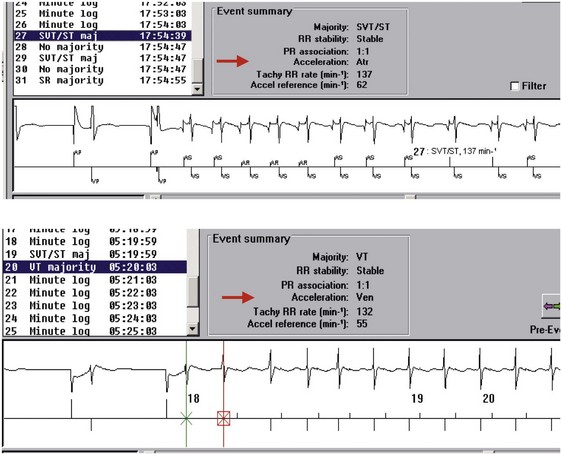
As in the electrophysiology laboratory, pacing methods may also be used to discriminate 1 : 1 tachycardias (see Active Discrimination).
Operation for Atrial Rate Greater Than Ventricular Rate
The building blocks used by each manufacturer for distinguishing rapidly conducted AF and atrial flutter from VT during atrial arrhythmias are summarized in Table 3-3. Although various combinations of these building blocks successfully discriminate VT from SVT in VT zones, most VT during AF is sufficiently rapid to be detected in the VF zone,129 where some discriminators lose specificity or may not be applied at all. For example, R-R regularity cannot be applied in the VF zone because polymorphic VT has irregular R-R intervals, and undersensing of VF exaggerates the irregularity of measured R-R intervals. AV dissociation occurs uniformly during rapidly conducted AF,68 and morphology templates acquired during sinus rhythm often misclassify aberrantly conducted beats. Individual examples are shown in Figures 3-67 to 3-69.
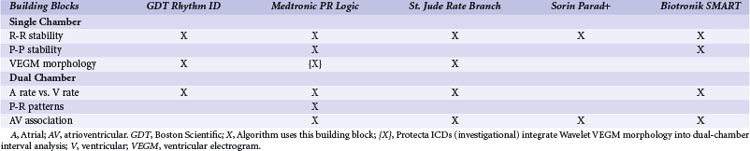
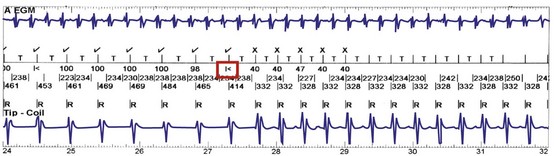
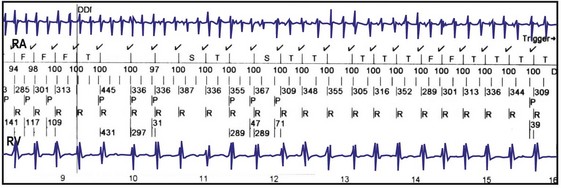
Figure 3-68 Inappropriate detection of rapidly conducted atrial fibrillation (AF) despite rejection by morphology.
(From Swerdlow CD, Friedman PA: Advanced ICD troubleshooting. Part I. Pacing Clin Electrophysiol 28:1322-1346, 2005.)
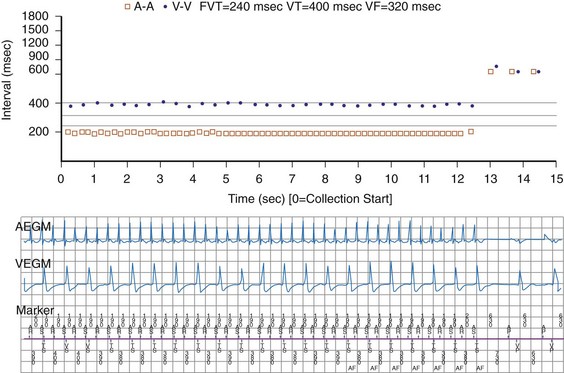
Specific Algorithms
Figures 3-70 to 3-74 show block diagrams of the principal dual-chamber detection algorithms in clinical use today. Legends identify unique features of each algorithm.
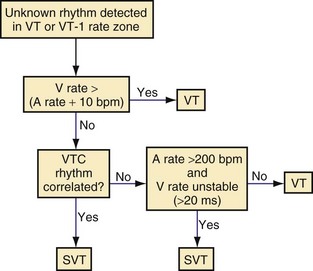
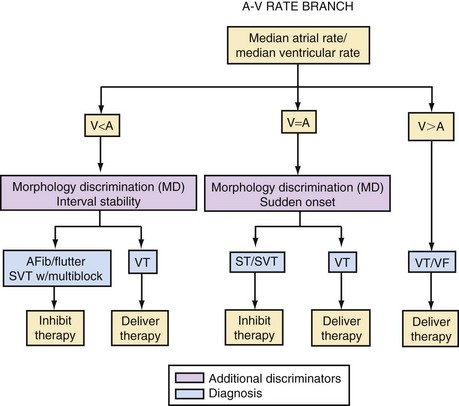
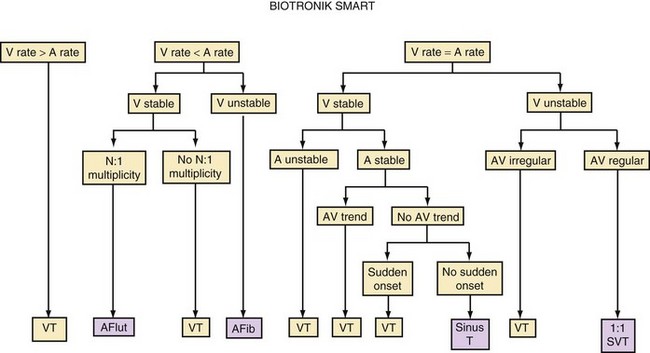
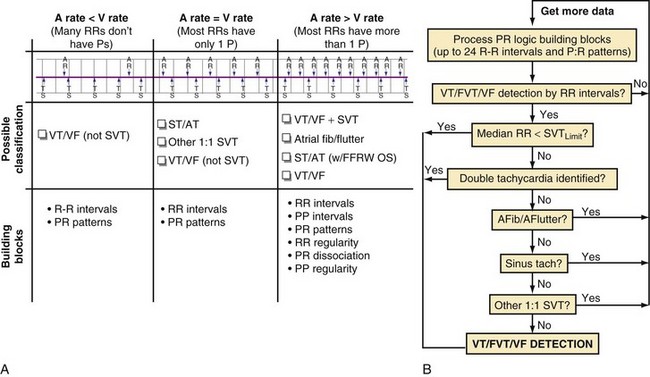
Figure 3-73 Medtronic PR Logic algorithm.
A, Clinical decision process. The rhythm types are represented using P-R marker diagram examples (top), from least complex (left) to most complex (right). A list of possible PR Logic decisions and the building blocks used are also shown for each of the rhythm types. Note that PR Logic implicitly employs a ventricular (V) rate > atrial (A) rate override (first column), because all rhythms with A rate < V rate and V rate in one of the detection zones are classified as ventricular tachycardia/fibrillation (VT/VF). For tachycardias with A rate = V rate (i.e., 1 : 1 tachycardias, center column), the original PR Logic uses P-R patterns and discriminates 1 : 1 rhythms with critical P-R interval timing zones (see Fig. 3-64, A). The new sinus tachycardia (ST) criterion in PR Logic (Entrust and later) uses the P-R pattern along with P-R and R-R sudden-onset criteria (see Fig. 3-64, B). For rhythms with A rate > V rate, PR Logic uses P-R patterns along with R-R regularity, P-R dissociation, and P-P regularity to ensure detection of double tachycardia (VT or VF during atrial fibrillation [AFib]) and to withhold therapy for 2 : 1 atrial flutter, rapid AFib, and ST with far-field R-wave oversensing (FFRW OS). In the newest Medtronic ICDs (Protecta, currently investigational), EGM morphology analysis (Wavelet) is applied for rhythms with A rate ≥ V rate that are identified by SVT by PR Logic pattern analysis alone. In addition, detection of double tachycardia in the Protecta devices requires that abnormal EGM morphology be present. Integration of Wavelet EGM morphology with PR Logic is designed to improve detection specificity compared to PR Logic interval analysis alone. B, PR Logic computational flow diagram. On each ventricular event, PR Logic processes the new P-R, R-P, P-P, and R-R patterns and timing information for the building blocks. If VT/fast VT (FVT) or VF rate detection criteria are satisfied, the ventricular rate override criterion is checked first. If the median R-R interval is less than the supraventricular tachycardia (SVT) limit, detection occurs through the single-chamber detection criteria without considering the PR Logic discrimination algorithm. If the median R-R interval is greater than the SVT limit, and if double tachycardia (VT/FVT/VF + SVT) is not detected, the three PR Logic criteria for identifying SVTs are tested in the order shown. If any one of the PR Logic SVT criteria is satisfied, inappropriate detection is avoided. If an SVT is not positively identified by PR Logic pattern analysis and the A rate ≥ V rate, EGM morphology analysis (Wavelet) is applied and classify the rhythm as SVT if the EGM morphology during tachycardia matches the template. If none of the SVT discrimination criteria is satisfied, VT/FVT/VF is detected when the R-R interval–based criterion is satisfied. If SVT is identified, the entire process repeats itself on each ventricular event until VT/FVT or VF is detected or the rhythm slows out of the ventricular rate detection zones.
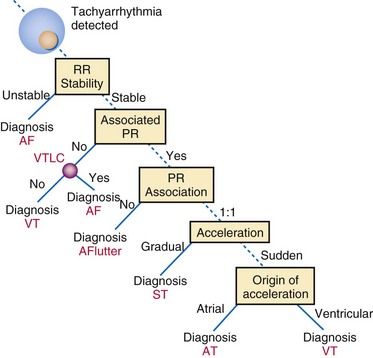
Single-Chamber vs. Dual-Chamber Discriminators
Nominal programming of dual-chamber algorithms is safe.130,131 Dual-chamber stored EGMs provide higher diagnostic accuracy for troubleshooting than single-chamber stored EGMs. However, dual-chamber discriminators cannot be implemented without the complications inherent in atrial leads. Also, dual-chamber ICDs introduce unique risks for underdetection of VT caused by cross-chamber ventricular blanking after atrial pacing (see Intradevice Interactions). In addition, with early dual-chamber algorithms, optimal values of programmable parameters were not known; initial approaches to the problem of atrial blanking versus FFRW oversensing had limited success; and atrial sensing problems and specific design flaws degraded performance. Not surprisingly, clinical studies of early dual-chamber algorithms reported no benefit over single-chamber algorithms.67,68,132,133 More recent, randomized prospective studies demonstrate moderate superiority in SVT-VT discrimination for dual-chamber over single-chamber algorithms.134,135 However, no agreement exists as to when the incremental implant complexity, price, risk of atrial lead complications, and reduced longevity of a dual-chamber ICD are justified for SVT-VT discrimination alone. Generally, dual-chamber ICDs should be considered in patients who are likely to have rapidly conducted SVT, those in whom monomorphic VT and sinus tachycardia rates are likely to overlap, and those who will benefit from additional diagnostics for atrial arrhythmias.
Active Discrimination
Although active discrimination presents the risk of proarrhythmia (Fig. 3-75), it can be valuable in discriminating tachycardias with 1 : 1 AV association (Figs. 3-76 and 3-77). One such algorithm was designed and implemented by Biotronik (and incorporated into the SMART-II algorithm) but is not commercialized in Biotronik ICDs.136 Feasibility investigations recently demonstrated a new algorithm using simultaneous atrial and ventricular ATP either to terminate or to discriminate 1 : 1 tachycardias. If the tachycardia persists after the simultaneous AV ATP, the discrimination algorithm considers the rhythm ventricular in origin, if the first sensed event after pacing is on the ventricular channel, and supraventricular in origin otherwise. In 62 ambulatory dual-chamber ICD patients, the algorithm terminated or correctly classified 1379 of 1381 SVT sequences (specificity 99.9%) and 23 of 26 VTs (sensitivity 88.5%).115
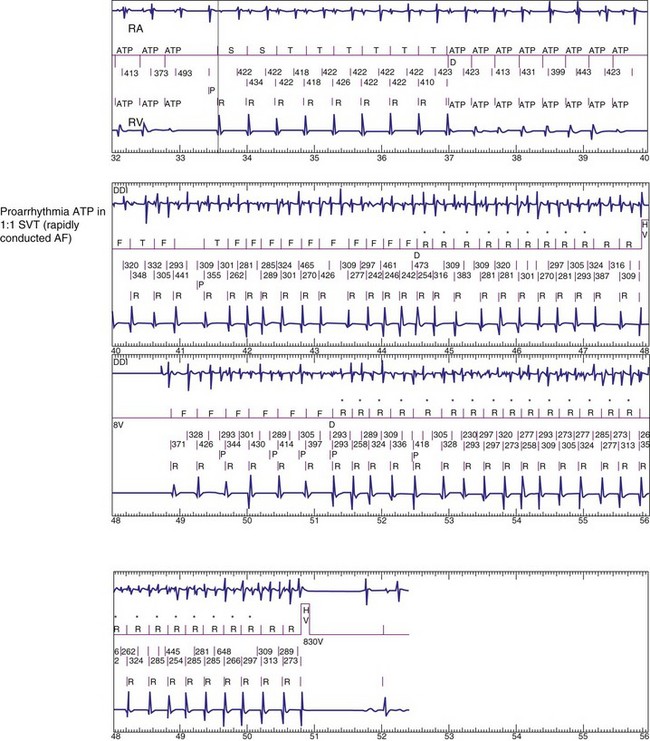
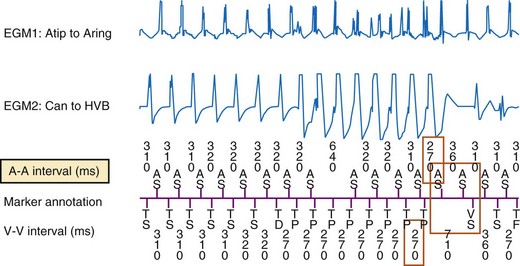
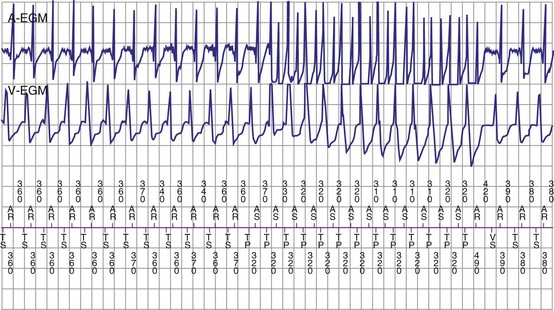
Features to Override Discriminators
Programmable duration-based “safety net” features deliver therapy if an arrhythmia satisfies the ventricular rate criterion for a sufficiently long duration even if discriminators indicate SVT. The premise is that VT will continue to satisfy the rate criterion for the programmed duration, whereas the ventricular rate during transient sinus tachycardia or AF will decrease below the VT rate boundary before the programmed duration is exceeded. The limitation is delivery of inappropriate therapy when SVT exceeds the programmed duration, which occurs frequently for durations of 1 minute or less and in up to 10% of SVTs at 3 minutes, depending on the VT detection interval and AV conduction.116 Because SVTs are much more common than VTs, programming of discriminator override duration to 3 minutes results primarily in inappropriate therapy of SVT. Programmed durations of 5 to 10 minutes are required to minimize such inappropriate therapy.137 The decision to use a discriminator override should be based on clinical factors, including the probability that discriminators will prevent detection of VT, the likely consequences of failure to detect VT, and the likelihood that SVT in the VT rate zone will persist long enough to trigger inappropriate therapy because of the override. For example, override features may be considered whenever a morphology algorithm is programmed without inducing VT at electrophysiologic study.
SVT-VT Discriminators in Redetection
The SVT-VT discrimination during redetection serves two purposes: (1) to prevent inappropriate therapy for SVT after appropriate therapy for VT (Fig. 3-78) and (2) to provide a second chance for the algorithm to classify SVT correctly after inappropriate therapy. Biotronik ICDs (Fig. 3-79) and sorin-ELA ICDs provide essentially equivalent SVT-VT discrimination in initial detection and redetection, except that algorithm building blocks related to tachycardia onset are disabled. Boston Scientific algorithms permit programming discriminators after shocks, but not after ATP, when it is more useful and reliable. In Medtronic ICDs, the single-chamber stability discriminator applies to redetection only if it is “on” for initial detection. The user interface does not indicate that it applies in redetection, and it is rarely programmed for this purpose. St. Jude ICDs do not apply discriminators to redetection. Neither Medtronic nor St. Jude ICDs provide any discriminators to reject sinus tachycardia in redetection.
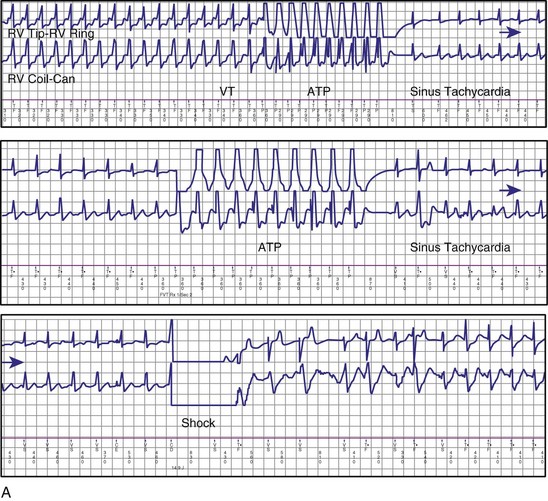
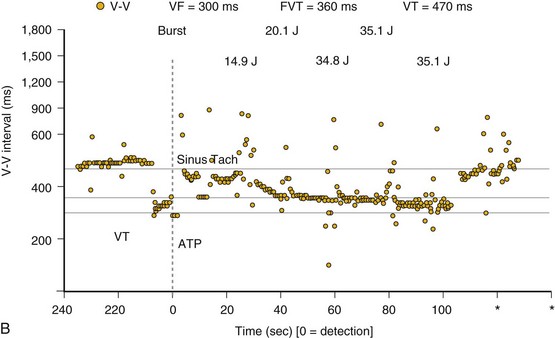
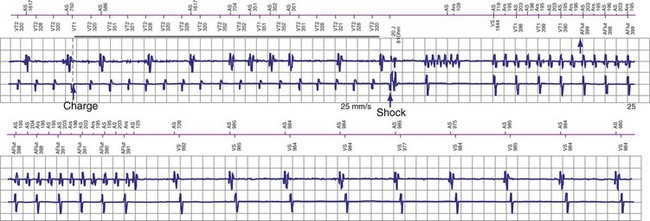
Measuring Performance of SVT-VT Discrimination Algorithms
Valid assessments and comparisons of algorithm performance require consideration of multiple ICD-related and clinical factors. A comprehensive assessment requires analysis of all tachycardia episodes, including those not stored in ICD memory and those in the VF zone to which discriminators may not apply.68,69,130 Programmed detection parameters may influence reported algorithm performance.69 In most studies, a few patients contribute a large number of SVT or VT episodes. Therefore, statistical methods such as the generalized estimating equation (GEE)138 should control for such clustered, nonindependent data.
Quantitative Considerations
Detection algorithms must maintain almost 100% sensitivity for detection of VT; but detection of hemodynamically-stable asymptomatic VT is not necessarily synonymous with therapy. If patient populations and programmed detection boundaries are equivalent, positive predictive accuracy may be the most useful statistical measure of algorithm performance.68 However, it is highly dependent on the ratio of SVT to VT episodes and therefore on the programmed detection rate and patient population (prevalence of SVT and VT). However, it is almost impossible to obtain a clinically meaningful comparison of different detection algorithms based only on their performance on different sets of data.
Inappropriate Detection, Inappropriate Therapy, and Inappropriate Shocks
All failures of SVT-VT discrimination algorithms do not have equivalent clinical outcomes. ATP is delivered immediately after detection so the numbers of detections and therapies are equivalent. In contrast, shock delivery requires capacitor charging, during which therapy may be aborted. However, inappropriate ATP is often unnoticed. It terminates about 40% of SVTs and reduces the ventricular rate below the VT detection interval in another 20%.139 In contrast, inappropriate shocks adversely affect quality of life.140 Active discrimination blurs the distinction between detection and therapy because only tachycardias that persist immediately after diagnostic pacing are classified.
Is Ventricular Therapy for SVT Always Inappropriate?
Persistent, rapidly conducted atrial arrhythmias can cause hemodynamic compromise in patients with LV dysfunction or ischemia in patients with severe coronary artery disease. Thus, algorithmically inappropriate ventricular therapy may fortuitously terminate clinically significant SVT, although inappropriate ventricular therapy for SVT may also be proarrhythmic.141 Further, in patients with ICDs, rapid conduction in AF is often transient, and symptoms are often mild, but ventricular shocks delivered shortly after detection do not permit spontaneous termination of AF or slowing of the ventricular rate. Therefore, shocks will be delivered for AF that may have spontaneously terminated or slowed. Inappropriate shocks for AF may place patients at risk for thromboembolism if they are not anticoagulated. Also, early recurrence is common after transvenous cardioversion of AF.142 Experts differ about whether algorithmically inappropriate ventricular therapy of SVT may be clinically appropriate in specific clinical situations. ICDs designed to deliver both atrial and ventricular therapies may be implanted in patients who are likely to benefit from ICD-based therapy of SVT.