TOPIC 2 Respiratory system
Imaging – Plain radiography
Test: The chest x-ray
Interpretation
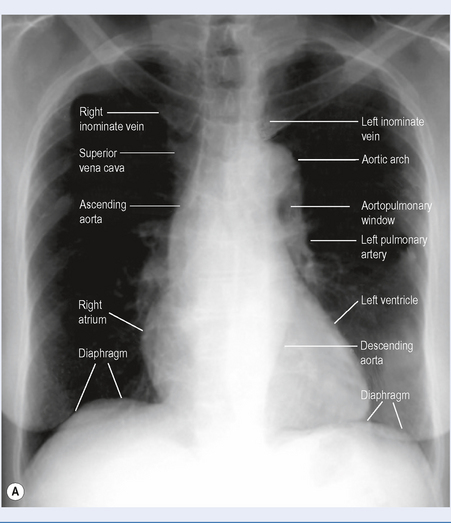
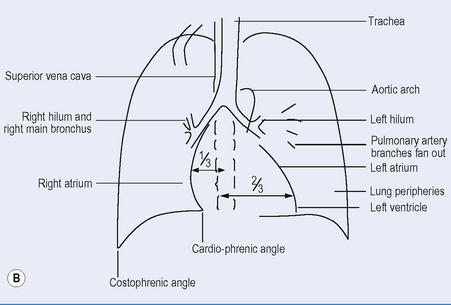
The chest x-ray (Fig. 2.1) is a two-dimensional representation of a three-dimensional structure. An understanding of chest anatomy is essential to interpretation of plain chest x-ray abnormalities.
Interstitial disease
The interstitial space surrounds bronchi, vessels and groups of alveoli. Disease in the interstitium manifests itself by reticulonodular shadowing (criss cross lines or tiny nodules or both). The main two processes affecting the interstitium are accumulation of fluid (pulmonary oedema) and inflammation leading to fibrosis (Fig. 2.2 and Box 2.1).
Fig. 2.2 Pulmonary oedema: diffuse hazy shadowing in a bat-wing distribution and upper lobe blood diversion.
A helpful mnemonic for noncardiogenic pulmonary oedema is NOT CARDIAC: near-drowning, oxygen therapy, transfusion or trauma, CNS disorder, ARDS, aspiration, or altitude sickness, renal disorder, drugs, inhaled toxins, allergic alveolitis, contrast or contusion.
COPD is often seen on CXR as diffuse hyperinflation with flattening of diaphragms and enlargement of pulmonary arteries and right ventricle (cor pulmonale). In smokers the upper lung zones are commonly diseased.
Abnormalities of the hila and pulmonary vessels
Enlarged hila could be due to an abnormality in any of the three structures that lie there:
Pulmonary embolism (PE)
Most chest x-rays in patients with a PE are normal (Box 2.2). The primary purpose of a chest film in suspected PE is therefore to rule out other diagnoses as a cause of dysponea or hypoxia. Further imaging is indicated, such as V/Q scan, pulmonary arteriogram and CT pulmonary angiogram (CTPA).
Pleural abnormalities
Pleural effusion
On an upright film, an effusion will cause blunting of the costophrenic angle. Sometimes a depression of the involved diaphragm will occur. A large effusion can lead to a mediastinal shift. Approximately 200 mL of fluid is needed to detect an effusion in the frontal film – a lateral chest x-ray (though now rarely done) is more sensitive.
Pneumothorax
A pneumothorax is air inside the thoracic cavity but outside the lung. It appears as air without lung markings in the least dependent part of the chest. It is best demonstrated by an expiration film. It can be difficult to see when the patient is in a supine position – air rises to the medial aspect of the lung becoming a lucency along the mediastinum. It may also collect in the inferior sulci causing a deep sulcus sign (Fig. 2.3).
Further investigations
Computed tomography (CT) scan, ventilation/perfusion (VQ) scan, etc (see below).
Limitations and complications
Other imaging
Test: Computed tomography (CT) scan (Fig. 2.4)
Indications
How it is done
Limitations and complications
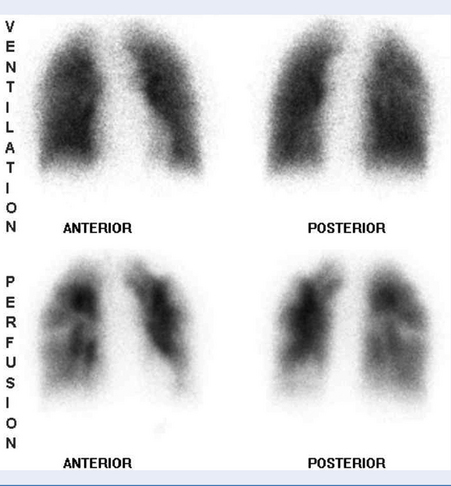
Test: Ventilation-perfusion scan (VQ scan) (Fig. 2.5)
Indications
Pulmonary function tests
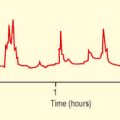
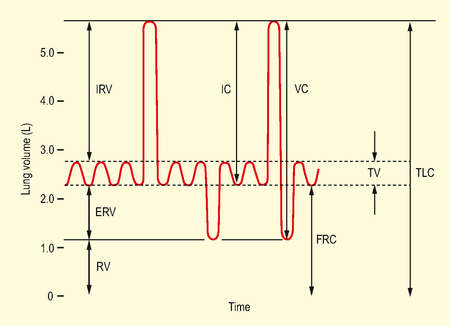
Test: Functional residual capacity (FRC; Fig. 2.6)
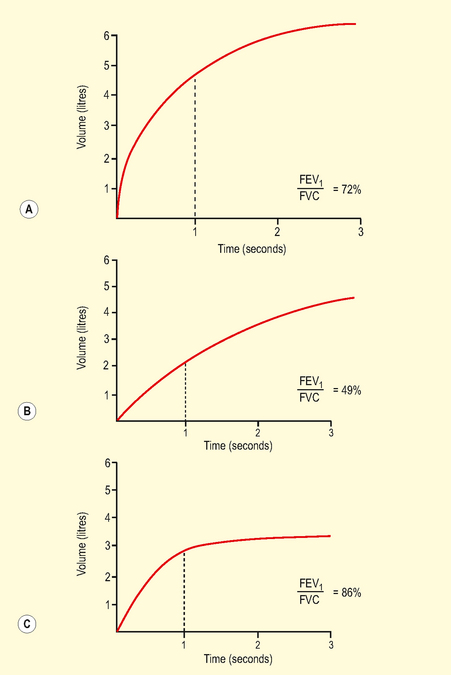
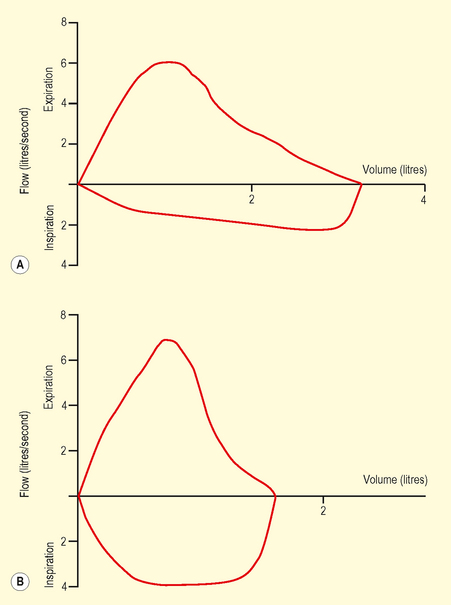
Test: Volume/time curve (Fig. 2.7)
Indications
With flow/volume curves, occasionally used preoperatively to:
How it is done
Interpretation
Data presented as graphs and numerical data (absolute numbers, % predicted).
Test: Flow/volume curve (dynamic)
Interpretation
Data presented as graphs and numerical data (absolute numbers, % predicted).
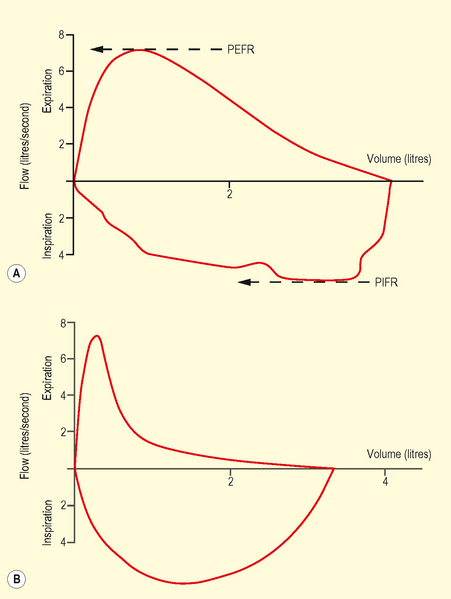
Abnormalities
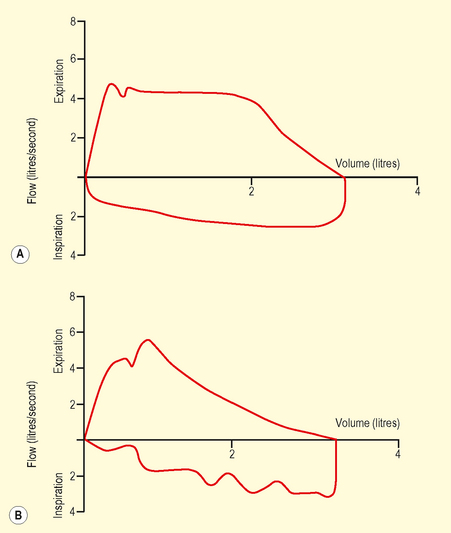
A fixed obstruction reduces both peak expiratory and inspiratory flow rates
Test: Transfer factor/diffusing capacity
How it is done
Interpretation
Abnormalities
Intraoperative respiratory monitoring
Test: Pulse oximetry (SpO2)
Test: Capnography
Physiological principles
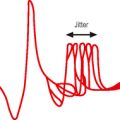
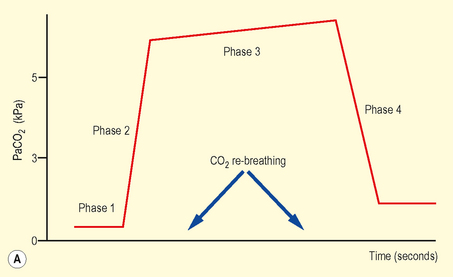
During the respiratory cycle exhaled CO2 produces a display of instantaneous CO2 concentration versus time. In the healthy patient, end-tidal CO2 (PETCO2) closely approximates to arterial CO2 (PaCO2). CO2 in exhaled gas is dependent on its carriage from site of production in the tissues to the lungs via the right heart (Table 2.1). Thus capnography also provides limited but useful information on cardiac output, pulmonary blood flow and the diffusion of pulmonary capillary gases. A mismatch between PETCO2 and PaCO2 may occur due to both physiological and pathological processes.
Table 2.1 Conditions affecting arterial – end-tidal CO2 gradient
| Increasing gradient | Decreasing gradient |
|---|---|
| Age | Increased cardiac output |
| COPD | Low frequency ventilation |
| Pulmonary embolism | Pregnancy |
| Reduced cardiac output | Infants under anaesthesia |
| Hypovolaemia | |
| General anaesthesia |
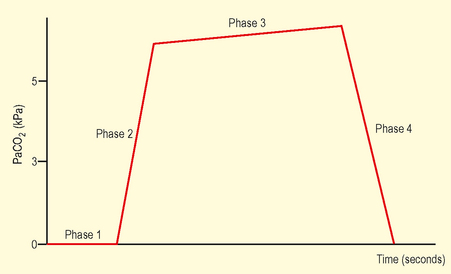
Normal range
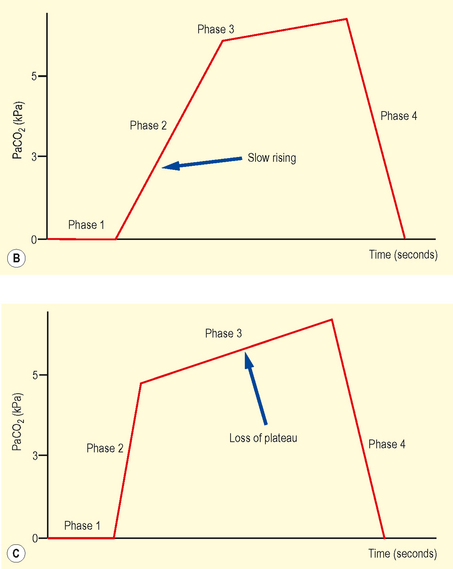
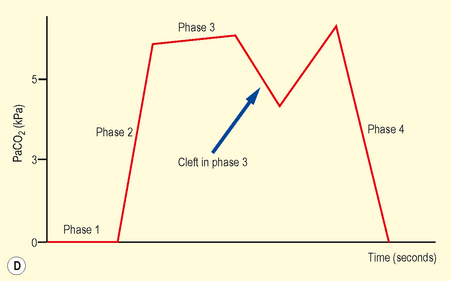
In the healthy patient PETCO2 approximates PaCO2 (5–5.6 kPa). Figure 2.11 shows four phases of a normal capnograph trace:
Test: Shunt fraction
How it is done
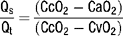
where CcO2 = end-capillary O2 content, CaO2 = arterial O2 content and CvO2 = mixed venous O2 content.

Further investigations


Shunt estimation 3: ‘P/F’ ratio (PaO2/FiO2)
This compares the arterial oxygen tension with the fractional inspired oxygen concentration and has the advantage of not using the alveolar gas equation (Table 2.2).
| PaO2 kPa (mmHg) | FiO2 | P/F ratio |
|---|---|---|
| 12.5 (93.7) | 0.21 | 59 (446) |
| 10 (75) | 0.30 | 33 (250) |
| 8 (60) | 0.70 | 11 (86) |
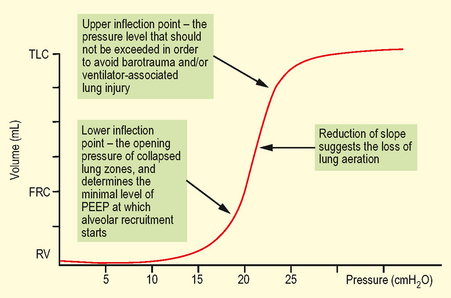
Pressure–volume (P/V) curve analysis
Test: Static airway compliance
How it is done
Interpretation
The P-V relationship is linear around FRC until total lung capacity (TLC) is approached as denoted by an upper inflection point (UIP) (Fig. 2.13). Above UIP overdistension of alveolar units occurs and no more recruitment is achieved. On the P/V curve this point is situated around 30 cmH2O. A stiff lung (e.g. ARDS) has a low compliance, whereas a highly distensible lung (e.g. emphysema) has a high compliance.
Blood gas analysis
Test: Arterial blood gas analysis
Interpretation
Table 2.3 Definitions and normal ranges of measured and calculated acid-base parameters breathing room air at sea level
| Abbreviation | Meaning | Normal value |
|---|---|---|
| pH | A measurement of the hydrogen ion concentration (log scale) | 7.35–7.45 |
| pH = pK + log ([HCO3 −]/[CO2]) | ||
| PCO2 | Partial pressure of CO2 | 4.8–5.9 kPa |
| PO2 | Partial pressure of O2; the FiO2 must be known | 11.9–13.2 kPa |
| BEx | Base excess, a measure of the metabolic component of acid-base disorders: the calculated amount in milliequivalents of strong acid required to restore 1 litre of fully saturated blood to pH 7.4, at a PCO2 of 5.3 kPa | −2 to +2 |
| More than +2 = a metabolic alkalosis; less than −2 = a metabolic acidosis | ||
| sBEx | Standard base excess: the calculated base excess after the sample has been equilibrated (‘standardized’) with CO2 at 5.3 kPa at 37°C, saturated with oxygen and a haemoglobin of 5 g/dL | −2 to +2 |
| BDef | Base deficit: a measure of the metabolic component of acid-base disorders; is the opposite of base excess | −2 to +2 |
| Total CO2 | = CO2 + HCO3− | 22–32 mEq/L |
| sHCO3 | Standard bicarbonate: the calculated bicarbonate concentration after the sample has been equilibrated (‘standardized’) with CO2 at 5.3 kPa at 37°C and saturated with oxygen. Like base excess, a measure of the purely metabolic component | 22–26 mmol/L |
| aHCO3 | Actual bicarbonate: the bicarbonate calculated from the measured CO2 and pH; values vary if the CO2 is abnormal | 22–26 mmol/L |
Physiological principles
Abnormalities
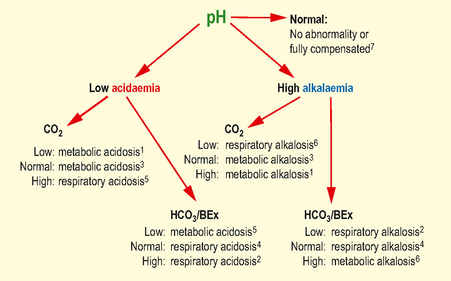
Low pH with low sHCO3 (<22) or BEx (<−2.2): Metabolic acidosis
Low pH with high pCO2 (>6.2 kPa): Respiratory acidosis
Further investigations
Strictly, it refers to the venous electrolyte concentrations.
In the context of a metabolic acidosis: