13 Respiratory Assessment and Monitoring
After reading this chapter, you should be able to:
• demonstrate an understanding of respiratory anatomy and normal physiology
• describe the mechanisms that contribute to altered respiratory function
• examine the key principles underpinning assessment and monitoring of respiratory function
• discuss nursing assessment and monitoring activities for critically ill patients with respiratory dysfunction
• explain the importance of patient assessment skills, and the contribution of diagnostic and laboratory findings to ongoing clinical management
• justify the physiological bases for different types of monitoring
• discuss some common forms of diagnostic procedures used in critical care
Introduction
This chapter provides a comprehensive description of the principles and practice of respiratory assessment, monitoring, and diagnostics. This knowledge is important in providing timely and effective interventions for critically ill patients with respiratory dysfunction. The following two chapters then discuss the management of respiratory alterations (Chapter 14) and oxygenation and ventilation interventions (Chapter 15).
Related Anatomy and Physiology
The thorax cavity contains the trachea and bronchial tree, the two lungs, pleura and diaphragm. The mediastinum, located between the lungs, houses and protects the heart, great vessels and the oesophagus. Twelve pairs of ribs cover the lungs, ten of which are connected to the spine posteriorly, and to the sternum or to the cartilage of the rib above anteriorly (ribs 8–10). The 11th and 12th ribs have no anterior attachment (see Figure 13.1).1
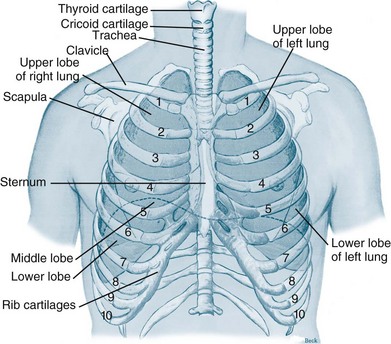
FIGURE 13.1 Ventilatory structures of the chest wall and lungs, showing the ribs and lobes of the lungs.1
The respiratory system is divided into upper and lower respiratory tracts: the upper airways consist of the nose, nasal conchae, sinus and pharynx; the lower respiratory tract includes the larynx, trachea, bronchi and lungs.2 Larger airways are lined with stratified epithelial tissue, which have a relatively high cellular turnover rate; these cells protect and clear these large airways. There are also additional specialised features of this tissue including an extensive distribution of mucus/goblet cells and cilia, which facilitate the mucociliary clearance system and aid airway clearance.
Upper Respiratory Tract
The nasal cavities contain an extremely vascular and mucoid environment for warming and humidifying inhaled gases. To maximise exposure to this surface area, the nasal conchae create turbulent gas flow. Cilia at the top of the epithelial cells and mucus provide filtration and cleaning of the inhaled air. Mucus is moved by the cilia lining the conducting airways towards the pharynx at a rate of 1–2 cm per minute. One litre of mucus is produced every day with only a small part not reabsorbed by the body.3,4
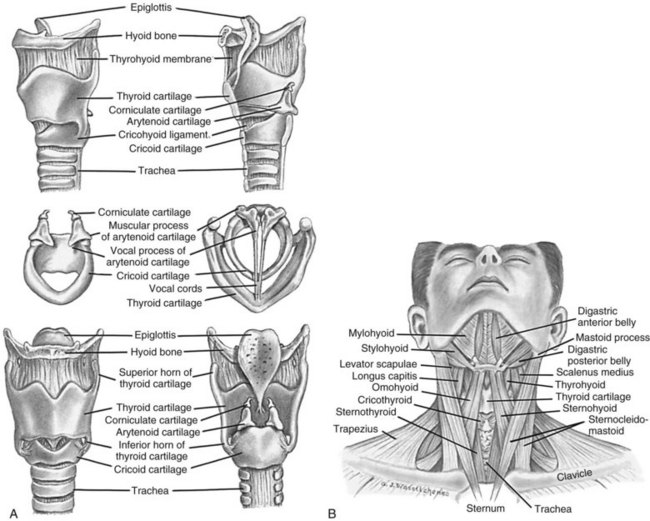
The pharynx is a muscular tube that transports food and air to the oesophagus and larynx, respectively. Inferior to the pharynx, the larynx consists mostly of cartilage attached to other cartilage and surrounding structures, and houses the vestibular (false) vocal folds and the true vocal cords (see Figure 13.2).5 An important pair of cartilages within the larynx is the pyramid-shaped arytenoids, which act as attachment points for the vocal cords. This area is easily damaged by pressure from endotracheal tubes; the most significant independent risk factor for injury to the arytenoids is the length of intubation time.6 The thyroid cartilage (‘Adam’s apple’) and the cricoid cartilage protect the glottis and the entrance to the trachea.4 Another cartilage in the larynx is the triangular-shaped elastic epiglottis which protects the lower airways from aspiration of food and fluids into the lungs. The epiglottis usually occludes the inlet to the larynx during swallowing. The primitive cough, swallow and gag reflexes further protect the airway.4
Lower Respiratory Tract
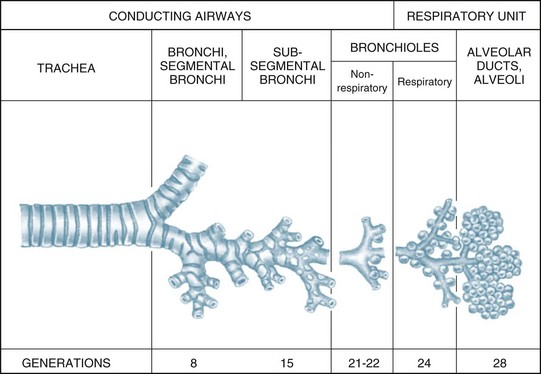
The airways within each lung branch out further into secondary (or lobar) bronchi then tertiary (or segmental) bronchi. Further divisions within these conducting airways end with the terminal bronchioles, the smallest airways without alveoli. These conducting airways do not participate in gas exchange but form the anatomical dead space (approximately 150 mL).7
Larger airways have a greater proportion of supporting cartilage, ciliated epithelium, goblet and serous cells and hence a mucous layer. As the airways become smaller, cartilage becomes irregularly dispersed, the number of goblet cells and amount of mucus decreases until, at the alveolar level, there is only a single layer of squamous epithelial cells. Alveolar macrophages are present in these epithelial cells, and phagocytose any small particles that may enter the alveolar area. Smooth muscle surrounds and supports the bronchioles, enabling airway diameter change and subsequent changes in airway resistance to gas flow.8
Thorax/Lungs
The lungs and heart are protected within the thoracic cage. Expansion of the thorax enables the lungs to fill with air during inspiration when respiration is triggered, and to passively compress to expel air from the lungs during expiration. The diaphragm separates the thorax from the abdomen and actively participates in the ventilation process. The diaphragm is the most important inspiratory muscle, performing approximately 80% of the work of breathing. Inspiration is initiated from the medulla, sending impulses through the phrenic nerve to stimulate the diaphragm to contract and flatten. The phrenic nerve originates in the cervical plexus and involves the third to fifth cervical nerves. It splits into two parts, passing to the left and right side of the heart before it reaches the diaphragm. For this reason, patients can have ventilation difficulties if phrenic nerve damage is due to C3–C5 trauma.8,9
The conducting airways move inspired air towards the respiratory unit, ending in the terminal bronchioles. The respiratory bronchioles, the alveolar ducts and alveolar sacs form the respiratory unit where the diffusion of gas molecules, or gas exchange, occurs. The respiratory unit makes up most of the lung with a volume of 2.5–3 L during rest7 (see Figure 13.3).
Surfactant
Of particular importance to the structure and function of the respiratory system are the type I and II alveolar epithelial cells. Type I cells provide support of the wall within the alveolar unit. Type II cells produce an important lipoprotein, surfactant, that lines the inner alveolar surface, and lowers surface tension of the alveoli, stabilising the alveoli to optimise lung compliance and facilitate expansion during inspiration.7 If surfactant synthesis is reduced due to pulmonary disease, lung compliance decreases and the work of breathing increases.10
Pleura
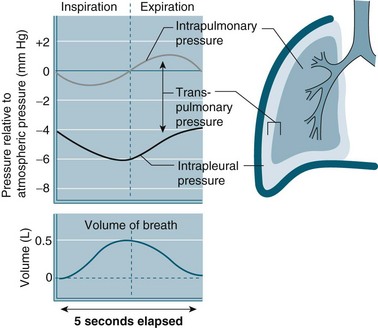
The intra-pleural pressure in the pleural space under normal circumstances is always negative with a range of −4 to −10 cmH2O; this negative pressure keeps the lungs inflated. During inhalation the pressure becomes more negative as both the lungs and the chest wall are elastic structures. These elastic fibres of the lung pull the visceral pleura inwards while the chest wall pulls the parietal pleura outward. The pressure difference between the alveolar pressure (0 cmH2O pressure in the lungs) and the intra-pleural pressure (−4 cmH2O) across the lung wall is termed the trans-pulmonary pressure (+4 cmH2O [0 − (−4) = +4]), and is the force that hold the lungs open3,4 (see Figure 13.4).
Pulmonary Circulation
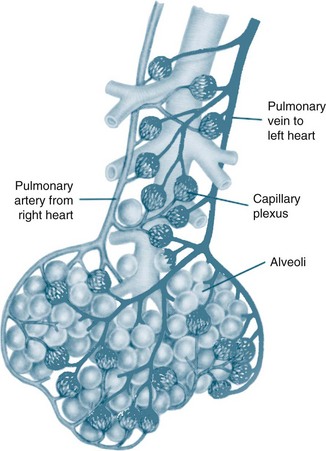
The circulatory system of the lung receives the entire cardiac output but operates as a low pressure system, as it only directs blood back to the left side of the heart (unlike the systemic circulation which pumps blood to different regions of the entire body). The pulmonary circulation involves oxygen-depleted blood being pumped by the right ventricle to the lungs via the pulmonary artery, with oxygen-rich blood returning to the left atrium via the pulmonary veins. Pulmonary blood vessels follow the path of the bronchioles, with the capillaries forming a dense network in the walls of the alveoli. As illustrated in Figure 13.5,5 the entire surface area of the alveolar wall is covered by these capillaries, where gas exchange occurs as the capillaries are just large enough for a red blood cell to pass through.
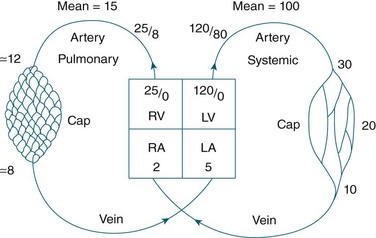
Pulmonary vessels are short, thin and have relatively little smooth muscle. The pressure inside the vessels is remarkably low (normal pulmonary artery pressure is only 25/8 mmHg; mean 15 mmHg).7 This low pressure system ensures that the work of the right heart is as small as feasible, while promoting efficient gas exchange in the lungs11 (see Figure 13.6).
Bronchial Circulation
The bronchial circulation, part of the systemic circulation, supplies oxygenated blood, nutrients and heat to the conducting airways (to the level of the terminal bronchioles) and to the pleura. Drainage of this deoxygenated blood is predominantly through the bronchial network, although some capillaries drain into the pulmonary arterial circulation, contributing to venous admixture or right-to-left shunt7 (see Pathophysiology below for further discussion).
Control of Ventilation
Controller
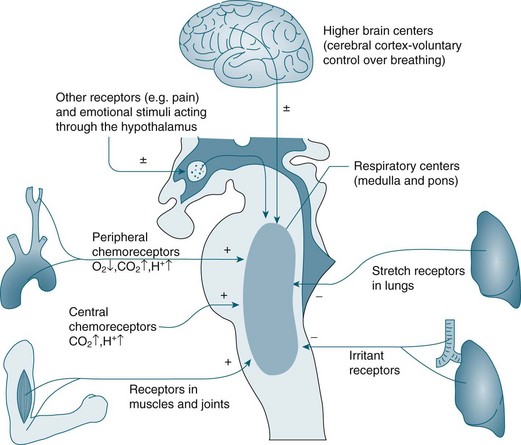
In the brainstem, the medulla oblongata and the pons regulate automatic ventilation while the cerebral cortex regulates voluntary ventilation (see Figure 13.7). The respiratory rhythmic centre in the medulla can be divided into inspiratory and expiratory centres, with the following functions:8
• The inspiratory centre (or dorsal respiratory group) triggers inspiration.
• The expiratory centre (or ventral respiratory group) only functions during forced respiration and active expiration.
• The pneumotaxic and apneustic centre in the pons adjusts the rate and pattern of breathing.
• The cerebral cortex provides conscious voluntary control over the respiratory muscles. This voluntary control cannot be maintained when PCO2 and hydrogen ion (H+) concentration become markedly elevated; an example is the inability to hold your breath for very long.8 Emotional and autonomic activities also often affect the pace and depth of breathing.
Effectors
The diaphragm is the major muscle of inspiration, although the external intercostal muscles are also involved. The accessory muscles of inspiration (scalenes, sternocleidomasteoid muscles and the pectoralis minor of the thorax) are active only during exercise or strenuous breathing. Expiration is a passive act and only the internal intercostal muscles are involved at rest. During exercise, the abdominal muscles also contribute to expiration.4 Inspiration is triggered by stimulus from the medulla, causing the diaphragm to contract downwards, and the external intercostal muscles to contract, lifting the thorax up and out. This action lowers pressure within the alveoli (intra-alveolar pressure) relative to atmospheric pressure. Air rushes into the lungs to equalise the pressure gradient. After contraction has ceased, the ribs and diaphragm relax, the pressure gradient reverses, and air is passively expelled from the lungs and return to their resting state due to elastic recoil.
Sensors
A chemoreceptor is a sensor that responds to a change in the chemical composition of the blood; there are two types: central and peripheral. Central chemoreceptors account for 70% of the feedback controlling ventilation, and respond quickly to changes in the pH of cerebral spinal fluid (CSF) (increase of PCO2 in arterial blood).9 If the PCO2 in arterial blood remains high for a prolonged period, as in chronic obstructive pulmonary disease (COPD), a compensatory change in HCO3 occurs and the pH in CSF returns to its near normal value.7 Under these conditions a patient breathes due to hypoxic drive; that is, low levels of O2 are detected by peripheral chemoreceptors and this triggers breathing. For this small percentage of the population with COPD, care is required when administering oxygen so that the stimulus to breathe is not compromised, as increases in PO2 may reduce respiratory drive. Peripheral chemoreceptors respond to low partial pressure of oxygen in arterial blood (PaO2) and contribute to maintaining ventilation, functioning optimally when oxygen levels fall below 70 mmHg.7
Central chemoreceptors located in the medulla respond to changes in hydrogen ion concentration in the CSF that surrounds these receptors. A change in the partial pressure of carbon dioxide in arterial blood (PaCO2) causes movement of CO2 across the blood–brain barrier into the CSF and alters the hydrogen ion concentration. This increase in hydrogen ions stimulates ventilation. Central chemoreceptors do not however respond to changes in PaO2 levels. Opiates also have a negative influence on these chemoreceptors causing less sensitivity to changes in hydrogen ion concentration.7 Note also that hyperventilation may reduce the level of PaCO2 to a level that could cause accidental unconsciousness if the breath is held after hyperventilation. This phenomenon is well known amongst divers and is due to increasing levels of CO2 as the primary trigger of breathing. If the CO2 level is too low due to hyperventilation, the breathing reflex is not triggered until the level of oxygen has dropped below what is necessary to maintain consciousness.
Peripheral chemoreceptors are located in the common carotid arteries and in the arch of the aorta. These receptors are sensitive to changes in PaO2 and are the primary responders to hypoxaemia, stimulating the glossypharyngeal and vagus nerves and providing feedback to the medulla. Peripheral chemoreceptors also detect changes in PaCO2 and hydrogen ion concentration/pH in arterial blood.9 Other receptors include stretch receptors located in the lungs that inhibit inspiration and protect the lungs from over-inflation (Hering–Breuer reflex), and in the muscles and joints (see Figure 13.7).
Pulmonary Volumes and Capacities
In healthy individuals, the lungs are readily distensible or compliant; when exposed to high expanding pressures or in disease states, compliance is increased or decreased. A range of lung volumes and capacities are illustrated in Figure 13.8. Tidal volume (TV) is the volume of air entering the lungs during a single inspiration and is normally equal to the volume leaving the lungs on expiration (around 500 mL). During inspiration, the TV of inspired air is added to the 2400 mL of air already in the lungs. This volume of air that remains in the lungs after a normal expiration is the functional residual capacity (FRC),4 which:
• has an important role in keeping small alveoli open and avoiding atelectasis
• can be reduced during anaesthesia or neuromuscular blockade, most likely due to loss of muscle tone12
• if reduced, results in the smallest alveoli closing at the end of the expiration (the ‘closing volume’).
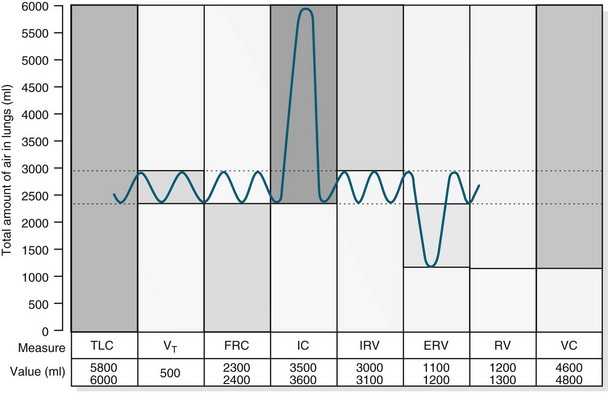
FIGURE 13.8 For lung volume measurements, all values are approximately 25% less in women. ERV, expiratory reserve volume; IC, inspiratory capacity; IRV, inspiratory reserve volume; FRC, functional residual capacity; TLC, total lung capacity; RV, residual volume; VC, vital capacity; VT, tidal volume.10
The closing volume plus the residual volume is called the ‘closing capacity’. The closure of the smallest airways may occur because dependent areas of the lungs are compressed, although this is not the only mechanism as these airways also close in the weightlessness of space. The closing volume is dependent on patient age; in a young healthy person it is 10% of vital capacity, while for an individual aged 65 years it increases to 40%, approximating total FRC.11
Alveolar Ventilation
Minute volume (MV), often referred to during mechanical ventilation, is TV multiplied by respiratory frequency (e.g. 500 mL × 12 breaths per minute = 6000 mL MV). Importantly, only the first 350 mL of inhaled air in each breath reaches the alveolar exchange surface, with 150 mL remaining in the conducting airways (called the ‘anatomic dead space’). Alveolar ventilation is the amount of inhaled air that reaches the alveoli each minute (e.g. 350 mL × 12 = 4200 mL of alveolar ventilation).8
Work of Breathing
In a resting state, energy requirements to breathe is minimal (less than 5% of total O2 consumption).7 However, changes in airway resistance and lung compliance affect the work of breathing (WOB), resulting in increased oxygen consumption (VO2).13 As noted earlier, the lungs are very distensible and expand during inspiration. This expansion is called the elastic or compliance work and refers to the ease by which lungs expand under pressure. Lung compliance is often monitored when patients are mechanically ventilated, and is calculated by dividing the change in lung volume by the change in trans-pulmonary pressure.3 For the lung to expand, it must overcome lung viscosity and chest wall tissue (called ‘tissue resistance work’). Finally, there is airway resistance work – movement of air into the lungs via the airways. The work associated with resistance and compliance is easily overcome in healthy individuals but in pulmonary disease, both resistance and compliance work is increased.3,14 During exertion, when increased muscle function heightens metabolic rate, oxygen demand rises to match consumption and avoid anaerobic metabolism, and work of breathing is increased. The term ‘work of breathing’ is often used in those who are critically ill, when basic respiratory processes are challenged and breathing consumes a far greater proportion of total energy.
Principles of Gas Transport and Exchange in Alveoli and Tissues
Oxygen and carbon dioxide is transported in the bloodstream between the alveoli and the tissue cells by the cardiac output. Delivery of oxygen to tissues and transfer of carbon dioxide from the tissues to the capillary occurs by diffusion and is therefore dependent on the pressure gradient between the capillary and the cell. Diffusion involves molecules moving from areas of high concentration to low concentration. Other determinants of the rate of diffusion include the thickness of the alveolar membrane, the amount of surface area of the membrane available for gas transfer and the inherent solubility of the gas. Carbon dioxide diffuses about 20 times more rapidly than oxygen because of the much higher solubility of carbon dioxide in blood.7 At the most distal ends of the conducting airways lies an extensive network of approximately 300 million alveoli. The surface area of the lungs if spread out flat is about 90 m2 – about 40 times greater than the surface of the skin.4 Gas exchange occurs through the exceptionally thin alveolar membranes. Oxygen uptake takes place from the external environment via the lungs through to the blood in the adjacent alveolar capillary networks. Similarly, carbon dioxide diffuses from capillaries to the alveoli and is then expired.
Oxygen Transport
In oxygenated blood transported by the pulmonary capillaries, there is 20 mL of oxygen in each 100 mL of blood. Oxygen is transported in two ways; dissolved in plasma (about 0.3 mL; 1.5%) with the remainder bound to haemoglobin.8 The 1.5% of oxygen dissolved in the blood is what constitutes PaO2 and measured by arterial blood gases.4 One gram of haemoglobin carries 1.34 mL oxygen, and the level of saturation within the total circulating haemoglobin can be measured clinically, commonly by pulse oximetry. The amount of oxygen actually bound to haemoglobin compared with the amount of oxygen the haemoglobin can carry is commonly reported as SaO2. Oxygen is attached to the haemoglobin molecule at four haem sites. As the majority of oxygen transport is via haemoglobin, if all four sites are occupied with oxygen molecules the blood is determined to be ‘fully saturated’ (SaO2 = 100%).14
A large reserve of oxygen is available if required, without the need for any increase in respiratory or cardiac workload. Oxygen extraction is the percentage of oxygen extracted and utilised by the tissues. At rest, just 25% of the total oxygen delivered to the tissue is extracted, although this amount does vary throughout the body, with some tissue beds extracting more and others taking less. Normally, the oxygen saturation of venous blood is 60–75%; values below this indicate that more oxygen than normal is being extracted by tissues. This can be due to a reduction in oxygen delivery to the tissues, or to an increase in the tissue consumption of oxygen.8,9
Oxygen delivery (DO2) and oxygen consumption (VO2) are important aspects to consider in the management of a critically ill patient. Normal oxygen delivery in a healthy person at rest is approximately 1000 mL/min. Normal oxygen consumption is 200–250 mL/min,9 but this can increase significantly during episodes of sepsis, fever, hypercatabolism and shivering.14 The difference between normal delivery and normal consumption highlights the large degree of oxygen reserve available to the body.
Oxygen–Haemoglobin Dissociation Curve
As blood is transported to the tissues and end-organs, the affinity of haemoglobin and oxygen to combine decreases, relative to the surrounding arterial oxygen tension. This relationship is illustrated by the oxyhaemoglobin dissociation curve (see Figure 13.9). As oxygen is offloaded at the tissue level, carbon dioxide binds more readily with haemoglobin, to be transported back to the lungs for removal.4
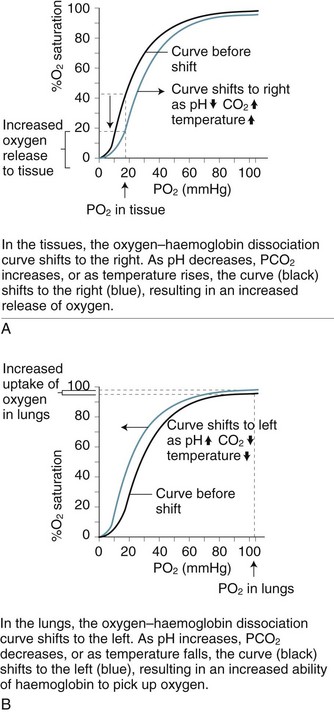
In the upper part of the curve (within the lungs), relatively large changes in the PaO2 cause only small changes in haemoglobin saturation. Therefore, if the PaO2 drops from 100 to 60 mmHg (14–8 kPa), the saturation of haemoglobin changes only 7% (from a normal 97% to 90%). The lower portion (steep component) of the oxygen–haemoglobin dissociation curve, when PaO2 is between 60 and 40 mmHg (8–5 kPa) reflects however that as haemoglobin is further de-saturated, larger amounts of oxygen are released for tissue use, ensuring an adequate oxygen supply to peripheral tissues is maintained even when oxygen delivery is reduced.4 Oxygen saturation still remains at 70–75%, leaving a significant amount of oxygen in reserve. The relationship between the two axes of this curve assumes normal values for haemoglobin, pH, temperature, PaCO2 and 2,3-DPG. Changes to any of these values will shift the curve to the right or left and therefore reflect different values for PaO2 and SaO2.8
Carbon Dioxide Transport
Carbon dioxide is transported by blood in three forms: combined with water as carbonic acid (80–90%), dissolved (5%), or attached to plasma proteins (5–10%), including haemoglobin. The dissolved carbon dioxide constitutes PaCO2 and is measured by arterial blood gases. The greater solubility of CO2 when compared with oxygen results in rapid diffusion across the capillary membranes, and therefore the gas can be easily removed for elimination.4 Carbon dioxide, a byproduct of cellular respiration, is produced at a rate of 200 mL/min, with only minor differences in normal concentrations in arterial (480 mL/L) and venous (520 mL/L) blood.9
Relationship Between Ventilation and Perfusion
Gas exchange is the key function of the lungs, and the unique anatomy of capillaries and alveoli facilitates this process. However, a number of physiological factors mean that the ventilation (V) to perfusion (Q) ratio is not matched in a 1 : 1 relationship. As normal alveolar ventilation is about 4 L/min and pulmonary capillary perfusion is about 5 L/min, the normal ventilation to perfusion ratio (V/Q) is 0.8.7 In addition, pressure in the pulmonary circulation is low relative to systemic pressure, and is influenced much more by gravity/hydrostatic pressure. In the upright position, lung apices receive less perfusion compared with the bases.7 In the supine position, apical and basal perfusion is almost equal, but the posterior (dependent) portion of the lungs receives greater perfusion than the anterior lung area. Ventilation is also uneven throughout the lung, with the bases receiving more ventilation per unit volume than the apices.7
For a patient in an upright position, in:
• Zone 1 (upper area of the lungs): alveolar pressure is generally greater than both arterial and venous capillary pressure [PA>Pa>Pv], and blood flow is reduced, leading to alveolar dead space (alveoli ventilated but not adequately perfused).
• Zone 2 (middle portion of the lungs): perfusion and gas exchange is influenced more by pressure differences between arterial and alveolar pressures than by the usual difference between arterial and venous pressures [Pa>PA>Pv], with a normal V/Q ratio.
• Zone 3 (lung bases): alveolar pressure is lower than both arterial and venous pressures [Pa>Pv>PA], and ventilation is reduced leading to intrapulmonary shunting (alveoli perfused but not adequately ventilated)7 (see Figure 13.10).
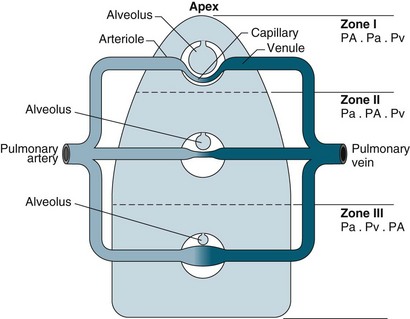
FIGURE 13.10 The effects of gravity and alveolar pressure on pulmonary blood flow. Notice the three lung zones.86
These physiological relationships are more complex in a critically ill patient when ventilation and/or lung perfusion is further compromised by disease processes and positive pressure ventilation, and the patient is in a supine or semi-recumbent position.7
Acid–Base Control: Respiratory Mechanisms

(6.1 = the dissociation constant in plasma).11
Respiratory alkalosis occurs when a patient hyperventilates with large, frequent breaths; CO2 decreases in arterial blood and pH rises. If this condition is maintained (e.g. walking at high altitude), the kidney excretes bicarbonate and pH returns to normal (i.e. the respiratory alkalosis is compensated).11
Pathophysiology
Three common pathophysiological concepts that influence respiratory function in critically ill patients are hypoxaemia, inflammation and oedema. The principles for these phenomena are discussed below. Related presenting disease states including respiratory failure, pneumonia, acute lung injury, asthma and chronic obstructive pulmonary disease are described in Chapter 14.
Hypoxaemia
Hypoxaemia describes a decrease in the partial pressure of oxygen in arterial blood (PaO2) of less than 60 mmHg.4 This state leads to less efficient anaerobic metabolism at the tissue and end-organ level, and resulting compromised cellular function. Hypoxia is abnormally low PO2 in the tissues, and can be due to:
• ‘hypoxic’ hypoxia: low PaO2 in arterial blood due to pulmonary disease
• ‘circulatory’ hypoxia: reduction of tissue blood flow due to shock or local obstruction
• ‘anaemic’ hypoxia: reduced ability of the blood to carry oxygen due to anaemia or carbon monoxide poisoning
• ‘histotoxic’ hypoxia: a cellular environment that does not support oxygen utilisation due to tissue poisoning (e.g. cyanide poisoning).7
A hypoxic patient can show symptoms of fatigue and shortness of breath if the hypoxia has developed gradually. If the patient has severe hypoxia with rapid onset, they will have ashen skin and blue discolouration (cyanosis) of the oral mucosa, lips, and nail beds. Confusion, disorientation and anxiety are other symptoms. In later stages, unconsciousness, coma and death occur.15
Acute respiratory failure is a common patient presentation in ICU that is characterised by decreased gas exchange with resultant hypoxaemia.16 Two different mechanisms cause acute respiratory failure: Type I presents with low PO2 and normal PCO2; Type II presents with low PO2 and high PCO21 (see Chapter 14 for further discussion).
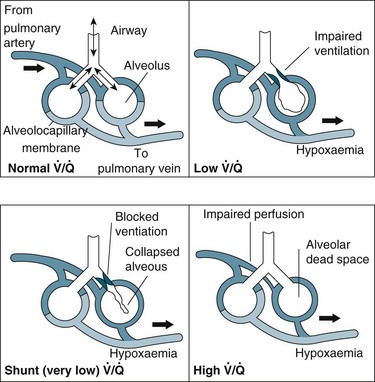
In general, impaired gas exchange results from alveolar hypoventilation, ventilation/perfusion mismatching and intrapulmonary shunting, each resulting in hypoxaemia. Hypercapnia may also be present depending on the underlying pathophysiology.17
Alveolar hypoventilation occurs when the metabolic needs of the body are not met by the amount of oxygen in the alveoli. Hypoxaemia due to alveolar hypoventilation is usually extrapulmonary (e.g. altered metabolism, interruption to neuromuscular control of breathing/ventilation) and associated with hypercapnia.17
Ventilation/perfusion (V/Q) mismatch results when areas of lung that are perfused are not ventilated (no participation in gas exchange) because alveoli are collapsed or infiltrated with fluid from inflammation or infection (e.g. pulmonary oedema, pneumonia). This results in an overall reduction in blood oxygen levels, which can usually be countered by compensatory mechanisms.1
Intrapulmonary shunting is an extreme case of V/Q mismatch. Shunting occurs when blood passes alveoli that are not ventilated. There can be significant intrapulmonary shunting, and therefore overwhelming reductions in PaO2.18 Carbon dioxide levels may still be normal but depending on the onset and progression of the respiratory pathophysiology, compensatory mechanisms may not be able to maintain homeostasis1,11 (see Figure 13.11).
Tissue Hypoxia
There are few physiological changes with mild hypoxaemia (when O2 saturation remains at 90% despite a PaO2 of 60 mmHg [8 kPa]), with only a slight impairment in mental state. If hypoxaemia deteriorates and the PaO2 drops to 40–50 mmHg (5.3–6.7 kPa), severe hypoxia of the tissues ensues. Hypoxia at the central nervous system level manifests with headaches and somnolence. Compensatory mechanisms include catecholamine release, and a decrease in renal function results in sodium retention and proteinuria.19
Different tissues vary in their vulnerability to hypoxia, with the central nervous system and myocardium at most risk. Hypoxia in the cerebral cortex results in a loss of function within 4–6 seconds, loss of conscious in 10–20 seconds and irreversible damage in 3–5 minutes.11 In an environment that lacks oxygen, cells function by anaerobic metabolism and produce much less energy (adenosine triphosphate [ATP]) than with aerobic metabolism (2 versus 38 ATP molecules per glucose molecule), and lactic acid increases. With less available energy, the efficiency of cellular functions such as the Na+/K+ pump, nerve conduction, enzyme activity and transmembrane receptor function diminishes.19 The overall effect of interruption to these vital cellular activities is a reduction in organ or tissue function, which in turn compromises system and body functions.
Changes to the oxyhaemoglobin dissociation curve also occur in states related to hypoxia. The curve shifts to the right when there is acidosis and/or raised levels of PCO2 as commonly seen in respiratory failure. Although this change may alter patient oxygen saturation readings, the increased release of oxygen from haemoglobin to the tissues has obvious benefits for tissue oxygenation and cellular metabolism.7
Compensatory Mechanisms to Optimise Oxygenation
When PO2 in the alveolus is reduced, hypoxic pulmonary vasoconstriction occurs, with contraction of smooth muscles in the small arterioles in the hypoxic region, directing blood flow away from the hypoxic area of the lung.7 Peripheral chemoreceptors also detect hypoxaemia and initiate compensatory mechanisms to optimise cellular oxygen delivery. Initial responses are increased respiratory rate and depth of breathing, resulting in increased minute ventilation, and raised heart rate with possible vasoconstriction as the body attempts to maintain oxygen delivery and uptake. This overall up-regulation cannot be sustained indefinitely, particularly in a person who is critically ill, and compensatory mechanisms begin to fail with worsening hypoxaemia and cellular and organ dysfunction. Unless the hypoxaemia is reversed and/or respiratory and cardiovascular support is provided, irreversible hypoxia and death will ensue.
Inflammation
Inflammatory processes can occur at a local level (e.g. as a result of inhalation injuries, aspiration or respiratory infections) or are secondary to systemic events (e.g. sepsis, trauma). Damage to the pulmonary endothelium and type I alveolar cells appear to play a key role in the inflammatory processes associated with ALI.20 Once triggered, inflammation results in platelet aggregation and complement release. Platelet aggregation attracts neutrophils, which release inflammatory mediators (e.g. proteolytic enzymes, oxygen free radicals, leukotrienes, prostaglandins, platelet-activating factor [PAF]). Neutrophils also appear to play a key role in the perpetuation of ALI/ARDS.1 As well as altering pulmonary capillary permeability, resulting in haemorrhage and fluid leak into the pulmonary interstitium and alveoli, mediators released by neutrophils and some macrophages precipitate pulmonary vasoconstriction. Resulting pulmonary hypertension leads to diminished perfusion to some lung areas, with dramatic alterations to both perfusion and ventilation leading to significant V/Q mismatches, and the subsequent signs and symptoms typically seen in patients with pulmonary inflammation/oedema.
Oedema
Pulmonary oedema also alters gas exchange, and results from abnormal accumulation of extravascular fluid in the lung. The two main reasons for this are: ‘increased pressure’ oedema, where there is an increase in hydrostatic or osmotic forces (e.g. left heart ventricular dysfunction or volume overload); and ‘increased permeability’ oedema, that results from increased membrane permeability of the epithelium or endothelium in the lung, allowing accumulation of fluid (also called ‘non-cardiogenic’). Resulting clinical syndromes are acute lung injury (ALI) or acute respiratory distress (ARDS) (see Chapter 14 for further discussion).
Changes to Respiratory Function
During the early exudative phase of ALI/ARDS, tachypnoea, signs of hypoxaemia (apprehension, restlessness) and an increase in the use of accessory muscles are usually evident as a result of infiltration of fluids into the alveoli. With impaired production of surfactant during the proliferative phase, respiratory function deteriorates, and dyspnoea, agitation, fatigue and the emergence of fine crackles on auscultation are common.1,11 Airway resistance is increased when oedema affects larger airways. Lung compliance is reduced as interstitial oedema interferes with the elastic properties of the lungs, and patients may be quite a challenge to adequately ventilate. Infiltration of type II alveolar cells into the epithelium may lead to interstitial fibrosis on healing,21causing chronic lung dysfunction.
Respiratory Dysfunction: Changes to Work of Breathing
If respiratory compromise is not reversed, there will be significant increases to the work of breathing. Clinical manifestations include tachypnoea, tachycardia, dyspnoea, low tidal volumes and diaphoresis. Hypercapnia will ensue, which further compromises respiratory muscle function and precipitates diaphragmatic fatigue. Oxygen consumption during breathing can be so great that reserve capacity is reduced. If patients with preexisting COPD (who may breathe close to the fatigue work level) experience an acute exacerbation, this can easily tip them into a fatigued state. Early identification and management of respiratory compromise before these stages improves patient outcomes.19
Assessment
Patient History
Previous Respiratory Problems
Many respiratory disorders can be chronic and pulmonary diseases may recur (e.g. tuberculosis), and new diseases can complicate old ones.22 Ask about problems with breathing and their chest, number of hospitalisations, treatments, and childhood respiratory diseases.
Symptoms
Dyspnoea (shortness of breath) is subjective and therefore difficult to grade. The mechanism that underlies the sensation of dyspnoea is poorly understood but it is extremely uncomfortable and frightening.22 Assess the severity of dyspnoea by asking about breathing in relation to activities (e.g. breathlessness when dressing or walking across a room). Ask the patient how many pillows they need to sleep as this may indicate the severity of any orthopnoea. If the patient becomes short of breath when lying flat (orthopnoea) it can be a symptom of increased blood in the pulmonary circulation due to left ventricular failure, pulmonary oedema, bronchitis, asthma or obstructive sleep apnoea.
Sputum production should be considered for amount, colour or the presence of blood. Yellow or green sputum is typical in bacterial infection. Haemoptysis or sputum mixed with blood is a significant finding and can indicate tuberculosis or lung cancer. Wheezing can indicate vocal cord disorder or asthma.22
Chest pain can result from multiple causes, therefore appropriate assessment is essential. Chest pain that occurs during inspiration can be due to irritation or inflammation of the pleural surface. Pleural pain is experienced mostly on one side of the chest, is knifelike in character and occurs in pneumonia and spontaneous pneumothorax. The most significant chest pain occurs as a result of myocardial ischaemia, due to too little oxygen to the coronary blood vessels. This pain is termed angina pectoris and can arise from chronic stable angina or acute myocardial infarction22 (see Chapter 10 for further discussion). Chest pain also occurs with fractured ribs.
Personal and Family History
Patient family history and environment can influence pulmonary presentations. The focus of this questioning is on: tobacco use, allergies, recent travel, type of occupation, home situation and family history. Use of tobacco, current or past, is important in evaluating pulmonary symptoms. Ask the patient to quantify the amount of cigarette packs per week and how many years they have smoked. The majority of smokers have reduced lung function. Tobacco smoking is responsible for 80–90% of the risk of developing chronic obstructive pulmonary disease but only 10–15% of these patients will develop clinically significant symptoms.23 Exposure to secondhand smoke may also be of interest. There is evidence that exposure to secondhand smoke for an extended period is a major cause in developing chronic bronchitis.24 A history of recent travel increases the possibility of exposure to infectious diseases affecting the respiratory system.25 Recent long flights are also responsible for the possibility of deep venous thrombosis which can lead to pulmonary embolism.26 An occupation with exposure to allergens and toxins in the work place is important information to collect because this can be associated with a decline in lung function.27 Ask about the patient’s home situation and whether they live with someone with an infection or disease such as influenza or tuberculosis. Ask about children who are close to the patient, as innocuous viral infections in small children may account for severe disease in adults.22 Check also whether there is a family history of cancer, heart or respiratory diseases.
Physical Examination
Inspection
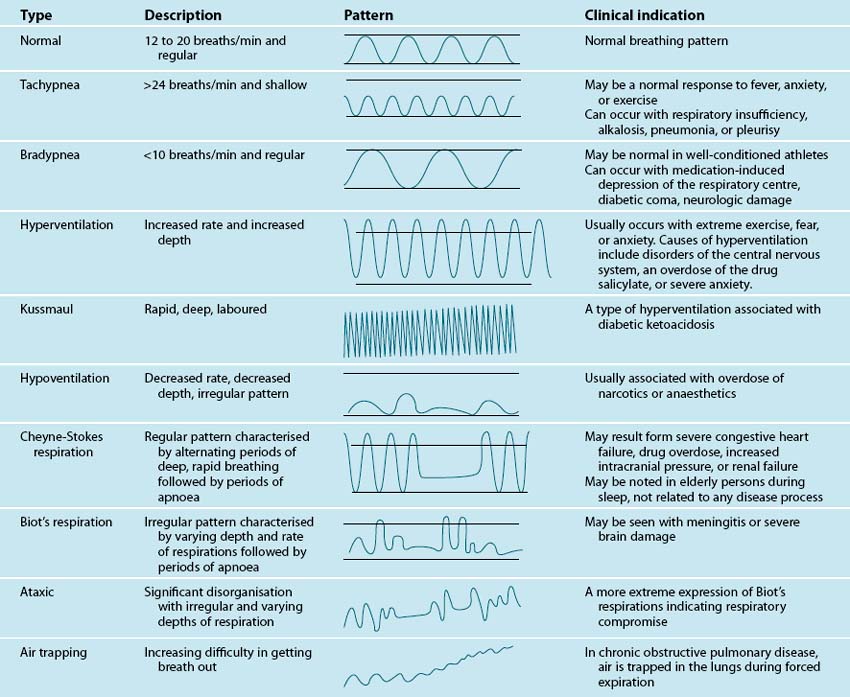
Inspection involves carefully observing the patient for signs of respiratory problems. Focus on: patient position, chest wall inspection, respiratory rate and rhythm, respiratory effort, central or peripheral cyanosis and clubbing. Note what position appears preferable for the patient, whether they look comfortable in bed, having trouble breathing, or appear anxious. Observe from head to toe. Observe the patient’s chest wall symmetry during the respiratory cycle, anatomical structures, and the presence of scars. The most important sign of respiratory distress is respiratory rate and rhythm. Count the rate for a one-minute period. Normal respiratory rate for adults is 12–15 per minute.4 Abnormal breathing patterns are noted in Table 13.1. Observe respiratory effort, in particular the use of accessory muscles, abdominal muscles, nasal flaring, body position and mouth-breathing.
Inspect the lips, tongue and sublingual area for central cyanosis (a late sign of hypoxia that is almost impossible to detect in a patient with anaemia).1 Observe the extremities for oedema (can be a sign of heart failure), fingers and toes for peripheral cyanosis and clubbing of the nailbeds. Peripheral cyanosis can appear with low blood flow to peripheral areas. Clubbing of finger or toe nailbeds can be idiopathic in nature or more commonly due to respiratory and circulatory diseases (e.g. chronic hypoxia in congenital heart disease).14,22
Palpation
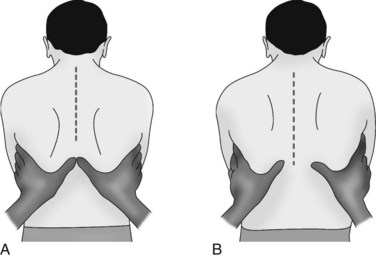
Palpate the patient’s chest with warm hands, focusing on: areas of tenderness, tracheal position, presence of subcutaneous emphysema and tactile fremitus. Assess for symmetry (left compared to right) and anterior and posterior surfaces (see Figure 13.12). Check the thorax for areas of tenderness or bony deformities, and note symmetry of chest movement during breathing. Use the palm of your hand to assess skin temperature of the skin, noting for clammy, hot or cold skin. To test for chest wall symmetry on inspiration, place both hands with thumbs together on the patient’s posterior thorax and ask the patient to take a deep breath. Your thumbs should separate equally 3–5 cm during normal deep inspiration1 (see Figure 13.13). Asymmetry can occur in pneumothorax, pneumonia or other lung disorders where inspiration is affected.
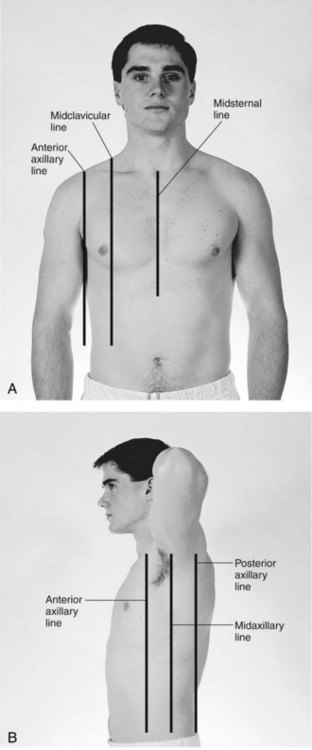
FIGURE 13.12 Sequence of systematic movements for auscultation and palpation of the anterior (A) and posterior (B) chest. Comparison of the right and left sides of the chest should be performed by moving from side to side, beginning proximally and moving distally down the chest wall. Palpation and auscultation of the thorax is performed in a sequential fashion.84
Palpation of tracheal position is useful to detect a mediastinal shift; deviation of the trachea from midline may indicate a pulmonary problem. With a large pneumothorax or after pneumonectomy, the trachea may shift away from the affected side.28 The presence of subcutaneous emphysema indicates air in the subcutaneous tissue and most commonly occurs in the face, neck and chest after blunt or penetrating trauma to the chest (e.g. stabbing, gun shot, fractured ribs); facial fractures; tracheostomy; upper respiratory tract surgery; and patients who are mechanically ventilated. Subcutaneous emphysema feels like crackling under your fingers due to air pockets in the tissue.29
Palpation is also used to assess for the presence of tactile (vocal) fremitus, a normal palpable vibration. Place your hands on the patient’s chest and ask the patient to vocalise repeatedly the term ‘ninety nine’. Fremitus is decreased (that is, impaired transmission of sounds) in pleural effusion and pneumothorax. Fremitus is increased over those regions of the lungs were transmission is increased (e.g. pneumonia, consolidation).22 In mechanically ventilated patients, fremitus can be detected over the lungs when there are secretions in the airways.
Auscultation
Careful interpretation of breath sounds and integration of this assessment data with other findings can provide important information about lung disorders. Use the diaphragm of the stethoscope and ensure full contact with the skin for optimal listening. For a spontaneously breathing patient, ask them to breathe through their mouth (nose breathing may alter the pitch of the breath sounds). Auscultation is performed in a systematic way so as to compare the symmetry of breath sounds (see Figure 13.12). Normal breath sounds reflect air movement through the bronchi, and sounds change as air moves from larger to smaller airways. Sounds also change when air passes though fluid or narrowed airways. Breath sounds therefore differ depending on the area auscultated; the three general types of normal breath sounds are bronchial, bronchiovesicular and vesicular breath sounds (see Table 13.2).
| Sound | Characteristics |
|---|---|
| Vesicular | Heard over most of lung field; low pitch; soft and short exhalation, and long inhalation. |
| Bronchovesicular | Heard over main bronchus area and over upper right posterior lung field; medium pitch; exhalation equals inhalation. |
| Bronchial | Heard only over trachea; high pitch; loud and long exhalation. |
Identify and become familiar with normal breath sounds before beginning to listen and identify abnormal breath sounds. Abnormal breath sounds are either continuous or discontinuous. Continuous sounds include wheezes and rhonchi, while discontinuous sounds include crackles (see Table 13.3). Stridor is an abnormal loud high-pitched breath sound caused by obstruction in the upper airways as a result of a foreign body, tissue swelling or vocal cord; this emergent condition requires immediate attention.30 Absent or diminished breath sounds indicate no airflow through that area of the lung and also requires immediate treatment.22,31
TABLE 13.3 Description of abnormal breath sounds1
| Abnormal Sound | Description | Condition |
|---|---|---|
| Absent breath sounds | No airflow to particular portion of lung | Pneumothorax Pneumonectomy Emphysematous blebs Pleural effusion Lung mass Massive atelectasis Complete airway obstruction |
| Diminished breath sounds | Little airflow to particular portion of lung | Emphysema Pleural effusion Pleurisy Atelectasis Pulmonary fibrosis |
| Displaced bronchial sounds | Bronchial sounds heard in peripheral lung fields | Atelectasis with secretions Lung mass with exudates Pneumonia Pleural effusion Pulmonary oedema |
| Crackles (rales) | Short, discrete popping or crackling sounds | Pulmonary oedema Pneumonia Pulmonary fibrosis Atelectasis Bronchiectasis |
| Rhonchi | Coarse, rumbling, low-pitched sounds | Pneumonia Asthma Bronchitis Bronchospasm |
| Wheezes | High-pitched, squeaking, whistling sounds | Asthma Bronchospasm |
| Pleural friction rub | Creaking, leathery, loud, dry, coarse sounds | Pleural effusion Pleurisy |
Documentation and Charting
Document the findings of your respiratory assessment in the patient’s chart; if this is the first respiratory assessment, describe the patient’s respiratory history carefully. Any abnormal findings including abnormal sounds and their characteristics should be described to enable subsequent re-assessment.30
Respiratory Monitoring
Pulse Oximetry
A pulse oximeter is a non-invasive device that measures the arterial oxygen saturation of haemoglobin in a patient’s blood flow. The technology is commonly standard in critical care units and other acute care areas. It is important to note that the device does not provide information on the patient’s ventilatory state, but it can determine their oxygen saturation and detect hypoxaemia.32 This prompt non-invasive detection of hypoxaemia enables identification of clinical deterioration and more rapid treatment to avoid associated complications.33
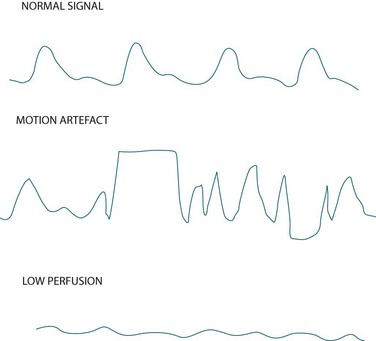
Measurement of indirect arterial oxygen saturation of the peripheral circulation via pulse oximetry is referred to as SpO2 (the letter ‘p’ denotes peripheral) and is displayed digitally on the monitor as a percentage, along with heart rate and a plethysmographic waveform. Interpreting this waveform is essential in distinguishing a true oximetry signal from one displaying dampening or artefact (see Figure 13.14). The probe is commonly sited on a finger, but can also be placed on the toe, earlobe or forehead. Change the probe position frequently to maintain adequate perfusion of the site and skin integrity.32
It is important to understand that pulse oximetry (SpO2) measures peripheral arterial oxygen saturation (SaO2) and that this differs from arterial oxygen tension (arterial partial pressure of oxygen; PaO2). Note that SaO2 and PaO2 are physiologically related; this is illustrated by the two axes of the oxyhaemoglobin dissociation curve (see Figure 13.9, and the previous Physiology section for more discussion). A fit healthy adult (with a normal haemoglobin level) breathing room air has a SpO2 of 97–99%.34
Limitations of Pulse Oximetry
The limitations of pulse oximetry can be seen as follows:
• Pulse oximetry in isolation does not provide all the necessary information on ventilation status and acid–base balance. Arterial blood gas testing is therefore also needed to assess other parameters.35
• Pulse oximeters are relatively reliable when the SaO2 is 90% or above, however accuracy deteriorates when the SaO2 falls to 80% or less.33 When SpO2 appear abnormal, assess the ABGs.
• As satisfactory arterial perfusion of the monitoring area is required, low cardiac output states, vasoconstriction, peripheral vascular disease and hypothermia can cause inaccurate pulse signals and falsely low oxygen saturation readings. In these cases, confirm oxygen saturation with intermittent arterial blood gas testing.
• As cardiac arrhythmias can impair perfusion and flow, signal quality may be compromised (see Figure 13.14). In these cases, use a more central probe (earlobe or forehead) to improve signal quality.
• Motion artefact (see Figure 13.14) caused by patient movement or shivering, is a significant cause of erroneously low readings and false alarms.36 Keep the patient warm (if not contraindicated) and encourage them to minimise movement as this may be a problem. Using an ear probe may also reduce motion artefact.
• There is conflicting evidence as to whether nail varnish or acrylic nails interfere with SpO2 readings.36 Blue, green and black nail varnishes may affect accuracy of readings. To ensure accuracy, it is recommended that nail varnish and acrylic nails be removed if possible.
• Dark skin pigmentation can lead to falsely elevated SpO2 values especially at low saturation levels.37 A target SpO2 level for patients with dark skin should be 95% to account for any over-estimation caused by pigmentation.33
• External light, especially fluorescent light and heat lamps, can lead to an over- or under-estimation of SpO2.35 Covering the probe with an opaque barrier, such as a washcloth, can prevent this problem.
• Dyshaemoglobins, particularly carboxyhaemoglobin and methaemoglobin render SpO2 monitoring unreliable.33 The pulse oximetry sensor cannot differentiate between oxyhaemoglobin, carboxyhaemoglobin and methaemoglobin, and therefore provides a falsely elevated oxygen saturation reading.35
• Injection of intravenous dyes may lead to a false underestimation of SpO2 for up to 20 minutes after their administration (methylene blue, indocyanine green, indigo carmine).33
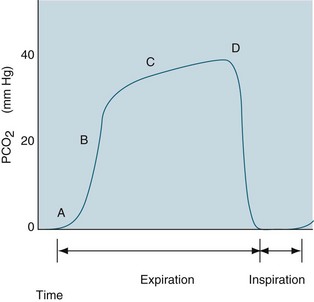
Capnography
Capnography monitors expired CO2 during the respiratory cycle (also termed end-tidal CO2 [PetCO2] monitoring) by infrared spectrometry. The percentage of CO2 exhaled at end expiration is displayed on the monitor in addition to the waveform, called a capnogram1 (see Figure 13.15 and Chapter 15 for waveform analysis and further discussion of PetCO2 monitoring). Continuous capnography detects subtle changes in a patient’s lung dynamics (i.e. changes to physiological shunting or alveolar recruitment) and can be measured in both intubated and non-intubated patients. It can be used to estimate PaCO2 levels in patients with a normal ventilation-perfusion ratio (usually 1–5 mmHg less than PaCO2). However, levels are affected by conditions common in the critically ill (e.g. low cardiac output states, elevated alveolar pressures, sepsis, hypo/hyperthermia, pulmonary embolism), so use PetCO2 to estimate PaCO2 levels in these patients with caution.38 Investigate any sudden changes in PetCO2 levels with arterial blood gas analysis.
Despite this limitation, PetCO2 monitoring has many uses in the care of a critically ill patient:
• it is the best method of confirming correct ETT placement and maintaining correct positioning of the ETT, ensuring tube patency and detecting leaks or disconnection of the circuit
• monitoring ventilation status during weaning from mechanical ventilation and after extubation
• assessing the effectiveness of cardiopulmonary resuscitation compressions and detecting return of spontaneous circulation
• monitoring ventilation continuously during sedation and anaesthesia
Capnography is recommended as a standard component of respiratory monitoring in intubated and mechanically ventilated patients in the ICU,41 during transport of a critically ill patient42 and during anaesthesia.43
Ventilation Monitoring
Mechanical ventilation is a common intervention in ICU for patients with respiratory failure or who require respiratory support. Advances in ventilation technology have led to an increased ability to monitor many ventilator parameters. A detailed understanding of mechanical ventilation principles and functions enables patient data to be interpreted accurately and managed appropriately. Chapter 15 provides a detailed discussion of mechanical ventilation, including ventilation monitoring, airway pressures (peak airway pressure, plateau pressure and positive end-expiratory pressure) and waveforms and loop displays.
Bedside and Laboratory Investigations
Arterial Blood Gases
Arterial blood gases (ABGs) are one of the most commonly performed laboratory tests in critical care, and accurate interpretation of ABG analysis is therefore an important clinical skill. ABG measurements enable rapid assessment of oxygenation and ventilation and all ICUs are recommended to have a blood gas analyser as a minimum standard.41
Blood for ABG analysis is sampled by arterial puncture, or more commonly in critically ill patients, from an arterial catheter usually sited in the radial or femoral artery. Both techniques are invasive but only allow for intermittent analysis. The advantage of the arterial catheter is that it facilitates ABG sampling without repeated arterial punctures. Continuous blood gas monitoring is possible using fibreoptic sensor in-line with the intra-arterial line but this practice is yet to have wide application in Australasia due to cost and accuracy concerns.44,45
Sampling Technique
A correct sampling technique is essential for accurate results. Approximately 1 mL of arterial blood is collected anaerobically and aseptically using a premixed syringe containing dry heparin. If drawing the sample from an intra-arterial line, a portion of blood is discarded to prevent dilution and contamination of the sample by saline present in the flush line. The discard amount is twice the dead space volume to ensure clinically accurate ABG and electrolyte measurement and to prevent unnecessary blood loss46 (dead space is defined as the priming volume from sampling port to catheter tip; this differs depending on the arterial line set up that is used). Arterial blood exerts its own pressure, which is sufficient to fill the syringe to the required level; active negative pressure is to be avoided, as this causes frothing. Any excess air will also cause inaccurate readings and is expelled before the syringe is capped with a hub, which prevents further contamination with air. The sample is analysed within 10 minutes if not packed in ice, or within 60 minutes if iced; delays cause degradation of the sample. Degradation also occurs if the sample is shaken; therefore gently roll the syringe/collection tube between your fingers to mix the sample with the heparin and prevent clotting.47
Arterial Blood Gas Analysis
ABG analysis includes the measurement of the partial pressure of oxygen in arterial blood (PaO2), the partial pressure of carbon dioxide in arterial blood (PaCO2), the hydrogen ion concentration of the blood (pH), and the chemical buffer, bicarbonate (HCO3−). Normal values for ABG parameters are listed in Table 13.4. Use a systematic approach when interpreting the results of ABG analysis (see Table 13.5).
| Blood gas measurements | Description | Normal value |
|---|---|---|
| Temperature (T) | Patient’s body temperature. Analyser defaults to 37°C if not entered. | 37°C |
| Haemoglobin (Hb) | Samples should be fully mixed so should be constantly agitated until analysed. | Females: 115–165 g/L Males: 130–180 g/L |
| Acid–Base status (pH) | Overall acidity or alkalinity of blood. | 7.36–7.44 (36–44 mmol/L) |
| Carbon dioxide (CO2) | Partial pressure of arterial CO2. A potential acid. | 35–45 mmHg (4.7–6 kPa) |
| Oxygen (O2) | Partial pressure of O2. Varies with age. | 80–100 mmHg (10.7–13.3 kPa) |
| Bicarbonate (HCO3−) | Standardised HCO3− (actual HCO3− minus the HCO3− produced by respiratory dysfunction) estimates true metabolic function. An alkali or base. | 22–32 mmol/L |
| Base Excess (BE) | Measures acid–base balance. The number of molecules of acid or base required to return 1 litre of blood to the normal pH (7.4). | −3 to +3 mmol/L |
| Oxygen saturation (SaO2) | Haemoglobin saturation by oxygen in arterial blood | 94.5–98.2% |
TABLE 13.5 Steps for arterial blood gas interpretation
| Step | Interpretation |
|---|---|
| 1 | Assess oxygenation. PaO2 < 60 mmHg indicates hypoxaemia. |
| 2 | Assess the pH level. <7.36 indicates acidosis, >7.44 indicates alkalosis. |
| 3 | Assess PaCO2 level. <35 mmHg indicates respiratory acidosis; >45 mmHg indicates respiratory alkalosis. |
| 4 | Assess HCO3− level. <22 indicates metabolic acidosis; >32 indicates metabolic alkalosis. |
| 5 | Assess pH, CO2 and HCO3−. Is there an acid–base disturbance and is it fully compensated, partially compensated or uncompensated? |
| 6 | Assess other ABG results. Are they within normal limits for the patient? |
When assessing PaO2, hypoxaemia (<60 mmHg) will be the most common abnormality, and supplemental oxygen will be required to maintain adequate tissue oxygenation. Hyperoxia rarely occurs unless a patient is receiving supplemental oxygen therapy. Oxygen can be toxic to cells if delivered at high concentrations for a prolonged period.48 The pH level is assessed to determine if it falls on the acidic or alkaline side of 7.4.
On the pH scale of 1–14 (1 = the strongest acid, 14 = the strongest alkali), a pH of 7.4 is the middle of the normal range. pH measures the acid–base balance of the blood sample, where Hydrogen (H+) ions are the acid and HCO3− is the base or buffer. The body’s acid–base balance is affected by both the respiratory and metabolic systems.48 Acidaemia is present with a pH of <7.36; alkalaemia is present with a pH of >7.44.
PaCO2 is an indicator of the effectiveness of ventilation in removing CO2. CO2 is a potential acid as it combines with H2O in the blood to form carbonic acid (H2CO3). Retention of CO2 (through hypoventilation) leads to increased H+ resulting in a lower pH, and similarly a loss of CO2 (through hyperventilation) results in a higher pH.49 A PaCO2 of >45 mmHg (6 kPa) indicates alveolar hypoventilation, due to chronic obstructive pulmonary disease, asthma, pulmonary oedema, airway obstruction, over sedation, narcosis, drug overdose, pain, neurological deficit or permissive hypercapnia in mechanically ventilated patients.50 Conversely, a PaCO2 of <35 mmHg (4.7 kPa) reflects alveolar hyperventilation, and can be due to hypoxia, pain, anxiety, pregnancy, permissive hypocapnia in mechanically ventilated patients or as a compensatory mechanism for metabolic acidosis.50
Bicarbonate (HCO3−) is regulated by the renal system and indicates metabolic functioning. A HCO3− of < 22 mmol/L can be caused by renal failure, ketoacidosis, lactic acidosis, diarrhoea, or cardiac arrest. A HCO3− of >32 can be caused by severe vomiting, continuous nasogastric suction, diuretics, corticosteroids, or excessive citrate administration from stored blood or renal replacement therapy.50 Base excess is an additional parameter measured as part of the ABG report and it reflects the excess (or deficit) of base to acid in the blood. A positive figure indicates a base excess (more base than acid; i.e. alkalosis if >+3); a negative figure indicates a base deficit (more acid than base i.e. acidosis if >−3). If the base excess is +2 mmol/L, then removal of 2 mmol of base per litre of blood is required to return the pH to 7.4. If the base excess is −2 mmol/L (i.e. a base deficit), then 2 mmol of base per litre of blood needs to be added to have a pH of 7.4. Understanding this concept is useful as it can determine how much treatment is necessary to restore a patient’s pH to normal.49,51
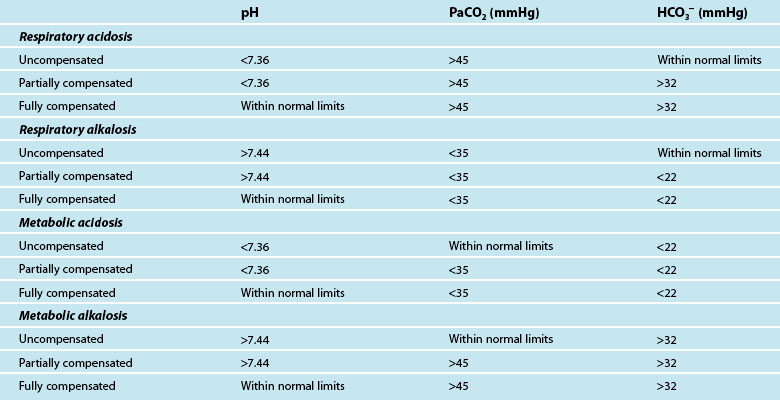
The final step of interpretation is to examine the pH, CO2 and HCO3− levels collectively to determine if the patient has fully compensated or partially compensated the primary dysfunction, or is in an uncompensated state. With the respiratory system regulating the acid (CO2) and the metabolic system regulating the base (HCO3−), restoration of normal acid–base balance and homeostasis is possible.49 The ability of the body to achieve this determines whether the imbalance is fully compensated (pH returned to normal), partially compensated (pH outside of normal limits) or uncompensated. To assess compensation, pH, CO2 and HCO3− are examined in the context of a patient’s clinical presentation:
• in a fully compensated state, the pH is returned to within normal limits, but the other two parameters will be outside normal limits as the body has successfully manipulated CO2 and HCO3− levels to restore pH
• in a partially compensated state, the pH is not within normal limits, and the other parameters will also be outside of normal limits but not enough to bring pH back to within normal limits
• in a non-compensated state, the pH will be outside normal limits, and the primary disruption (either CO2 or HCO3−) will also be outside normal limits while the remaining parameter has not compensated for this derangement and has stayed within normal limits.
It can be difficult to differentiate the patient’s primary problem from their compensatory response. As a quick guide, if the CO2 is moving in the opposite direction to pH, then the primary disruption is respiratory; if the HCO3− is moving in the same direction as pH, the disruption is metabolic.52 Table 13.6 provides a guide to ABG findings for each acid–base disorder. Other parameters measured on the ABG sample, such as lactate, electrolytes, haemoglobin and glucose, are also considered in determining patient status.
Oxygen Tension Derived Indices
The alveolar-arterial gradient is a marker of intrapulmonary shunting (i.e. blood flowing past collapsed areas of alveoli not involved in gas exchange). The index is calculated as PAO2 − PaO2 (PAO2 is the partial pressure of oxygen in the alveoli). PAO2 is determined by a complex equation, the alveolar gas equation. PAO2 and PaO2 are equal when perfusion and ventilation are perfectly matched. The gradient increases with age but a value of 5–15 is normal up until approximately middle age. Despite questions about its clinical usefulness, particularly in the critically ill,53 it is used in clinical practice as a trending tool to track intrapulmonary shunting. Simply put, the larger the gradient between PAO2 and PaO2, the larger the degree of intrapulmonary shunting.54
The PaO2/FiO2 ratio was introduced as a simpler way of estimating pulmonary shunting, even though it does not formally measure alveolar partial pressure. It remains widely used to define ALI or ARDS. A PaO2/FiO2 ratio of <300 indicates ALI and a ratio of <200 indicates ARDS. For example, for a patient receiving an FiO2 of 0.65 with a PaO2 of 90 mmHg (12 kPa), their PaO2/FiO2 ratio is 138.5, indicating an ARDS state.55
Blood Tests
Investigation of haematology and biochemistry values for a patient with respiratory dysfunction can aid their overall treatment. Full blood count (FBC), including a leukocyte differential count, can track a patient’s white cell count (WCC) if they have a confirmed or suspected infective process. When infections are severe, the FBC will show a dramatic rise in the number of immature neutrophils. Blood cultures can also be drawn to assist in diagnosis of bacterial or yeast infections and isolation of the causative organism. Viral studies may be conducted to aid diagnosis for respiratory infections of unknown origin. If the patient is suspected of having a pulmonary embolism, a D-dimer test can determine the presence of a thrombus. Urea and electrolytes will also be routinely measured to monitor a patient’s renal function and acid–base status.56
Sputum, Tracheal Aspirates and Nasopharyngeal Aspirates
Colour, consistency and volume of sputum provides useful information in determining changes in a patient’s respiratory status and progress. Regular cultures of tracheal sputum facilitates tracking of colonisation by opportunistic organisms, or the identification of the cause of an acute chest infection or sepsis. Many ICUs have routine surveillance monitoring (weekly or twice-weekly) of tracheal aspirates in long-term mechanically-ventilated patients. In spontaneously breathing patients, sputum specimens can be provided into a sterile specimen receptacle. These specimens are best collected early in the morning and assisting the patient to clean their teeth prior to sample collection prevents secondary contamination. In an intubated patient, a sputum sample is collected by suctioning the artificial airway using a sputum trap between the suction catheter and suction tubing. Maintain a sterile technique so that the specimen is not contaminated.57
If obtaining an adequate sputum specimen in non-intubated patients is difficult, there is evidence that administration of nebulised saline (isotonic or hypertonic) can assist in producing a sample.58 There is no evidence to support this for mechanically ventilated patients, but anecdotally nebulised normal saline may assist in moistening the airways and thinning secretions to facilitate sputum production. Physiotherapy is often useful in producing a sputum sample,59,60 as manual hyperinflation and head downtilt during the physiotherapy session has increased sputum production.61,62
Instilling normal saline in an endotracheal tube (ETT) to facilitate clearance of tenacious sputum and obtain a tracheal aspirate remains a controversial issue. There is no evidence that instillation facilitates secretion clearance, while there is some evidence that it is more uncomfortable for a patient and increases the risk of contamination of the lower airway with bacteria. The practice is therefore not recommended.63
Nasopharyngeal aspirates (NPA) or nasopharyngeal swabs (NPS) may be necessary to diagnose viral respiratory infections. The NPA is collected by inserting a fine sterile suction catheter (8 or 10 F), attached to a sputum trap and suction, through the nare and back to the nasopharynx. Suction is applied while withdrawing the catheter slowly using a rotating motion. Flush the catheter through to the sputum trap with sterile normal saline or transport medium if available. A NPS is collected by inserting a specially designed swab to the back of the nasopharynx and rotating for 5–10 seconds, withdrawing slowly then placing the swab into the plastic vial containing transport medium.64
Diagnostic Procedures
Medical Imaging
Chest X-ray
Chest X-ray (CXR) is a common diagnostic tool used for respiratory examination of critically ill patients. Chest radiography allows basic information regarding abnormalities in the chest to be obtained relatively quickly. The image provides information about lung fields and other thoracic structures as well as the placement of various invasive lines and tubes.65,66 In the critically ill ventilated patient, serial chest X-rays also enable sequential assessment of lung status in relation to therapy.66
In-unit X-rays of patients using portable equipment are inferior to those taken using a fixed camera in the radiology department. Patient preparation is therefore important to optimise the quality of the film. Patients should ideally be positioned sitting or semi-erect for this procedure; images using a supine position are less effective at revealing gravity-related abnormalities such as haemothorax. Lateral view chest X-rays can also be taken to view lesions in the thorax. Film plate location in relation to the patient’s thorax determine the view; posterior-anterior (PA) has the plate against the patient’s anterior thorax (see Figure 13.16) while the anterior-posterior (AP) view has the plate against the patient’s back surface. For mobile X-rays, the AP view is used. Images from the AP view magnify thoracic structures and can be less distinct or even distorted, so interpret findings with caution, particularly if comparing them with previous PA images.67
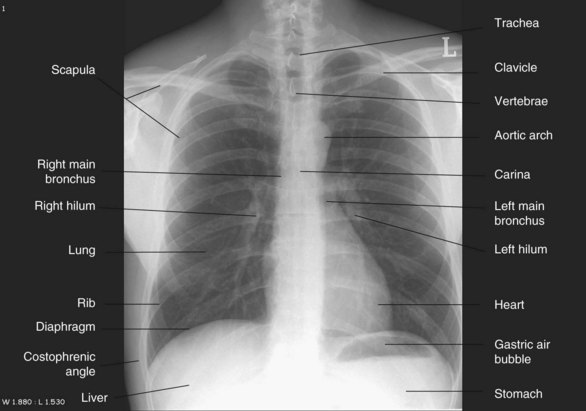
FIGURE 13.16 Chest X-ray, PA view.
Courtesy the University of Auckland Faculty of Medical and Health Sciences.
Interpretation of the CXR follows a systematic process designed to identify common pathophysiological processes and location of lines and other items. Table 13.7 provides a comprehensive guideline for viewing and interpreting a CXR.
• Cardiac silhouette should be not more than 50% of the diameter of the thorax, with  of heart shadow to the right of the vertebrae and
  of shadow to the left of the vertebrae; this positioning helps to rule out a tension pneumothorax. It should be noted that, post-cardiac surgery, if the mediastinum is left open the heart may appear wider than this; also in AP films this may be the case due to the plate being further away from the heart.
• Identify distal end of endotracheal tube and ensure above the carina (i.e. not in the right main bronchus).
• Trace nasogastric tube along length and ensure tip is in stomach, or below stomach if nasoenteric tube.
• Check position of intra-aortic balloon pump and ensure it is in the descending thoracic aorta.
• Trace all central catheters and ensure distal tip in correct location.
• Identify other lines (e.g. intercostal catheters, pacing wires) and note location.
PA = posterior-anterior; AP = anterior-posterior.
Common abnormalities that can be detected by CXR include:
• Lobar collapse or atelectasis: The image reveals all or some of the following features: loss of lung volume, displacement of fissures and vascular markings, and diaphragmatic elevation on the affected side.
• Pneumothorax: Check for lack of pulmonary vascular markings on the affected side so the lung field appears black; there will be mediastinal and possibly tracheal shift away from the affected side in a tension pneumothorax.
• Pleural effusion: Visualised in the dependent areas of the pleural spaces; costophrenic angles are blunted by fluid and there may be a shift of the mediastinum away from a large effusion; best visualised with the patient upright, and will only be evident on an AP image with 200–400 mL of fluid in the pleural space.
• Pulmonary oedema: Lung fields, particularly central and perihilar areas, appear white; Kerley B lines (small horizontal lines no more than 2 cm long) may be present in the lung periphery near the costophrenic angles.
• Pulmonary embolism: Although not the optimal diagnostic tool, areas of infarction may be visualised although these can be mistaken for collapse or consolidation.
• Pneumoperitonium: Free air under the diaphragm elevates the diaphragm.66,68
Ultrasound
Ultrasound imaging (sonography) is a useful bedside diagnostic tool for a select group of critically ill patients69 and can add to the diagnostic information provided by chest X-rays and computerised tomography (CT) scanning. The technique uses high-frequency sound waves which when probed on the body, reflect and scatter. The advantages are no need for transport of a critically ill patient outside the ICU, and it is radiation-free. Ultrasound is most useful for patients with fluid in the pleural space (i.e. pleural effusion, haemothorax or empyema), as it provides more detailed diagnostic information than chest X-rays alone;70 it estimates the volume of fluid present, the exact location of the fluid, and provides a guide for aspirating a fluid-filled area or the placement of chest tubes.71
Computed Tomography
Computed tomography (CT) is a diagnostic investigation that provides greater specificity in chest anatomy and pathophysiology than a plain CXR, as it uses multiple beams in a circle around the body. These beams are directed to a specific area of the body and provide detailed, consecutive cross-sectional slices of the scanned regions. CT scans can be performed with or without intravenous contrast.72 Contrast improves diagnostic precision but is used with caution in patients with renal impairment; renal failure may preclude a patient from receiving contrast. CT scanning is useful in the detection and diagnosis of pulmonary, pleural and mediastinal disorders (e.g pleural effusion, empyema, haemothorax, atelectasis, pneumonia, ARDS).73 CT pulmonary angiography (CTPA) produces a detailed view of blood vessels and is therefore the most definitive method for diagnosing pulmonary embolism.74
A significant limitation of CT scanning is that the patient is transported away from the ICU. Transport usually requires at least two appropriately trained staff to accompany the patient and involves added risk to the critically ill patient. Detailed planning by the health care team (including imaging staff) includes ventilator support, monitoring requirements and maintenance of infusions during the scanning period. See Chapter 6 for discussion of in-hospital transfers, and Chapter 22 for inter-hospital transport. Portable CT scanners are available in some centres, but the image quality is inferior to fixed CT scanners.75
Magnetic Resonance Imaging
Magnetic resonance imaging (MRI) uses radiofrequency waves and a strong magnetic field rather than X-rays to provide clear and detailed pictures of internal organs and soft tissues.76 These high-contrast images of soft tissue are clearer than those generated by X-ray or CT scans. The strong magnetic field around the scanner means that ferromagnetic objects (metallic objects containing material that can be attracted by magnets, such as iron or steel) can become potentially fatal projectiles. MRI scans may therefore be unsuitable for patients with implanted pacemakers, defibrillators or neurostimulation devices; some types of intracranial aneurysm clips; and loose dental fillings. The magnetic force can either attract these items and dislodge them from the body or interfere with their functioning.76 The strong magnetic fields also have the potential to interfere with ventilators, infusion pumps and monitoring equipment. Similar to CT scans, an MRI requires transport of the critically ill patient. The benefits of the diagnostic data obtained from the MRI is balanced against any potential risk to the patient.77
Ventilation/Perfusion Scan
The ventilation/perfusion (V/Q) scan is indicated when a mismatch of lung ventilation and perfusion is suspected; the most common indication is for pulmonary embolism. The ventilation scan is performed with the patient inhaling a radioisotopic gas to demonstrate ventilation of the lung, while the perfusion scan is performed using an intravenous radioisotope that reveals distribution of blood flow in the blood vessels of the lungs.78 These two scans are then compared, with mismatches in perfusion and ventilation identified. In larger centres, the V/Q scan has been superseded by the use of CT pulmonary angiogram (CTPA) for detection of pulmonary embolism.
Bronchoscopy
Bronchoscopy is a bedside technique used for both diagnostic and therapeutic purposes. The bronchoscope can be either rigid or flexible; the most widely used type in critical care is the flexible fibreoptic bronchoscope. A flexible fibreoptic bronchoscope allows direct visualisation of respiratory mucosa and thorough examination of the upper airways and tracheobronchial tree. The scope is passed into the trachea via the oropharynx or nares. In mechanically-ventilated patients, the scope can be passed quickly and easily down the endotracheal (ETT) or tracheostomy tube (TT) allowing rapid access to the airways.79 Supplemental oxygen can be administered during the bronchoscopy in non-intubated patients and FiO2 can be increased in intubated patients. Accurate continuous monitoring during the procedure includes continuous pulse oximetry, electrocardiography, respiratory rate, heart rate and blood pressure. Equipment for advanced airway management, suctioning, cardiac defibrillation and advanced life support medications is immediately available.80 In intubated patients, one person is responsible for security of the airway as there is a risk that it may become displaced during the procedure.
Fiberoptic bronchoscopy is a relatively safe procedure, even in critically ill patients, when performed by an experienced operator. In mechanically ventilated patients, insertion of the bronchoscope into the artificial airway can lead to decreases in tidal and minute volumes resulting in decreased PaO2 and increased PaCO2.81 Serious complications such as bleeding, bronchospasm, arrhythmia, pneumothorax and pneumonia occur rarely.82 Patient preparation pre-procedure may include chest X-ray; haemoglobin and coagulation profile, particularly if a biopsy is to be performed; arterial blood gases as a baseline measurement; and fasting or have feeds ceased for 4–6 hours prior.
Diagnostic indications include further investigation of poor gas exchange; evaluation of haemoptysis; collection of specimens (e.g. bronchoalveolar lavage, bronchial washings, bronchial brushings, lung biopsy) to assist in diagnosis of infection, interstitial lung disease, rejection post-lung transplantation and malignancy; and diagnosis of airway injury due to burns, aspiration or chest trauma. Therapeutic indications include removal of mucous plugs; removal of foreign bodies; treatment of atelectasis; assistance during tracheostomy; airway dilatation and stenting for tracheobronchomalacia and tracheobronchial stenosis; and lung volume reduction for emphysema.79,83
Summary
• Critical care nurses are in a prime position at the beside to provide systematic and dynamic assessments of a patient’s respiratory status; this includes history-taking of past and present respiratory problems, and physical examination of the thorax and lungs using inspection, palpation and auscultation techniques.
• Monitoring a patient’s respiratory function includes pulse oximetry, and capnography for a patient with non-invasive or invasive mechanical ventilation; pulse oximetry provides non-invasive measurement of arterial oxygen saturation of haemoglobin, and is regarded as standard practice in ICU.
• Bedside and laboratory investigations add to available information regarding a patient’s respiratory status and assists in the diagnosis and treatment of a critically ill patient; this includes arterial blood gas analysis; blood testing; and sputum and tracheal aspirates. ABG is a commonly performed laboratory test, and ABG interpretation is an important clinical skill for critical care nurses.
• There are several diagnostic tools used for respiratory dysfunction in ICU; the chest X-ray is the most common. Interpretation of a CXR follows a systematic process designed to identify common pathophysiological processes and locate lines and other items. Bronchoscopy is a useful bedside diagnostic and therapeutic device. Computed tomography provides greater specificity than an X-ray. Ultrasound imaging is a useful diagnostic tool for patients with fluid in the pleural space. Magnetic resonance imaging and ventilation/perfusion scans are more sophisticated devices for patients when high diagnostic skills are needed.
Case study
• respiratory rate 36 breaths/min
• pulse oximetry 89% on 15 L/min via a non-rebreather oxygen mask
• use of accessory muscles and nasal flaring evident
• unable to speak in sentences and appears exhausted
• auscultation of lung sounds revealed coarse crackles and bronchial breathing in the left lower lung area
• chest X-ray demonstrated shadowing of the left lower lobe with associated loss of the costophrenic angle indicating pleural effusion
Research vignette
Critique
For analysis, data from the arterial blood sample SaO2 was considered the ‘gold standard’, and compared to the forehead and the finger sensor SpO2 values. Each patient was used as their own control for the five different measures: baseline, SRM at maximum PEEP, end of SRM, 30 and 60 minutes after SRM. A repeated measures T test was used to assess for systematic differences on each of the five measurement points. Bland-Altman analysis was used to illustrate differences between forehead or finger sensors and the gold standard SaO2. This analysis is an alternative to correlation coefficients which can be misleading, as correlation measures the strength of relation between two variables but not the agreement between them. Bland-Altman analysis is based on graphic techniques and simple calculations (see Further reading). This paper presents easily comprehensible figures demonstrating the differences between forehead and finger sensors, and arterial blood oxygen saturation.
Learning activities
1. When assessing a patient, what do the findings of accessory muscle use and nasal flaring indicate?
2. Describe what coarse crackles and bronchial breathing sound like and the pathophysiological mechanisms behind these added lung sounds.
3. Outline the correct sampling technique for drawing an arterial blood gas.
4. In relation to the case study, using Patricia’s first ICU arterial blood gas data as a guide, what are the key variables to note when interpreting arterial blood gases?
5. What indicates uncompensated respiratory acidosis in Patricia’s first ICU arterial blood gas?
6. What are the pathophysiological mechanisms behind Patricia’s hypoxia?
7. What monitoring is necessary when performing a bronchoscopy?
American Association for Respiratory Care. http://www.aarc.org/.
ARDS Network. http://www.ardsnet.org.
Asian Pacific Society of Respirology. http://www.apsresp.org/.
Australian & New Zealand Society of Respiratory Science. http://www.anzsrs.org.au/.
Australian Lung Foundation. http://www.lungnet.org.au/.
Become an expert in spirometry. http://www.spirxpert.com/.
Capnography. a comprehensive educational website. www.capnography.com.
Chest X-rays. http://www.learningradiology.com/.
Critical Care Medicine Tutorials. http://www.ccmtutorials.com.
European Respiratory Journal. http://erj.ersjournals.com/.
Lung Health Promotion Centre. The Alfred Hospital, Victoria. http://www.lunghealth.org.
Respiratory Care journal. http://www.rcjournal.com/.
Respiratory Research journal. http://respiratory-research.com/.
Thoracic Society of Australia and New Zealand. http://www.thoracic.org.au.
Thorax. An International journal of Respiratory Medicine. http://thorax.bmj.com/.
Bland JM, Altman DG. Statistical methods for assessing agreement between two methods of clinical measurement. Int J Nurs Studies. 2010;47(8):931–936.
Coggon JM. Arterial Blood Gas Analysis 1: understanding ABG reports. Nursing Times. 2008;104(18):28–29.
Coggon JM. Arterial Blood Gas Analysis 2: compensatory mechanisms. Nursing Times. 2008;104(19):24–25.
Moore T. Respiratory assessment in adults. Nurs Stand. 2007;21(49):48–56.
Siela D. Chest radiograph evaluation and interpretation. AACN Adv Crit Care. 2008;19(4):444–473.
Valdez-Lowe C, Ghareeb SA, Artinian NT. Pulse oximetry in adults. Am J Nurs. 2009;109(6):52–59.
Zwerneman K. End-tidal carbon dioxide monitoring: a VITAL sign worth watching. Crit Care Nurs Clin N Am. 2006;18(2):217–225.
1 Urden LD, Stacy KM, Lough ME. Critical care nursing: diagnosis and management, 6th edn. St. Louis: Mosby; 2010.
2 Martini FH, Timmons MJ, Tallitsch RB. Human anatomy, international edition, 5th edn. San Francisco: Pearson Benjamin Cummings; 2006.
3 Fox S. Human physiology, 9th edn. New York: McGraw Hill; 2006.
4 Marieb E, Hoehn K. Human anatomy and physiology, 8th edn. San Francisco: Pearson Benjamin Cummings; 2010.
5 Thompson J, McFarland G, Hirsch J, Tucker S. Mosby’s clinical nursing, 5th edn. St Louis: Mosby; 2002.
6 Tadie JM, Behm E, Lecuyer L, Benhmamed R, Hans S, Brasnu D, Diehl JL, Fagon JY, Guerot E. Post-intubation laryngeal injuries and extubation failure: a fiberoptic endoscopic study. Intensive Care Med. 2010;36(6):991–998.
7 West J. Respiratory physiology: the essentials, 8th edn. Philadelphia: Lippincott Williams & Wilkins; 2008.
8 Martini F, Nath J. Fundamentals of anatomy and physiology, 8th edn. San Francisco: Pearson Benjamin Cummins; 2009.
9 Widmaier E, Raff H, Strang K. Vander’s human physiology, international edition, 10th edn. New York: McGraw-Hill; 2006.
10 Enhorning G. Surfactant in airway disease. Chest. 2008;133(4):975–980.
11 West J. Pulmonary pathophysiology: the essentials, 6th edn. Philadelpia: Lippincott Williams & Wilkins; 2003.
12 Zankynthinos S, Koulouris N, Roussos C. Respiratory system mechanics and energetics. In: Mason R, Murray J, Broaddus V, Nadel J. Murray and Nadel’s textbook of respiratory medicine. 4th edn. Philadelphia: Elsevier Saunders; 2005:87–135.
13 Adams KL. Hemodynamic assessment: the physiologic basis for turning data into clinical information. AACN Clin Issues. 2004;15(4):534–546.
14 Morton P, Rempher K. Patient assessment respiratory system. Morton P, Fontaine D. Critical care nursing: a holistic approach, 9th edn, Philadelphia: Lippincott Williams & Wilkins, 2009.
15 Schoene R, Swenson E. High altitude. In: Mason R, Murray J, Broaddus C, Nadel J. Murray and Nadel’s textbook of respiratory medicine. 4th edn. Philadelphia: Elsevier Saunders; 2005:1837–1868.
16 Vincent JL, Akca S, De Mendonca A, Haji-Michael P, Sprung C, et al. The epidemiology of acute respiratory failure in critically ill patients. Chest. 2002;121(5):1602–1609.
17 Pierson D, Hill N. Acute ventilatory failure. In: Mason R, Murray J, Broaddus C, Nadel J. Murray and Nadel’s textbook of respiratory medicine. 4th edn. Philadelphia: Elsevier Saunders; 2005:2379–2398.
18 Baumgartner L. Acute respiratory failure and acute lung injury. In: Carlson K, ed. Advanced critical care nursing. St Louis: Saunders Elsevier; 2009:447–468.
19 West J. Pulmonary physiology and pathophysiology: an integrated, case-based approach, 2nd edn. Baltimore: Lippincott Williams & Wilkins; 2007.
20 Orfanos SE, Mavrommati I, Korovesi I, Roussos C. Pulmonary endothelium in acute lung injury: from basic science to the critically ill. Intensive Care Med. 2004;30(9):1702–1714.
21 Matthay M, Martin T. Pulmonary edema and acute lung injury. In: Mason R, Murray J, Broaddus C, Nadel J. Murray and Nadel’s textbook of respiratory medicine. 4th edn. Philadelphia: Elsevier Saunders; 2005:1502–1543.
22 Fitzgerald F, Murray J. History and physical examinations. In: Mason R, Murray J, Broaddus C, Nadel J. Murray and Nadel’s textbook of respiratory medicine. 4th edn. Philadelphia: Elsevier Saunders; 2005:493–510.
23 Shapiro S, Snider G, Rennard S. Chronic bronchitis and emphysema. In: Mason R, Murray J, Broaddus C, Nadel J. Murray and Nadel’s textbook of respiratory medicine. 4th edn. Philadelphia: Elsevier Saunders; 2005:1115–1168.
24 Wu CF, Feng NH, Chong IW, Wu KY, Lee CH, et al. Second-hand smoke and chronic bronchitis in Taiwanese women: a health-care based study. BMC Public Health. 2010;10:44.
25 Spira AM. Assessment of travellers who return home ill. Lancet. 2003;361(9367):1459–1469.
26 Scurr JH, Machin SJ, Bailey-King S, Mackie IJ, McDonald S, Smith PD. Frequency and prevention of symptomless deep-vein thrombosis in long-haul flights: a randomised trial. Lancet. 2001;357(9267):1485–1489.
27 Rushton L. Occupational causes of chronic obstructive pulmonary disease. Rev Environ Health. 2007;22(3):195–212.
28 Light R, Lee G. Pneumothorax, chylothorax, hemothorax, and fibrothorax. In: Mason R, Murray J, Broaddus V, Nadel J. Murray and Nadel’s textbook of respiratory medicine. 4th edn. Philadelphia: Elsevier Saunders; 2005:1961–1989.
29 Park D, Valliéres E. Pneumomediastinum and mediastinitis. In: Mason R, Murray J, Broaddus V, Nadel J. Murray and Nadel’s textbook of respiratory medicine. 4th edn. Philadelphia: Elsevier Saunders; 2005:2039–2069.
30 Hunter J, Rawlings-Anderson K. Respiratory assessment. Nurs Stand. 2008;22(41):41–43.
31 Pasterkamp H, Kraman SS, Wodicka GR. Respiratory sounds. Advances beyond the stethoscope. Am J Respir Crit Care Med. 1997;156:974–987.
32 Moore T. Respiratory assessment in adults. Nurs Stand. 2007;21(49):48–56.
33 Jubran A. Pulse oximetry. Intensive Care Med. 2004;30(11):2017–2020.
34 Clark AP, Giuliano K, Chen HM. Pulse oximetry revisited: “but his O(2) sat was normal!”. Clin Nurse Spec. 2006;20(6):268–272.
35 Callahan JM. Pulse oximetry in emergency medicine. Emerg Med Clin N Am. 2008;26(4):869–879.
36 Valdez-Lowe C, Ghareeb SA, Artinian NT. Pulse oximetry in adults. Am J Nurs. 2009;109(6):52–59.
37 Bickler PE, Feiner JR, Severinghaus JW. Effects of skin pigmentation on pulse oximeter accuracy at low saturation. Anesthesiology. 2005;102(4):715–719.
38 Bersten AD. Respiratory monitoring. In: Bersten AD, Soni N. Oh’s intensive care manual. 6th edn. Philadelphia: Butterworth Heinemann; 2009:439–450.
39 Dorland’s Medical Dictionary for Health Consumers. Saunders; 2007 [cited August 2010]. Available from http://medical-dictionary.thefreedictionary.com/capnogram
40 Zwerneman K. End-tidal carbon dioxide monitoring: a VITAL sign worth watching. Crit Care Nurs Clin N Am. 2006;18(2):217–225.
41 Joint Faculty of Intensive Care Medicine. Minimum Standards for Intensive Care Units [Review IC-1]. Joint Faculty of Intensive Care Medicine: Melbourne, 2010.
42 Joint Faculty of Intensive Care Medicine. Minimum standards for transport of critically ill patients. Melbourne: Joint Faculty of Intensive Care Medicine; 2010.
43 Australian and New Zealand College of Anaesthetists. Monitoring during anaesthesia [Review PS18]. Australian and New Zealand College of Anaesthetists: Melbourne, 2008.
44 Umegaki T, Kikuchi O, Hirota K, Adachi T. Comparison of continuous intraarterial blood gas analysis and transcutaneous monitoring to measure oxygen partial pressure during one-lung ventilation. J Anesth. 2007;21(1):110–111.
45 Venkatesh B. Continuous intra-arterial blood gas monitoring. Crit Care Resusc. 1999;1(2):150.
46 Rickard CM, Couchman BA, Schmidt SJ, Dank A, Purdie DM. A discard volume of twice the deadspace ensures clinically accurate arterial blood gases and electrolytes and prevents unnecessary blood loss. Crit Care Med. 2003;31(6):1654–1658.
47 AARC. AARC Clinical Practice Guideline: Sampling for arterial blood gas analysis. Respiratory Care. 1992;37(8):913–917.
48 Woodrow P. Arterial blood gas analysis. Nurs Stand. 2004;18(21):45–52. quiz 4–5
49 Simpson H. Interpretation of arterial blood gases: a clinical guide for nurses. Br J Nurs. 2004;13(9):522–528.
50 Morgan TJ. Acid–base balance and disorders. In: Bersten AD, Soni N. Oh’s intensive care manual. 6th edn. Philadelphia: Butterworth Heinemann; 2009:949–961.
51 Coggon JM. Arterial Blood Gas Analysis 1: understanding ABG reports. Nursing Times. 2008;104(18):28–29.
52 Coggon JM. Arterial Blood Gas Analysis 2: Compensatory mechanisms. Nursing Times. 2008;104(19):24–25.
53 Coetzee A, Swanevelder J, van der Spuy G, Jansen J. Gas exchange indices – how valid are they? S Afr Med J. 1995;85(11):1227–1232.
54 Johnson KL. Diagnostic measures to evaluate oxygenation in critically ill adults: implications and limitations. AACN Clin Issues. 2004;15(4):506–524.
55 Morgan TJ, Venkatesh B. Monitoring oxygenation. In: Bersten AD, Soni N. Oh’s intensive care manual. 6th edn. Philadelphia: Butterworth Heinemann; 2009:133–144.
56 The Royal College of Pathologists of Australia. RCPA manual, 6th edn. Sydney: The Royal College of Pathologists of Australia; 2009. [cited July 2010]. Available from http://rcpamanual.edu.au/index.php?option=com_pttests&task=show_test&id=268&Itemid=77&msg=425
57 The Joanna Briggs Institute. Evidence based recommended practices: Sputum specimen. Adelaide: The Joanna Briggs Institute; 2010.
58 Khan SY, O’Driscoll BR. Is nebulized saline a placebo in COPD? BMC Pulm Med. 2004 Sep;4:9.
59 McCool FD, Rosen MJ. Nonpharmacologic airway clearance therapies: ACCP evidence-based clinical practice guidelines. Ches. 2006;129(1 Suppl):S250–S259.
60 Hodgson C, Denehy L, Ntoumenopoulos G, Santamaria J, Carroll S. An investigation of the early effects of manual lung hyperinflation in critically ill patients. Anaesth Intensive Care. 2000;28(3):255–261.
61 Berney S, Denehy L. A comparison of the effects of manual and ventilator hyperinflation on static lung compliance and sputum production in intubated and ventilated intensive care patients. Physiother Res Int. 2002;7(2):100–108.
62 Berney S, Denehy L, Pretto J. Head-down tilt and manual hyperinflation enhance sputum clearance in patients who are intubated and ventilated. Aust J Physiother. 2004;50(1):9–14.
63 Pedersen CM, Rosendahl-Nielsen M, Hjermind J, Egerod I. Endotracheal suctioning of the adult intubated patient–what is the evidence? Intensive Crit Care Nurs. 2009;25(1):21–30.
64 World Health Organization. WHO guidelines for the collection of human specimens for laboratory diagnosis of avian influenza infection. http://www.who.int/csr/disease/avian_influenza/guidelines/humanspecimens/en/, 2005. [Cited July 2010]. Available from
65 Lareau C, Wootton J. The “frequently” normal chest x-ray. Can J Rural Med. 2004;9(3):183–186.
66 Siela D. Chest radiograph evaluation and interpretation. AACN Adv Crit Care. 2008;19(4):444–473. quiz 74–5.
67 Siela D. Using chest radiography in the intensive care unit. Crit Care Nurse. 2002;22(4):18–27.
68 Tarrac SE. A systematic approach to chest x-ray interpretation in the perianesthesia unit. J Perianesth Nurs. 2009;24(1):41–47.
69 Padley SPG. Imaging the chest. In: Bersten AD, Soni N. Oh’s intensive care manual. 6th edn. Philadelphia: Butterworth Heinemann; 2009:451–470.
70 Chen HJ, Yu YH, Tu CY, Chen CH, Hsia TC, et al. Ultrasound in peripheral pulmonary air-fluid lesions. Color Doppler imaging as an aid in differentiating empyema and abscess. Chest. 2009;135(6):1426–1432.
71 Beckh S, Bolcskei PL, Lessnau KD. Real-time chest ultrasonography: a comprehensive review for the pulmonologist. Chest. 2002;122(5):1759–1773.
72 Revell MA, Pugh M, Smith TL, McInnis LA. Radiographic studies in the critical care environment. Crit Care Nurs Clin N Am. 2010;22(1):41–50.
73 Hill JR, Horner PE, Primack SL. ICU imaging. Clin Chest Med. 2008;29(1):59–76.
74 Davies AR, Pilcher DV. Pulmonary embolism. In: Bersten AD, Soni N. Oh’s intensive care manual. 6th edn. Philadelphia: Butterworth Heinemann; 2009:387–398.
75 Trotman-Dickenson B. Radiology in the intensive care unit (part 2). J Intensive Care Med. 2003;18(5):239–252.
76 Carr MW, Grey ML. Magnetic resonance imaging. Am J Nurs. 2002;102(12):26–33.
77 Everest E, Munford B. Transport of the critically ill. In: Bersten AD, Soni N. Oh’s intensive care manual. 6th edn. Philadelphia: Butterworth Heinemann; 2009:31–42.
78 Kumar AM, Parker JA. Ventilation/perfusion scintigraphy. Emerg Med Clin N Am. 2001;19(4):957–973.
79 Turner JS, Willcox PA, Hayhurst MD, Potgieter PD. Fiberoptic bronchoscopy in the intensive care unit–a prospective study of 147 procedures in 107 patients. Crit Care Med. 1994;22(2):259–264.
80 Taylor DL. Bronchoscopy: What critical care nurses need to know. Crit Care Nurs Clin N Am. 2010;22(1):33–40.
81 Ricou B, Grandin S, Nicod L, Thorens JB, Suter PM. Adult and paediatric size bronchoscopes for bronchoalveolar lavage in mechanically ventilated patients: yield and side effects. Thorax. 1995;50(3):290–293.
82 Nseir S. Could fiberoptic bronchoscopy and CT lung scan differentiate ventilator-associated tracheobronchitis from ventilator-associated pneumonia? Chest. 2009;136(4):1187–1188.
83 Murgu SD, Pecson J, Colt HG. Bronchoscopy during noninvasive ventilation: indications and technique. Respir Care. 2010;55(5):595–600.
84 Pierce LNB. Management of the mechanically ventilated patient, 2nd edn. Philadelphia: Saunders; 2006.
85 Seely R, Stephens T, Tate P. Anatomy and physiology, 7th edn. Boston: McGraw Hill; 2006.
86 Urden L, Stacy KL, Lough ME. Thelan’s critical care nursing: diagnosis and management, 5th edn, St Louis: Mosby/Elsevier, 2006.