CHAPTER 106 Renal Artery Hypertension
The classic studies by Goldblatt in the 1930s have shown that renal artery stenosis (RAS) is the underlying cause of renovascular hypertension (RVH).1 Although only 5% of cases of hypertension can be attributed to RAS, it is a potentially curable cause of hypertension. In most cases, RVH is caused by atherosclerotic RAS or fibromuscular dysplasia (FMD).2 Atherosclerosis accounts for 70% to 90% of cases of RAS and usually involves the ostium and proximal third of the main renal artery.2,3 Fibromuscular dysplasia (FMD) frequently involves the distal two thirds of the renal artery and its branches. It is most often characterized by aneurysmal dilations interspersed with localized narrowings presenting as a so-called string of beads or string-of-pearls appearance on angiography.4
Intra-arterial digital subtraction angiography (IA-DSA) is traditionally regarded as the definitive test to diagnose the presence of RAS. However, both the invasive nature of IA-DSA and the difficulty in assessing the pathophysiologic significance of stenotic lesions have encouraged the search for widely available noninvasive or minimally invasive diagnostic tests. In addition, IA-DSA is not a perfect test for the detection of RAS because it is subject to substantial interobserver variation.5
PREVALENCE AND EPIDEMIOLOGY
Atherosclerotic Renal Artery Disease
The prevalence of RAS in the general population is low. Among patients diagnosed with hypertension, RAS is present in 1% to 6%.6 On the other hand, atherosclerotic RAS is a common and progressive disease in patients with preexisting manifestations of atherosclerosis or clinical clues suggestive of RAS (see later, “Imaging Indications and Algorithm”). In selected cohorts of patients, such as those undergoing coronary or peripheral angiography, the prevalence of atherosclerotic RAS may increase to more than 20%. Among patients with atherosclerotic RAS, progressive stenosis has been reported in 51% of renal arteries 5 years after diagnosis (including 18% of initially normal vessels). Only 3% to 16% of renal arteries became totally occluded and renal atrophy of more than 60% developed in 21% of patients with RAS.2
Fibromuscular Dysplasia
FMD is responsible for 10% to 30% of cases of RAS.2–4 In one of the largest studies on imaging of RAS, the Dutch Renal Artery Diagnostic Study in Systolic Hypertension (RADISH),7 the prevalence of FMD, as shown by IA-DSA, was 27 of 356 patients (7.6%), all of whom were referred for imaging of the renal arteries because of therapy-resistant hypertension and/or clinical clues suggestive of RAS, including a baseline blood pressure higher than 95 mm Hg. In this study, FMD comprised 38% of all cases of RAS.
ETIOLOGY AND PATHOPHYSIOLOGY
The relationships between renal artery stenosis, hypertension, and renal excretory disfunction are not straightforward but are complex. Renal artery stenosis may occur as an isolated finding or in combination with hypertension, renal insufficiency, or both. The underlying pathophysiologic mechanisms are incompletely elucidated. Current understanding2,8 is that a decrease in renal perfusion pressure activates the renin-angiotensin system, which leads to the release of renin and the production of angiotensin II. This, in turn, has a direct effect on sodium excretion, sympathetic nerve activity, intrarenal prostaglandin concentrations, and nitric oxide production. When all these factors are present, the end result is renovascular hypertension. When hypertension is sustained, plasma renin levels may decrease, partially explaining the limitations of renin measurements for identifying patients with renovascular hypertension; this phenomenon is referred to as reverse tachyphylaxis.
MANIFESTATIONS OF DISEASE
Clinical Presentation
In addition to hypertension, patients may present with ischemic nephropathy. Ischemic nephropathy is defined as an obstruction of renal blood flow that leads to ischemia and excretory dysfunction.9 The pathophysiology of ischemic nephropathy is not fully understood but it is present when the serum creatinine level is elevated because of loss of renal mass as a consequence of long-standing hypertension. In general, loss of more than 50% of renal mass is usually associated with elevated creatinine levels. It is estimated that ischemic nephropathy is present in up to 24% of patients with unexplained chronic or progressive renal failure.
Imaging Indications and Algorithm
The rational use of noninvasive imaging techniques to detect RAS is important to maximize the diagnostic performance of the test. It is well known in epidemiology that positive and negative predictive values depend on the prevalence of disease. A general rule of thumb is that diagnostic tests perform better when the prevalence of disease is higher. Therefore, clinical clues are used to increase the a priori chances of a patient having RAS (Fig. 106-1). Clinical clues suggestive of RAS include the following: are the presence of diastolic blood pressure of 95 mm Hg or higher; an epigastric, subcostal, or flank bruit; sudden, accelerated, or malignant hypertension; unilateral small kidney; hypertension in children or young adults (prior to age 35) or adults older than 55 years; hypertension and unexplained impairment of renal function; sudden worsening of renal function in a patient with known hypertension; hypertension refractory to three or more appropriate antihypertensive drugs; impairment of renal function in response to angiotensin-converting enzyme inhibitor; and the presence of extensive occlusive disease in the coronary, cerebral, and/or peripheral circulation.3 Using these clinical clues, the prior probability of RAS can be increased to approximately 20% or higher.7,10
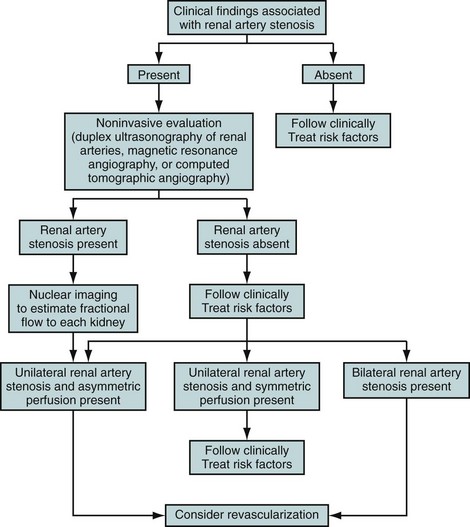
 FIGURE 106-1
Imaging Techniques and Findings
Ultrasound
Ultrasonographic examination of the renal arteries is entirely noninvasive because it does not require injection of contrast medium. In contrast to CE-MRA and MDCTA, however, it does require fasting for 8 hours prior to the examination.11
RAS can be detected by color DUS using peak systolic velocity in a stenosis or by poststenotic flow phenomena. Most researchers have used 180 to 200 cm/sec at the point of maximum stenosis as the cutoff point to establish 50% or higher RAS12 (Fig. 106-2). However, because of obesity, excessive bowel gas, or inability of the patient to sustain a breath-hold, about 10% to 20% of the examinations are unsuccessful. In addition, a study by Nchimi and colleagues13 has demonstrated that the accuracy of DUS for the detection of accessory renal arteries is still low. An indirect approach to assessing the severity of RAS is by measuring acceleration in intrarenal arteries distal to a stenosis and the presence of a tardus-parvus waveform. The tardus-parvus phenomenon is used to describe a change in the Doppler blood flow velocity waveform that may be found downstream from significant arterial stenoses. Tardus refers to delayed or prolonged early systolic acceleration (more than 0.07 second14), and parvus refers to diminished amplitude and rounding of the systolic peak.15 By combining direct and indirect measurements, the diagnostic yield may be increased.
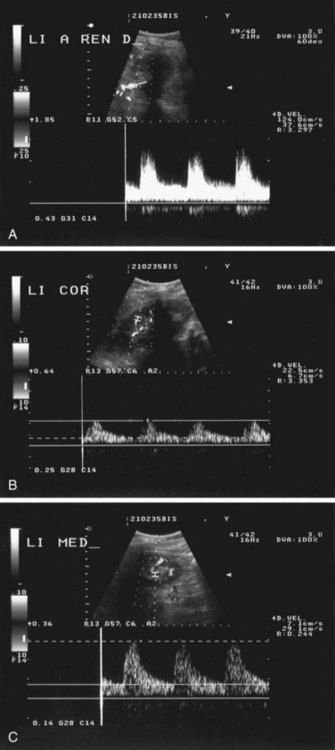
 FIGURE 106-2
Velocities are measured by obtaining Doppler signals from segmental arteries, typically in the upper, middle, and lower portions of each kidney (Fig. 106-3). When measuring the RI, it is important to keep in mind that pulse rates below 50 or above 70 beats/min, or measuring during inspiration or a Valsalva maneuver, may lead to less accurate measurements. Radermacher and associates16 have shown that in patients with 50% or greater stenosis in at least one renal artery, RI values above 0.80 are highly sensitive and specific to identify patients in whom angioplasty or surgery will not improve renal function, blood pressure, or kidney survival. However, a potential source of bias in this study was that only in patients in which ultrasound detected 50% or greater RAS was therapy considered. In addition, it is not known whether elevated RI values alone are predictive of therapeutic failure. The same group showed that an RI value above 0.80 measured at least 3 months after transplantation is associated with poor subsequent allograft performance and death.17
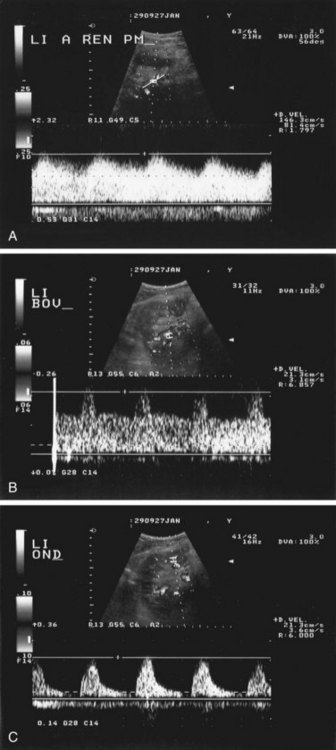
 FIGURE 106-3
The diagnostic accuracy of color DUS is moderate to high, depending primarily on the expertise of the vascular laboratory. Reported sensitivities and specificities are generally in the 80% to 90% range. In a meta-analysis comparing different noninvasive diagnostic tests for RAS, the accuracy of ultrasonography for the detection of RAS was shown to be significantly lower than that of CE-MRA and MDCTA.18 A well-known drawback of ultrasonography is the large interobserver variation, although in expert laboratories with dedicated ultrasonographers, this may not be a prohibitive problem.19 Intravenous microbubble contrast agents may improve diagnostic accuracy and success rates.20 DUS may become an interesting alternative to CTA and MRA because of concerns about the effects of administration of iodinated and MR contrast media.
Computed Tomography
Over the past decade,multidetector CT (MDCT) of the vascular system has become firmly integrated into clinical routine. With the recent introduction of MDCT scanners, with which up to 320 slices can be acquired in parallel, CTA has evolved even further. MDCT systems are equipped with two or more parallel detector arrays and always use a synchronously rotating tube and detector array.21,22 To provide sufficient vessel to background contrast, up to 150 mL of 300 mg I/mL or up to 85 mL of 400 mg I/mL nonionic contrast medium is needed. Injection speeds range from 2 to 6 mL/sec. Faster acquisitions require less total contrast medium.23
The need to acquire data during breath-hold and careful, individualized synchronization of contrast injection with acquisition are technical aspects of CTA that are similar to those of CE-MRA (see later, “Magnetic Resonance Imaging”). With the fastest CT scanners, timing of data acquisition becomes even more critical because the imaging time becomes substantially shorter, and the contrast bolus may be missed if mistimed.23 Currently, the spatial resolution of CTA is superior to that of CE-MRA. The typical resolution used for renal artery imaging when using multidetector row systems is 0.6 × 0.6 × 1.0 mm3 (left-right direction × anteroposterior direction × craniocaudal/slice direction). With increasing numbers of detector rows, resolution in the slice direction can be decreased even further.
Because CT uses ionizing radiation, there are concerns about radiation exposure, especially in younger patients, who have a relatively higher prevalence of FMD. In addition, CTA requires the injection of nephrotoxic and potentially allergenic contrast media. Cochran and coworkers24 analyzed adverse events in 90,473 administrations of iodinated contrast media and found that of 10 severe reactions (0.02%) and one death in 5 years of using nonionic contrast media, seven reactions occurred in patients after helical CT angiography. Petersein and colleagues25 have reported similar rates of adverse events in a cohort of 60,213 patients given a modern nonionic contrast agent.
CTA has been successfully used for the assessment of atherosclerotic RAS (Fig. 106-4). The diagnostic accuracy of CTA is high and similar to that of CE-MRA, as was confirmed by results of meta-analysis noted earlier.18 Beregi and associates26 have investigated the diagnostic accuracy of helical CTA in 20 patients with angiographically proven FMD and were able to detect the FMD in all patients accurately. A similar study in 21 patients has recently been published by Sabharwal and coworkers.27 The results of these studies must be interpreted with caution because they involved only patients who already had FMD. As is the case with CE-MRA, little additional data are available about the prospective accuracy of CTA for the detection of FMD in patients with therapy-resistant hypertension. An example of a 64-detector row CT scan of FMD is shown in Figure 106-5.
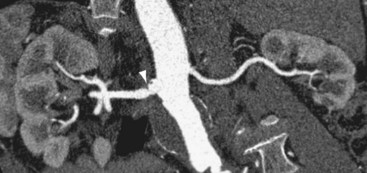
 FIGURE 106-4
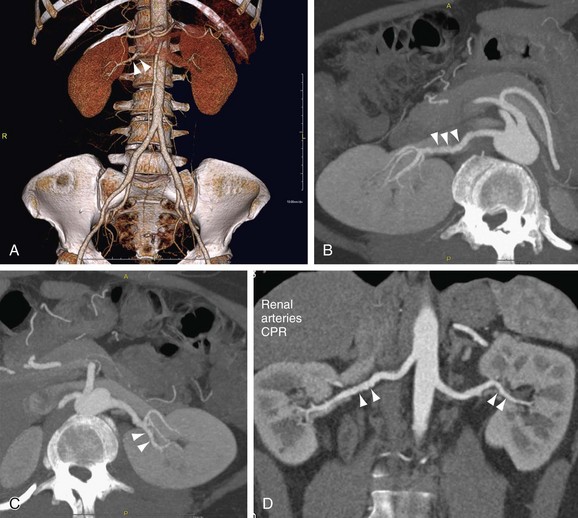
 FIGURE 106-5
The results of these CTA studies are, however, in contrast with the results of a large multicenter study from the Netherlands in which the validity of CE-MRA and CTA were prospectively investigated in 356 patients suspected of having RVH, using IA-DSA as the standard of reference.7 Two panels of three observers each judged CE-MRA and CTA examination results; they were blinded for each others results and the results of all other imaging modalities. Overall, sensitivity ranged from 61% to 69% for CTA and from 57% to 67% for CE-MRA. Specificity ranged from 89% to 97% for CTA and from 77% to 90% for CE-MRA. Additional analyses revealed that selecting a subgroup of patients with a high prevalence of RAS could increase the diagnostic performance of both tests, but not to levels that were commonly reported in the literature. Possible explanations for these discrepant findings are suboptimal technique, low overall disease prevalence, a high proportion of patients with FMD, and imperfect standard of reference.
Magnetic Resonance Imaging
Because of the relative ease of use and high reliability, CE-MRA is the preferred MR technique for the detection of RAS.28 In addition, phase contrast MRA or MR flow measurements might provide supplemental functional data on renal artery blood flow.
In CE-MRA, the renal arteries are imaged in the coronal plane during initial arterial passage of a 0.1- to 0.2-mmol/kg dose of a traditional (0.5 M) extracellular gadolinium chelate contrast medium. Because of the increase in T1 of tissue at 3.0 T, the contrast media dose can be reduced relative to that used for CE-MRA at 1.5 T.29 For best results, patients are required to hold their breath during the acquisition, which typically lasts about 10 to 20 seconds, depending on the resolution and other technical factors related to system performance. Contrast medium is injected at speeds up to 3.0 mL/sec, followed by 25 mL saline flush, and typical spatial resolution in current reports is approximately 1.0 × 1.0 × 1.0-2.0 mm3 (craniocaudal frequency direction × left-right phase-encoding direction × anteroposterior slice direction) or better. Using this approach, the abdominal aorta and renal arteries, including accessory arteries, can be visualized with high accuracy (Fig. 106-6). Arteries can usually be evaluated down to the proximal part of the segmental arteries. Distal segmental and interlobar branches cannot be evaluated reliably at this time.28,30
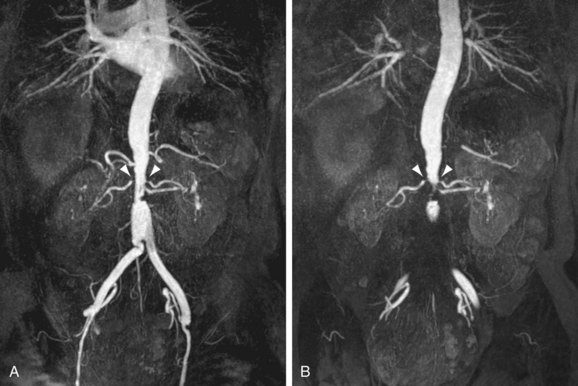
 FIGURE 106-6
To obtain a study with maximum arterial and minimum venous enhancement, it is very important to ensure careful synchronization of peak arterial contrast concentration, with sampling of central k-space profiles.31 This is typically done by performing a timing sequence with 1 to 2 mL of contrast medium prior to the contrast-enhanced acquisition, or by the use of real-time bolus monitoring software. With the latter technique, the entire contrast bolus is injected and simultaneously monitored by the operator or the MR scanner and, when sufficient enhancement is present in the descending aorta, the MR fluoroscopy sequence is aborted, the patient is given a breath-hold command, and the three-dimensional CE-MRA acquisition is started. A third option, available on the most advanced systems, is the use of a time-resolved technique to obtain a series of high spatial resolution three-dimensional volumes by using view-sharing techniques.32
Because of the risk of motion artifacts, it is important to limit breath-hold length. Motion artifacts may occur when patients are unable to sustain the breath-hold because the acquisition is too long, and even while performing a breath-hold, the kidneys are subject to linear caudocranial motion.30 Application of parallel imaging technology can lead to higher spatial resolution CE-MRA and/or shorter acquisition durations.33
Both nonenhanced (two-dimensional time-of-flight [TOF] and phase-contrast [PC]), as well as CE-MRA techniques, have been investigated for the detection of RAS. The results of these studies were summarized in a meta-analysis by Vasbinder and colleagues.18 Of the 306 studies published up to mid-2000, in which the utility of renal MRA was investigated, 18 studies were performed because of clinical suspicion of RVH; they used explicitly defined criteria for the presence of RAS and IA-DSA as the standard of reference test. Reported sensitivities and specificities for the detection of atherosclerotic RAS in these CE-MRA studies were uniformly high.
The reported sensitivity of CE-MRA for the visualization of accessory renal arteries is more than 90%.34,35 At present, one study has been published that specifically investigated the utility of CE-MRA for the detection of FMD. Willoteaux and associates36 retrospectively analyzed the accuracy of CE-MRA in comparison to IA-DSA in 25 subjects with angiographically proven FMD. They evaluated the sensitivity, specificity, and accuracy of CE-MRA for the detection of FMD-associated stenosis, string-of-pearls sign, and aneurysm formation. Although the sensitivity for FMD-associated stenosis in their study was only 68%, the sensitivity for the detection of the string-of-pearls sign and aneurysm formation was 95% and 100%, respectively. The overall sensitivity and specificity for the diagnosis FMD were 97% and 93%. However, although overt cases of FMD can be diagnosed with CE-MRA (Fig. 106-7), it is generally believed that CE-MRA currently cannot detect FMD with high accuracy in the presence of only subtle anatomic changes.
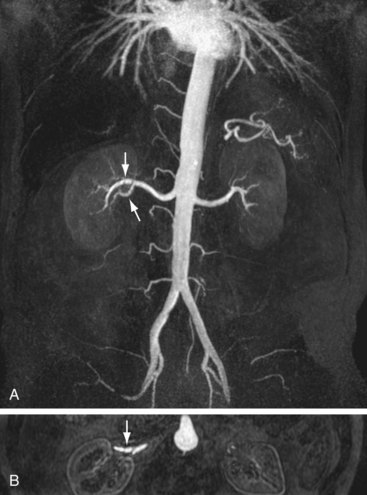
 FIGURE 106-7
The favorable results of these CE-MRA studies are, however, in contrast with the results of the previously noted large multicenter RADISH study from the Netherlands, in which the sensitivity ranged from 57% to 67% and specificity ranged from 77% to 90% for CE-MRA.7 Strikingly similar results were obtained in a more recent multicenter trial by Soulez and coworkers,37 who investigated the diagnostic performance of CE-MRA for the detection of RAS using IA-DSA as the reference standard in 268 patients with hypertension and/or suspected renal artery stenosis. Sensitivity, specificity, and accuracy for the detection of 51% or more RAS on a patient level in this study ranged from 65.2% to 79.9%, 81.3% to 91.4% and 73.6% to 83.8%, respectively.
Recently, there has been much interest in non–contrast-enhanced balanced steady-state free precession (SSFP)–based techniques as alternatives for CE-MRA. Although these techniques are promising,38 there are limited data with regard to their diagnostic accuracy and clinical utility. Preliminary data have indicated that the value of these techniques lies in their high negative predictive value.39
Nuclear Medicine and Positron Emission Tomography
The diagnosis of RAS on nuclear scintigraphy relies primarily on its ability to detect abnormalities in renal function rather than the anatomic depiction of arterial narrowing, as with CTA and MRA. Although both CT and MRA have shown potential for assessment of renal perfusion and/or function, these methods remain investigational and have yet to be widely applied in clinical practice. Thus, although nuclear medicine techniques are not ideal for the anatomic detection of renal artery stenosis, they are well suited to quantify renal function to determine the functional severity of a stenosis.18
There are numerous radionuclide techniques for studying kidney function. Nuclear techniques are the most reliable way to determine the true glomerular filtration rate (GFR); there are tracers that are exclusively cleared by glomerular filtration (e.g., 51Cr-EDTA, 99mTc-DTPA, 99mTc-MAG3). These types of agents can be used not only to determine GFR, but also to determine individual kidney function, also known as split renal function). Parameters that can be determined are differential blood flow, divided and regional renal function, and mean intrarenal transit time. A specific test that is sometimes still used to assess the significance of a suspected renal artery stenosis is the captopril scan, or captopril renography. In this test, the patient is imaged prior to and after having been given a 25- to 50-mg dose of captopril. In cases of hemodynamically significant RAS, uptake of the radionuclide tracer will fall after captopril administration because renal perfusion drops in response to inhibition of the renin-angiotensin system. However, in a meta-analysis comparing the diagnostic accuracy of different tests for the detection of RAS, nuclear medicine techniques performed poorly compared with CTA and CE-MRA, using IA-DSA as the standard of reference.18
Except for one study of 18 patients, there is a paucity of data in the literature on positron emission tomography (PET) techniques for the assessment of RAS.40 On the other hand, a recent experimental study has demonstrated proof of concept of imaging the angiotensin II subtype 1 receptor in the context of RAS.41
In clinical practice, most nuclear techniques are relatively time-intensive from the patients perspective and therefore are mostly used if Doppler ultrasonography, CTA, and CE-MRA are inconclusive or contraindicated (Fig. 106-8). An exception is assessment of renal transplant function, for which nuclear medicine techniques are still widely used. It is expected that in the near future, direct receptor imaging using PET techniques will enter the clinical arena.
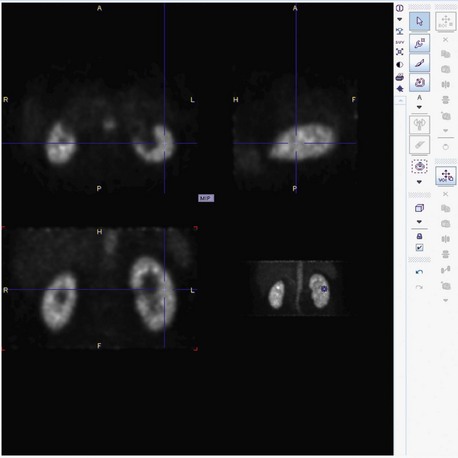
 FIGURE 106-8
Angiography
At present, IA-DSA is still widely regarded as the definitive test to diagnose the presence of RAS (Figs. 106-9 and 106-10). However, both the invasive nature of IA-DSA and the difficulty in assessing the pathophysiologic significance of stenotic lesions have encouraged the search for widely available noninvasive or minimally invasive diagnostic tests (see earlier). At present, these alternative tests are widely accepted in the medical community. In clinical practice, IA-DSA is mainly used in cases of equivocal findings with one of the noninvasive modalities. Our experience is that the number of diagnostic IA-DSA examinations specifically aimed at establishing the presence of RAS has dropped dramatically over the past decade. Currently, this test is rarely used for the diagnosis of RAS. IA-DSA for therapeutic intervention still remains the standard of care for patients with RAS in whom the decision has been made to perform percutaneous revascularization.
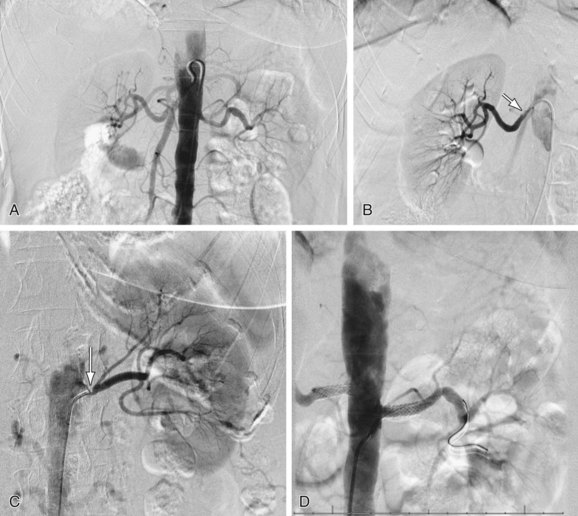
 FIGURE 106-9
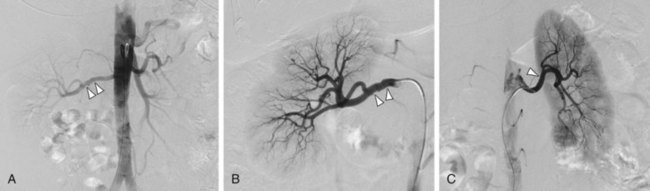
 FIGURE 106-10
DIFFERENTIAL DIAGNOSIS
From Imaging Findings
There are several diseases that may present with RAS, apart from atherosclerosis and FMD. RAS has been described in association with Takayasu disease42 and developmental hypoplasia of the infrarenal aorta.43 This latter condition is rare and usually presents in childhood. Other diseases that may lead to RAS are neurofibromatosis, tuberous sclerosis, and various space-occupying lesions. Finally, an acutely angulated renal artery may impede renal artery flow.
SYNOPSIS OF TREATMENT OPTIONS
Medical Treatment
The standard medical treatment of patients with RAS is usually a combination of different antihypertensive medications consisting of β blockers and angiotensin-converting enzyme inhibitors and/or angiotensin receptor blockers. The most appropriate regimen is the subject of continuous discussions and is beyond the scope of this chapter. For an excellent overview, see the review article by Textor.8
Surgical or Interventional Management
One of the most hotly debated issues in contemporary medicine is whether there is a long-term beneficial effect of renal artery dilation in patients with RAS compared with optimal medical treatment alone. The rapid increase in the number of percutaneous renal revascularizations, in patients with therapy-resistant hypertension and in those in whom RAS is accidentally discovered, is in sharp contrast with the limited evidence of its efficacy. It was once assumed that the mere presence and subsequent endovascular treatment of RAS of more than 50% luminal narrowing would improve renal function, but several randomized trials have shown that this is not necessarily the case, and only certain patients will benefit from intervention.44–49
Several clinical trials aimed at elucidating the optimal treatment strategy in patients with RAS are currently underway or in the final phase of follow-up. The conventional wisdom—that is, to dilate and/or stent in the presence of 50% or greater RAS—was greatly challenged in 2000 with the appearance of the results of the DRASTIC study by van Jaarsveld and colleagues,48 who found no difference at 12-month follow-up in 106 patients with RAS and hypertension randomized between medical antihypertensive therapy and angioplasty. The Dutch study of stent placement and blood pressure and lipid lowering to prevent the progression of renal dysfunction caused by atherosclerotic ostial stenosis of the renal artery has just completed enrollment and results of a 2-year follow-up are expected shortly.50 The large-scale ASTRAL trial will compare renal function in 750 patients with RAS randomized to medical management or revascularization51 and is specifically powered to detect a reduction in the decline of renal function of more than 20%, as assessed by reciprocal serum creatinine determinations over time. The final ongoing trial is the 1000-patient CORAL study,52 which aims to address a similar question as in the ASTRAL trial.
REPORTING: INFORMATION FOR THE REFERRING PHYSICIAN
When reporting a study of the kidneys and renal arteries, there are several points that should be mentioned. The referring clinician should receive information on kidney size and whether or not the renal cortex has a normal thickness and appearance. Any lesions in the kidney, including cysts, should be mentioned. When evaluating the renal arteries, the interpreting physician should note the number of renal arteries and from which vessel(s) they originate, including the presence of accessory arteries and the location and severity of any lumen-encroaching lesions. Measurements should preferably be made perpendicular to the center lumen line and the report should state whether stenosis was measured in plane (usually in the coronal acquisition plane), or as surface area. The latter is preferred, because it correlates significantly better with the degree of stenosis as seen with IA-DSA and intravascular ultrasonography.53


Leiner T. Magnetic resonance angiography of abdominal and lower extremity vasculature. Top Magn Reson Imaging. 2005;16:21-66.
Michaely HJ, Sourbron S, Dietrich O, et al. Functional renal MR imaging: an overview. Abdom Imaging. 2007;32:758-771.
Miyazaki M, Lee VS. Nonenhanced MR angiography. Radiology. 2008;248:20-43.
Robbin ML, Lockhart ME, Barr RG. Renal imaging with ultrasound contrast: current status. Radiol Clin North Am. 2003;41:963-978.
Safian RD, Textor SC. Renal-artery stenosis. N Engl J Med. 2001;344:431-442.
Schoenberg SO, Prince MR, Knopp MV, Allenberg JR. Renal MR angiography. Magn Reson Imaging Clin North Am. 1998;6:351-370.
Slovut DP, Olin JW. Fibromuscular dysplasia. N Engl J Med. 2004;350:1862-1871.
Textor SC. Renovascular hypertension update. Curr Hypertens Rep. 2006;8:521-527.
1 Laragh J. Harry Goldblatt 1891-1977. Trans Assoc Am Physicians. 1978;91:24-27.
2 Safian RD, Textor SC. Renal-artery stenosis. N Engl J Med. 2001;344:431-442.
3 Working Group on Renovascular Hypertension. Detection, evaluation, and treatment of renovascular hypertension. Final report. Arch Intern Med. 1987;147:820-829.
4 Slovut DP, Olin JW. Fibromuscular dysplasia. N Engl J Med. 2004;350:1862-1871.
5 Schreij G, de Haan MW, Oei TK, et al. Interpretation of renal angiography by interpreting physicians. J Hypertens. 1999;17:1737-1741.
6 Simon N, Franklin SS, Bleifer KH, Maxwell MH. Clinical characteristics of renovascular hypertension. JAMA. 1972;220:1209-1218.
7 Vasbinder GB, Nelemans PJ, Kessels AG, et al. Computed tomographic angiography and magnetic resonance angiography for the diagnosis of renal artery stenosis: a comparative study with digital subtraction angiography. Results of the renal artery diagnostic imaging study in hypertension (RADISH). Ann Intern Med 2004; 141: 674-682.
8 Textor SC. Renovascular hypertension update. Curr Hypertens Rep. 2006;8:521-527.
9 Dean RH, Tribble RW, Hansen KJ, et al. Evolution of renal insufficiency in ischemic nephropathy. Ann Surg. 1991;213:446-455.
10 Krijnen P, van Jaarsveld BC, Steyerberg EW, et al. A clinical prediction rule for renal artery stenosis. Ann Intern Med. 1998;129:705-711.
11 Rabbia C, Valpreda S. Duplex scan sonography of renal artery stenosis. Int Angiol. 2003;22:101-115.
12 Radermacher J, Chavan A, Schaffer J, et al. Detection of significant renal artery stenosis with color Doppler sonography: combining extrarenal and intrarenal approaches to minimize technical failure. Clin Nephrol. 2000;53:333-343.
13 Nchimi A, Biquet JF, Brisbois D, et al. Duplex ultrasound as first-line screening test for patients suspected of renal artery stenosis: prospective evaluation in high-risk group. Eur Radiol. 2003;13:1413-1419.
14 De Cobelli F, Venturini M, Vanzulli A, et al. Renal arterial stenosis: prospective comparison of color Doppler US and breath-hold, three-dimensional, dynamic, gadolinium-enhanced MR angiography. Radiology. 2000;214:373-380.
15 Kliewer MA, Tupler RH, Carroll BA, et al. Renal artery stenosis: analysis of Doppler waveform parameters and tardus-parvus pattern. Radiology. 1993;189:779-787.
16 Radermacher J, Chavan A, Bleck J, et al. Use of Doppler ultrasonography to predict the outcome of therapy for renal-artery stenosis. N Engl J Med. 2001;344:410-417.
17 Radermacher J, Mengel M, Ellis S, et al. The renal arterial resistance index and renal allograft survival. N Engl J Med. 2003;349:115-124.
18 Vasbinder GB, Nelemans PJ, Kessels AG, et al. Diagnostic tests for renal artery stenosis in patients suspected of having renovascular hypertension: a meta-analysis. Ann Intern Med. 2001;135:401-411.
19 Baumgartner I, Behrendt P, Rohner P, Baumgartner RW. A validation study on the intraobserver and interobserver reproducibility of renal artery duplex ultrasound. Ultrasound Med Biol. 1999;25:225-231.
20 Robbin ML, Lockhart ME, Barr RG. Renal imaging with ultrasound contrast: current status. Radiol Clin North Am. 2003;41:963-978.
21 Prokop M. Protocols and future directions in imaging of renal artery stenosis: CT angiography. J Comput Assist Tomogr. 1999;23(Suppl 1):S101-S110.
22 Prokop M. General principles of MDCT. Eur J Radiol. 2003;45(Suppl 1):S4-S10.
23 Fleischmann D. MDCT of renal and mesenteric vessels. Eur Radiol. 2003;13(Suppl 5):M94-M101.
24 Cochran ST, Bomyea K, Sayre JW. Trends in adverse events after IV administration of contrast media. AJR Am J Roentgenol. 2001;176:1385-1388.
25 Petersein J, Peters CR, Wolf M, Hamm B. Results of the safety and efficacy of iobitridol in more than 61,000 patients. Eur Radiol. 2003;13:2006-2011.
26 Beregi JP, Louvegny S, Gautier C, et al. Fibromuscular dysplasia of the renal arteries: comparison of helical CT angiography and arteriography. AJR Am J Roentgenol. 1999;172:27-34.
27 Sabharwal R, Vladica P, Coleman P. Multidetector spiral CT renal angiography in the diagnosis of renal artery fibromuscular dysplasia. Eur J Radiol. 2007;61:520-527.
28 Schoenberg SO, Prince MR, Knopp MV, Allenberg JR. Renal MR angiography. Magn Reson Imaging Clin North Am. 1998;6:351-370.
29 Michaely HJ, Kramer H, Oesingmann N, et al. Intraindividual comparison of MR-renal perfusion imaging at 1.5 T and 3.0 T. Invest Radiol. 2007;42:406-411.
30 Vasbinder GB, Maki JH, Nijenhuis RJ, et al. Motion of the distal renal artery during three-dimensional contrast-enhanced breath-hold MRA. J Magn Reson Imaging. 2002;16:685-696.
31 Maki JH, Chenevert TL, Prince MR. Three-dimensional contrast-enhanced MR angiography. Top Magn Reson Imaging. 1996;8:322-344.
32 Michaely HJ, Sourbron S, Dietrich O, et al. Functional renal MR imaging: an overview. Abdom Imaging. 2007;32:758-771.
33 Weiger M, Pruessmann KP, Kassner A, et al. Contrast-enhanced 3D MRA using SENSE. J Magn Reson Imaging. 2000;12:671-677.
34 Bakker J, Beek FJ, Beutler JJ, et al. Renal artery stenosis and accessory renal arteries: accuracy of detection and visualization with gadolinium-enhanced breath-hold MR angiography. Radiology. 1998;207:497-504.
35 Shetty AN, Bis KG, Kirsch M, et al. Contrast-enhanced breath-hold three-dimensional magnetic resonance angiography in the evaluation of renal arteries: optimization of technique and pitfalls. J Magn Reson Imaging. 2000;12:912-923.
36 Willoteaux S, Faivre-Pierret M, Moranne O, et al. Fibromuscular dysplasia of the main renal arteries: comparison of contrast-enhanced MR angiography with digital subtraction angiography. Radiology. 2006;241:922-929.
37 Soulez G, Pasowicz M, Benea G, et al. Renal artery stenosis evaluation: diagnostic performance of gadobenate dimeglumine-enhanced MR angiography—comparison with DSA. Radiology. 2008;247:273-285.
38 Miyazaki M, Lee VS. Nonenhanced MR angiography. Radiology. 2008;248:20-43.
39 Maki JH, Wilson GJ, Eubank WB, et al. Navigator-gated MR angiography of the renal arteries: a potential screening tool for renal artery stenosis. AJR Am J Roentgenol. 2007;188:W540-W546.
40 Shreve P, Chiao PC, Humes HD, et al. Carbon-11-acetate PET imaging in renal disease. J Nucl Med. 1995;36:1595-1601.
41 Xia J, Seckin E, Xiang Y, et al. Positron-emission tomography imaging of the angiotensin II subtype 1 receptor in swine renal artery stenosis. Hypertension. 2008;51:466-473.
42 Leiner T. Magnetic resonance angiography of abdominal and lower extremity vasculature. Top Magn Reson Imaging. 2005;16:21-66.
43 Prakken FJ, Kitslaar PJ, van de Kar N, et al. Diagnosis of abdominal aortic hypoplasia by state-of-the-art MR angiography. Pediatr Radiol. 2006;36:57-60.
44 Cheung CM, Hegarty J, Kalra PA. Dilemmas in the management of renal artery stenosis. Br Med Bull. 2005;73-74:35-55.
45 Ives NJ, Wheatley K, Stowe RL, et al. Continuing uncertainty about the value of percutaneous revascularization in atherosclerotic renovascular disease: a meta-analysis of randomized trials. Nephrol Dial Transplant. 2003;18:298-304.
46 Plouin PF, Chatellier G, Darne B, Raynaud A. Blood pressure outcome of angioplasty in atherosclerotic renal artery stenosis: a randomized trial. Essai Multicentrique Medicaments vs Angioplastie (EMMA) Study Group. Hypertension. 1998;31:823-829.
47 van de Ven PJ, Kaatee R, Beutler JJ, et al. Arterial stenting and balloon angioplasty in ostial atherosclerotic renovascular disease: a randomised trial. Lancet. 1999;353:282-286.
48 van Jaarsveld BC, Krijnen P, Pieterman H, et al. The effect of balloon angioplasty on hypertension in atherosclerotic renal-artery stenosis. Dutch Renal Artery Stenosis Intervention Cooperative Study Group. N Engl J Med. 2000;342:1007-1014.
49 Webster J, Marshall F, Abdalla M, et al. Randomised comparison of percutaneous angioplasty vs continued medical therapy for hypertensive patients with atheromatous renal artery stenosis. Scottish and Newcastle Renal Artery Stenosis Collaborative Group. J Hum Hypertens. 1998;12:329-335.
50 Bax L, Mali WP, Buskens E, et al. The benefit of STent placement and blood pressure and lipid-lowering for the prevention of progression of renal dysfunction caused by Atherosclerotic ostial stenosis of the Renal artery. The STAR-study: rationale and study design. J Nephrol. 2003;16:807-812.
51 Mistry S, Ives N, Harding J, et al. Angioplasty and STent for Renal Artery Lesions (ASTRAL trial): rationale, methods and results so far. J Hum Hypertens. 2007;21:511-515.
52 Murphy TP, Cooper CJ, Dworkin LD, et al. The Cardiovascular Outcomes with Renal Atherosclerotic Lesions (CORAL) study: rationale and methods. J Vasc Interv Radiol. 2005;16:1295-1300.
53 Schoenberg SO, Rieger J, Weber CH, et al. High-spatial-resolution MR angiography of renal arteries with integrated parallel acquisitions: comparison with digital subtraction angiography and US. Radiology. 2005;235:687-698.
