Chapter 13
Reference Values and Interpretation Strategies
1. Identify the reference set recommended for spirometry testing and the effect of ethnicity.
2. Determine the methodology used in defining the lower 5th percentile.
3. Understand the key parameter in determining airway obstruction.
1. Describe a z score in determining the lower limit of normal.
2. Define the nuances of the nonspecific pattern.
3. Understand grading the degree of obstruction in the mixed pattern.
Selecting and using reference values
Lung Volumes
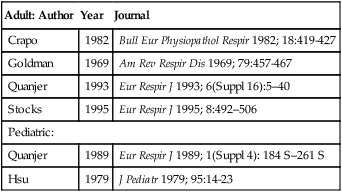
Identification of normal lung volume values, specifically FRC, RV, and TLC, is more challenging because the amount of published data is limited. Lung volumes are related to body size with height being the most important variable. An additional factor that should be considered when selecting lung volumes reference sets is the testing methodology used in deriving the values (e.g., plethysmography versus dilutional methods). The ATS-ERS did not recommend a specific reference set, but a few popular authors are listed in Table 13-1.
Table 13-1
Common Reference Authors for Lung Volumes
| Adult: Author | Year | Journal |
| Crapo | 1982 | Bull Eur Physiopathol Respir 1982; 18:419-427 |
| Goldman | 1969 | Am Rev Respir Dis 1969; 79:457-467 |
| Quanjer | 1993 | Eur Respir J 1993; 6(Suppl 16):5–40 |
| Stocks | 1995 | Eur Respir J 1995; 8:492–506 |
| Pediatric: | ||
| Quanjer | 1989 | Eur Respir J 1989; 1(Suppl 4): 184 S–261 S |
| Hsu | 1979 | J Pediatr 1979; 95:14-23 |
Diffusing Capacity
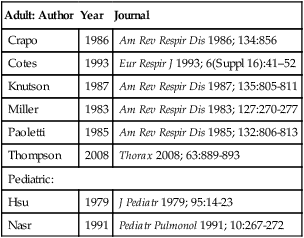
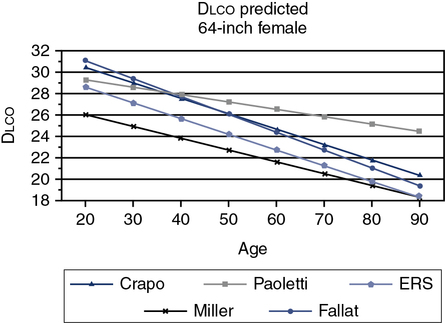
The ATS-ERS did not recommend a specific set of reference equations for diffusing capacity, citing inter-laboratory variability as their reason. Published data have shown even in a well controlled clinical trial that intersession variability can range from 10%-25%. The ATS-ERS statement did recommend that predicted values for alveolar volume (VA), inspired volume (VI), and Dlco should come from the same source. Figure 13-1 demonstrates the difference in a subject between various Dlco predicted equations. A 60-year-old female of average height can have a predicted value ranging from approximately 21-27 mL/min/mm Hg, depending on the reference set selected. Thompson and others published a reference set in middle aged to older subjects (ages 45-71), which complied entirely with the 2005 ATS-ERS recommendations for testing technique and quality assurance. Their equations compared favorably with those previously published by Miller. Several common reference authors are listed in Table 13-2.
Table 13-2
Common Reference Authors for Diffusing Capacity
| Adult: Author | Year | Journal |
| Crapo | 1986 | Am Rev Respir Dis 1986; 134:856 |
| Cotes | 1993 | Eur Respir J 1993; 6(Suppl 16):41–52 |
| Knutson | 1987 | Am Rev Respir Dis 1987; 135:805-811 |
| Miller | 1983 | Am Rev Respir Dis 1983; 127:270-277 |
| Paoletti | 1985 | Am Rev Respir Dis 1985; 132:806-813 |
| Thompson | 2008 | Thorax 2008; 63:889-893 |
| Pediatric: | ||
| Hsu | 1979 | J Pediatr 1979; 95:14-23 |
| Nasr | 1991 | Pediatr Pulmonol 1991; 10:267-272 |
Several methods for applying reference values are used:
Establishing what is abnormal
Determining the lower limit of normal (LLN) should be done by analyzing some measure (e.g., FVC, FEV1) in healthy subjects and then determining the variability of that measurement. In clinical medicine, the 5th percentile is often defined as the LLN because it represents the segment of healthy subjects farthest below the average. Even though subjects in the 5th percentile are healthy, they are arbitrarily defined as “abnormal” for clinical purposes. Figure 13-2 depicts the predicted and the LLN for white females from ages 8–80 years (NHANES III). It is noteworthy that the statistical LLN is approximately the same across the adult age range.
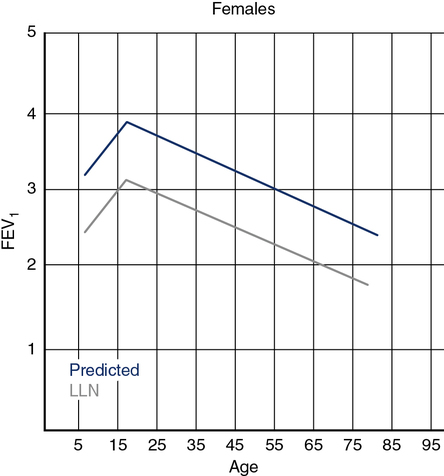
The predicted FEV1 for females ages 8 to 80 years is shown by the upper line (blue) based on the third National Health and Nutrition Evaluation Survey (NHANES III) regression equations for white adults. The lower line (gray) represents the statistical lower limit of normal (LLN) for the same group. FEV1 increases from ages 8 to 18 years, with the LLN showing a similar pattern. The LLN line represents the 95th percentile.
Some clinicians use a fixed percentage (measured value divided by the reference value × 100) of the reference value to determine the degree of abnormality. Eighty percent (80%) is often used as the limit of normal. Unfortunately, this method leads to errors because the variability around the predicted value is relatively constant in adults. In other words, the scatter of normal values does not vary with the size of the predicted value. Figure 13-3 illustrates why using fixed percentages, such as 80% of the predicted, can lead to misclassification. In tall, young subjects 80% of the predicted is often less than the 5th percentile; using 80% as the limit can allow a patient who really does have decreased lung function (in the 5th percentile or lower) to be misclassified as normal. This situation is a false-negative result; the patient has disease but the test does not indicate abnormality. Similarly, an elderly patient who is short may have a lung function parameter that is less than 80% of predicted but well within the statistically normal range (above the 5th percentile). This short elderly subject would be misclassified as having lung disease when in fact she is within the “normal” range (i.e., a false-positive result). Using percents of predicted introduces both age and height biases. The situation is slightly different in children because the variability of lung function measures tends to change proportionately with the size of the predicted value. For this reason, percents of predicted values may be appropriate for classifying lung function in children.
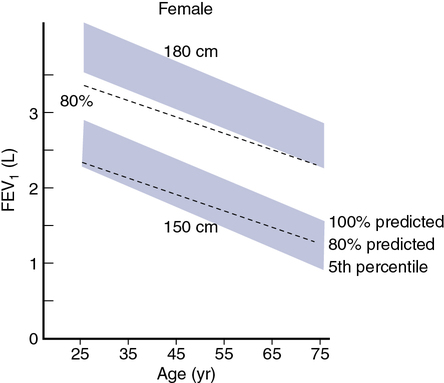
The graph illustrates the fall in predicted FEV1 for tall (180 cm) and short (150 cm) females with age. The shaded areas represent the “normal” range from 100% of the predicted value down to the 5th percentile. The dashed line shows a fixed percentage of the predicted—in this case, 80%, as is sometimes used to represent the lower limit of normal. For a young tall female, 80% is less than the statistical lower limit. A subject with a low FEV1 (below the 5th percentile) might still be above 80% of predicted; this would result in a false-negative finding on spirometry. Similarly, a short, older female might have an FEV1 below 80% of predicted and be considered to have disease when her FEV1 is actually above the 5th percentile. In this instance, the result is false-positive. Similar bias occurs when percents of predicted are used from adult males because the variability of FEV1 (and other pulmonary function parameters) does not tend to vary with the size of the predicted value. Clinical decisions should be based on well-defined lower limits of normal rather than fixed percents of predicted (in adults).
A more statistically sound approach for classifying abnormality is to compute the z score or standard deviation score (SDS). If lung function varies in a normal fashion (a Gaussian or bell-shaped distribution curve; Figure 13-4), the mean ± 1.96 standard deviation (SD) defines the 95% confidence interval. Statistically, 95% of the healthy population falls within approximately 2 SD of the mean. The remaining subjects fall into either the highest or lowest 2.5% of the distribution. The z score or SDS can be calculated easily if the variability (residual standard deviation (RSD)) of the reference population is known:
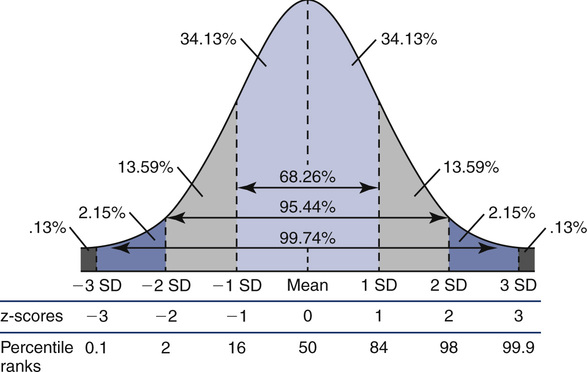
Lowest 5% of the reference population is defined as “abnormal.”
< ?xml:namespace prefix = "mml" />
RSD = residual standard deviation
where 0.468 is the residual standard deviation from the reference population, the z score of −1.53 suggests that this subject is above the 5th percentile and likely has normal lung function. The advantage of z scores is that they can be used for any index that is normally distributed. Because the z score accounts for the variability occurring in healthy subjects, it tells how common, or uncommon, the finding may be in the patient being studied.
There are several areas in which the definition of lung function abnormality may have important clinical consequences. One such area is the use of a fixed ratio to define airway obstruction, as is frequently done with the FEV1/FVC (FEV1/VC). The World Health Organization’s Global Initiative for Obstructive Lung Disease (GOLD) recommends the use of 70% as a cutoff, with ratios less than this value defining the presence of airway obstruction. However, because the FEV1/FVC ratio falls with age (sex, height, and ethnicity also may play a role), using a fixed ratio may misclassify younger subjects as normal (false negative) and older subjects as obstructed (false positive) (Figure 13-5). Similarly, using fixed percentages of predicted (e.g., 80%, 50%) to categorize the severity of obstruction may misclassify subjects who are young and tall or old and short (as discussed in a preceding paragraph). These misapplications of fixed ratios and fixed percents of predicted can have serious consequences for individual patients and for large groups of subjects when research is involved. Misclassifying an elderly subject as having COPD may mean the inappropriate prescription of drugs that can have serious side effects. Using an inappropriate classification, such as an FEV1/FVC ratio of 70%, to exclude subjects from a clinical trial (because they are incorrectly classified as “obstructed”) means that otherwise healthy subjects are not exposed to the treatment or drug being evaluated.
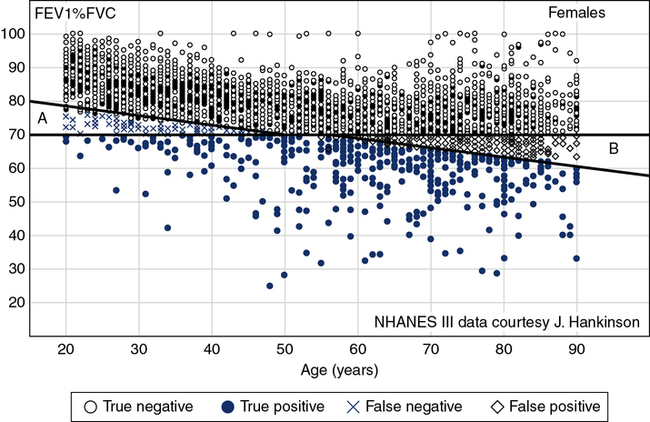
The Figure shows a theoretical sample population of females whose data fit the NHANES III equation for FEV1/FVC ratio. All subjects plotted as black dots are truly within the normal range. Those plotted in light grey are below the LLN and represent true positives. The subjects less than 40 years of age and plotted in blue “x”s are false negatives (GOLD recommendations falsely state they are normal [>70%] but are in fact below the LLN) and the black “◇”s in the older population group are those where GOLD recommendations state they are abnormal when in fact they are above the LLN (false positives).
1. Type of equipment used for the reference study: Does equipment comply with the most recent recommendations of the ATS-ERS (See Chapter 11.)
2. Methodology: Were standardized procedures used in the reference study similar to those to be used, particularly for spirometry, lung volumes, and Dlco?
3. Reference population: What were the ranges of ages of the individuals in the reference population? Were both males and females tested? Did the study generate different regressions for different ethnic origins? Did the study include smokers or other “at-risk” individuals as healthy individuals? If a specific group of subjects was studied, are the results applicable to the population in general?
4. Statistical analysis: Are lower limits of normal specifically defined (e.g., 5th percentile, 1.645 × RSD)? Are adequate measures of variability available (RSD, SEE) so that upper or lower limits of normal can be calculated along with the predicted values?
5. Conditions of the study: Was the study performed at a different altitude or under significantly different environmental conditions?
6. Published reference equations: Do reference values generated using the study’s regressions differ markedly from other published references?
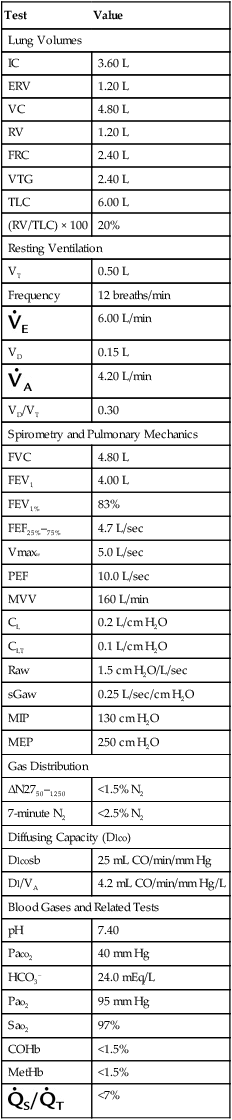
Individual laboratories may wish to perform measurements on subjects who represent a healthy cross-section of the population that the laboratory usually tests. Doing this in a statistically meaningful way may require testing a large number of subjects. However, measured values from these individuals can then be compared with expected values using various reference equations. Equations that produce the smallest average differences (measured – predicted) may be preferable. Evaluation of a small number of individuals may not show much difference between equations for FVC and FEV1. However, there may be noticeable discrepancies for Dlco or maximal flows. Equations for spirometry, lung volumes, and Dlco should be taken from a single reference, if possible. If healthy individuals fall outside of the limits of normal, the laboratory should examine its test methods, how the individuals were selected, and the prediction equations being used. Table 13-3 lists “typical” normal values for pulmonary function and blood gas parameters.
Table 13-3
Typical Values for Pulmonary Function Tests
Values are for a healthy young male, 1.7 m2 body surface area.
| Test | Value |
| Lung Volumes | |
| IC | 3.60 L |
| ERV | 1.20 L |
| VC | 4.80 L |
| RV | 1.20 L |
| FRC | 2.40 L |
| VTG | 2.40 L |
| TLC | 6.00 L |
| (RV/TLC) × 100 | 20% |
| Resting Ventilation | |
| VT | 0.50 L |
| Frequency | 12 breaths/min |
 |
6.00 L/min |
| VD | 0.15 L |
 |
4.20 L/min |
| VD/VT | 0.30 |
| Spirometry and Pulmonary Mechanics | |
| FVC | 4.80 L |
| FEV1 | 4.00 L |
| FEV1% | 83% |
| FEF25%–75% | 4.7 L/sec |
| Vmax50 | 5.0 L/sec |
| PEF | 10.0 L/sec |
| MVV | 160 L/min |
| CL | 0.2 L/cm H2O |
| CLT | 0.1 L/cm H2O |
| Raw | 1.5 cm H2O/L/sec |
| sGaw | 0.25 L/sec/cm H2O |
| MIP | 130 cm H2O |
| MEP | 250 cm H2O |
| Gas Distribution | |
| ΔN2750–1250 | <1.5% N2 |
| 7-minute N2 | <2.5% N2 |
| Diffusing Capacity (Dlco) | |
| Dlcosb | 25 mL CO/min/mm Hg |
| Dl/VA | 4.2 mL CO/min/mm Hg/L |
| Blood Gases and Related Tests | |
| pH | 7.40 |
| Paco2 | 40 mm Hg |
| HCO3– | 24.0 mEq/L |
| Pao2 | 95 mm Hg |
| Sao2 | 97% |
| COHb | <1.5% |
| MetHb | <1.5% |
 |
<7% |
Pulmonary function testing interpretation, “bringing it all together”
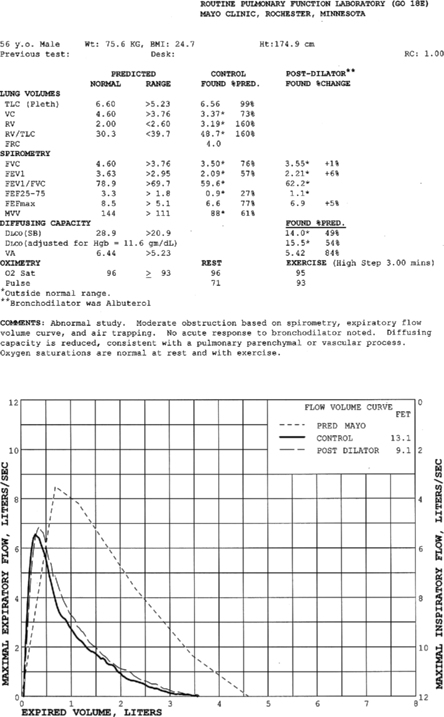
Pulmonary function test interpretation should be structured to facilitate an understanding of the test results by the attending clinician and not to further confuse them. Simply reiterating numbers will not accomplish this goal. Clear, succinct terminology, such as “normal study” or “abnormal study” followed by a brief organized review of the data will be more useful to the ordering physician in caring for their patient (Box 13-1). The reported data should be structured in an organized manner to facilitate the interpretation and understanding of the clinician. Spirometers can calculate a virtual sea of parameters, and, even though they may have benefit in specific circumstances, they serve only to confuse the novice user. Figure 13-6 is an example of a PFT report with groupings of data under major section headers that assist in presenting the data in an organized fashion. Values that fall outside of the LLN (or ULN) can be highlighted (colored) or accompany an asterisk to visually bring them to the attention of the viewer.
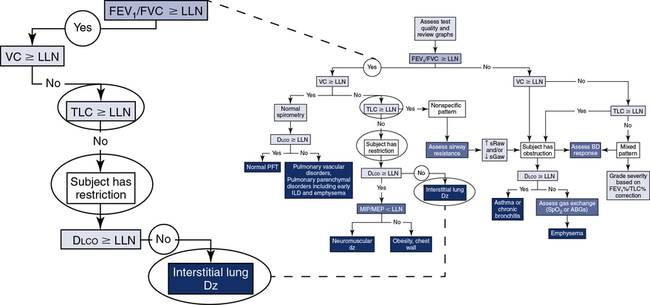
Interpretation algorithm
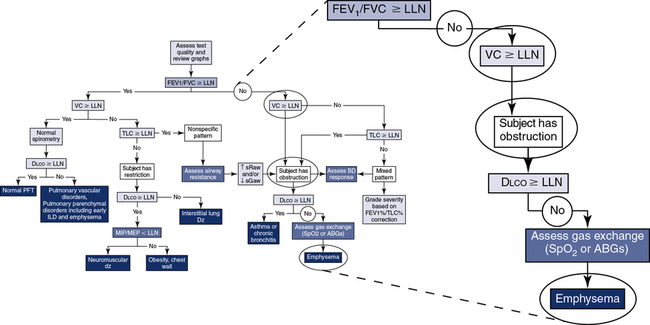
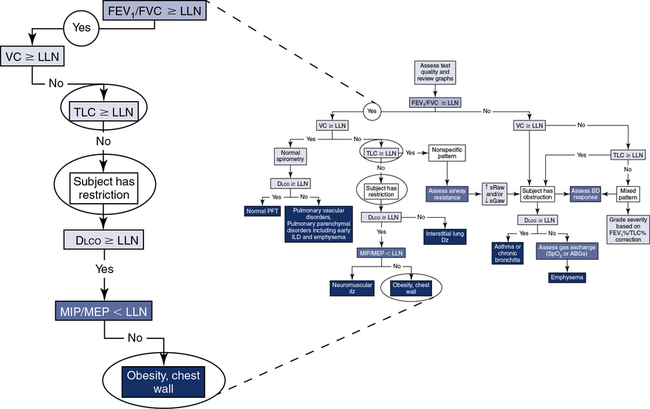
The application of a simple algorithm to define the major characteristics of lung function allows for a systematic approach to interpretation (Figure 13-7), although it does not fully describe all of the clinical nuances an interpreter may encounter.
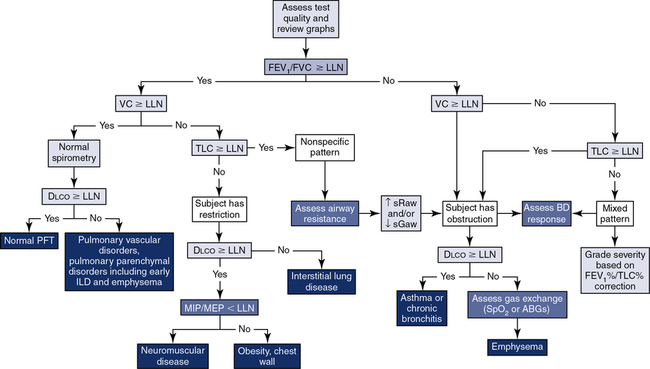
Step 1: Assess quality and review graphs. Step 2: Evaluate “the ratio.” Step 3: Assess the vital capacity. Step 4: Assess TLC. Step 5: Assess Dlco. Step 6: Consider the addition of airway resistance, bronchodilator response, respiratory muscle strength, and ABGs/pulse oximetry.
Quality Review and “the Graph”
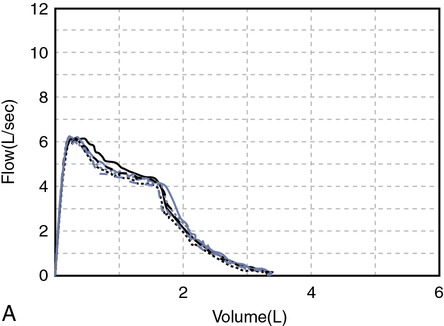
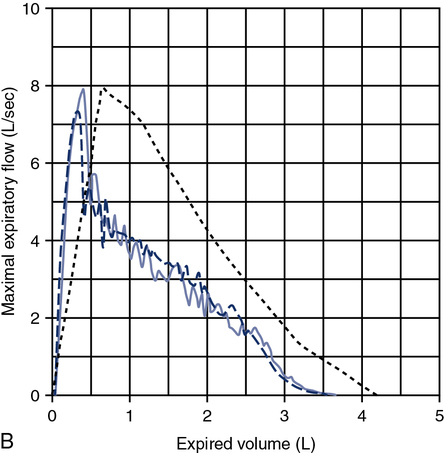
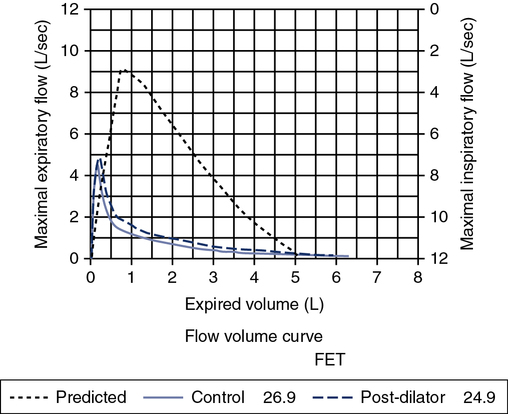
A review of the quality of each testing module data (see Chapter 12) and any comments documented by the testing staff are quintessential in the interpretation process. The interpretation of data that do not meet the ATS-ERS recommendations for acceptability and repeatability or include technologist’s comments related to poor effort should be conducted with caution. Data that are not repeatable but still “usable” should be noted by the interpreter in their comments (e.g., subject could not perform repeatable FVCs). Reviewing the flow volume and volume time curves can also help the interpreter in assessing quality. A slow start (e.g., back extrapolation error), cough in the first second, sharp peak flow (e.g., effort), and end-of-test criteria can all be evaluated visually from the graphical data. The FV curve can help define obstructive and restrictive patterns, aid in the assessment of upper airway obstruction (see Chapter 2), and possibly identify normal variants or other abnormalities that may not affect the numbers but be relevant to the patient’s condition (Figure 13-8, A and B). Any spirometry data without the presence of the flow volume curve graph, in particular, are just numbers and subject to question.
Gas Exchange
Gas exchange can be evaluated by several parameters. Diffusing capacity is used to evaluate the integrity of the alveolar-capillary membrane interface (transfer factor; see Chapter 3), and arterial blood gases or pulse oximetry is used to assess the physiologic impact of a gas exchange abnormality (see Chapter 6). In our simple algorithmic scheme, we will use the former to determine the impact of the disease process on gas exchange.
If the patient has obstruction, mixed pattern, and nonspecific pattern included (see Figure 13-7, B), and the Dlco is greater than or equal to LLN, the data would be consistent with asthma or chronic bronchitis. Whereas if the Dlco is less than LLN, the data would be consistent with emphysema. According to Hadeli and others, when the Dlco is <60%, there is a high probability of exercise desaturation, and further assessment (i.e., ABGs or pulse oximetry) may be warranted.
If the patient has normal spirometry (see Figure 13-7, A) and the Dlco is greater than or equal to LLN, the subject has a normal PFT. Whereas if the Dlco is less than LLN, the data would be consistent with a pulmonary vascular disorder (e.g., pulmonary emboli, A-V malformation) and/or early pulmonary parenchymal disorders (e.g., interstitial lung disease, emphysema).
If the patient has restriction (see Figure 13-7) and the Dlco is greater than or equal to LLN, consider neuromuscular disease, obesity, and/or chest wall deformities. Further evaluation with respiratory muscular strength measurements (see Chapter 10) may be helpful in differentiating the abnormality. Whereas if the Dlco is less than LLN, the data would be consistent with interstitial lung disease (e.g., pulmonary fibrosis).
Bronchodilator Response
Assessing bronchodilator response may be indicated in patients complaining of chest tightness, wheeze, and/or shortness of breath. Furthermore, patients who fall into the categories of obstruction, mixed pattern, and/or nonspecific pattern may specifically warrant bronchodilator testing to further differentiate their underlying abnormality. A complete description of the test methodology and assessment of the response is described in Chapter 2. However, as a review, a significant response (positive response) is an increase in the FEV1 greater than 12% and 200 mL or if airways resistance is assessed, a 30% to 40% change occurs (↓ sRaw or ↑ sGaw).
Grading Severity and Assessing Change in Lung Function
Table 13-4 summarizes grading of the severity of pulmonary function test parameters. The 2005 ATS-ERS recommendations do not address grading of lung volumes (also known as restriction) separate from grading the severity of the FEV1 from spirometry, noting that the overall impact of the ventilatory dysfunction can be described with this single variable. However, practically all clinicians are still requesting grading of the lung volume measurements and may make clinical/treatment decisions based on that grade. The 1991 ATS interpretation recommendations have a scheme for the grading of lung volumes, which are included in Table 13-4. Zechariah and others recently published recommendations for grading the severity of obstruction in a patient with mixed obstruction-restriction. In their paper, they applied an adjustment by dividing the FEV1% predicted by the TLC% predicted.
Table 13-4
Grading Severity of PFT Parameters
| *Spirometry FEV1/FVC < LLN | FEV1 % Pred |
| Mild obstruction | >70% |
| Moderate obstruction | 60%-69% |
| Moderately severe obstruction | 50%-59% |
| Severe obstruction | 35%-49% |
| Very severe obstruction | <35% |
| **Lung Volumes FEV1/FVC ≥ LLN | TLC % Pred |
| Mild restriction | <LLN but >70% |
| Moderate restriction | <70 and >60% |
| Moderately severe restriction | <60% |
| *DLCO | DLCO % Pred |
| Mild | >60% and <LLN |
| Moderate | 40%-60% |
| Severe | <40% |
*Adapted from the ATS-ERS Interpretation guideline. Eur Respir J. 2005; 26:948–968.
**Adapted from the ATS Selection of reference values and interpretive strategies. Am Rev Respir Dis. 1991; 144:1202.
| TLC | 2.82 L | 61% pred |
| FVC | 1.11 L | 44% pred |
| FEV1 | 0.68 L | 34% pred = Very severe obstruction |
| FEV1/FVC | 61.6% |
TLC% predicted = 34/61 = 56% = Moderately severe obstruction
In evaluating a patient’s change in lung function over time, you need to take into account the test-to-test variability. The normal rate of decline in FEV1 is approximately 30 mL per year in subjects greater than 30 years of age. However, when you factor in the test variability, the ATS-ERS recommends a change of 15% before you interpret any change as clinically significant. A laboratory can also establish its own variability by analyzing their BioQC (see Chapter 12) data. The Mayo Clinic Pulmonary Laboratory variability is as follows:
FVC 250 mL FEV1 220 mL, TLC 320 mL, Dlco 3.2 units
Table 13-5 summarizes the ATS-ERS recommendations for a clinically significant change over time.
Table 13-5
| FVC | FEV1 | Dlco | |
| Week to Week | |||
| Normal subjects | ≥11% | ≥12% | >6 units |
| COPD | ≥20% | ≥20% | >4 units |
| Year to Year | ≥15% | ≥15% | 10% |
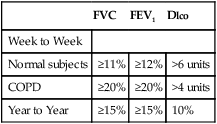
Adapted from the ATS-ERS Interpretation guideline. Eur Respir J. 2005; 26:948–968.
Summary
• The chapter describes the selection of reference values for spirometry, lung volumes, and diffusing capacity.
• It’s important to identify the lower limit of normal and list some of the more commonly used reference sets, such as for spirometry, lung volumes, and diffusing capacity.
• A simple algorithm for the interpretation of pulmonary function test can be used and will help establish the cut-points used to grade severity.
• More detailed information related to test interpretation is found in specifically labeled chapters.
Case Studies
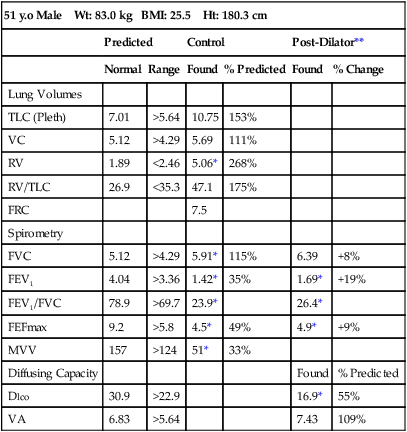
Case 13-1
| 51 y.o Male Wt: 83.0 kg BMI: 25.5 Ht: 180.3 cm | ||||||
| Predicted | Control | Post-Dilator** | ||||
| Normal | Range | Found | % Predicted | Found | % Change | |
| Lung Volumes | ||||||
| TLC (Pleth) | 7.01 | >5.64 | 10.75 | 153% | ||
| VC | 5.12 | >4.29 | 5.69 | 111% | ||
| RV | 1.89 | <2.46 | 5.06* | 268% | ||
| RV/TLC | 26.9 | <35.3 | 47.1 | 175% | ||
| FRC | 7.5 | |||||
| Spirometry | ||||||
| FVC | 5.12 | >4.29 | 5.91* | 115% | 6.39 | +8% |
| FEV1 | 4.04 | >3.36 | 1.42* | 35% | 1.69* | +19% |
| FEV1/FVC | 78.9 | >69.7 | 23.9* | 26.4* | ||
| FEFmax | 9.2 | >5.8 | 4.5* | 49% | 4.9* | +9% |
| MVV | 157 | >124 | 51* | 33% | ||
| Diffusing Capacity | Found | % Predicted | ||||
| Dlco | 30.9 | >22.9 | 16.9* | 55% | ||
| VA | 6.83 | >5.64 | 7.43 | 109% | ||
Step 1: Assess quality and review graphs.
Step 3: Assess the vital capacity.
*For these case studies use the simple interpretation flow chart to characterize the abnormality.
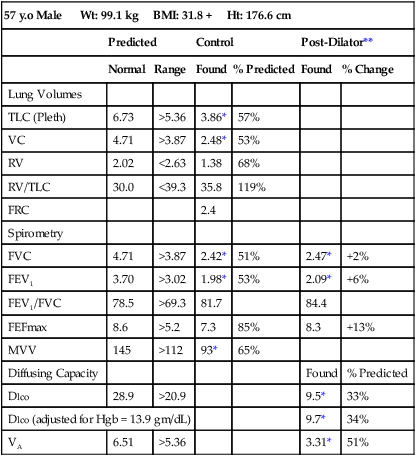
Case 13-2
| 57 y.o Male Wt: 99.1 kg BMI: 31.8 + Ht: 176.6 cm | ||||||
| Predicted | Control | Post-Dilator** | ||||
| Normal | Range | Found | % Predicted | Found | % Change | |
| Lung Volumes | ||||||
| TLC (Pleth) | 6.73 | >5.36 | 3.86* | 57% | ||
| VC | 4.71 | >3.87 | 2.48* | 53% | ||
| RV | 2.02 | <2.63 | 1.38 | 68% | ||
| RV/TLC | 30.0 | <39.3 | 35.8 | 119% | ||
| FRC | 2.4 | |||||
| Spirometry | ||||||
| FVC | 4.71 | >3.87 | 2.42* | 51% | 2.47* | +2% |
| FEV1 | 3.70 | >3.02 | 1.98* | 53% | 2.09* | +6% |
| FEV1/FVC | 78.5 | >69.3 | 81.7 | 84.4 | ||
| FEFmax | 8.6 | >5.2 | 7.3 | 85% | 8.3 | +13% |
| MVV | 145 | >112 | 93* | 65% | ||
| Diffusing Capacity | Found | % Predicted | ||||
| Dlco | 28.9 | >20.9 | 9.5* | 33% | ||
| Dlco (adjusted for Hgb = 13.9 gm/dL) | 9.7* | 34% | ||||
| VA | 6.51 | >5.36 | 3.31* | 51% | ||
Step 1: Assess quality and review graphs.
Step 3: Assess the vital capacity.
*For these case studies use the simple interpretation flow chart to characterize the abnormality.
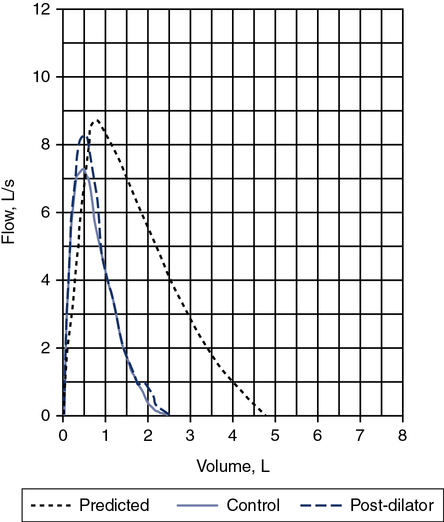
Case 13-3
| 62 y.o Male Wt: 91.1 kg BMI: 25.4 Ht: 189.4 cm | ||||
| Predicted | Control | |||
| Normal | Range | Found | % Predicted | |
| Lung Volumes | ||||
| TLC (Pleth) | 7.70 | >6.33 | 5.71* | 74% |
| VC | 5.60 | >4.76 | 3.20* | 57% |
| RV | 2.11 | <2.74 | 2.51 | 119% |
| RV/TLC | 27.4 | <35.9 | 44.0 | 161% |
| FRC | 3.5 | |||
| Spirometry | ||||
| FVC | 5.60 | >4.76 | 3.16* | 56% |
| FEV1 | 4.26 | >5.58 | 2.15* | 51% |
| FEV1/FVC | 76.1 | >66.9 | 68.1 | |
| FEFmax | 9.6 | >6.2 | 5.6 | 58% |
| MVV | 153 | >120 | 86 | 56% |
| Diffusing Capacity | ||||
| Dlco | 29.9 | >21.9 | 26 | 87% |
| VA | 7.50 | >6.33 | 5.20* | 69% |
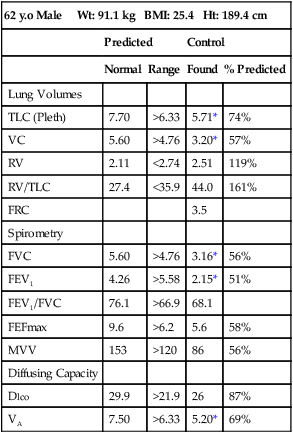
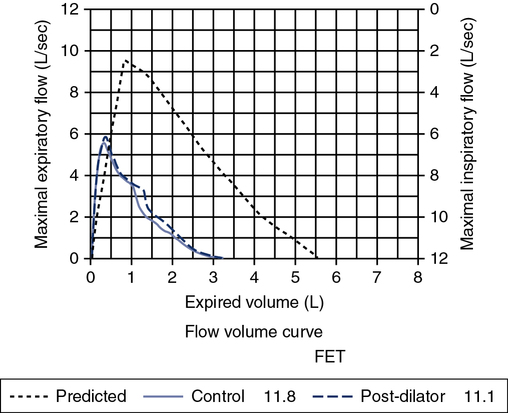
Step 1: Assess quality and review graphs.
Step 3: Assess the vital capacity.
• No other tests ordered. Respiratory muscle strength would have been indicated, but he had an obvious chest wall abnormality so it was not needed.
*For these case studies use the simple interpretation flow chart to characterize the abnormality.