CHAPTER 4 REDUCING CARDIOVASCULAR RISK
OVERVIEW
There is strong evidence to support the efficacy of modifying cardiovascular risk factors to prevent or delay the onset and development of cardiovascular disease (CVD). Whilst careful attention needs to be paid to the assessment and modification of individual risk factors, for any “high-risk” individual (which includes all people with type 2 diabetes), the greatest benefit will come from attacking aggressively all relevant risk factors, irrespective of the baseline, and not from an excessive focus on one factor to the possible exclusion of others: in other words, a broadly based approach. This approach is followed in the most recent guidelines from the Joint British Societies (Wood et al 2005) and the American Diabetes Association (ADA 2007). Readers may also find it useful to refer to a 2006 review by Marshall and Flyvbjerg published in the BMJ (Marshall & Flyvbjerg 2006).
UNDERSTANDING CARDIOVASCULAR RISK
DEFINITIONS
These concepts are relevant when quantifying and describing risk.
WHAT FACTORS ARE ASSOCIATED WITH CARDIOVASCULARRISK IN PATIENTS WITH DIABETES?
Cardiovascular risk factors can be divided into nonmodifiable and modifiable (see Table 4.1). Only modifiable factors can respond to intervention. However, some nonmodifiable risk factors are needed to calculate global cardiovascular risk and, if present, can serve as a prompt to help identify those individuals in whom this risk should be assessed and “tackled”, particularly in people normally considered to be at lower risk, such as those without diabetes.
TABLE 4.1 Cardiovascular risk factors and markers in people with diabetes mellitus
| Nonmodifiable risk factors | Modifiable risk factors |
|---|---|
| Age | Smoking status |
| Gender | Raised blood pressure |
| Ethnic group | Dyslipidaemia |
| Family history | Lack of physical activity |
| Poor diet | |
| Obesity | |
| Poor glycaemic control | |
| Excess alcohol | |
| Elevated fibrinogen | |
| Cardiomyopathy | |
| Raised inflammatory markers | |
| Microalbuminuria | |
| Hyperhomocysteinaemia |
Although individual risk factors may have an independent effect upon the global cardiovascular risk, their overall effect upon cardiovascular risk is often more than additive, with different risk factors combining “at times … to become permissive for harm or create harm greater than that effected by simple addition” (Simmons 2002). In 1993 the MRFIT study demonstrated that the greater than additive adverse effect of a collection of risk factors is especially marked in diabetes, where the increase in risk attributed to any single or combination of risk factors is doubled when compared to a nondiabetic population (Stamler et al 1993). There are still gaps in the evidence base. Matters become more complicated when evaluating the efficacy of various interventions.
CARDIOVASCULAR RISK MODELS
Risk prediction tables have been used in the UK since the mid 1990s. Initially for primary prevention, the Department of Health recommended a threshold of annual risk for a CHD event of 3%, now reduced to 1.5%, above which the prescription of expensive drugs could be justified. The latest Joint British Societies’ guidelines, consistent with the aim of preventing CVD events, have a threshold of annual risk for a CVD event of 2% (Wood et al 2005).
Many risk models have derived their data from the Framingham Heart Study. These models predict risk for CVD, CHD or stroke, either over a period of 5 or 10 years or annualised. The calculations included age, gender, smoking status, blood pressure (some include only systolic blood pressure), lipid profile (total cholesterol and high-density lipoprotein), the presence or absence of diabetes, and the presence or absence of left ventricular hypertrophy. Several other geographical and time-based cohorts have been used to generate risk models. Ideally, the risk calculator should be incorporated into the software being used during the consultation. A current favourite risk model is the updated New Zealand Calculator (derived from Framingham), as it incorporates decision support and can be used to inform patients of the effectiveness of modifying risk factors (New Zealand Guidelines Group 2003).
All of these models have several flaws, listed in Table 4.2, and any calculation using models derived from Framingham data or other population cohorts should be applied with caution. The main limitations are:
TABLE 4.2 Potential drawbacks of cardiovascular risk prediction tools
| Applicable to both diabetic and nondiabetic populations | Applicable to a diabetic population |
|---|---|
| The use of shorter fixed time spans, as opposed to long-term or lifetime | Under-representation of diabetics in the study populations, leading to a smaller database upon which to base calculations of risk |
| Annualised risk does not reflect the incremental increased incidence of CVD with age | While risk models regard diabetes as a categorical variable, they ignore the level of glycaemia, which is probably an important predictor of CVD and CHD in patients with type 2 diabetes (Turner et al 1998) |
| Failure to include all the relevant risk factors contributing to cardiovascular risk | Failure to include important markers or factors associated with increased cardiovascular risk in diabetics, such as microalbuminuria and raised serum triglycerides |
| The lack of valid data for certain ethnic groups | |
| Failure to take into consideration the confounding effect of modern treatments | |
| Different risk engines will give different risk predictions with the same data |
The UKPDS database was used to produce a diabetes-specific risk engine (Stevens et al 2001 – also available online: http://www.dtu.ox.ac.uk) to predict annual CHD risk (defined as fatal or nonfatal MI or sudden death). The calculation incorporates HbA1c, systolic blood pressure, TC:HDL-C ratio, age, sex, ethnic group, smoking status and time elapsed since diabetes was diagnosed. The engine can also report the different levels of risk for CHD, PVD and cerebrovascular disease. Unlike other databases, the UKPDS database is based upon an interventional study.
However, the UKPDS database and risk engine do have the following drawbacks:
RAISED BLOOD PRESSURE

RATIONALE
The presence of both raised blood pressure and diabetes mellitus in the same individual is a synergistic and potentially deadly combination. There is strong evidence to demonstrate that raised arterial pressure is a significant, and potentially treatable, contributor to the development of major diabetes complications, both microvascular (nephropathy, retinopathy) and macrovascular (CHD, major stroke). Much of this evidence comes from several large trials involving type 2 diabetics, starting with the UKPDS (Stratton et al 2000). Lowering blood pressure in type 2 diabetics reduces the risk of deaths and complications related to diabetes (UKPDS 1998a).
Raised blood pressure is more prevalent in the type 2 diabetic population than in the general population (SIGN 1997). At a cellular level, hypertension is associated with increased sodium retention and increased pressor responsiveness in diabetics compared to nondiabetics (Dawson et al 1993). In adult diabetics, other atherogenic risk factors (dyslipidaemia, elevated fibrinogen and left ventricular hypertrophy) are also more prevalent.
TARGETS
Neither research evidence nor expert consensus has found a level of blood pressure below which treatment does not confer benefit. The target blood pressure levels currently recommended by several learned bodies, summarised in Table 4.3, do not concur, but the overall trend has been downwards over recent years. If target organ damage is present, interventions should aim to achieve and maintain even lower target blood pressure levels. However, less strict targets may be appropriate in elderly or seriously ill patients with limited life expectancy.
TABLE 4.3 Target blood pressure levels for diabetics recommended by different organisations
| Blood pressure target (mmHg) | Learned body/organisation | Date published |
|---|---|---|
| 145/85 | New GP Contract | 2003, reviewed 2006 |
| 140/90 | NICE (North of England 2004) | August 2004 |
| 140/90 | NICE (NICE 2006a) | June 2006 |
| 140/80 | SIGN (SIGN 2001) | November 2001 |
| 140/80 | National Clinical Guidelines for Type 2 Diabetes (Hutchinson et al 2002) | October 2002 |
| 140/80 | UKPDS 36 (Adler et al 2000) | 2000 |
| 130/80 (optimal) | British Hypertension Society Guidelines | 2004 |
| 140/80 (acceptable) | BHS-IV (Williams 2004) | |
| 130/80 | American Diabetes Association (ADA 2007) | January 2006 |
| 130/80 | JBS 2 (Wood et al 2005) | December 2005 |
EVALUATION
Measurement of blood pressure
However, routine use of automated ambulatory blood pressure monitoring or home monitoring devices in primary care is not currently recommended by NICE (NICE 2006a): further research is needed to determine their precise role.
A variety of automated sphygmomanometers are now available. Before purchasing any model, the buyer is advised to enquire whether the device has passed independent validation using the protocols of the British Hypertension Society (BHS) and the Association for the Advancement of Medical Instrumentation Standard (AAMI) (O’Brien et al 2001). Additional useful advice may be available from the local hospital’s medical physics department. Further independent evaluation of the available blood pressure measuring devices is being undertaken and may be published at some point in the future.
Due to pressures of time and less than ideal ergonomics, many health professionals do not invariably measure a patient’s blood pressure correctly. Detailed authoritative guidance on how it should be done is given in Table 4.4, a counsel of perfection. To minimise inaccuracies, some key points to remember when measuring blood pressure include:
| Blood pressure measurement: procedure |
|---|
| Measure sitting blood pressure routinely: standing blood pressure should be recorded at least once at the initial estimation |
| Try to standardise the procedure: |
(from North of England 2004, O’Brien et al 2003, British Hypertension Society website)
INTERVENTIONS: OVERVIEW
The main aims here are to reduce the overall cardiovascular risk and prevent diabetes complications.
When is treatment indicated?
A single measurement is rarely sufficient to ascertain an individual’s “true” blood pressure level and, thus, to justify a decision on whether to treat. Repeated measurements need to be taken over a length of time (the 2006 NICE guidelines recommend at least two further separate readings). The duration of observation prior to a treatment decision depends upon how elevated the measurements are, and if target organ damage and/or any other vascular risk factors are present. If the measurements are elevated only slightly and there is no target organ damage in a “low-risk” individual, it is reasonable to observe over several months. If the measurements are elevated markedly or target organ damage is present in a “higher-risk” individual, a briefer duration of observation with earlier intervention is indicated.
INTERVENTIONS: PHARMACOLOGICAL METHODS
In support of the Diabetes NSF, the National Clinical Guidelines for type 2 diabetes published its recommendations for the pharmacological management of raised blood pressure in 2002 (Hutchinson et al 2002). However, these have been superseded by the 2006 guidelines from NICE (NICE 2006a), and the 2005 JBS 2 guidance on the prevention of CVD. The Quality and Outcomes Framework of the GMS contract sets a unified threshold for intervention and target (see Appendix 3).
Drug classes for the treatment of raised blood pressure
Although some of the supporting evidence came from trials comparing treatments against placebo, more data are now available comparing different effective treatments or combinations. An overview of this evidence is found in Table 4.5. The trials cited below are referred to by their acronyms, with their full names given in Appendix 5. The indications, cautions and contraindications for the major classes of antihypertensive drugs are summarised in Table 4.6.
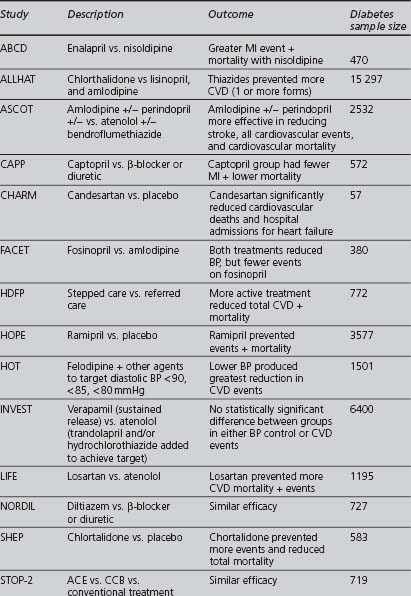

TABLE 4.6 Compelling and possible indications, contraindications and cautions for the major classes of antihypertensive drugs (Wood et al 2005)
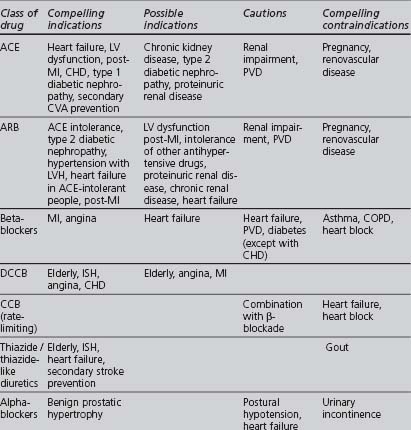
Further details of the names and dosages of different blood-pressure-lowering agents are given in Appendix 1 and in the BNF Section 2.
Angiotensin converting enzyme (ACE) inhibitors
Angiotensin-II has other actions that are thought to be harmful to the cardiovascular system, contributing to the pathogenesis of large and small vessel structural changes in hypertension and other CVD (Luft 2001). ACE inhibitors also suppress aldosterone secretion, increase renal blood flow (producing natriuresis) and increase circulating levels of bradykinin, a vasodilating cytokine which can cause cough. ACE inhibitors have little effect upon heart rate or airways resistance. ACE inhibitors have no adverse effects upon lipid metabolism or glucose tolerance, but there have been reports that they may be less effective in Afro-Caribbean patients. Drugs in this class have generic names ending in “-pril”. They include captopril, cilazapril, enalapril, fosinopril, imidapril, lisinopril, moexipril, perindopril, quinapril, quinopril, ramipril and trandolapril.
The ABCD (Estacio et al 1998) and FACET (Tatti et al 1998) studies found ACE inhibitors to be superior to dihydropyridine calcium channel blockers in preventing cardiovascular events in type 2 diabetics. ACE inhibitors have been shown to improve cardiovascular outcomes in high cardiovascular risk patients with diabetes, independently of whether hypertension was present (HOPE 2000, PROGRESS 2001). In the ASCOT study, the treatment group, in which the ACE inhibitor perindopril was the add-in drug, achieved lower blood pressures, had fewer CVAs and total CVD events, and lower all-cause mortality (Dahlöf et al 2005). Some of these differences could be attributed to the lower blood pressure levels achieved and improvements in other cardiovascular risk factors in this group. ASCOT was stopped early due to differences in mortality between the two treatment groups: as a result, it lacked sufficient power to detect a statistically significant difference between the groups for the primary endpoint (nonfatal MI or CHD death).
Angiotensin II receptor blockers (ARB)
Drugs in this class have generic names ending in “-sartan”. Currently available are candesartan, eprosartan, irbesartan, losartan, olmesartan, telmisartan and valsartan. Cautions and contraindications are the same as for ACE inhibitors. Both ACE inhibitors and ARB conserve renal function in diabetic nephropathy and are beneficial in heart failure.
In the LIFE study, an ARB was superior to a β-blocker in improving CVD outcomes in a subset of patients with diabetes, hypertension and left ventricular hypertrophy (Dählof et al 2002, Lindholm et al 2002). In the CHARM study, candesartan improved cardiovascular outcomes against placebo (Pfeffer et al 2003). The candesartan and lisinopril microalbuminuria (CALM) study (Mogensen et al 2000) suggested that the combination of the ACE inhibitor lisinopril with the ARB candesartan may be more effective in reducing blood pressure and urinary albumin excretion than the individual drugs in type 2 diabetics (although the study dose of lisinopril was only half the maximal dose).
Beta (β) blockers
The different β-blockers now available (generic names end in “-lol”) vary in:
Recently, doubts have been cast on whether the β-blocker atenolol does reduce cardiovascular mortality and stroke in hypertensive patients, despite its proven blood-pressure-lowering effect (Carlberg et al 2004). Because atenolol has been used as a reference drug in many studies, it is unclear whether these reservations apply to atenolol alone or to other β-blockers as well. β-blockers are not recommended as first-line drugs for “routine treatment” in the 2006 NICE guidelines.
However, the following need to be borne in mind:
Other currently available β-blockers not mentioned above are esmolol, nadolol, and timolol.
Calcium channel blockers (CCB)
L-type CCBs can be subdivided into three different classes:
A prospective randomised, blinded trial suggested that ACE inhibitors were more effective than CCBs at preventing myocardial infarction in hypertensive patients with diabetes and concerns were raised over the safety of CCBs (Estacio et al 1998). At the European Society of Cardiology meeting in 2000, Furberg and his colleagues presented their meta-analysis of several trials, finding no difference in the blood pressure levels achieved by CCBs and other drug classes, but suggested that patients receiving CCBs were at increased risk from certain major cardiovascular events (a question of safety or of efficacy?). The National Clinical Guidelines for Type 2 Diabetes in 2002, recommended prescribing long-acting (avoid short-acting) CCBs only as second-line treatment or as part of combination therapy (Hutchinson et al 2002). The INVEST study found that patients with CHD and hypertension (even in the diabetic subgroup) had a similar reduction in CVD mortality if treated with either verapamil or atenolol (Pepine et al 2003). ASCOT reported DCCBs to be safe and effective (Dahlöf et al 2005). The British Hypertension Society did not express concerns about the safety or efficacy of CCBs in their 1999 (Ramsay et al 1999) and 2004 (Williams 2004): DCCBs are one of the three drug class options recommended as first line by NICE in its 2006 guidelines.
Thiazide/thiazide-like diuretics
In the large ALLHAT trial (ALLHAT 2002), the thiazide chlorthalidone was found to be as effective as as amlodipine (a DCCB) and lisinopril (an ACE inhibitor) as an initial blood-pressure-lowering therapy for reducing cardiovascular events; also, chlorthalidone reduced heart failure when compared with amlodipine. The INSIGHT trial found no significant difference in the overall onset of cardiovascular events between co-amilozide and the CCB nifedipine (Mancia et al 2003). However, in ALLHAT increased rates of hypokalaemia and increased cholesterol and fasting glucose levels occurred on chlorthalidone, significantly when compared to lisinopril, but of minimal clinical significance when compared to amlodipine. In the ASCOT study, the group in which bendroflumethiazide was used as an add-in drug had a poorer cardiovascular outcome (Dahlöf et al 2006), but how much was this due to the effect of the first-line drug atenolol, the levels of blood pressure achieved or the effects on other cardiovascular risk factors? Nonetheless, thiazide diuretics remain recommended as first line in the 2006 NICE and ADA guidelines.
Alpha (α)-1 adrenergic blockers
The α-blocker arm of the ALLHAT study used doxazosin and was terminated after an interim analysis showed that doxazosin was significantly less effective than diuretic therapy (chlortalidone) in preventing cardiovascular events (ALLHAT 2000).
Spironolactone
The NICE 2006 guidelines recommend spironolactone as a possible add-in drug in difficult-to-treat hypertension when combinations of the three standard first-line agents have not lowered blood pressure sufficiently. Potassium-retaining diuretics need to be monitored carefully in patients with impaired renal function due to the risk of developing hyperkalaemia, particularly if combined with either an ACE inhibitor or ARB. Spironolactone can commonly cause gynaecomastia due to its anti-androgen effect. A recent population-based, case-control study claimed to find an association between spironolactone and upper gastrointestinal bleeding and ulcers (Verhamme et al 2006), although there may be confounding factors and causality was not proven.
Centrally acting, older and other antihypertensive agents
Which drugs should be chosen?
Which drug should be the initial therapy?
As stated above, five drug classes (ACE inhibitors, ARBs, β-blockers, CCBs and diuretics) have been shown to reduce cardiovascular events in individuals with both diabetes and hypertension (ADA 2004, Clinical Evidence online). Which of these drug classes should be the first-line therapy in patients with type 2 diabetes and raised blood pressure? There is no simple answer.
The most recent JBS guidelines concluded that “in general the various drug classes are about as effective as each other at reducing cardiovascular mortality and morbidity per unit fall in blood pressure” … with the caveat that there is “heterogeneity in response to different drug classes, optimal drug combinations, and specific categories of hypertension” (Wood et al 2005). The ADA recommends initial drug therapy with an agent from one of the five drug classes listed above (ADA 2004). For routine treatment, the 2006 NICE guidelines recommend choosing from ACE inhibitors, ARBs, DCCBs and diuretics, but not β-blockers, except in pregnant women or in patients with CHD and/or heart failure (NICE 2006a).
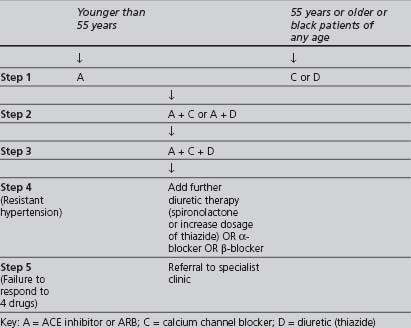
In the 2006 NICE treatment template (see Table 4.7), the reasoning behind drug selection is that hypertension can be classified as “high renin” and “low renin” and, as such, it is best treated initially with drugs that either inhibit the renin-angiotensin system (ACE inhibitor or ARB, known as A drugs) or those that do not inhibit the renin-angiotensin system (CCB or a thiazide diuretic – known as C or D drugs). “Younger” people (aged 55 years or less) tend to have higher renin levels in comparison to older people and blacks of all ages. Thus, the recommended initial therapy in the former group is a drug from the A group, and in the latter group a drug from the C or D group. This is a change from earlier (2004) NICE guidance which stated that there was “no compelling evidence” to support the opinion that different classes of drug are more effective in lowering the risk of developing CVD in either older or younger age patients (North of England Hypertension Guideline Development Group 2004).
TABLE 4.7 The NICE 2006 recommendations for combining blood-pressure-lowering drugs (NICE Clinical Guideline 2006a)
Nevertheless, the reader should bear in mind the findings of three studies:
There has been a debate as to whether ethnicity contributes to different outcomes in drug treatments; nevertheless, there is strong evidence that blood-pressure-lowering therapy reduces cardiovascular risk irrespective of ethnicity (ALLHAT 2000). Blood pressure in blacks often responds well to dietary salt restriction and there are theoretical reasons why thiazides and CCBs may be more effective in lowering blood pressure than β-blockers, ACE or ARB. However, a review by the University of York in 2004 (University of York 2004) concluded that “there is insufficient evidence that any antihypertensive drug or drug combination is superior in reducing morbidity and mortality outcomes in hypertensive black people.” There is also no evidence currently available to show that South Asians respond differently than white Europeans to blood-pressure-lowering medication. A recent meta-analysis suggested that adverse reactions to cardiovascular drugs, including ACE inhibitors and thrombolytic therapy, may be different between some ethnic groups: a factor that may influence clinical decisions about drug choices and doses (McDowell et al 2006).
Considering all of the above, the following approach seems sensible:
Combining drug groups rationally
The BHS 2004 Guidelines introduced a treatment template to assist practitioners to combine different drug classes in a rational and effective way. This was modified in the 2006 NICE guidelines, shown in Table 4.7. Ultimately, the aim should be to achieve the best possible blood pressure control, with minimal and tolerable side-effects.
DYSLIPIDAEMIA
RATIONALE

The combination of elevated levels of LDL with reduced levels of HDL predisposes an individual to the development of arteriosclerosis, regardless of whether diabetes is present. There is a direct and continuous association between total and LDL cholesterol levels in the serum and CVD risk, while serum HDL levels have an inverse correlation with CHD risk (Betteridge 1997). The “hallmark” of obesity is the over-production by the liver of VLDL, which is then converted to LDL and is often associated with elevated levels of triglycerides. LDL levels may also be raised due to defective clearance, which has many causes, including reduced numbers or activity of LDL-receptors. Elevated levels of TG have a major adverse effect upon CHD risk. In contrast, HDL has several anti-atherogenic actions. Low HDL-C increases vulnerablity to the dynamic features of atherogenesis (often mediated by raised LDL-C): these include cholesterol accumulation, inflammation, pro-thrombotic activity, matrix fragilisation and oxidative stress. Cholesterol levels can be affected by both genetic (e.g. familial hyperlipoproteinaemias) and environmental factors, and by the presence of other conditions, such as hypothyroidism and obstructive liver disease. Individuals who migrate from a country with a lower prevalence of CVD to a country with a higher prevalence often alter their eating habits and other behaviours accordingly, resulting in a CVD risk closer to that of their new country’s endogenous population.
There is now strong evidence that improving the lipid profile, particularly in lowering LDL-C, does reduce significantly the incidence of CHD mortality and morbidity in individuals at higher risk (Baigent et al 2005).
TARGETS
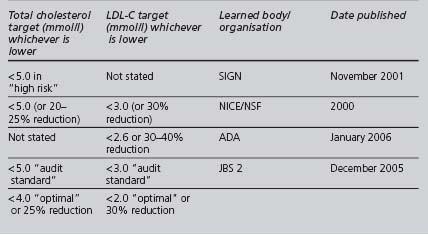
The range of targets recommended by these and other authoritative bodies is summarised in Table 4.8. The current national policy (NICE and NSF) for lipid targets (whichever results in a lower absolute level) is a total cholesterol less than 5.0 mmol/l (or reduced by 20–25%), and a LDL-C less than 3.0 mmol/l (or reduced by 30%), instead of JBS2’s lower recommended optimal levels. However, these targets may be revised when NICE issues its guidance on lipid modification (at writing, due December 2007). As with other risk factors, it is sensible to set less strict targets in some older patients with a limited life expectancy.
The new GMS contract QOF’s only current lipid target is a total cholesterol of less than 5.0 mmol/l, although this could change in the future. Looking at the most recent evidence, simply achieving this target may not correct an atherogenic lipid profile sufficiently, especially in high-risk patients. Primary care teams should consider setting a target for LDL-C, and possibly HDL-C and triglycerides, in high-risk patients.
INTERVENTIONS: PHARMACOLOGICAL MANAGEMENT
In support of the Diabetes NSF, the National Clinical Guidelines for Type 2 Diabetes published its recommendations in 2002 for the management of “abnormal” serum lipids (McIntosh et al 2002). Following the findings of several important studies, this guidance has now been superseded by the JBS 2 guidelines published in December 2005:
The American Diabetes Association’s 2006 recommendations are quite similar to JBS 2:
Once started on treatment, patients require earlier review to monitor the response to and the safety of their treatment. A combination of lipid-regulating drugs may be required in high-risk individuals who require aggressive correction of their dyslipidaemia. There are little data available on the reduction in cardiovascular events in patients on combinations of a statin and either a fibrate or nicotinic acid.
Although this meta-analysis has some limitations (varying definitions of diabetes, three studies combined results for coronary events and stroke, two studies used gemfibrozil, effects of dose were not explored), it was published after JBS2 and may have important implications for clinical practice: probably “all” patients with type 2 diabetes should receive statin treatment if their LDL-C is equal to or greater than 2.0 mmol/l (Reckless 2006), going beyond the JBS 2 guidelines discussed above.
Statins
Several well-publicised trials demonstrated that pravastatin (CARE [Goldberg et al 1998], LIPID 1998, PROSPER [Shepherd et al 2002], WOSCOPS 1998) and simvastatin (Scandinavian Simvastatin Survival Study and MRC/BHF) reduced both total and LDL cholesterol levels and were effective in the primary and secondary prevention of CHD, although the cholesterol levels achieved in many patients in these studies fell short of the JBS 2 targets. In elderly individuals at high risk of developing vascular disease, pravastatin reduced the risk of CHD after 3 years (Shepherd et al 2002). Three recent studies have provided the strongest evidence base for the benefits of lipid lowering using statins in type 2 diabetics:
Furthermore, a meta-analysis of 14 RCTs concluded that an absolute reduction in LDL-C, independently of the baseline level, reduces CVD risk (relative risk reduction of 21% in CVD events per mmol/l reduction in LDL-C). This effect appears to apply equally to subgroups in which there had been previous uncertainty, such as people with diabetes and no pre-existing vascular disease and people aged more than 75 years (Baigent et al 2005).
Although, in its 2006 technology appraisal of statins, NICE accepted that statin therapy is “cost-effective” in type 2 diabetics, it concluded “that the decision whether to initiate statin therapy in diabetics should be made where a clinical assessment has estimated the CVD risk to be likely to be equivalent to at least 20% over 10 years.” Since NICE noted that there were “no data on clinical events to suggest the superiority of any one statin over all the others in reducing cardiovascular events”, it recommended initial statin therapy using “a drug with low acquisition cost” (NICE 2006b).
Some of NICE’s conclusions may seem a little surprising as:
A “new generation” synthetic statin, rosuvastatin, is more potent than other statins in lowering LDL-C levels (achieving up to 45–50% reduction). In the ASTEROID study patients with existing atheroma were all prescribed maximal dose (40 mg) rosuvastatin for 2 years. Not only did a significantly better lipid profile (lower LDL-C and higher HDL-C) result, but a “significant” median reduction in fatty deposits occurred, suggesting that the treatment produced a regression in the build up of fatty deposits in the coronary arteries (Nissen et al 2006). Due to lack of controls on a lower dose of rosuvastatin or on a high dose of another statin, and the relatively short duration of this study, further research is needed to answer the following important questions:
ASTEROID reported “infrequent” side-effects, despite previous reports of increased risk of serious muscle toxicity associated with rosuvastatin, particularly in certain subpopulations (renal impairment, hypothyroidism, Japanese and Chinese origin, alcohol abuse, concomitant use of fibrates) to the US Food and Drug Administration (FDA) and other regulatory bodies. These led to revised guidance being issued in 2004 for prescribing rosuvastatin, advising that mainly the lower doses of 5–10 mg should be prescribed in primary care, with the maximum dose of 40 mg to be prescribed only under close (i.e. specialist) supervision and with greater caution. NICE indicated that, particularly with insufficient data on clinical events currently available for rosuvastatin, there is “significant uncertainty” over rosuvastatin’s cost-effectiveness (NICE 2006b). Currently, rosuvastatin is a second-line drug, but it may be increasingly used when “older” statins fail to achieve the progressively “tighter” targets set by authoritative bodies.
A note of caution should be introduced at this point. Statins do not produce significant increases in low HDL-C levels. Women and non-Caucasians were not always well represented in lipid-lowering interventional studies and currently there are no published studies reporting the effect of lipid-lowering therapy on “hard” cardiovascular outcomes in any population originating from the Indian subcontinent (Winocour and Fisher 2003). Being a female and/or nonwhite diabetic does increase an individual’s susceptibility to the adverse effects of many cardiovascular risk factors. However, it is reasonable, until further evidence is published, not to allow the patient’s gender or ethnicity to influence decisions about the type of therapy to reduce cardiovascular risk.
“At the end of the day” while there may be some subgroups of type 2 diabetics in whom the evidence for the benefits of statin therapy may be considered less robust than in others (Drugs and Therapeutics Bulletin 2006), there is a clear consensus in the guidance from JBS2 and the ADA: all type 2 diabetics aged over 40 (and many aged under 40) are at increased CVD risk, regardless of baseline levels, and should be on a statin.
Fibrates
Fibrates are broad-spectrum, lipid-modulating agents. Their use can lead to:
The currently available fibrates are bezafibrate, ciprofibrate, fenofibrate and gemfibrozil.
Five randomised controlled trials (RCTs) found that fibrates, compared to placebo, have a “beneficial effect” upon cardiovascular mortality and morbidity and improve triglyceride levels (Clinical Evidence online). However, questions over safety were raised in two primary prevention studies (Koskinen et al 1992), while two secondary prevention studies suggested that fibrates were quite safe (Heinonen 1994, Rubins et al 1999).
The Fenofibrate Intervention and Event Lowering in Diabetes (FIELD) trial, comparing treatment with fenofibrate against placebo, provided mixed results. Fenofibrate did not significantly reduce the risk of the primary trial outcome of major coronary events. However, in the group treated with fenofibrate, there were fewer total cardiovascular disease events and a significant reduction in microvascular-associated complications. Fenobrate appeared also to be generally well tolerated in type 2 diabetics (Keech et al 2005).
Since statins are less effective in raising low HDL-C, alternative drug classes (such as fibrates and nicotinic acid group) need to be considered in lipid management. Despite the problems associated with combining gemfibrozil and the withdrawn statin cerivastatin, the need to raise HDL-C levels, along with lowering LDL-C and TG levels, may prompt the clinician to consider prescribing a statin–fibrate combination. Compared with fluvastatin plus placebo, fluvastatin plus fenofibrate significantly improved lipid profile in people with type 2 diabetes, dyslipidaemia, and history of CHD (Derosa et al 2004). It appears that this combination is relatively well tolerated, provided that renal, hepatic and thyroid function remains normal with CPK levels being monitored and that any muscle pains are promptly reported.
Cholesterol absorption inhibitors
There are no systematic reviews or RCTs in people with diabetes and higher risk for macrovascular complications comparing ezetimibe versus placebo, or comparisons of different doses for CVD outcomes (Clinical Evidence online). However, compared with statin plus placebo, statin plus ezetimibe significantly improved the lipid profile in type 2 diabetics over 8 weeks (Simons et al 2004). Adding ezetimibe to a statin is much more expensive than maximising the dosage of the statin. When aggressive LDL-C lowering is required, ezetimibe may have a role: either in combination with a statin beyond a maximal statin dose or as an alternative if statins are contraindicated or not tolerated. At the time of writing, NICE plans to issue a technology appraisal of ezetimibe in 2007.
Nicotinic acid group
They appear to act in several ways, including partial inhibition of free fatty acid release from adipose tissue, increased lipoprotein lipase activity and decreased hepatic synthesis of LDL-C; thus producing lower LDL-C and triglyceride levels. Nicotinic acid was reported to increase HDL-C levels significantly in one RCT. However, a large proportion of this study’s subjects were also taking a statin (Grundy et al 2002). Nicotinic acid’s side effects, especially vasodilatation, can be troublesome. It also worsens glucose tolerance (it may precipitate diabetes).
Acipimox has fewer side effects than nicotinic acid, but may be less effective.
Fish oils
Fish oils reduce serum triglycerides. There are two preparations currently available:
Increased consumption of fish oils has been recommended for some time, as this was said to be linked with a number of positive health outcomes, including protection from cardiovascular disease (Brunner 2006). However, a recent systematic review concluded that “long chain and shorter chain omega 3 fats do not have a clear effect on total mortality, combined cardiovascular events, or cancer” (Hooper et al 2006).
Selection of drug therapy
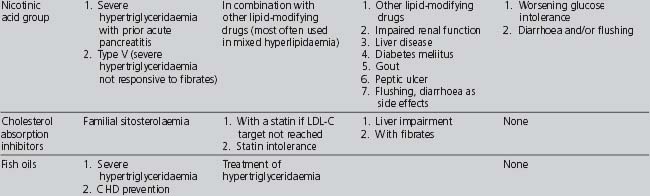
Table 4.9 summarises the indications, cautions and contraindications relating to the different classes of lipid-modifying drugs.
TABLE 4.9 Compelling and possible indications, contraindications and cautions for the major classes of lipid-modifying drugs (Wood et al 2005)
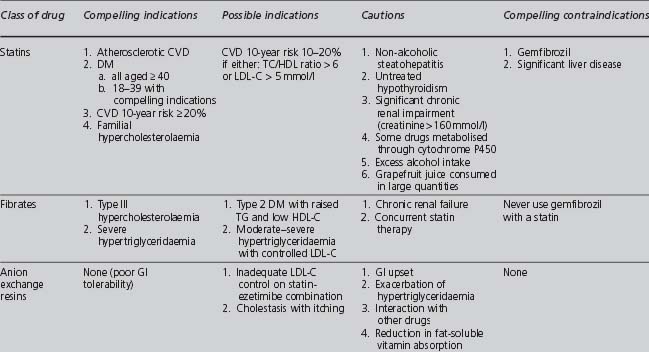
If target lipid levels are not achieved with the first-line drug, then the following need to be considered:
OBESITY
DEFINITIONS AND TERMINOLOGY

The World Health Organization (WHO) defines obesity as “a disease state in which excess fat has accumulated to an extent that health may be adversely affected.” The WHO categorises body weight into: normal weight, overweight, obesity and severe obesity, using the body mass index (BMI), expressed as kg/m2. NICE defines “morbid” obesity as greater than 40 kg/m2 or between 35 and 40 kg/m2 with other significant disease (e.g. diabetes, hypertension) (NICE 2002).
RATIONALE
From a public health perspective, obesity is becoming an “epidemic”, contributing to the relentlessly rising prevalence of metabolic syndrome and diabetes. In England 66% of men and 55% of women are classified as either overweight or obese (Department of Health 2004). The Department of Health has issued guidance available on its website (DoH 2006).
TARGETS
EVALUATION
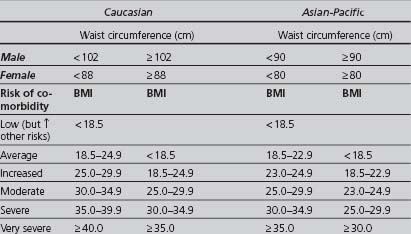
BMI = weight (in kilograms) divided by the square of height (in metres).
The waist circumference is measured half way between the lowest point of the rib cage and the iliac crest (Despres & Lemieur 2001). It is an essential criterion for the diagnosis of metabolic syndrome, and a better predictor than BMI of cardiovascular and metabolic risk. In 2003 Diabetes UK produced a stratification of co-morbidity risk, correlated with BMI and waist circumference in adults, summarised in Table 4.10.
INTERVENTIONS
As with other risk factors, the most important component in the management of obesity is changing the patient’s behaviour. The imbalance between an excessive dietary calorific intake and an inadequate level of physical activity needs to be reversed. The target weight and rate of loss should be negotiated. When weight loss is an important on-going activity for the patient, more frequent reviews may be needed to monitor progress and to encourage the patient. Specialist help should be sought if the patient is very obese or fails to respond to medical interventions.
Anti-obesity drugs
Gastric reduction (bariatric) surgery
In the NICE 2006 guidance, “bariatric surgery is recommended as a treatment option for adults with obesity if all of the following criteria are fulfilled:
NICE did not recommend any particular type of surgery to aid weight loss. The choice of surgical treatment should be made jointly by the individual and the doctor, taking into account individual factors (NICE 2002). Regional centres are now carrying out surgery on a regular basis.
Gastric reduction can be performed laparoscopically (using an adjustable LAP-BAND) in which the functional capacity of the stomach is permanently reduced by partitioning off of a small segment of the body of the stomach. This results in a reduced food intake, producing substantial and sustained weight loss in patients with a BMI greater than 35 kg/m2. It does appear to improve some of the major cardiovascular risk factors (Campbell & Rössner 2001), but there are no current data to compare the long-term benefits and risks of surgery with medical management in diabetics. In a severely obese nondiabetic population, the Swedish Obese Subjects Study reported improvements in lifestyle (lower energy intake and increased physical activity), hypertension and some biochemical variables (lower triglycerides and uric acid, but not hypercholesterolaemia) in those who underwent gastric surgery, compared to those who received conventional medical treatment (Sjöström et al 2004). Technically, this procedure may be difficult or impossible in patients whose BMI is very large (such as greater than 55 kg/m2), where gastric bypass is preferable.
REDUCING PLATELET ADHESIVENESS
RATIONALE
Platelets are involved in the development of atherosclerosis and vascular thrombosis. In vitro evidence suggests that diabetics are often more sensitive to platelet-aggregating agents. Thromboxane is a potent vasoconstrictor and platelet aggregator. In patients with type 2 diabetes and cardiovascular disease, thromboxane production is increased. Aspirin blocks thromboxane synthesis by acetylating platelet cyclo-oxygenase.
A recent systemic review found that relative risk of intracranial haemorrhage in patients treated with thrombolytic therapy was about 50% greater in Afro-Caribbean patients when compared to nonblack patients (McDowell et al 2006).
RECOMMENDATIONS
There is a clear consensus between the recommendations produced by JBS 2 (Wood et al 2005), the ADA (ADA 2007) and Diabetes UK that, unless contraindicated, aspirin should be prescribed in the dose range 75 to 150 mg to all patients with type 2 diabetes and existing CVD. Diabetes UK qualifies this with a lower age limit of 30 years (Diabetes UK 2001). Although all of these bodies recommend that, unless contraindicated, aspirin should be prescribed to most type 2 diabetics without evidence of CVD, the criteria vary:
For JBS 2, the criteria for prescribing a recommended dose of 75 mg are:
For the ADA, the criteria for prescribing a recommended dose of 75 to 162 mg are:
For Diabetes UK, the criteria for prescribing a recommended dose of 75 mg are:
In a 2006 clinical review, Marshall and Flyvberg go further than the above and recommend that low-dose “aspirin should be prescribed for patients aged over 40” (Marshall & Flyvberg 2006). Bearing in mind that type 2 diabetics require an approach based upon secondary prevention interventions (even in the absence of CVD) and that aspirin is under-prescribed, this recommendation has considerable merit.
OTHER RISK FACTORS
GENDER
If the profile of other risk factors is otherwise similar, then healthy pre-menopausal females should be at less risk of developing CVD than their male contemporaries. However, in diabetic pre-menopausal females, this normally protective cardiovascular effect is lost (Barrett-Connor et al 1991). There is evidence that the presence of a cardiovascular risk factor sometimes has a greater adverse effect upon women than upon men when diabetes is present: for example, women appear to be more susceptible to the adverse effects of both active and passive smoking upon cardiovascular risk.
A meta-analysis of prospective cohort studies concluded that the excess risk for fatal CHD mortality associated with diabetes is greater in women (3.5 odds ratio) than in men (2.06 odds ratio) and the “adjusted pool” ratio of relative risks in women compared to men was 1.46. However, the analysis could not adjust for menopausal status (and hormone replace therapy) and duration of diabetes, which may be potential confounding factors (Huxley et al 2006).
ETHNICITY
Another aspect of ethnicity in respect to CVD that needs to borne in mind is that the risk of adverse reactions occurring to some cardiovascular drugs may vary between ethnic groups. Although sound clinical judgement must be the basis of any treatment decisions and considerably more research is needed, clinicians should be aware of potentially variable outcomes to drug treatment within the context of a risk assessment for that intervention (Eliasson 2006).
AN “ALTERNATIVE” VIEW OF TARGETS

Two papers (Winocour 2002, Law & Wald 2002), published in the same issue of the British Medical Journal in 2002, analysed the benefits and problems associated with striving to achieve the targets advised by the various expert bodies and performance contracts.
in addition to prescribing for other medical problems!
Many patients would find such a regimen unacceptable or difficult. The factors that influence concordance are complex and vary between individual patients. Both once- and twice-daily regimens are associated with better concordance than three or more daily doses. Once-daily dosing has the advantage over twice-daily of reducing the tablet “load”. However, in patients known to miss medication, twice-daily dosing may result in shorter periods of sub-therapeutic medication levels (Wright 1993). Medication regimens may be simplified by combining more than one active drug in a single agent. There is evidence to suggest that fixed-dose combination pills and unit-of-use packaging are likely to improve adherence, although this has not been quantified (Connor et al 2004). Providing patients with a pocket-sized tablet dispenser holding one day’s tablets in up to three doses has been shown to improve adherence and glycaemic control (Maier et al 2006).
Winacour proposed alternative targets for glycaemic and blood pressure control (see Table 4.11). It may be preferable to set pragmatic individualised targets, in full collaboration with the patient and aiming to improve the adverse measurement of each component, rather than to pursue inflexibly several simultaneous “tough” targets.
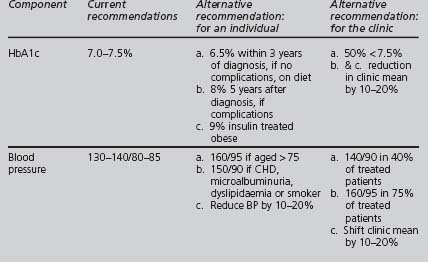
Law and Wald argue that variables, such as blood pressure, serum cholesterol, and body mass index, have a dose–response relationship with the diseases that they “cause”. They also argue “that a given change in the variables reduces the risk of disease by a constant proportion of the existing risk irrespective of the starting level of the variable or existing risk”, concluding that a patient’s overall absolute level of risk, not the level of individual risk factors, should determine the threshold for intervention. If a patient is at high risk, then appropriate intervention targets should require substantial changes in all reversible risk factors simultaneously. This is supported by the findings from the MRC/BHF Heart Protection Study that high-risk patients benefited from statin treatment, irrespective of pre-treatment cholesterol levels (Collins et al 2002). Greater risk reduction results from a significant change that falls short of reaching a fixed endpoint than from minimal change that does reach that endpoint.
Perhaps, the important messages are that:
