[level-membership-for-internal-medicine-category]
Chapter 44 Radionuclide Imaging of Inflammation in Atheroma
INTRODUCTION
Over 16 million people in the United States1 are afflicted with coronary artery disease. Approximately 785,000 of these individuals will experience a sudden coronary event in 2009, and about 152,000 will succumb to the acute process. Although identification of each person at risk is the ultimate clinical goal, it is most desirable to definitively identify the subset of patients who are most likely to suffer an acute coronary event. In 60% to 80% of patients, the acute event is caused by thrombotic occlusion of the vessel due to rupture of an atheroma in the coronary artery; in a minority (especially patients < 50 years old and smokers), the occlusion results from erosion of endothelial cells overlying the plaque (likely due to apoptosis of endothelial cells, exposing thrombogenic proteoglycans and microparticulates2). Lesions undergoing plaque rupture occupy a significant fraction of the circumference of the vessel, contain numerous inflammatory cells in the necrotic core, have a thin cap (<65 μm) separating the atheroma from blood in the vessel lumen, and have a marked increase in vasa vasorum.3 Diagnostic targeting strategies should identify plaques vulnerable to rupture or endothelial erosion.
EVOLUTION OF ATHEROSCLEROTIC LESIONS
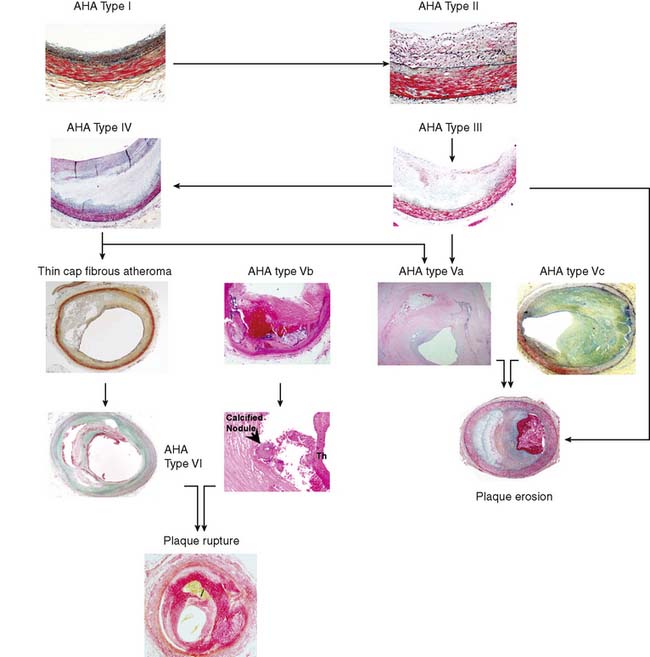
The American Heart Association (AHA) classifies atherosclerotic lesions from type I through VI based on the severity of the disease (Fig. 44-1).4 Type I plaque is an adaptive lesion consisting mostly of smooth muscle cells (SMC) with or without scattered macrophage infiltration. Type II plaque is a fatty streak consisting of foam cell infiltration. Type III plaque shows pools of extracellular lipid, but no necrotic core is formed; the extracellular matrix predominantly consists of proteoglycans. Type IV plaque has a well-defined necrotic core with overlying fibrous cap consisting of SMC and evolving collagenous matrix. Type V lesions demonstrate a thick fibrous cap consisting of a predominantly fibrotic lesion (type Vc) with calcification (type Vb) or deep-seated necrotic core (type Va). Type VI is a classic plaque rupture that shows a region of fibrous cap disruption that allows continuation between the necrotic core and overlying luminal thrombus. Although this histologic classification has neat groupings, clinically, patients do not progress linearly from types I to VI. To make the classification more relevant, several authors have proposed modifications to this classification system. One such classification suggested by Virmani and colleagues5 classifies lesions based on the morphologic description of the fibrous cap and neointima and their progression to complicated lesions. They have categorized atherosclerotic plaques as “intimal thickening” (equivalent to AHA type I), “intimal xanthoma” (type II), “pathologic intimal thickening” (type III), and “fibrous cap atheroma” (similar to types IV and V). The unique features of the Virmani classification include linking of pathologic intimal thickening (SMC + proteoglycan-rich lesions, equivalent to AHA type III) to acute coronary syndromes associated with plaque erosion, and description of an entity referred to as thin fibrous cap atheroma. The latter is a precursor of plaque rupture–related acute coronary syndromes. This classification has incorporated repeated cycles of healing on plaque ruptures and erosions toward development of more advanced lesions. On the other hand, the newer classification also assigns significance to calcific nodules in predisposition to the luminal thrombus. The morphologic characteristics of the atherosclerotic lesions described in the new classification are compared with the AHA classification in Figure 44-1.
PATHOGENETIC BASIS OF INFLAMMATION IN ATHEROSCLEROSIS
Atherosclerosis involves both an inflammatory response to lipid deposition in the vessel wall and an immunologic response of the endothelium to the injury. Damage to the vascular intima is initiated by various factors, including shear stress and, most important, hyperlipidemia.6–8 Endothelial damage causes expression of selectins and adhesion molecules by the endothelial cell. These chemotactic factors cause recruitment of circulating monocytes to the region of injury; these cells migrate into the subendothelial layer. There, the short-lived monocytes are transformed into long-lived macrophages.9 The macrophages phagocytize and start to metabolize low-density lipoprotein (LDL) cholesterol. In the process of metabolism, oxidative products are generated, leading to the formation of oxidized LDL cholesterol, both in the intracellular and extracellular environment. Oxidized LDL cholesterol causes greater inflammation, is difficult to metabolize, and in high concentration is toxic to the macrophages. Modified (mainly oxidized) LDL enters the macrophages through scavenger LDL receptors, which are not inhibited by the intracellular lipid contents, allowing the cells to continue gorging themselves on this relatively indigestible irritant. As large quantities of LDL cholesterol and oxidized LDL cholesterol accumulate in the macrophages, they become lipid-laden foam cells. Large quantities of intracellular oxidized LDL cholesterol causes death of the macrophages, in part by apoptosis10 and in part due to necrosis. Part of the process of apoptosis is production of caspase-1 by the mitochondria of the macrophage. Caspase-1 production is associated with increased production of matrix metalloproteinases, resulting in degradation of stromal tissue containing the lesion.11 These foam cells are restricted from moving away from the subintimal space. Concurrent with the release of selectins and attraction of monocytes to the site of injury, the injured endothelium releases substances that induce phenotypic alteration of medial SMC from contractile cells to the proliferating phenotype. The transformed smooth muscle cells migrate to the neointima.
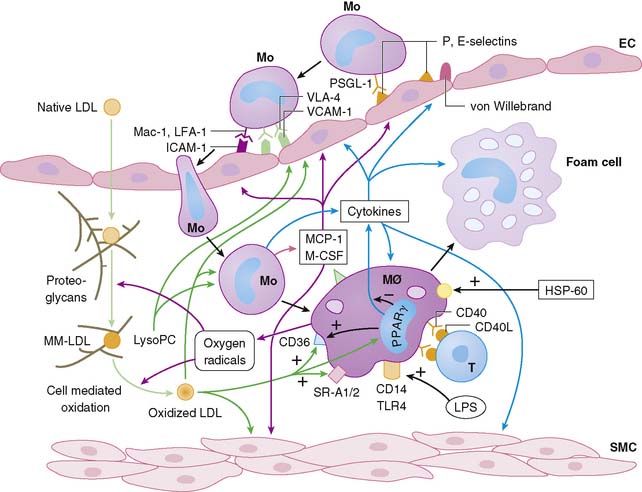
The macrophage infiltration in the vessel wall follows a systematic process that includes reversible adhesion of the monocytes to the injured endothelium, followed by monocytic activation, leading to a more permanent binding and eventual subendothelial migration of monocytes (Fig. 44-2).12 The initial injury to endothelial cells induces expression of integrin molecules such as E-selectin or P-selectin. Corresponding integrin moieties on the monocytes, such as L-selectin, facilitate interdigitating interaction between the endothelium and circulating monocytes that slows the monocytes as they start to roll along the vessel wall. Chemotactic peptides cause the monocytes to adhere to the injured endothelium. In the absence of chemoattractants, the selectins are shed, and the monocytes roll back to the bloodstream. The interaction of the endothelial chemoattractants and their receptors on monocytes lead to activation of β1– or β2-integrins (such as LFA-1, VLA-4, or Mac-1). These integrins bind firmly to endothelial expression of adhesion molecules of an immunoglobulin gene superfamily such as intercellular adhesion molecule 1 (ICAM-1), ICAM-2, and VCAM-1. The multipronged attachment of the monocytes to the endothelium commits monocytes to permeate through the endothelial cell junctions, mediated by co-adherins. In addition to the monocyte/macrophage infiltration, both PMNs and mast cells appear to play important roles in plaque rupture. Immune histology studies demonstrated that mast cells localize in the shoulders and cap of the plaque, suggesting a role for these cathepsin G–producing cells in plaque rupture.13
APPROACHES TO IMAGING ATHEROMA
There have been multiple radionuclide approaches to imaging atheroma:
IMAGING INFLAMMATION IN CORONARY ATHEROMA
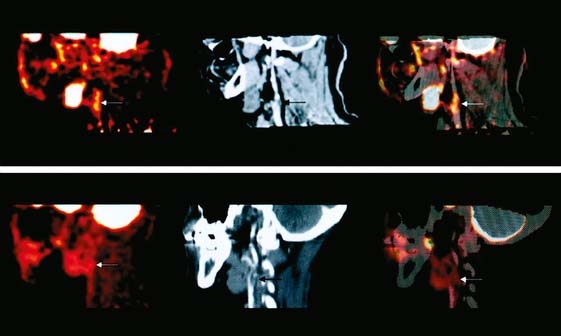
Even with PET technology, imaging inflammation in coronary atheroma is technically difficult. Histologic studies suggest that the average length of a necrotic core in atheromas of patients dying from an acute coronary event is about 8 mm, and the lesion typically occupies less than half of the 3- to 4-mm diameter circumference of the vessel.32,33 The spatial resolution of a state-of-the-art PET scanner is approximately 4 mm. As a result, the combination of small lesion size and limited spatial resolution (without considering approaches to eliminate respiratory and cardiac motion) make coronary atheroma inflammation imaging a substantial challenge. In spite of the resolution problem(s), the technique works because of the extremely high concentration of the metabolic tracer achieved in the highly activated cells. The primary energy source of activated macrophages in the lesion is glucose. The glucose is delivered to the macrophages both by vasa vasorum and less efficiently by diffusion from extracellular fluids. The numerous activated macrophages in the core concentrate a sufficient amount of the glucose analog, FDG, following intravenous injection of the tracer to be readily visualized on a PET scan. Recording the FDG PET data with a contemporaneous CT scan for anatomic localization provides the most precise information (Fig. 44-4). Although imaging the coronaries is the goal of vascular inflammation imaging, most investigators are applying FDG vascular imaging in vessels of larger diameter, such as the aorta, carotids, and iliac arteries, in part as a surrogate for coronary imaging.
The feasibility of FDG imaging of experimental atheroma was reported by Vallabhajosula and Fuster in 1996 and 1997.34,35 Subsequent observations demonstrated multiple focal sites of FDG uptake in the aorta of humans,36 where the intensity and number of sites of uptake correlated with risk factors.37,38 Similarly, sites of aortic FDG uptake were correlated with sites of calcification.39–41 Based on the pathology of calcified and noncalcified atheromas, it is not surprising that there was little overlap between the inflammatory and “tombstone” markers: Correlation between sites of aortic calcification and foci of FDG uptake were observed in 7% of patients in one series33 and in less than 2% of patients in another series35 when a criteria of greater than 130 Hounsfield units was employed as the CT criteria for calcification.
A study by Rudd et al., in eight patients undergoing carotid endarterectomy, reports the results of FDG scans and CT scans of their necks prior to surgery. The preoperative scan results were correlated with histology of the carotid specimens.42 These investigators demonstrated significant uptake of FDG in the lesions associated with more clinical symptoms. These lesions also demonstrated histologic evidence of inflammation. The investigators also performed an autoradiographic study, incubating endarterectomy specimens from three symptomatic patients with tritiated deoxyglucose. Autoradiographs of these specimens demonstrated uptake in macrophage-rich areas, with little uptake in other areas. FDG uptake in inflammation in carotid lesions was verified in a larger group of endarterectomy patients,43 where FDG uptake correlated with CD68 (macrophage-specific) staining of the endarterectomy specimen. Following these reports, studies to validate the short-term (2 weeks) and longer-term (>6 months) stability reproducibility of vascular FDG uptake were performed. Nineteen patients with carotid and iliofemoral atheromas had two FDG PET scans performed within 2 weeks.44 An intraclass correlation > 0.8 was observed. Another group of subjects had FDG studies of the carotids and aorta performed 2 weeks apart.45 Uptake in the carotid arteries had intraclass correlation, r > 0.9, while the stability of aortic uptake was lower, r = 0.7. Other investigators have applied the technique of FDG carotid imaging to compare the effect on carotid inflammation of simvastatin therapy to dietary therapy alone.46The investigators identified 43 cancer patients with FDG uptake in the carotid arteries. They randomized 21 subjects to receive simvastatin (dose range 5 to 20 mg) and 22 to diet therapy. Three months later, follow-up FDG PET/CT scan demonstrated a significant decrease in carotid uptake in the simvastatin group but no significant change in the group treated with diet alone.
The longer-term stability of FDG uptake is less certain.47 Fifty patients had PET/CT studies performed 8 to 26 months apart. Of the lesions with FDG uptake and no calcification, 48% demonstrated a changing pattern on the second scan, where the site of FDG was no longer seen, or a new site of FDG uptake was observed. A second study in 100 patients undergoing serial FDG PET/CT scans for cancer surveillance identified changes in 45% of sites on two FDG scans performed 6 months apart.48
There are still major hurdles for FDG vascular imaging to overcome to make the procedure clinically useful. In view of the number of sites of FDG vascular uptake in major vessels, it is apparent that vascular inflammation is present at many sites at the same time. Based on autopsy observations, healed plaque ruptures were observed in 61% of hearts in patients who subsequently died suddenly.49 This observation suggests that the number of ruptures is higher than the number of clinical events. As a result, FDG vascular inflammation imaging may have a very high sensitivity but a low predictive value for clinical outcome. There is a need to standardize data acquisition and analysis to produce both a score by individual lesion and a total score for each patient.
Most patients have multiple sites of uptake (>10 in the aorta alone)34 associated with different levels of intensity, suggesting that there is variation in lesion size and/or variation in the number of activated macrophages within a lesion. It is logical that the more intense and larger the region of uptake, the more likely the lesion is to rupture. However, this relationship requires a large clinical study for validation.
TARGETING OF APOPTOSIS IN ATHEROMA
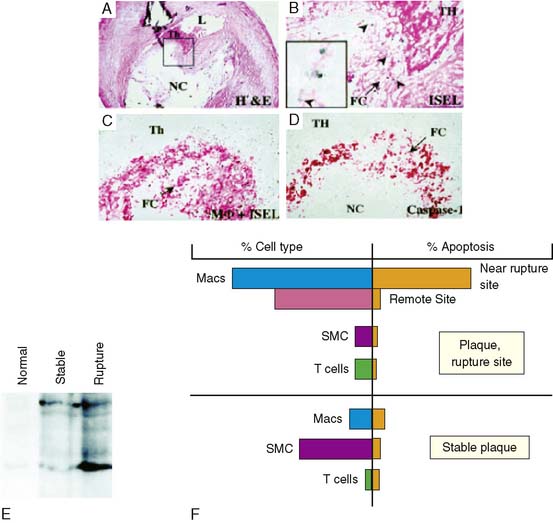
A strikingly high prevalence of apoptosis has recently been demonstrated in plaque rupture in the coronary arteries of victims of sudden cardiac death.50 These apoptotic cells surrounded the ruptured plaque site (Fig. 44-5). On the other hand, apoptotic cells were only occasionally observed in the regions of the same plaque remote from the site of rupture, such as in the shoulder triangle or deeper in the intima; similarly, relatively few apoptotic cells were observed in the stable plaques. The ultrastructural examination and immunohistochemical staining for the identification of cell type revealed that the apoptotic cells at the rupture site were predominantly macrophages; apoptotic smooth muscle or T cells were only occasionally seen. Immunohistochemical characterization revealed44 that the apoptotic macrophages predominantly expressed caspase-1; caspase-3 staining was less intense. Immunoblot studies of the plaques demonstrated active caspase-1 in the ruptured plaques (see Fig. 44-5). In contrast to the rupture site, fibrous caps of stable plaques demonstrated lower prevalence of macrophages and higher numbers of SMC; stable plaques showed a much lower frequency of apoptotic cells. In the stable plaque, the occasional positive apoptotic cell also co-localized with both caspase-1 and caspase-3; only unprocessed caspase-1 was present in stable plaques.
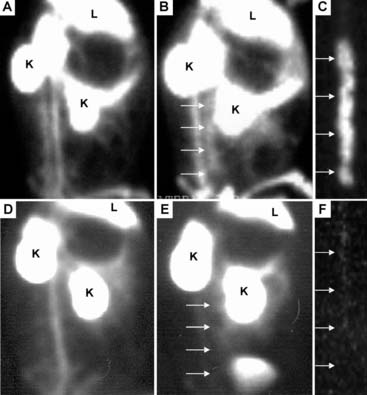
Since apoptosis may contribute to plaque vulnerability, we tested the ability of exogenous radiolabeled annexin V to detect atherosclerosis in vivo in a rabbit model.51 Animals were injected intravenously with 0.5 to 1 mg of annexin V labeled with 7 to 10 mCi of 99mTc for in vivo imaging studies, and after 3 hours there was clear delineation of radiolabeled annexin V within the abdominal aorta by in vivo gamma imaging (Fig. 44-6). In contrast, in vessels without plaques, at 3 hours after administration there was no localization of radiotracer within the normal vessel wall.
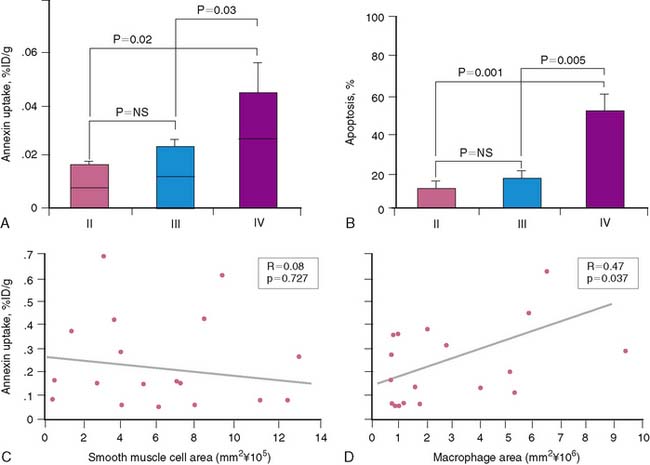
The accumulation of annexin V in atherosclerotic lesions was approximately 9-fold greater than in the corresponding control abdominal aortic region. The mean ± SEM %ID/g uptake in the specimens with lesions (0.054% ± 0.0095%) was significantly higher than the background activity in the normal specimens (0.0058 ± 0.001; P < 0.000). Aortic sections from atherosclerotic animals demonstrated microscopically detectable plaques displaying various lesion types. Approximately 20% of plaques were classified as intimal xanthoma (AHA type II), 30% pathologic intimal thickening (AHA type III), and 50% fibrous cap atheroma (AHA type IV). Total SMC and macrophage burden in the various lesion types were quantified. There were no significant differences in SMC burden among the three lesion types: intimal xanthoma, pathologic intimal thickening, and fibrous cap atheroma (0.54 ± 0.24 mm2, 0.64 ± 0.09 mm2, and 0.56 ± 0.14 mm2, respectively). In contrast, total macrophage burden was increased approximately twofold in fibrous cap atheroma (3.2 ± 0.93 mm2) compared with intimal xanthoma (1.6 ± 1.2 mm2) and lesions displaying pathologic intimal thickening (1.3 ± 0.73 mm2). The annexin V uptake was dependent on lesion severity (Fig. 44-7); the mean %ID/g uptake was significantly higher in aortic segments with fibrous cap atheroma (0.034 ± 0.006) than with intimal xanthoma (0.013 ± 0.002; P = 0.02) or lesions with pathologic intimal thickening (0.0169 ± 0.0032; P = 0.03). Differences in radiotracer uptake between intimal xanthoma and lesions with pathologic intimal thickening were not significant. Regression analyses of a combined sample of aortic sections from all lesion types demonstrated a positive correlation between the overall macrophage burden of the plaque and uptake of radiolabeled tracer (r = 0.47, P = 0.04). In contrast, there was no association between SMC burden and radiotracer uptake (r = 0.08, P = 0.73). Thus, it appears that annexin V has an affinity for macrophage-rich areas within the plaque.45
1. American Heart Association: Heart disease and stroke statistics 2009: Update Accessed at < http://circ.ahajournals.org/cgi/content/full/119/2/e21>
2. Leroyer A.S., Isobe H., Lesèche G., Castier Y., Wassef M., Mallat Z., Binder B.R., Tedgui A. Boulanger CM.Cellular origins and thrombogenic activity of microparticles isolated from human atherosclerotic plaques. J Am Coll Cardiol. 2007;49(7):772-777.
3. Moreno P., Purushothaman K.R., Fuster V., Echverri D., Truszcynska H., Sharma S.K., Badimon J.J., O’connor W.N. Plaque neovascularization is increased I nruptured atherosclerotic lesions of human aorta: Implication for plaque vulnerability. Circulation. 2004;110:2032-2038.
4. Stary H.C., Chandler A.B., Glagov S., et al. A definition of initial, fatty streak, and intermediate lesions of atherosclerosis. A report from the Committee on Vascular Lesions of the Council on Arteriosclerosis, American Heart Association. Circulation. 1994;89:2462-2478.
5. Virmani R., Kolodgie F.D., Burke A.P., Farb A., Schwartz S.M. Lessons from sudden coronary death: a comprehensive morphological classification scheme for atherosclerotic lesions. Arterioscler Thromb Vasc Biol. 2000;20(5):1262-1275.
6. Pasternak R.C., Abrams J., Greenland P., et al. 34th Bethesda Conference: Task force #1-Identification of coronary heart disease risk: Is there a detection gap? J Am Coll Cardiol. 2003;41:1863-1874.
7. Ridker P.M., Libby P. Risk factors for atherothrombotic disease. In Braunwald’s heart disease: A textbook of cardiovascular medicine, 8th ed, Philadelphia: Saunders; 2007:1004-1026.
8. Greenland P., Knoll M.D., Stamler J., et al. Major risk factors as antecedents of fatal and nonfatal coronary heart disease events. JAMA. 2003;290:891-897.
9. Mitchell R.N., Schoen F.J. Acute and chronic inflammation. In: Kumar V., Abbas A., Fausto N., Aste J.C., editors. Robbins & Cotran Pathologic Basis of Disease. 8th ed. Philadelphia: Saunders; 2010:496-506.
10. Laufer E.M., Reutelingsperger C., Narula J., Hofstra L. Annexin A5: an imaging biomarker of cardiovascular risk. Basic Res Cardiol. 2008;103:95-104.
11. Haider N., Hartung D., Fujimoto S., et al. Dual molecular imaging for targeting MMP activity and apoptosis in atherosclerosis: molecular imaging facilities understanding of pathogenesis. J Nucl Cardiol. 2009;16:753-762.
12. Osterud B., Bjorklid E. Role of monocytes in atherogenesis. Physiol Rev. 2003;83:1069-1112.
13. Mäyränpää M.I., Heikkilä H.M., Lindstedt K.A., Walls A.F., Kovanen P.T. Desquamation of human coronary artery endothelium by human mast cell proteases: implications for plaque erosion. Coron Artery Dis. 2006;17(7):611-621.
14. Davis H.H., Heaton W.A., Siegel B.A., Mathias C.J., Joist J.H., Sherman L.A., Welch M.J. Scintigraphic detection of atherosclerotic lesions and venous thrombi in man by indium-111-labelled autologous platelets. Lancet. 1978;1(8075):1185-1187.
15. Lees R.S., Lees A.M., Strauss H.W. External imaging of human atherosclerosis. J Nucl Med. 1983;24:154-156.
16. Lees A.M., Lees R.S., Schoen F.J., Isaacsohn J.L., Fischman A.J., McKusick K.A., Strauss H.W. Imaging human atherosclerosis with 99mTc-labeled low density lipoproteins. Arteriosclerosis. 1988;8:461-470.
17. Iuliano L., Signore A., Vallabajosula S., Colavita A.R., Camastra C., Ronga G., Alessandri C., Sbarigia E., Fiorani P., Violi F. Preparation and biodistribution of 99m technetium labelled oxidized LDL in man. Atherosclerosis. 1996;126:131-141.
18. Narula J., Petrov A., Bianchi C., Ditlow C.C., Lister B.C., Dilley J., Pieslak I., Chen F.W., Torchilin V.P., Khaw B.A. Noninvasive localization of experimental atherosclerotic lesions with mouse/human chimeric Z2D3 F(ab′)2 specific for the proliferating smooth muscle cells of human atheroma. Imaging with conventional and negative charge-modified antibody fragments. Circulation. 1995;92:474-484.
19. Carrio I., Pieri P.L., Narula J., Prat L., Riva P., Pedrini L., Pretolani E., Caruso G., Sarti G., Estorch M., Berna L., Riambau V., Matias-Guiu X., Pak C., Ditlow C., Chen F., Khaw B.A. Noninvasive localization of human atherosclerotic lesions with indium 111-labeled monoclonal Z2D3 antibody specific for proliferating smooth muscle cells. J Nucl Cardiol. 1998;5:551-557.
20. Ohtsuki K., Hayase M., Akashi K., Kopiwoda S., Strauss H.W. Detection of monocyte chemoattractant protein-1 receptor expression in experimental atherosclerotic lesions: an autoradiographic study. Circulation. 2001;104:203-208.
21. Oliveira R.T., Mamoni R.L., Souza J.R., Fernandes J.L., Rios F.J., Gidlund M., Coelho O.R., Blotta M.H. Differential expression of cytokines, chemokines and chemokine receptors in patients with coronary artery disease. Int J Cardiol. 2009;136:16-17.
22. Vallabhajosula S., Machac J., Knesaurek K. Imaging atherosclerotic macrophage density by positron emission tomography using F-18-fluorodeoxyglucose (FDG). J Nucl Med. 1996;37:38P.
23. Yun M., Yeh D., Araujo L.I., Jang S., Newberg A., Alavi A. F-18 FDG uptake in the large arteries: a new observation. Clin Nucl Med. 2001;26(4):314-319.
24. Rudd J.H., Warburton E.A., Fryer T.D., Jones H.A., Clark J.C., Antoun N., Johnstrom P., Davenport A.P., Kirkpatrick P.J., Arch B.N., Pickard J.D., Weissberg P.L. Imaging atherosclerotic plaque inflammation with [18F]-fluorodeoxyglucose positron emission tomography. Circulation. 2002;105:2708-2711.
25. Ogawa M., Ishino S., Mukai T., Asano D., Teramoto N., Watabe H., Kudomi N., Shiomi M., Magata Y., Iida H., Saji H. 18F-FDG Accumulation in Atherosclerotic Plaques: Immunohistochemical and PET Imaging Study. J Nucl Med. 2004;45:1245-1250.
26. Tawakol A., Migrino R.Q., Hoffmann U., Abbara S., Houser S., Gewirtz H., Muller J.E., Brady T.J., Fischman A.J. Noninvasive in vivo measurement of vascular inflammation with F-18 fluorodeoxyglucose positron emission tomography. J Nucl Cardiol. 2005;12:294-301.
27. Dunphy M.P., Freiman A., Larson S.M., Strauss H.W. Association of vascular 18F-FDG uptake with vascular calcification. J Nucl Med. 2005;46(8):1278-1284.
28. Zhao Y., Kuge Y., Zhao S., Strauss H.W., Blankenberg F.G., Tamaki N. Prolonged high-fat feeding enhances aortic 18F-FDG and 99mTc-annexin A5 uptake in apolipoprotein E-deficient and wild-type C57BL/6J mice. J Nucl Med. 2008;49(10):1707-1714.
29. Kolodgie F.D., Petrov A., Virmani R., Narula N., Verjans J.W., Weber D.K., Hartung D., Steinmetz N., Vanderheyden J.L., Vannan M.A., Gold H.K., Reutelingsperger C.P., Hofstra L., Narula J. Targeting of apoptotic macrophages and experimental atheroma with radiolabeled annexin V: a technique with potential for noninvasive imaging of vulnerable plaque. Circulation. 2003;108:3134-3139.
30. Laufer E.M., Winkens H.M., Corsten M.F., Reutelingsperger C.P., Narula J., Hofstra L. PET and SPECT imaging of apoptosis in vulnerable atherosclerotic plaques with radiolabeled annexin A5. Q J Nucl Med Mol Imaging. 2009;53(1):26-34.
31. Fujimoto S., Hartung D., Ohshima S., Edwards D.S., Zhou J., Yalamanchili P., Azure M., Fujimoto A., Isobe S., Matsumoto Y., Boersma H., Wong N., Yamazaki J., Narula N., Petrov A., Narula J. Molecular imaging of matrix metalloproteinase in atherosclerotic lesions: resolution with dietary modification and statin therapy. J Am Coll Cardiol. 2008;52(23):1847-1857.
32. Narula J., Garg P., Achenbach S., Motoyama S., Virmani R., Strauss H.W. Arithmetic of vulnerable plague for non-invasive imaging. Nature Clin Prac CV Med. 2008;Suppl 2:S2-10.
33. Davies J.R., Rudd J.H., Weissberg P.L., Narula J. Radionuclide imaging for the detection of inflammation in vulnerable plaques. J Am Coll Cardiol. 2006;47(Suppl 8):C57-C68.
34. Vallabhajosula I., Machac K., Knesaurek J., et al. Imaging atherosclerotic macrophage density by positron emission tomography using F-18-fluorodeoxyglucose (FOG). J Nucl Med. 1996;37:38.
35. Vallabhajosula S., Fuster V. Atherosclerosis: imaging techniques and the evolving role of nuclear medicine. J Nucl Med. 1997;38(11):1788-1796.
36. Yun M., Yeh D., Araujo L.I., Jang S., Newberg A., Alavi A. F-18 FDG uptake in the large arteries: a new observation. Clin Nucl Med. 2001;26(4):314-319.
37. Yun M., Jang S., Cucchiara A., Newberg A.B. Alavi A. 18F FDG uptake in the large arteries: a correlation study with the atherogenic risk factors. Semin Nucl Med. 2002;32(1):70-76.
38. Tatsumi M., Cohade C., Nakamoto Y., Wahl R.L. Fluorodeoxyglucose uptake in the aortic wall at PET/CT: possible finding for active atherosclerosis. Radiology. 2003;229(3):831-837.
39. Ben-Haim S., Kupzov E., Tamir A., Israel O. Evaluation of 18F-FDG uptake and arterial wall calcifications using 18F-FDG PET/CT. J Nucl Med. 2004;45(11):1816-1821.
40. Ben-Haim S., Kupzov E., Tamir A., Frenkel A., Israel O. Changing patterns of abnormal vascular wall F-18 fluorodeoxyglucose uptake on follow-up PET/CT studies. J Nucl Cardiol. 2006;13(6):791-800.
41. Dunphy M.P., Freiman A., Larson S.M., Strauss H.W. Association of vascular 18F-FDG uptake with vascular calcification. J Nucl Med. 2005;46(8):1278-1284.
42. Rudd J.H., Warburton E.A., Fryer T.D., Jones H.A., Clark J.C., Antoun N., Johnström P., Davenport A.P., Kirkpatrick P.J., Arch B.N., Pickard J.D., Weissberg P.L. Imaging atherosclerotic plaque inflammation with [18F]-fluorodeoxyglucose positron emission tomography. Circulation. 2002;105(23):2708-2711.
43. Tawakol A., Migrino R.Q., Bashian G.G., Bedri S., Vermylen D., Cury R.C., Yates D., LaMuraglia G.M., Furie K., Houser S., Gewirtz H., Muller J.E., Brady T.J., Fischman A.J. In vivo 18F-fluorodeoxyglucose positron emission tomography imaging provides a noninvasive measure of carotid plaque inflammation in patients. J Am Coll Cardiol. 2006;48(9):1818-1824.
44. Rudd J.H., Myers K.S., Bansilal S., Machac J., Pinto C.A., Tong C., Rafique A., Hargeaves R., Farkouh M., Fuster V., Fayad Z.A. Atherosclerosis inflammation imaging with 18F-FDG PET: carotid, iliac, and femoral uptake reproducibility, quantification methods, and recommendations. J Nucl Med. 2008;49(6):871-878.
45. Rudd J.H., Myers K.S., Bansilal S., Machac J., Pinto C.A., Tong C., Rafique A., Hargeaves R., Farkouh M., Fuster V., Fayad Z.A. Atherosclerosis inflammation imaging with 18F-FDG PET: carotid, iliac, and femoral uptake reproducibility, quantification methods, and recommendations. J Nucl Med. 2008;49(6):871-878.
46. Tahara N., Kai H., Ishibashi M., Nakaura H., Kaida H., Baba K., Hayabuchi N. Imaizumi T.Simvastatin attenuates plaque inflammation: evaluation by fluorodeoxyglucose positron emission tomography. J Am Coll Cardiol. 2006;48(9):1825-1831.
47. Ben-Haim S., Kupzov E., Tamir A., Frenkel A., Israel O. Changing patterns of abnormal vascular wall F-18 fluorodeoxyglucose uptake on follow-up PET/CT studies. J Nucl Cardiol. 2006;13(6):791-800.
48. Meirrelles G., Larson S., Strauss H: Fluorodeoxyglucose uptake and calcifications in the vascular wall at PET/CT: Assessment of frequency, stability over time and association with cardiovascular risk factors [abstract], J Nucl Med, Suppl 1, 126, 2006.
49. Burke A.P., Kolodgie F.D., Farb A., Weber D.K., Malcom G.T., Smialek J., Virmani R. Healed plaque ruptures and sudden coronary death: evidence that subclinical rupture has a role in plaque progression. Circulation. 2001;103(7):934-940.
50. Kolodgie F.D., Narula J., Burke A.P., et al. Localization of apoptotic macrophages at the site of plaque rupture in sudden coronary death. Am J Pathol. 2000;157:1259-1268.
51. Kolodgie F.D., Petrov A., Virmani R., et al. Targeting of apoptotic macrophages and experimental atheroma with radiolabeled annexin V: A technique with potential for noninvasive imaging of vulnerable plaque. Circulation. 2003;108:3134-3139.
[/level-membership-for-internal-medicine-category][not-level-membership-for-internal-medicine-category]
Chapter 44 Radionuclide Imaging of Inflammation in Atheroma
INTRODUCTION
Over 16 million people in the United States1 are afflicted with coronary artery disease. Approximately 785,000 of these individuals will experience a sudden coronary event in 2009, and about 152,000 will succumb to the acute process. Although identification of each person at risk is the ultimate clinical goal, it is most desirable to definitively identify the subset of patients who are most likely to suffer an acute coronary event. In 60% to 80% of patients, the acute event is caused by thrombotic occlusion of the vessel due to rupture of an atheroma in the coronary artery; in a minority (especially patients < 50 years old and smokers), the occlusion results from erosion of endothelial cells overlying the plaque (likely due to apoptosis of endothelial cells, exposing thrombogenic proteoglycans and microparticulates2). Lesions undergoing plaque rupture occupy a significant fraction of the circumference of the vessel, contain numerous inflammatory cells in the necrotic core, have a thin cap (<65 μm) separating the atheroma from blood in the vessel lumen, and have a marked increase in vasa vasorum.3 Diagnostic targeting strategies should identify plaques vulnerable to rupture or endothelial erosion.
EVOLUTION OF ATHEROSCLEROTIC LESIONS
The American Heart Association (AHA) classifies atherosclerotic lesions from type I through VI based on the severity of the disease (Fig. 44-1).4 Type I plaque is an adaptive lesion consisting mostly of smooth muscle cells (SMC) with or without scattered macrophage infiltration. Type II plaque is a fatty streak consisting of foam cell infiltration. Type III plaque shows pools of extracellular lipid, but no necrotic core is formed; the extracellular matrix predominantly consists of proteoglycans. Type IV plaque has a well-defined necrotic core with overlying fibrous cap consisting of SMC and evolving collagenous matrix. Type V lesions demonstrate a thick fibrous cap consisting of a predominantly fibrotic lesion (type Vc) with calcification (type Vb) or deep-seated necrotic core (type Va). Type VI is a classic plaque rupture that shows a region of fibrous cap disruption that allows continuation between the necrotic core and overlying luminal thrombus. Although this histologic classification has neat groupings, clinically, patients do not progress linearly from types I to VI. To make the classification more relevant, several authors have proposed modifications to this classification system. One such classification suggested by Virmani and colleagues5 classifies lesions based on the morphologic description of the fibrous cap and neointima and their progression to complicated lesions. They have categorized atherosclerotic plaques as “intimal thickening” (equivalent to AHA type I), “intimal xanthoma” (type II), “pathologic intimal thickening” (type III), and “fibrous cap atheroma” (similar to types IV and V). The unique features of the Virmani classification include linking of pathologic intimal thickening (SMC + proteoglycan-rich lesions, equivalent to AHA type III) to acute coronary syndromes associated with plaque erosion, and description of an entity referred to as thin fibrous cap atheroma. The latter is a precursor of plaque rupture–related acute coronary syndromes. This classification has incorporated repeated cycles of healing on plaque ruptures and erosions toward development of more advanced lesions. On the other hand, the newer classification also assigns significance to calcific nodules in predisposition to the luminal thrombus. The morphologic characteristics of the atherosclerotic lesions described in the new classification are compared with the AHA classification in Figure 44-1.
PATHOGENETIC BASIS OF INFLAMMATION IN ATHEROSCLEROSIS
Atherosclerosis involves both an inflammatory response to lipid deposition in the vessel wall and an immunologic response of the endothelium to the injury. Damage to the vascular intima is initiated by various factors, including shear stress and, most important, hyperlipidemia.6–8 Endothelial damage causes expression of selectins and adhesion molecules by the endothelial cell. These chemotactic factors cause recruitment of circulating monocytes to the region of injury; these cells migrate into the subendothelial layer. There, the short-lived monocytes are transformed into long-lived macrophages.9 The macrophages phagocytize and start to metabolize low-density lipoprotein (LDL) cholesterol. In the process of metabolism, oxidative products are generated, leading to the formation of oxidized LDL cholesterol, both in the intracellular and extracellular environment. Oxidized LDL cholesterol causes greater inflammation, is difficult to metabolize, and in high concentration is toxic to the macrophages. Modified (mainly oxidized) LDL enters the macrophages through scavenger LDL receptors, which are not inhibited by the intracellular lipid contents, allowing the cells to continue gorging themselves on this relatively indigestible irritant. As large quantities of LDL cholesterol and oxidized LDL cholesterol accumulate in the macrophages, they become lipid-laden foam cells. Large quantities of intracellular oxidized LDL cholesterol causes death of the macrophages, in part by apoptosis10 and in part due to necrosis. Part of the process of apoptosis is production of caspase-1 by the mitochondria of the macrophage. Caspase-1 production is associated with increased production of matrix metalloproteinases, resulting in degradation of stromal tissue containing the lesion.11 These foam cells are restricted from moving away from the subintimal space. Concurrent with the release of selectins and attraction of monocytes to the site of injury, the injured endothelium releases substances that induce phenotypic alteration of medial SMC from contractile cells to the proliferating phenotype. The transformed smooth muscle cells migrate to the neointima.
The macrophage infiltration in the vessel wall follows a systematic process that includes reversible adhesion of the monocytes to the injured endothelium, followed by monocytic activation, leading to a more permanent binding and eventual subendothelial migration of monocytes (Fig. 44-2).12 The initial injury to endothelial cells induces expression of integrin molecules such as E-selectin or P-selectin. Corresponding integrin moieties on the monocytes, such as L-selectin, facilitate interdigitating interaction between the endothelium and circulating monocytes that slows the monocytes as they start to roll along the vessel wall. Chemotactic peptides cause the monocytes to adhere to the injured endothelium. In the absence of chemoattractants, the selectins are shed, and the monocytes roll back to the bloodstream. The interaction of the endothelial chemoattractants and their receptors on monocytes lead to activation of β1– or β2-integrins (such as LFA-1, VLA-4, or Mac-1). These integrins bind firmly to endothelial expression of adhesion molecules of an immunoglobulin gene superfamily such as intercellular adhesion molecule 1 (ICAM-1), ICAM-2, and VCAM-1. The multipronged attachment of the monocytes to the endothelium commits monocytes to permeate through the endothelial cell junctions, mediated by co-adherins. In addition to the monocyte/macrophage infiltration, both PMNs and mast cells appear to play important roles in plaque rupture. Immune histology studies demonstrated that mast cells localize in the shoulders and cap of the plaque, suggesting a role for these cathepsin G–producing cells in plaque rupture.13
APPROACHES TO IMAGING ATHEROMA
There have been multiple radionuclide approaches to imaging atheroma:
