Quantitative M-mode and Two-dimensional Echocardiography
Varun Dixit, John C. Sciarra and Christopher J. Gallagher
M-mode provides a one-dimensional, “ice pick” view through the heart and updates the B-mode images at a very high rate.1 Doppler recordings reflect blood velocity, whereas M-mode motion of cardiac structures reflects volumetric blood flow. The two examinations are hemodynamically complementary. In certain situations, M-mode recordings of the valves and inter-ventricular septum can be particularly helpful.2 M-mode is a superior method of examining the timing of the cardiac events especially when displayed with the electrocardiogram.
Edge Components
When measuring “where is the real live edge” in the ventricle, the back of the mid-papillary muscle view is the most appropriate. Then, the whole deal centers on where does the blood stop and where does the ventricle start. For this, you are best off using contrast, as noted above. Other than that anemic explanation, I don’t know beans about how they’d ask you a test question on “Edge Components”.
Temporal Resolution
Deeper field?—That would take more information in, so temporal resolution would be worse.
Shallower field?—That would take less information in, so temporal resolution would be better.
Wider field?—More information coming in, therefore worse temporal resolution.
Narrower field?—You’re getting it. Less info, therefore better temporal resolution.
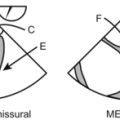
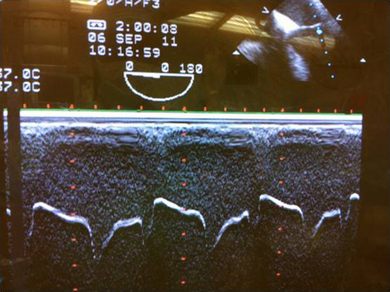
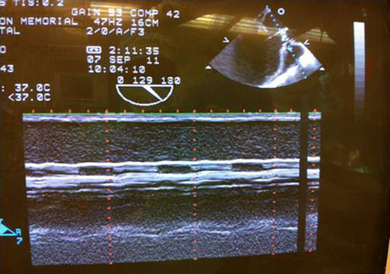
Aortic Valve in M-Mode
First you will see the chest wall. The next hypoechoic shadow is the right ventricular outflow tract. The next ‘ice pick’ line you get is the aortic anterior wall.
The ‘box car’ represents the cusp separation of the aortic valve.
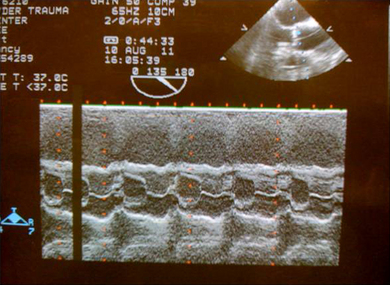
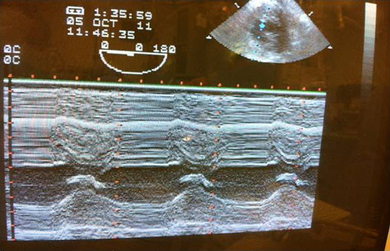
Mitral Valve in M-Mode
Note, the two leaflets of the mitral valve move in M-shaped mirror image pattern in diastole. At the onset of systole the two leaflets come together and generate the first heart sound.
Global Function: Measurements and Calculations
Even someone with little echo experience can see pretty quickly that the heart is functioning well but is empty (give volume!) or the heart is functioning poorly (give inotrope, put in a balloon, do something!). Without getting wild about specific measurements, the naked eye can tell pretty well when the ventricle is pumping all its volume out and contracting well, and when the ventricle is just sitting there, doing nothing. Obviously, experience will improve your assessment over time but it’s hard to miss the elephant in the room.
BINGO! Put in a TEE. Just like that you’ll SEE what’s going on and won’t have to INFER anything! Tamponade? You’ll see it, you won’t have to figure whether the numbers support it. LV failure? You’ll see it. Empty (say your patient had an allergic reaction and the SVR is zippo)? You’ll see it.
When you are in trouble, transesophageal echo may keep you from crashing.

You can trace an outline of the ventricle at diastole and systole and run the numbers, but most often you just eyeball it and make your own assessment. Errors in LVEF estimates can be diminished by increased experience of the echocardiographer, the use of cine loop technology, and frequent, continuous training for quality improvement.3
Geometric, Spectral, and Other Measurements

Strain rate measures the rate of deformation of a tissue segment and is measured in s−1. Infarcted myocardial tissue does not demonstrate shortening or lengthening activity and shows no or minimal systolic strain rate or strain.4
The echocardiogram is that visual assessment of wall motion which relies mainly on evaluation of inward motion of the myocardium (the transverse component of the contraction). Strain measurement allows evaluation of the longitudinal component as well, thus enabling identification of abnormalities that are not readily seen by the naked eye.5
Questions
1. Which is the best view to assess the left ventricular function:
2. The best angle to get a 2-D image is:
3. Which combination will give you best temporal resolution:
4. Calculate the fractional area of shortening with the following data (without using a calculator or your 4-year-old): end-diastolic area 4.8 cm2, end-systolic area 3.6 cm2, right atrial diameter 3.4 cm, left ventricular wall thickness 1.6 cm
5. A patient admitted for CABG has central crushing chest pain. You place a TEE probe and, guess what, you got M-mode. What ECHO findings will you see during systole?
Answers
1. C. The left ventricular function can be evaluated in number of views but the trans-gastric short-axis view will give an impression of the ventricular walls, which are supplied by all the three main coronary arteries.
2. B. A quick revision: Doppler is best at 0 or 180 degrees, but 2-D echo images are best viewed at 90 degrees.
3. D. Remember temporal resolution is like CA 1 resident, if you give him too much information he will slow down. So tell him one thing a day and give time to process. So a shallow and narrow field will give best results.
4. C. Too bad!!! You already forgot the formula
5. D. All these are the findings of ischemia in ventricular walls. Note that the ventricular wall should thicken during the systole; if there is normal ventricular thickness it signifies ischemia. I even made a diagram for you.
6. B. There is severe stenosis of the two cusps of the aortic valve, with one cusp hardly moving at all.