Chapter 12
Quality Systems in the Pulmonary Function Laboratory
1. Describe the twelve quality system essentials and path of workflow for pulmonary function testing.
2. Describe three types of mechanical quality control devices.
3. Perform and evaluate spirometry linearity testing on a flow-based system.
4. Determine whether spirometers, single-breath diffusing equipment, a plethysmograph, or a blood gas analyzer is “in control” using a control chart.
5. Compose technologist’s comments to describe acceptable and unacceptable spirometry, Dlco, and lung volumes.
1. Evaluate results from a customer satisfaction survey and apply to process improvement.
2. Apply results obtained from biologic control subjects to troubleshoot pulmonary function equipment.
3. Describe two methods for performing quality control of a Dlco system.
4. Define and describe the three components of a quality manual—policy, process, procedure—as applied to each QSE.
5. Describe key components of an information management QSE.
6. Identify key components of a safety and infection control QSE for arterial blood gas collection and prevention of cross-contamination of pulmonary function equipment.
The chapter discusses issues related to a quality system, as introduced in Chapter 1. Although an in-depth review of the quality system is beyond the scope of this chapter, an introduction to the basics of each quality system essential (QSE) and the path of workflow is included to move the laboratory toward total quality management. The referenced Clinical and Laboratory Standards Institute (CLSI) documents will broaden the reader’s understanding of each of the concepts introduced in the chapter and may be essential for meeting accreditation and regulatory standards. The concept of developing a quality manual that addresses policies, processes, and procedures is introduced. Each of the twelve QSEs is discussed with examples for application to the pulmonary function laboratory. The personnel QSE addresses personnel standards, training, and competence assessment. Personnel who perform pulmonary function tests must make decisions during the path of workflow (POW) (pre-testing, testing, and post-testing) that determine the quality of data obtained. Special attention is given to methods by which the pulmonary function technologist can assess data quality through discussion of each component of the path of workflow. Documentation of pulmonary function data quality (e.g., acceptability, repeatability, and reproducibility) is discussed.
Quality manual
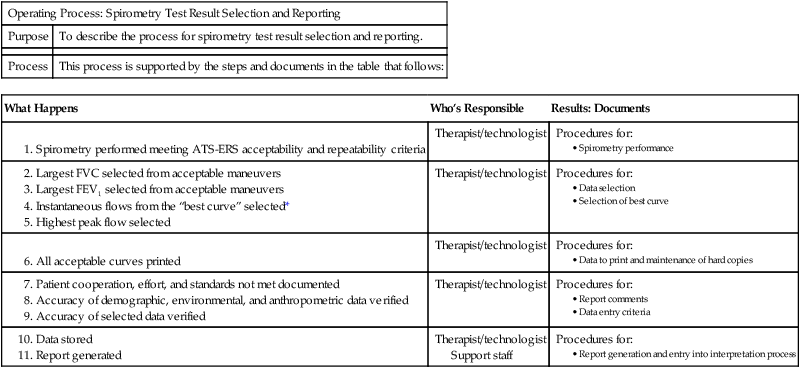
The initial step in building the quality system is developing a quality manual. The quality manual addresses policies for each of the twelve QSEs. Policies are written to answer the question: What do we do in our organization? Each policy describes the organization’s intent and provides direction for the specific QSE. Policies for the personnel QSE often include the intent and direction for job descriptions and qualifications, orientation, training, competence assessment, and continuing education. Processes are described to transform the policy into action and answer the question: How does this happen in our pulmonary laboratory? Processes are generally a group of activities or procedures. There is a process to obtain reliable spirometry data that may result in a need for several procedures such as quality control, test performance, test result selection and reporting, selection of reference values, and interpretation of results (Table 12-1). Procedures answer the question: How do I do this activity? Each QSE incorporates policies, processes, and procedures to build a platform for the path of workflow to be followed for each test procedure.
Table 12-1
| Operating Process: Spirometry Test Result Selection and Reporting | |
| Purpose | To describe the process for spirometry test result selection and reporting. |
| Process | This process is supported by the steps and documents in the table that follows: |
| What Happens | Who’s Responsible | Results: Documents |
Support staff
Expected Results: Accurate and reliable test results.
*NOTE: The “best curve” is selected from the largest sum of FVC + FEV1.
(From Blonshine S, Mottram CD, Berte LM, et al. Application of a quality management system model for respiratory services: Approved guidelines. 2nd ed. CLSI document HS4-A2. Wayne, PA: Clinical and Laboratory Standards Institute; 2006.)
Quality system essentials
Organization
Customer Focus
The pulmonary laboratory should identify their customers and expectations. Customers include both external and internal groups. Examples of external customers include accreditation and governmental agencies, patients, physicians, nurses, clinical support services, asthma educators, home care companies, and payers. All staff involved in the path of workflow are considered internal customers. An initial step is to evaluate the laboratory’s capability to meet the identified expectations. Physicians ordering tests likely will have an expectation of how long it should take to schedule a patient for testing and the length of time to receive an interpreted copy of the report. Surveys will identify expectations met and potential for continual improvement (Box 12-1). Complaints are recorded and managed according to the nonconforming event management QSE.
Box 12-1 Pulmonary Function Laboratory Customer Service Summary
How close to your scheduled appointment time were you called in for your test?
 |
Before appointment time |
 |
On-time |
 |
30 minutes late |
 |
1 hour late |
 |
Longer than 1 hour |
How well did the technologist explain your test?
 |
Excellent |
 |
Very good |
 |
Good |
 |
Fair |
 |
Poor |
How knowledgeable and technically skilled was the technologist performing your procedure?
 |
Excellent |
 |
Very good |
 |
Good |
 |
Fair |
 |
Poor |
How courteous and professional was your technologist?
 |
Excellent |
 |
Very good |
 |
Good |
 |
Fair |
 |
Poor |
Test performed: PFT ABG CPET O2 titration
Comment:________________________________________________
Courtesy of Mayo Clinic PF Laboratory.
Facilities and Safety
Each laboratory should have written guidelines defining safety and infection control practices. The guidelines should be part of a policy and procedure manual (Box 12-2). Procedures should include, but not be limited to, handwashing techniques, use of protective equipment such as laboratory coats and gloves, and guidelines for equipment cleaning. The handling of contaminated materials (e.g., waste blood) should be clearly described. Policies and procedures should include education of technologists regarding proper handling of biologic hazards. Department policies and procedures should be consistent with those mandated by individual hospitals or institutions. Most accrediting agencies require written plans for safety, waste management, and chemical hygiene. In the United States, the Occupational Safety and Health Administration (OSHA) has published strict guidelines regarding handling of blood and other medical waste (see Evolve). Safety training should be documented and the training records maintained per institutional requirements, accreditation, and regulatory requirements in the records management system. Generally, some areas will require retraining on an annual basis.
Pulmonary Function Tests
1. Disposable mouthpieces and noseclips should be used by the patient during spirometry. Reusable mouthpieces should be disinfected or sterilized after each use. Proper handwashing should be done immediately after direct contact with mouthpieces or valves. Gloves should be worn when handling potentially contaminated equipment. Hands should always be washed between patients and after removing gloves.
2. Tubing or valves through which subjects rebreathe should be changed after each test. Any equipment that shows visual condensation from expired gas should be disinfected before reuse. This is particularly important for maneuvers such as the FVC, where there is a potential for mucus, saliva, or droplet nuclei to contaminate the device. Breathing circuit components should be stored in sealed containers (e.g., plastic bags) after disinfection.
3. Spirometers should be cleaned according to the manufacturer’s recommendations. The frequency of cleaning should be appropriate for the number of tests performed. For open-circuit systems, only that part of the circuit through which air is rebreathed needs to be decontaminated between patients. Some flow-based systems offer pneumotachometers that can be changed between patients. Pneumotachometers not located proximal to the patient are less likely to be contaminated by mucus, saliva, or droplet nuclei.Disposable flow sensors should not be reused. Volume-displacement spirometers should be flushed using their full volume at least five times between patients. Flushing with room air helps clear droplet nuclei or similar airborne particulates. Water-sealed spirometers should be drained at least weekly and allowed to dry completely. They should be refilled with distilled water only. Bellows and rolling-seal spirometers should be disinfected on a routine basis. The spirometer may require recalibration after disinfecting.
4. Systems used for spirometry, lung volumes, and diffusing capacity tests often use breathing manifolds that are susceptible to contamination. Bacteria filters may be used to prevent contamination of these devices. Filters may impose increased resistance, affecting measurement of maximal flows as well as airway resistance or conductance. Some types of filters show increased resistance after continued use in expired gas. Spirometers with bacteria filters should be calibrated with the filter in line; the spirometer should meet the minimal recommendations in Table 12-2 with the filter in place. If filters are used for procedures such as lung volume determinations, their volumes must be included in the calculations.
Table 12-2
Minimal Recommendations for Spirometers
A 3-L calibration syringe is recommended for testing VC and FVC. Twenty-four standardized waveforms are available for validating FVC, FEV1, and FEF25%–75%. Twenty-six standard flow waveforms are available for validating PEF. Other flows require manufacturer’s proof of performance. A sine-wave pump is recommended for MVV validation.
| Test | Range/Accuracy (BTPS) | Flow Range (L/sec) | Time (sec) | Resistance/Back-Pressure |
| VC | 0.5–8 L/ ±3% of reading or ± 0.05 L, whichever is greater | 0–14 | 30 | N/A |
| FVC | 0.5–8 L/ ±3% of reading or ± 0.05 L, whichever is greater | 0–14 | 15 | <1.5 cm H2O/L/sec (0.15 kPa/L/sec) |
| FEV1 | 0.5–8 L/ ±3% of reading or ± 0.05 L, whichever is greater | 0–14 | 1 | <1.5 cm H2O/L/sec (0.15 kPa/L/sec) |
| Time zero | Time point for calculating all FEVT values | N/A | N/A | Back extrapolation |
| PEF | Accuracy: ±10% of reading or ±0.3 L/sec (20 L/min), whichever is greater; repeatability: ±5% of reading or ±0.15 L/sec (10 L/min), whichever is greater | 0–14 | N/A | Mean resistance at 200, 400, 600 L/min (3.3, 6.7, 10 L/sec) <2.5 cm H2O/L/sec (0.25 kPa/L/sec) |
 (except PEF) (except PEF) |
±5% of reading or ±0.2 L/sec, whichever is greater | 0–14 | N/A | <1.5 cm H2O/L/sec (0.15 kPa/L/sec) |
| FEF25%–75% | 7.0 L/sec /±5% of reading or ±0.2 L/sec, whichever is greater | ±14 | 15 | <1.5 cm H2O/L/sec (0.15 kPa/L/sec) |
| MVV | 250 L/min at VT of 2 L/ ±10% of reading or ±15 L/min, whichever is greater | ±14 (±3%) | 12–15 | <1.5 cm H2O/L/sec (0.15 kPa/L/sec) |
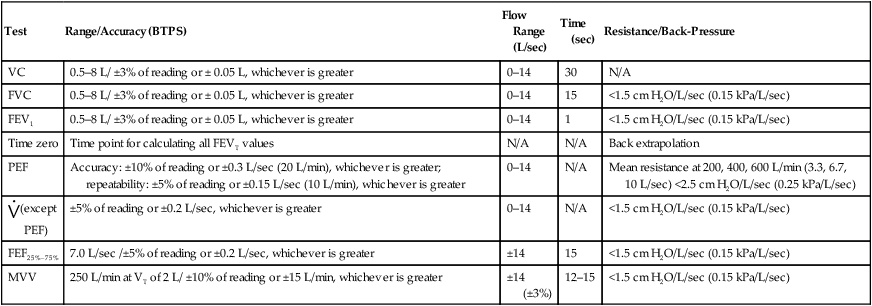
Adapted from Miller MR, Hankinson J, Brusasco V, et al. Standardisation of spirometry. Eur Resp J. 2005; 26:319-338.
5. Small-volume nebulizers, such as those used for bronchodilator administration or bronchial challenge, offer the greatest potential for cross-contamination. These devices, if reused, should be sterilized to destroy vegetative microorganisms, fungal spores, tubercle bacilli, and some viruses. Disposable single-use nebulizers are preferable but may not be practical for routines such as inhalation challenges. Metered-dose devices may be used for bronchodilator studies by using disposable mouthpieces or “spacers” to prevent colonization of the device. Common canister protocols for metered-dose inhaler usage have been evaluated in the laboratory.
6. Gloves or other barrier devices minimize the risk of infection for the technologist who must handle mouthpieces, tubing, or valves. Special precautions should be taken whenever there is evidence of blood on mouthpieces or tubing. There is a risk of acquiring infections such as tuberculosis or pneumonia caused by Pneumocystis carinii from infected patients. The technologist should wear a mask when testing subjects who have active tuberculosis or other diseases that can be transmitted by coughing.
7. Patients with respiratory diseases such as tuberculosis may warrant specially ventilated rooms, particularly if many individuals need testing. Risk of cross-contamination or infection can be greatly reduced by filtering and increasing the exchange rate of air in the testing room. Equipment can be reserved for testing infected patients only. An example may be using a spirometer for cepacia positive patients in a clinic patient room. Special patient organizations such as the Cystic Fibrosis Foundation may have additional requirements for infection control. Patients with known pathogens can also be tested in their own rooms or at the end of the day (to facilitate equipment decontamination).
8. Surveillance may include cultures of reusable components, such as mouthpieces, tubing, and valves, after disinfection.
Blood Gases
These standard precautions should be applied in the pulmonary function and/or blood gas laboratory:
1. Treat all blood and body fluid specimens as potentially contaminated.
2. Exercise care to prevent injuries from needles, scalpels, or other sharp instruments. Do not resheath used needles by hand. If a needle must be resheathed, use a one-handed technique or a device that holds the sheath. Do not remove used, unprotected needles from disposable syringes by hand. Do not bend, break, or otherwise manipulate used needles by hand. Use a rubber block or cork to obstruct used needles after arterial punctures. Use needle safety devices (now used in almost all blood gas kits) as described by the manufacturer. Place used syringes and needles, scalpel blades, and other sharp items in puncture-resistant containers. Locate the containers as close as possible to the area of use.
3. Use protective barriers to prevent exposure to blood, body fluids containing visible blood, and other fluids to which standard precautions apply. Examples of protective barriers include gloves, gowns, laboratory coats, masks, and protective eyewear. Gloves should be worn when drawing blood samples, whether from a needle puncture or an indwelling catheter. Gloves cannot prevent penetrating injuries caused by needles or sharp objects. Gloves are also indicated if the technologist has cuts, scratches, or other breaks in the skin. Protective barriers should be used in situations where contamination with blood may occur. These situations include obtaining blood samples from an uncooperative patient, performing finger-heel sticks on infants, and receiving training in blood drawing. Examination gloves should be worn for procedures involving contact with mucous membranes. Masks, gowns, and protective goggles may be indicated for procedures that present a possibility of blood splashing. Blood splashing may occur during arterial line placement or when drawing samples from arterial catheters.
4. Wear gloves while performing blood gas analysis. Laboratory coats or aprons that are resistant to liquids should also be worn. Protective eyewear may be necessary if there is risk of blood splashing during specimen handling. Maintenance of blood gas analyzers, such as repair of electrodes and emptying of waste containers, should be performed wearing similar protective gear. Laboratory coats or aprons should be left in the specimen handling area. Blood waste products (e.g., blood gas syringes) should be discarded in clearly marked biohazard containers.
5. Immediately and thoroughly wash hands and other skin surfaces that are contaminated with blood or other fluids to which the standard precautions apply. Hands should be washed after removing gloves. Blood spills should be cleaned up using a solution of 1 part 5% sodium hypochlorite (bleach) in 9 parts of water. Bleach should also be used to rinse sinks used for blood disposal.
Personnel
An orientation/training plan and process is required for all new employees. An orientation manual and training guide is developed and updated as required. The training manual may include, but is not limited to, quality management, safety, computer systems, ethics, work processes, and procedures. Records documenting the orientation and training processes are maintained according to the document and records QSE (Table 12-3). Training occurs and documentation is maintained when processes or procedures are updated or added. Performance of quality control procedures has been identified as a primary training need in pulmonary function laboratories globally, regardless of professional credentials. Orientation also includes review of the quality manual and application to work duties in the laboratory.
Table 12-3
• Main organization’s system (e.g., hospital information system [HIS])
• Department’s system (e.g., laboratory information system [LIS])
• PC applications (e.g., e-mail, scheduling, word processing, spreadsheets, database)
• Other computer applications used in the job (e.g., documentation of training, continuing education, competence assessment)
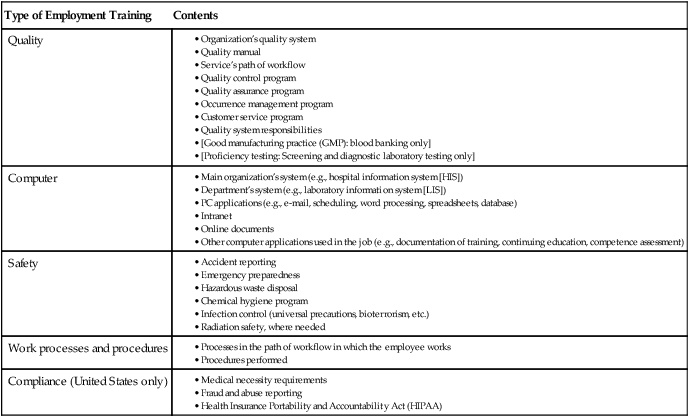
(From Blonshine S, Mottram CD, Berte LM, et al. Application of a quality management system model for respiratory services: Approved guidelines. 2nd ed. CLSI document HS4-A2. Wayne, PA: Clinical and Laboratory Standards Institute; 2006.)
Equipment
Equipment acquisition includes meeting the minimum equipment standards as outlined by the ATS-ERS standards as represented in Tables 12-2 and 12-4 for spirometers. Additional guidance may be found in the ATS-ERS standards for other types of equipment. The selection process may include a list of acceptable vendors, development of a product-evaluation matrix, equipment evaluation (on-site is preferred), written acceptable limits of accuracy and precision, information management options, computer standards, warranty and service agreements, and training options (Box 12-3). The initial selection may include an on-site evaluation with a comparison of old and new equipment.
Table 12-4
Minimum Recommended Scale Factors for Recorders and Displays
| Instrument Display | Printed Graphs | |||
| Resolution | Scale Factor* | Resolution | Scale Factor* | |
| Volume | 0.05 L | 5 mm/L | 0.025 L | 10 mm/L |
| Flow | 0.20 L/sec | 2.5 mm/L/sec | 0.10 L/sec | 5 mm/L/sec |
| Time | 0.2 sec | 10 mm/sec | 0.2 sec | 20 mm/sec |
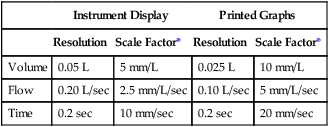
*Scale factors for flow and volume produce an aspect ratio of 2:1.
Adapted from Miller MR, Hankinson J, Brusasco V, et al. Standardisation of spirometry. Eur Resp J. 2005; 26:319-338.
Installation, Validation, and Verification
Selection for equipment location in the pulmonary laboratory includes consideration of environmental conditions that impact acceptable function. For example, equipment specifications outline temperatures appropriate for spirometry equipment. A plethysmograph is sensitive to pressure changes in the room, vibrations close to the device, or other significant changes such as a fan blowing on the device. The installation process should include a correlation study between old and new equipment. Correlation studies are required for blood gas equipment by CLIA’88 and are also prudent to complete with pulmonary function equipment. Studies have shown bias between vendors and equipment within a specific vendor. Equipment function is validated initially to determine compliance with manufacturer’s specifications, expected accuracy and precision, and quality control standards. The question to answer is: Have the requirements for the intended use or application been fulfilled? Verification means that the specified requirements are fulfilled such as calibration verification. All institutional, regulatory, or governmental requirements should be considered during the installation process (Box 12-4).
Equipment Maintenance
An equipment maintenance plan should be developed and approved. If maintenance is provided by an outside contractor, it should be in compliance with the institutional plan. The type and complexity of instrumentation for a specific test determines the long-term and short-term maintenance that will be required. Daily maintenance includes replacing disposable items such as filters and gas conditioning devices. Preventive maintenance is scheduled in anticipation of equipment malfunction to reduce the possibility of equipment failure. Corrective maintenance or repair is unscheduled service that is required to correct equipment failure. These types of failures are often detected by QC procedures or unusual test results. Familiarity with the operating characteristics of spirometers, gas analyzers, Dlco systems, plethysmographs, metabolic systems, and application software requires manufacturer support and thorough documentation. Accurate records are essential to a comprehensive maintenance program. Documentation of procedures and repairs is required by most accrediting organizations. Upgrades to application software should be considered an essential component of equipment maintenance in the pulmonary function laboratory. Software upgrades generally require a re-verification process. Re-verification is often required after preventive maintenance and repairs (Table 12-5).
Table 12-5
| Date | Time | Maintenance or Problem | Resolution | Technologist |

(Courtesy Mayo Clinic, Rochester, MN)
Control Methods: Mechanical and Biologic
Quality Control Tools and Materials
Syringes
A large-volume syringe is the most common and frequently used mechanical QC tool used in pulmonary function testing. Syringes used for calibration should be accurate to within ±15 mL or ±0.5% of the stated volume (i.e., 15 mL for a 3-L syringe). Accuracy of calibration syringes should be verified annually. Several companies provide the service globally with the device in Figure 12-1, A and B. Syringes can be checked for leaks simply by occluding the port and trying to empty the syringe. Some laboratories use two syringes: one to calibrate and another to verify volume accuracy. This is highly recommended to exclude the syringe as a source of error. An alternative to have a 3-L and 7-L syringe is depicted in Figure 12-1.
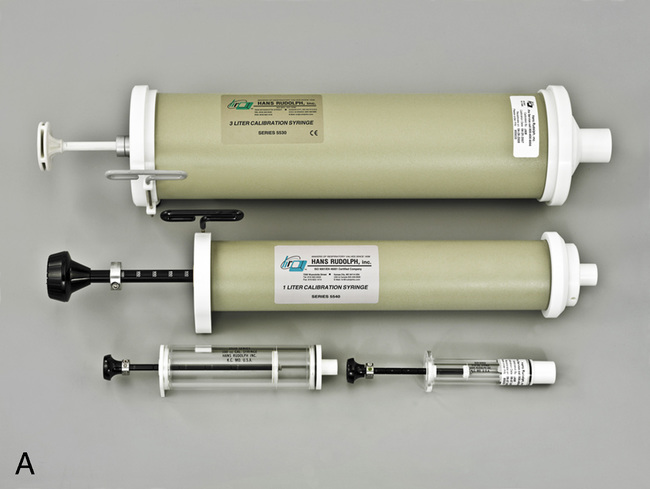
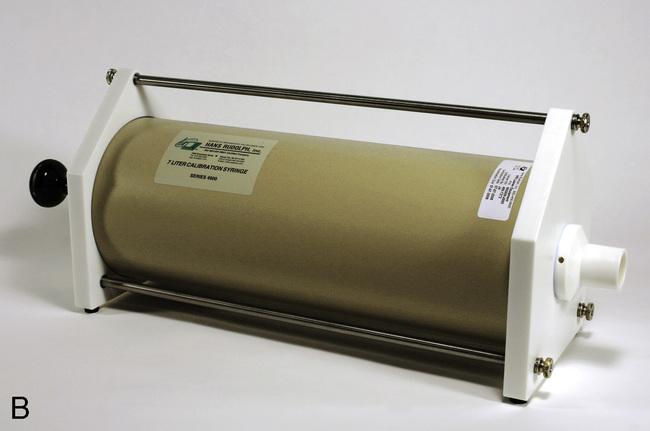
A, Standard 3-L syringe is used for calibration of spirometers for testing of adults and adolescents. Smaller calibration syringes may be used for calibration and verification of pulmonary function equipment used for small children and infants. B, A 7-L syringe. (Courtesy Hans Rudolph, Inc., Shawnee, KS.)
A syringe of at least 3-L volume (see Figure 12-1) should be used to generate a control signal for checking spirometers. A 3-L syringe can be used to verify volume-displacement spirometers and associated deflection of mechanical recorders. A large-volume syringe may also be used to check the volume accuracy of flow-based spirometers. Computerized systems often have the user inject (or withdraw) a 3-L volume to calibrate the spirometer, and then immediately perform additional injections to verify the calibration. Some portable flow-based spirometers (i.e., those using disposable flow sensors) do not provide for calibration but do allow checking or verification of a stored calibration. The calibration or verification should minimally be completed each day testing is completed.
Sine-Wave Rotary Pumps
Sine-wave rotary pumps produce a biphasic volume signal. A biphasic or sine-wave signal may be useful for checking volume and flow accuracy for both inspiration and expiration. A rotary-drive syringe may be useful for checking the frequency response of a spirometer or to evaluate a spirometer’s ability to adequately record tests such as the MVV. Sine-wave pumps are also commonly used in the calibration of body plethysmographs(Figure 12-2).
Dlco Simulator
A Dlco simulator is a commercially available device, as depicted in Figure 12-3. This simulator uses precision gas mixtures to allow repeatable Dlco measurements at different levels (e.g., high Dlco, low Dlco) to simulate Dlco results over the range of expected results for patient testing. Two large-volume syringes are included; an adjustable 5-L syringe provides measured inspiratory volumes. A smaller second syringe is loaded with one of the precision gases; this gas is “exhaled” at the end of the breath-hold interval and sampled by the gas analyzers. Application software calculates the expected Dlco with the known gas concentrations (inspired and expired) along with the inspired volume, breath-hold time, and environmental conditions. The measured Dlco is then compared with the expected value and the percent error reported. By using different precision gases and varying the inspired volume, a range of expected Dlco values can be generated. This type of simulator is useful for all laboratories to identify the source of error in Dlco measurements and may also be used for performance qualification when installing new equipment. Use of the device is standard practice by manufacturers developing Dlco systems and evaluation of systems before shipment. It is also very useful for large laboratories with multiple Dlco systems, multicenter research applications in which accurate Dlco measurements are critical, and accreditation or regulatory programs. Studies have shown that the Dlco simulator data correlates with biologic data but may be more sensitive to identify the source of the problem or error.
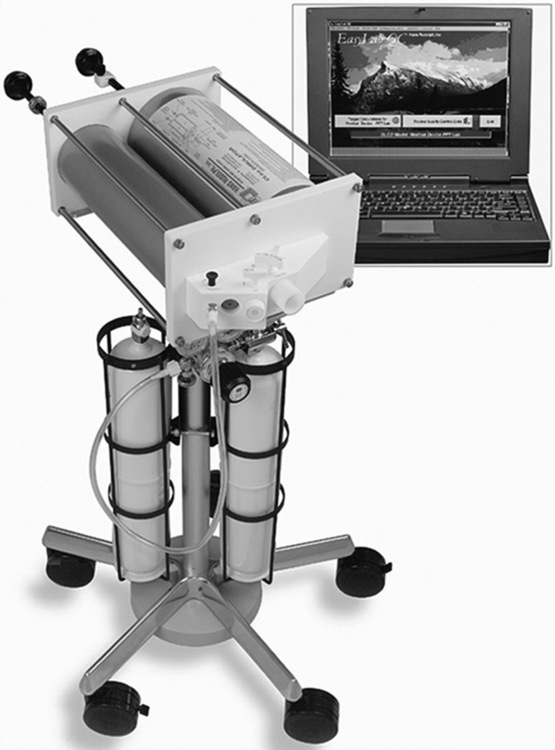
A Dlco simulator that incorporates two large volume syringes and multiple precision gas mixtures provides quality control for Dlco systems. The simulator attaches to the patient port of the Dlco system. (Courtesy Hans Rudolph, Inc., Kansas City, MO.)
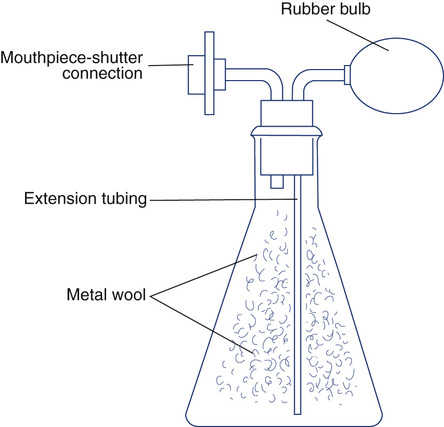
Plethysmograph volumes can be verified with an isothermal bottle. This device is available commercially (Figure 12-4) or can be constructed. An isothermal volume analog can be constructed from a glass bottle or jar of 4–5 L (for adult-size plethysmographs). The jar is filled with metal wool, usually copper or steel. The metal wool acts as a heat sink (see Figure 12-4) so that small pressure changes within the jar can be measured with minimal temperature change. The mouth of the bottle is fitted with two connectors. One connector attaches to the mouth shutter (or the patient connection). The other is attached to a rubber bulb with a volume of 50–100 mL (e.g., the bulb from a blood pressure cuff). The actual volume of the lung analog can be determined by subtracting the volume of the metal wool from the volume of the bottle. The volume occupied by metal wool is calculated from its weight times its density. The gas volume of the empty bottle may be measured by filling it with water from a volumetric source. The volume of the connectors and rubber bulb should be added to the total volume.
Quality Control Concepts
Precision may be defined as the extent to which repeated measurements of the same quantity can be reproduced. If a control is measured repeatedly and the results are similar, the instrument may be considered precise. Precision is often defined in terms of variability based on the standard deviation (SD) of a series of measurements (Box 12-5).
Box 12-5
The Mean and the Standard Deviation
Calculation of the mean and the standard deviation

The mean ( ) may be calculated as:

∑ = a symbol meaning “the sum of”
The SD is calculated as follows:
X2 = deviations from the mean (X– ) squared
If the SD is computed from a sample of 30 data points or less, N-1 is usually substituted for N.
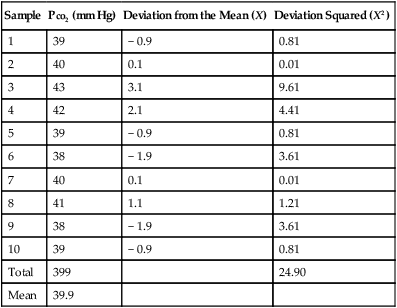
Example calculation of the mean and SD for a series of Pco2 values:
| Sample | Pco2 (mm Hg) | Deviation from the Mean (X) | Deviation Squared (X2) |
| 1 | 39 | − 0.9 | 0.81 |
| 2 | 40 | 0.1 | 0.01 |
| 3 | 43 | 3.1 | 9.61 |
| 4 | 42 | 2.1 | 4.41 |
| 5 | 39 | − 0.9 | 0.81 |
| 6 | 38 | − 1.9 | 3.61 |
| 7 | 40 | 0.1 | 0.01 |
| 8 | 41 | 1.1 | 1.21 |
| 9 | 38 | − 1.9 | 3.61 |
| 10 | 39 | − 0.9 | 0.81 |
| Total | 399 | 24.90 | |
| Mean | 39.9 |
Accuracy and precision are desirable but may not always be present together in the same instrument. For example, a spirometer that consistently measures a 3-L test volume as 2.5 L is precise but not very accurate. A spirometer that evaluates a 3-L test volume as 2.5, 3.0, and 3.5 L on repeated maneuvers produces an accurate mean of 3.0 L, but the measurements are not precise. Determining both the accuracy and precision of instruments such as spirometers is critical because many pulmonary function variables are effort-dependent. The largest observed value, rather than the mean, is often reported as the best test (see Chapter 2). Reporting the largest result observed is based on the rationale that the subject cannot overshoot on a test that is effort-dependent. Other pulmonary function tests, such as the Dlco, are reported as an average of two or more acceptable maneuvers; in these instances, precision of the measuring devices (e.g., gas analyzers) needs to exceed the normal physiologic variability of the parameter being measured.
Spirometry Calibration and Mechanical Quality Control
Spirometers that produce a voltage signal by means of a potentiometer (see Chapter 2) normally allow some form of “gain” adjustment so that the analog output can be matched to a known input of either volume or flow. For example, a 10-L volume-displacement spirometer may be equipped with a 10-V potentiometer. The potentiometer amplifier would be adjusted so that 0 V equals 0 L (zero), and 10 V equals 10 L (gain). The calibration could be verified by setting the spirometer at a specific volume and noting the analog signal (e.g., 5 L should equal 5 V).


Spirometers that use disposable flow sensors may or may not allow calibration. Many disposable sensors are calibrated during manufacture and are coded so that the spirometer software applies appropriate correction factors (see Chapter 11). If these types of spirometers provide for user calibration, they should be calibrated at least daily. At a minimum, a daily calibration check (see the following paragraphs) should be performed with a sensor from the lot used for patient testing.

Expected volume = known syringe volume (usually 3 L)
Measured volume = volume recorded for the test
The maximum acceptable error for spirometers, according to ATS-ERS recommendations, is ±3.5% or ±65 mL, whichever is larger. Table 12-2 lists the minimal requirements for spirometers (excluding the accuracy of the 3-L syringe). If the error exceeds these limits, careful examination of the spirometer, recording device, software, most recent calibration, and testing technique should be performed (Box 12-6).
Linearity of volume-based spirometers should be verified at least quarterly. Volume-displacement spirometers should be checked in 1-L increments across their volume range (i.e., 0–8 L). A 3-L syringe injection performed when the spirometer is nearly empty or nearly full should yield accurate results. The linearity of flow-sensing spirometers should be tested weekly by injecting a series of 3-L volumes at low, moderate, and high flows. Different flows can be generated by varying the speed at which the syringe is emptied. Applying different flows and measuring the resulting volumes may indicate if the spirometer (and its software) is accurate across the range of flows. For example, three different injection times, 0.5–1.0 seconds, 1.0–1.5 seconds, and 5.0–6.0 seconds, may be used with a 3-L syringe to simulate a wide range of flows. The variance between volumes at low and high should not exceed 90 mL or 3% (see Figure 12-5).
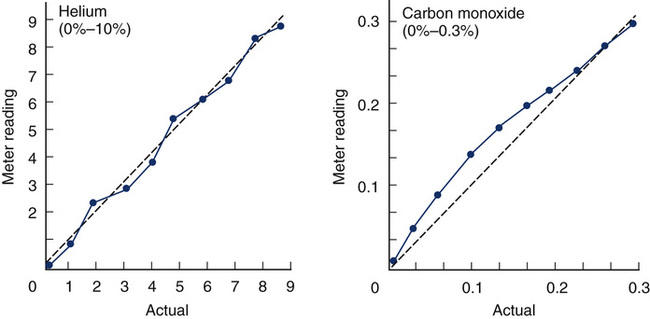
Two plots of varying gas concentrations (for helium [He] and carbon monoxide [CO]) are shown. Each graph plots the meter reading of the analyzers against the actual concentration of the gas. Different dilutions of each gas are prepared and then analyzed. The He analyzer shows good linearity in the comparison of measured versus expected concentrations. The CO analyzer shows a nonlinear pattern, typical of an infrared analyzer.
Recorders and displays should meet the ATS-ERS recommendations in Table 12-4. Printed records or computer-generated displays of spirometry signals are required for diagnostic functions, validation, or when waveforms are to be measured manually. Printed copies of volume-time or flow-volume graphs should be available for diagnostic spirometry. Flow-volume curves should be plotted with expired flow in the positive direction on the vertical (Y) axis and expired volume from left to right on the horizontal (X) axis. A flow-to-volume aspect ratio of 2:1 should be maintained (i.e., 2 L/sec flow for each 1 L of volume). Accurate recorder speed and volume sensitivity are particularly important if FEV1 or other flows are calculated manually. Recorder accuracy should be checked at least quarterly, and the accuracy of the timer should be within 2% of the stated value. Paper speed of strip chart recorders can be easily checked with a stopwatch. Mechanical recording devices (e.g., kymographs, strip-chart recorders) may require repair or replacement of drive motors if paper speed is determined to be inaccurate. Most pulmonary function systems are computerized, and printed tracings are generated by ink-jet, thermal, or laser printers. The output of these devices should adhere to the recommended scale factors but often do not. In effect, it may be difficult or impossible to check the timing during forced spirometry using computer-generated tracings.
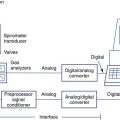
Gas Analyzers and Dlco Systems
Accurate analysis of inspired and expired gases is required to measure lung volumes by dilution methods, Dlco, and gas exchange during exercise or metabolic testing. The validity of these tests depends on accuracy of both the spirometer and gas analyzers used. Various types of gas analyzers are commonly used in pulmonary function testing (see Chapter 11). Calibration refers to the process of adjusting analyzer output to match the input of a known concentration of gas. QC refers to a method for routinely checking the accuracy and/or precision of the gas analyzer. Important factors related to calibration techniques for gas analyzers include the following.
Multiple-Point (Linearity) Calibration
An assumption made by a two-point calibration is that analyzer output is linear between the points used. To verify linearity or to determine the pattern of nonlinearity, three or more calibration points must be determined (see Figure 12-5). A multiple-point calibration is performed in a manner similar to the two-point calibration except that concentrations of known gases across the range to be analyzed are checked and plotted. If multiple points are determined, regression analysis may be used to determine the slope (or type of curve) relating the measured gas concentrations to the expected gas concentrations. A spreadsheet or graphing calculator can be used to analyze the data points. If the analyzer is linear, the points plotted will approximate a straight line. A minimum of three points (i.e., gases) is required to demonstrate linearity. If the analyzer is nonlinear, a calibration curve must be constructed to correct the results. In most instances, an equation describing a nonlinear curve can be generated. This equation can then be used either manually or by software to correct analyzer readings. Computerized systems often use an equation or a table of points representing a calibration curve. This allows an analyzer to be calibrated using two points only. Most nonlinear analyzers incorporate electronics that linearize their output. Linearity of analyzers used for Dlco, lung volumes, exercise, and metabolic studies should be assessed at least quarterly.
Dlco Systems
Gas analyzer accuracy and linearity is particularly important in pulmonary function systems that measure Dlco. For measurement of Dlco by the single-breath method, analyzer linearity is more critical than the absolute measurement of gas concentrations. Small errors in which the analyzer outputs for CO and tracer gas are not linear with respect to one another can result in significant errors in the calculation of Dlco. The nonlinearity of each of the analyzers should be 0.5% or less of the full scale. Analyzers used for Dlco tests also need to be stable, with minimal drift (<±0.5% of full scale) between calibration and testing. To detect drift or similar problems during testing, the actual readings of the analyzers should be displayed. Removal of water vapor and CO2 is usually accomplished by chemical absorbers or related devices (see Chapter 11). Some analyzers use software corrections for the effects of water vapor and CO2 rather than physically removing or altering the interfering gases.

Total volume of gas = test gas + added air + syringe dead space
As each dilution is analyzed, the meter reading is recorded and plotted against the expected percentage (see Figure 12-5). This method is simple and available in most laboratories. Care must be taken when preparing samples so that air does not leak into the syringe, further diluting the test gas. The volume of air in the syringe connectors (i.e., dead space) must be included when calculating the dilution of the test gas. Some calibrated syringes include their dead space volume.
A Dlco simulator is commercially available (see Figure 12-3). This simulator uses precision gas mixtures to allow repeatable Dlco measurements at different levels (e.g., high Dlco, low Dlco). Two large-volume syringes are included; an adjustable 5-L syringe provides measured inspiratory volumes. A smaller second syringe is loaded with one of the precision gases; this gas is “exhaled” at the end of the breath-hold interval and sampled by the gas analyzers. Application software calculates the expected Dlco with the known gas concentrations (inspired and expired) along with the inspired volume, breath-hold time, and environmental conditions. The measured Dlco is then compared with the expected value and the percent error reported. By using different precision gases and varying the inspired volume, a range of expected Dlco values can be generated. This type of simulator is useful for large laboratories with multiple Dlco systems, or for multicenter research applications in which accurate Dlco measurements are critical.
Some computerized pulmonary function systems may make lung simulators more challenging to use, although it has become common practice for manufacturers to develop Dlco systems with a lung simulator. The device may also be used to verify the function of new systems before shipment and in the laboratory during installation. When using a Dlco simulation device, the laboratory staff must understand how calculations are completed both in the testing software of the PF equipment and the Dlco simulation calculation software to avoid errors. The software may be designed to make all necessary corrections for human subjects, giving erroneous results when a simulator is used. However, if the software reports gas analyzer values, the accuracy and linearity of various dilutions can usually be checked (Box 12-7).
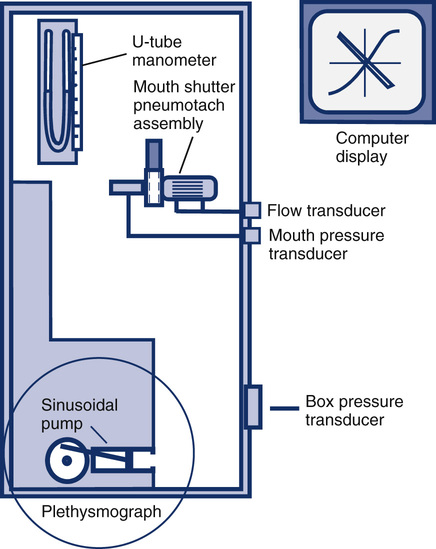
Body Plethysmographs
Mouth Pressure Transducer
Calibration is done by connecting the pressure transducer to a water manometer or a similar device that can generate an accurate pressure. The manometer is a fluid-filled, U-shaped tube with a calibration scale that allows very accurate pressures to be generated (Figure 12-6). Some plethysmographs use a weighted piston to produce a calibration pressure signal. The mouth pressure transducer should be able to accurately record pressures greater than ±50 cm H2O at frequencies of 8 Hz or more. The actual mouth pressures encountered are often less than this level. Air is injected into one port of the U-tube manometer. For example, a small volume of air may be introduced to cause a deflection of 5 cm. In effect, this creates a difference of 10 cm between the two columns of the manometer. The gain of the mouth pressure amplifier is then adjusted so that its signal display deflects by an amount equivalent to 10 cm H2O/cm. The display device is most commonly a computer screen. The deflection then equals the calibration factor for the mouth pressure transducer. In the previous example, if a pressure change of 10 cm H2O resulted in a 1-cm deflection on the display, the calibration “factor” would be 10 cm H2O/cm. Because almost all plethysmograph systems are computerized, the analog output of the transducers is measured and a software correction factor is determined. The correction (or calibration) factor is calculated in a manner similar to that used for spirometer output (see section on spirometers). The correction factor is then applied by the software as the mouth pressure signals are acquired.
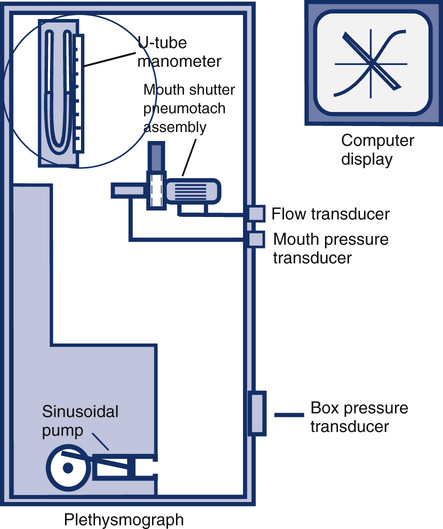
Box Pressure Transducer
Calibration of the box pressure transducer is accomplished by closing the door of the plethysmograph and applying a volume signal comparable to what occurs during patient testing. In a plethysmograph of 500–700 L, a volume signal of 25–50 mL is typical. The box pressure transducer should be capable of accurately measuring pressures as small as ±0.2 cm H2O. The box pressure transducer typically requires a range of up to 5–10 cm H2O to accommodate large changes in box pressure (e.g., thermal drift) An adjustable sine-wave pump connected to a small syringe is ideal for box calibration. A small volume is pumped into and out of the box (see Figure 12-6). With the pump operating, the gain of the box pressure transducer is adjusted so that volume change in the box causes a specific pressure change. For example, if the pressure signal generated by a 30-mL volume change is adjusted to cause a 2-cm deflection on the display, the box pressure calibration factor would be 15 mL/cm. For computerized systems (most plethysmographs), a software calibration factor is derived rather than an actual adjustment of the displayed signal. In other words, no actual adjustment of the output of the box pressure transducer is necessary; the software correction is simply applied to all signals generated during measurements. The calibration procedure may be repeated by adjusting the pump speed from 0.5–8.0 cycles/sec (Hz). Varying the frequency allows the frequency response of the box and transducer to be checked. The volume deflection or calibration factor should not change at frequencies up to 8.0 Hz. Flow-based plethysmographs may be calibrated similarly. The output of the box flow transducer is adjusted (instead of a pressure transducer) to correspond to a known volume change within the plethysmograph chamber. Flow boxes can be used as pressure boxes simply by occluding the flow sensor in the box wall. For plethysmographs that use this method, a box pressure transducer may need calibration as well.
Plethysmographs are normally calibrated empty. A volume correction for the displacement of gas by the patient can be calculated from the patient’s weight. This correction is then applied in the calculation of results (http://evolve.elsevier.com/Mottram/Ruppel/).
Flow Transducer
The pneumotachometer (flow sensor) may be calibrated by applying either a known flow or a known volume. A precise flow may be generated with a rotameter or similar calibrated flow meter. Most systems, however, calibrate the pneumotachometer with a 3-L syringe. The flow is integrated, and the gain of the flow signal is then adjusted until the output of the integrator matches the 3-L volume, just as is done for most flow-based spirometers. The flow sensor used in the plethysmograph should meet the volume range and accuracy requirements for spirometers (see Table 12-2). Just as for the box and mouth pressure transducers, a software calibration factor may be computed rather than physically adjusting the output of the flow sensor. Pressure-differential, heated-wire, or Pitot tube flow sensors may be used (see Chapter 11). Once the flow sensor is calibrated, both volumes and flows (as needed for measurement of Raw) can be measured.
The accuracy check is performed with an assistant seated in the sealed plethysmograph. The isothermal volume device is connected to the mouthpiece. The mouth shutter is then closed. While the assistant holds his or her breath, the bulb is squeezed at a rate of 1–2 times per second. A PMOUTH/PBOX tangent is recorded just as would be done when testing a patient. Thoracic gas volume (VTG) is calculated as usual, except that PH2O is not subtracted. The VTG calculated should equal the volume of the isothermal lung analog (as determined previously) within 50 mL or ±3%, whichever is greater. Correction should be made for the assistant’s volume (based on body weight) plus the known volume of the isothermal lung analog. The procedure may be repeated by squeezing the bulb at 0.5–5.0 cycles/sec to check the frequency response of the box. If the box’s frequency response is “flat,” tangents should not change when the bulb is squeezed at different rates. The lung analog must contain a sufficient mass of metal wool to act as a heat sink (i.e., isothermal). The metal wool “absorbs” changes in temperature that would result from the compression and decompression of gas in the bottle. If there is not enough metal wool, small temperature changes may affect the volume determination. Some manufacturers provide an automated isothermal lung analog that can be placed in the plethysmograph and operated under software control to provide measurements across the range of expected results for both pediatrics and adults (see Figure 12-4).
The accuracy of the box for measuring airway resistance (Raw) can be assessed with known resistances. A resistor can be made using a plug with a small-diameter orifice. Alternatively, a resistor can be constructed from capillary tubes arranged lengthwise in a flow tube. In either case, the pressure drop across the resistor must be measured at a known flow rate. Some manufacturers supply resistors with known resistances. The resistor is then inserted between the pneumotachometer/mouth shutter assembly and a test subject. The subject, whose Raw has been previously measured, then has Raw measured with the resistor in place. The increase in measured Raw should approximate that of the resistor (Box 12-8).
A third method of checking plethysmograph accuracy is to compare the VTG with FRC determined by gas dilution. Correlations greater than 0.90 have been demonstrated between gas dilution and plethysmograph lung volumes in healthy individuals. Differences greater than 10% (in healthy individuals) for volumes measured by plethysmograph and gas dilution are not specific but may indicate equipment malfunction. This method, as well as use of biologic controls, is based on measurements of healthy individuals with normal day-to-day variability. It is important that control subjects perform the breathing maneuvers correctly (see Chapter 3).
Biologic Controls
Biologic controls are healthy subjects who are available for repeated tests. These controls can be laboratory personnel or other individuals who can be tested repeatedly. Using biologic controls does not eliminate other control devices such as large-volume syringes. Although a 3-L syringe can verify volume and flow accuracy of a spirometer, biologic controls can evaluate an entire system, including spirometers, gas analyzers, plethysmographs, and software. A disadvantage of using biologic controls is that pulmonary function varies from day to day. However, by establishing means and measures of variability from repeated tests, real problems with most pulmonary function equipment can be identified (How to Box 12-2).
To provide useful statistics, 20 sets of measurements should be recorded. Pulmonary function variables that are not derived from other measurements should be recorded. These include FVC, FEV1, FRC, and Dlco. Calculated values such as TLC or DL/VA can also be used; however, if subsequent control tests show significant differences, it may be unclear which component test is at fault. Typical values selected from metabolic studies may include  o2, CO2, tidal volume,
  E, and respiratory rate at different work rates. See chapter 7 for specifics on metabolic QC performance. A calculator or a computer spreadsheet may be used to perform the simple statistics required (Table 12-6). Most spreadsheets have built-in functions to calculate mean and SD and to allow data to be graphed. The coefficient of variation (CV) may be calculated by dividing the SD by the mean. The coefficient of repeatability (CR) may also be calculated. Separate statistics should be calculated for each control and for separate instruments. Data more than 1 or 2 years old should be evaluated with more recentmeasurements to account for small normal changes in pulmonary function that occur over time (Figure 12-7).
Table 12-6
Example Spreadsheet for a Biologic Control*
Control Subject: J.S.
| Date | FVC | FEV1 | FRC | Dlco |
| 2/1/12 | 4.51 | 3.93 | 3.51 | 25.1 |
| 2/15/12 | 4.61 | 3.99 | 3.55 | 26.2 |
| 3/14/12 | 4.49 | 3.95 | 3.65 | 27.2 |
| 3/19/12 | 4.40 | 3.90 | 3.50 | 25.5 |
| 4/21/12 | 4.57 | 3.89 | 3.60 | 26.0 |
| 5/1/12 | 4.50 | 3.94 | 3.66 | 27.2 |
| 5/15/12 | 4.55 | 3.95 | 3.65 | 27.0 |
| Mean | 4.52 | 3.94 | 3.59 | 26.31 |
| SD | 0.07 | 0.03 | 0.07 | 0.85 |
| CV | 1.49% | 0.85% | 1.91% | 3.21% |
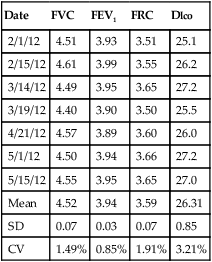
*Most spreadsheet programs have built-in functions to calculate means and standard deviations; additional calculations, such as coefficient of variation, can be entered by the user. Quality control charts may be constructed with mean and standard deviation data for each variable.
Testing biologic controls is also a means of evaluating gas analyzers. This method may not detect small changes in analyzer performance because of day-to-day variability of lung volumes, Dlco, or resting energy expenditure. Despite variability as high as 10% for Dlco or exercise parameters in healthy patients, gas analyzer malfunctions may be detected. Current research has shown that the variability in biologic controls for Dlco may be as low as 6% if the equipment is well maintained. Biologic controls may be the simplest means of checking automated exercise/metabolic systems that depend on accurate gas analysis. Abnormal results from biologic controls can suggest which component of the gas analyzer may be faulty (see chapter 7 for completed explanation of biologic QC with metabolic systems).
Commercially Prepared Controls
A sound statistical method of interpreting “control runs” is necessary to detect blood gas analyzer malfunctions (Box 12-9). The most commonly used method for detecting out-of-control situations is calculating the control mean ±2 SD. A series of runs of the same control material is performed. Twenty to 30 runs provide an adequate base for calculation of the mean and SD (see Evolve http://evolve.elsevier.com/Mottram/Ruppel/). One SD on either side of the mean in a normal distribution includes approximately 67% of the data points. Two SD include 95% of the data points in a normal distribution. Three SD include 99% of the data points in a normal series. A QC value that falls within ±2 SD of the mean is usually considered to be “in control.” If the control value falls between 2 and 3 SD from the mean, there is only a 5% chance that the run is in control. The normal variability that occurs when multiple measurements are performed is called random error. One of 20 control runs (i.e., 5%) can be expected to produce a result in the 2–3 SD range and still be acceptable. In practice, if a control run shows a value that is more than 2 SD above or below the mean, the control is usually repeated. If the second run shows a value within 2 SD of the mean, the first value was probably a random error. Conversely, if the second run produces a result that is similar to the first run (>2 SD on the same side of the mean), the instrument is probably “out of control.” This simple approach works very well for detecting most types of errors that occur in analytic instruments like blood gas analyzers. The same method has also been applied to pulmonary function equipment.
More complex sets of rules have been developed to distinguish true out-of-control situations from random errors. A widely used set of rules is that proposed by Westgard (see Selected Bibliography). The rules are selected to provide the greatest probability for detecting real errors and rejecting false errors. This approach to QC is termed the multiple-rule method. An example of the multiple-rule method may be applied as follows:
1. When one control observation exceeds the mean ±2 SD, a “warning” condition exists.
2. When one control observation exceeds the mean ±3 SD, an out-of-control condition exists.
3. When two consecutive control observations exceed the mean +2 SD or the mean −2 SD, an out-of-control condition exists.
4. When the range of differences between consecutive control runs exceeds 4 SD, an out-of-control condition exists.
5. When four consecutive control observations exceed the mean +1 SD or the mean −1 SD, an out-of-control condition exists.
6. When 10 consecutive control observations fall on the same side of the mean (±), an out-of-control condition exists.
When using the multiple-rule method, it is necessary not only to evaluate the mean and SD of the current control run, but also to keep a control history. This is often accomplished by means of a control chart (Figure 12-8), also called a Levey-Jennings plot. A graph for each control is created with the mean ±2 SD on the Y-axis and control run number (or time) on the X-axis. Individual controls are then plotted as they are run to track electrode performance.
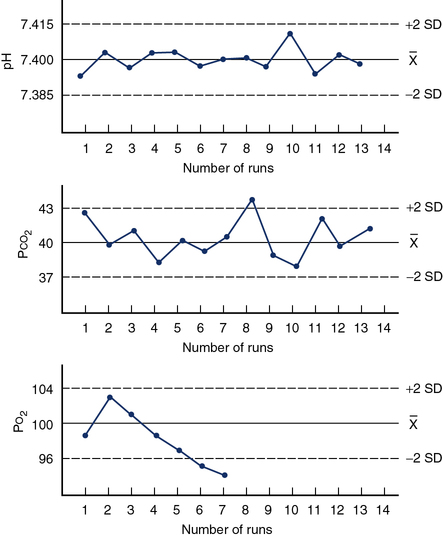
Quality control charts, or Levey-Jennings plots, are used to assess the QC. Figure 12-8 illustrates three examples of Levey-Jennings charts for pH, Pco2, and Po2. The mean for each control material is plotted as a solid line, and the ±2 SD lines are dashed. The left Y-axis on each graph is labeled with the actual mean and ±2 SD values. Consecutive control runs are plotted on the X-axis. On the pH control chart (top) all values vary about the mean in a regular fashion; the electrode appears in control (all values within ±2 SD) for the 13 measurements plotted. The Pco2 chart (middle) shows somewhat more variability. Control run 8 shows a value outside of the ±2 SD range. This may be considered a random error because subsequent controls show normal variability about the mean. The Po2 chart (bottom) shows a trend of decreasing control values. Runs 6 and 7 both produce values of more than 2 SD below the mean. This pattern suggests that the electrode or sensor is malfunctioning and needs to be serviced. By applying multiple rules (see text) to the interpretation of consecutive control runs, with or without charts, most out-of-control situations can be detected.
Documents and Records
The system for creating, reviewing, and approving documents is an example of a process document (see Table 12-1). The document for maintaining a record of procedures, effective dates, and location is an example of a form and could be created in an electronic database, a paper form, or as a spreadsheet. A procedure manual that outlines the steps for each test performed is a required document. Multiple forms may also be required to document other processes and procedures such as quality control procedures and results, equipment maintenance, quality improvement activities, equipment validation procedures, ordering forms, and pre-test instructions. Box 12-2 outlines a typical technical procedure manual for the pulmonary function laboratory.
Assessments
The Assessment QSE addresses the use of external and internal monitoring (Box 12-10). The purpose is to determine whether the defined process meets the requirements and evaluate how well the processes are functioning. Examples of external assessments include the proficiency testing program for the blood gas laboratory. Internal assessments are quality indicators such as monitoring turnaround time for pulmonary function results from performance to release the interpretation results.
Continual Improvement
The Continual Improvement QSE identifies opportunities for improvement from multiple sources such as customer surveys, nonconforming events, evidence-based practice, ATS-ERS standards, PT results, internal assessments, external inspections or evaluations, and quality indicators. Improvement opportunities may be within a specific QSE or the path of workflow. A defined strategy for continual improvement should be used. A quality report is submitted at least annually to upper management (Box 12-11). One common effective strategy in pulmonary laboratories is the provision of a technologist’s feedback loop.
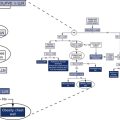
Path of workflow
The path of workflow was briefly described in Chapter 1. This section will illustrate and describe key processes in the path of workflow for the pulmonary function laboratory from the time a patient is assessed for testing clinical correlation of the results. The pre-test processes are shown in Figure 12-9.
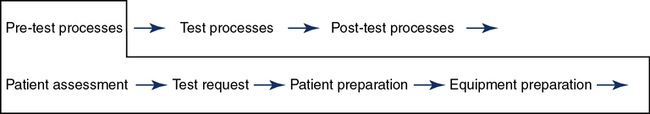
Pre-Test Process
Equipment preparation includes the final preparation of the equipment just before testing that is required to obtain reliable results. Quality control is completed at the frequencies predetermined for the laboratory and typically would be completed before this step unless a probable out-of-control situation is defined after the patient has started the testing process. Equipment that is found out of control should not be used for patient testing. Specific instructions on how to handle out-of-control situations are included in the procedure manual. Equipment calibration is performed, and all necessary supplies are ready for testing. Reference values may be selected if there are multiple options based on specific patient populations. The reference sets selected are based on current evidence and the patient population to be tested (Chapter 13). For example, the CF foundation currently requires PF laboratories to use defined reference authors.
Testing
Test Method Selection
The testing method is dependent on the patient population, equipment available, tests ordered, and, ultimately, the patient’s needs (Figure 12-10). In order to decrease unwanted variations that impact test reliability, the laboratory can validate its testing processes, equipment, and software. An initial validation is completed when new equipment is installed. Re-verification is completed when processes are changed, software is changed, or after repairs and preventive maintenance.
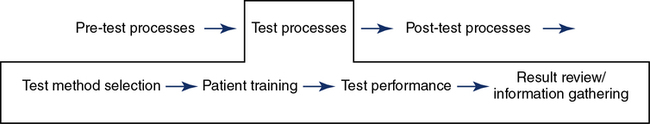
Patient training is essential to obtaining reliable results. The patient’s anxiety level and understanding of why they are being tested are important considerations to obtaining maximum cooperation. Communication strategies may need to be altered based on the age of the patient. Chapter 8 addresses training and coaching pediatric patients. Regardless of the test performed, key steps to performing the test are explained and demonstrated to the patient. If needed, an interpreter should be available. Demonstration of the procedure should always be done to achieve maximum understanding of the test procedure. The technologist training the patient needs to display the same effort required by the patient to achieve reliable tests.
Using Criteria for Acceptability/Repeatability
Criteria for assessing the validity of various tests have been described in Chapters 2 through 9. Standards for pulmonary function testing have been published by the ATS in conjunction with the ERS. Criteria for acceptability have three primary uses:
1. To provide a basis for decision making during testing. Standards or guidelines can be used to decide whether equipment is functioning properly, whether the patient is giving maximal effort, or whether testing should be continued or repeated. Standardized criteria also help characterize the types of problems known to occur during specific tests (e.g., poor effort during spirometry).
2. To evaluate validity of pulmonary function data from an individual patient. Criteria may be applied by the technologist performing the test, by computer software, or by the clinician responsible for interpretation. This may consist of assigning a letter grade or a code to individual efforts or tests.
3. To score or evaluate the performance of the technologist. Many pulmonary function tests, especially spirometry, depend on the interaction between the technologist and the patient. Criteria for acceptability can be used to gauge the performance of individual technologists and to provide objective feedback.
Evaluate Key Indicators
The technologist’s comments or notes can usually be added to the test results. The commentary should be based on standardized criteria. If a particular test meets all criteria, that fact should be stated. Failure to meet any of the laboratory’s criteria should be documented as well. The reason the patient was unable to perform the test acceptably should be explained whenever possible. Failure to meet criteria for acceptability does not necessarily invalidate a test. For some patients, their best performance may fail one or more of the criteria. Table 12-7 lists examples of statements that may be used to document test quality.
Table 12-7
Technologist’s Comments (Examples)
| Test | Comments |
| Spirometry | Meets all ATS-ERS recommendations. |
| Poor start of test or patient effort. | |
| Expiration did not last 6 seconds, or no obvious plateau for age 10 years old or greater (3 seconds for <10). | |
| Back-extrapolated volume was >5% of FVC. | |
| Patient was unable to continue to exhale because of _____. | |
| Two best acceptable FVC maneuvers were not within 150 mL. | |
| Two best acceptable FEV1 maneuvers were not within 150 mL. | |
| MVV does not correlate with FEV1. | |
| Lung volumes (gas dilution) | Lung volumes by (method)—meet ATS-ERS recommendations. |
| Lung volumes reported were the average of (n) FRC determinations. | |
| Slow VC was (greater/less) than FVC (_____%). | |
| Lung volumes were unacceptable because of a leak. | |
| Equilibration not reached within 7 minutes—He dilution. | |
| Alveolar N2 >1.5% after 7 minutes—N2 washout. | |
| Plethysmography | All plethysmographic measurements met ATS-ERS recommendations. |
| FRCpleth measurements were variable. | |
| Raw measurements were variable. | |
| Patient was unable to pant at the correct frequency. | |
| Dlcosb | Meets all ATS-ERS recommendations. |
| Dlco reported is average of (n) maneuvers. | |
| Predicted Dlco corrected for an Hb of _____. | |
| Inspired volume <85% of best VC (_____%). | |
| Breath-hold time not within 8–12 seconds (_____ seconds). | |
| Dlco values not within 3 mL CO/min/mm Hg or 10%. | |
| Dlco not corrected for Hb or COHb. |
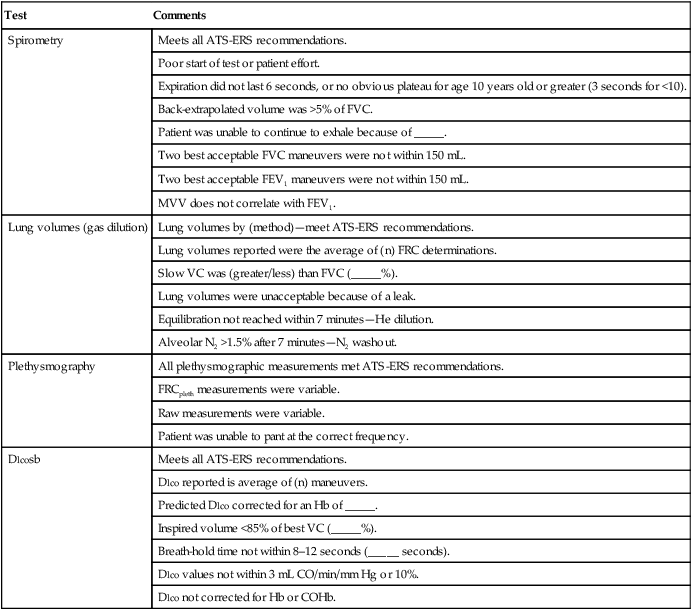
*Values in parentheses may be filled in with appropriate values from the patient’s data.
The technologist’s comments can be included in the final report. Many automated systems provide for “free text” comments to be included with tabular data. Some software supports “canned text” functions that allow predetermined statements (see Table 12-7) to be entered with a single keystroke. The technologist’s name or initials should be included. The technologist’s comments should be clearly identified to avoid confusion with the physician’s interpretation.
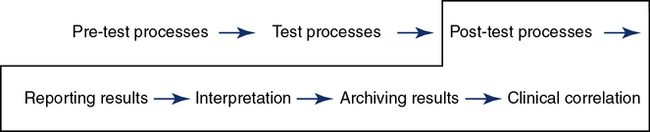
Post-Testing
Results reporting occurs after the quality review is completed and the final data have been selected for the report (Figure 12-11). A system for a secondary review of results as a routine or random evaluation leads to continual improvement. It also provides a forum to discuss methods to improve testing processes. The report format needs to provide numeric and graphic results for the interpretation process. If preliminary and final reports are used, both must be accurately labeled in the patient chart and the process defined when a preliminary is replaced by a final report. Turnaround times for report generation can be a quality indicator for the laboratory. If a report is found to be an erroneous post release, a system for the correction and replacement of the original report is required. This includes a method to verify that the health care provider is notified. The laboratory should establish acceptable limits for each test. Notification procedures for “alert” results and a documentation process should be available in the procedure manual and immediately available for all technologists.
Summary
• The quality systems approach is outlined with a review of the 12 QSEs and path of workflow as applied to the pulmonary function laboratory and blood gases.
• Calibration and verification of spirometers, gas analyzers, Dlco systems, and body plethysmographs are discussed. Special emphasis is placed on techniques to ensure that pulmonary function equipment meets established standards of accuracy and precision. QC methods are reviewed, including the use of large-volume syringes, biologic controls, and lung simulators.
• Calibration and QC of blood gas analyzers are discussed, as well as advantages and disadvantages of automated calibration.
• Basic statistical concepts commonly used in laboratory situations are covered, including the application of multiple control rules.
• Testing technique is a key element in ensuring the validity of pulmonary function data. Some guidelines for applying acceptability and repeatability criteria (as listed throughout the text) are given. These include decision-making pre-testing, during testing, assessing test quality for interpretive purposes, and providing feedback on the technologist’s performance.
• Infection control and safety issues are presented. Cleaning of spirometers and related equipment along with techniques to avoid cross-contamination are listed. Standard precautions applicable to blood gas analysis and pulmonary function testing are reviewed.
• The QSEs and path of workflow concepts incorporated in multiple CLSI quality management documents list five probable outcomes by implementing this approach: the ability to reduce or eliminate medical error, the likelihood of meeting customer expectations, more effective and efficient operations, the potential for successful governmental and accreditation assessments, and sustainable attainment of quality objectives.
Case Studies
Case 12-1
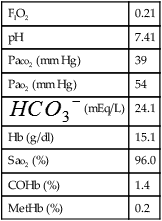
This case describes the use of blood gas QC to detect analytic errors.
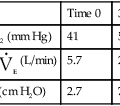
| FIO2 | 0.21 |
| pH | 7.41 |
| Paco2 (mm Hg) | 39 |
| Pao2 (mm Hg) | 54 |
 (mEq/L) (mEq/L) |
24.1 |
| Hb (g/dl) | 15.1 |
| Sao2 (%) | 96.0 |
| COHb (%) | 1.4 |
| MetHb (%) | 0.2 |
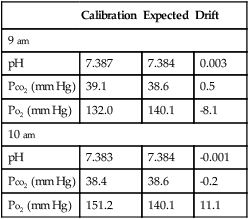
A review of the two most recent automatic calibrations revealed the following:
| Calibration | Expected | Drift | |
| 9 am | |||
| pH | 7.387 | 7.384 | 0.003 |
| Pco2 (mm Hg) | 39.1 | 38.6 | 0.5 |
| Po2 (mm Hg) | 132.0 | 140.1 | -8.1 |
| 10 am | |||
| pH | 7.383 | 7.384 | -0.001 |
| Pco2 (mm Hg) | 38.4 | 38.6 | -0.2 |
| Po2 (mm Hg) | 151.2 | 140.1 | 11.1 |
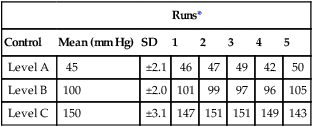
Blood Gas Quality Control (Five Most Recent Runs)
| Runs* | |||||||
| Control | Mean (mm Hg) | SD | 1 | 2 | 3 | 4 | 5 |
| Level A | 45 | ±2.1 | 46 | 47 | 49 | 42 | 50 |
| Level B | 100 | ±2.0 | 101 | 99 | 97 | 96 | 105 |
| Level C | 150 | ±3.1 | 147 | 151 | 151 | 149 | 143 |
Case 12-2
This case addresses the use of biologic controls in the pulmonary function laboratory.
| Subject 1 | Subject 2 | Subject 3 | |
| FVC | 4.04 (101%) | 5.22 (97%) | 3.90 (83%) |
| FEV1 | 3.51 (99%) | 4.10 (103%) | 3.12 (82%) |
| FEV1% | 87% | 79% | 80% |
| TLC | 5.11 (98%) | 6.96 (100%) | 5.01 (81%) |
| Dlco* | 14.3 (69%) | 18.2 (65%) | 10.2 (50%) |
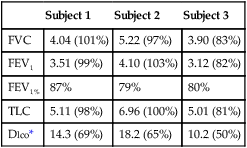
This laboratory was fortunate to have access to a Dlco simulator (see Figure 12-3), as described previously. Simulations were performed with two different levels of precision gases. The simulator showed Dlco values that were similarly reduced in comparison to the expected values. Examination of the measured CO and tracer gas concentrations with the simulator revealed that the CO values were significantly larger than expected, resulting in low calculated Dlco. The faulty gas analyzer was replaced before any further subject testing was conducted. Both biologic controls and simulations showed acceptable Dlco values after replacement of the analyzer.
1. A pulmonary function technologist is checking a small portable spirometer that uses disposable flow sensors. Repeated injections from a 3-L syringe produce the following results:
Which of the following best describes these results?
a. The flow sensor is defective.
b. Spirometer shows excessive drift.
2. QC is performed on a blood gas analyzer. The Pco2 electrode shows the following results when plotted on a QC chart (Levey-Jennings):
Which of the following best describes the result of control run 10?
3. The pulmonary function laboratory develops and implements a training and orientation guide for new employees. This process is a requirement of which QSE?
4. When developing a quality control program, which of the following devices would the technologist select to determine the FRCPL?
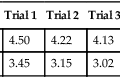
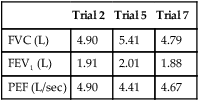
5. After performing eight FVC maneuvers, these results are recorded from the three best efforts:
| Trial 2 | Trial 5 | Trial 7 | |
| FVC (L) | 4.90 | 5.41 | 4.79 |
| FEV1 (L) | 1.91 | 2.01 | 1.88 |
| PEF (L/sec) | 4.90 | 4.41 | 4.67 |
6. Daily maintenance of a body plethysmograph should include which of the following?
1. Calibration of the box pressure transducer
2. Calibration of the flow sensor (pneumotachometer)
3. Checking the mouth pressure transducer against a known standard
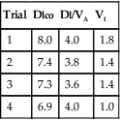
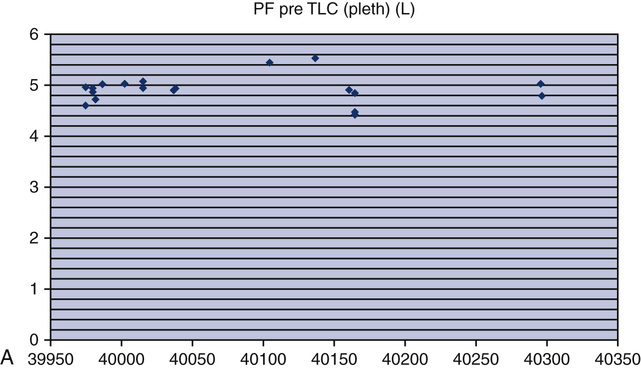
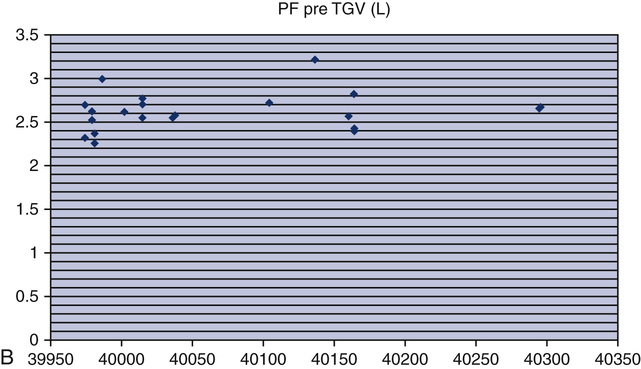
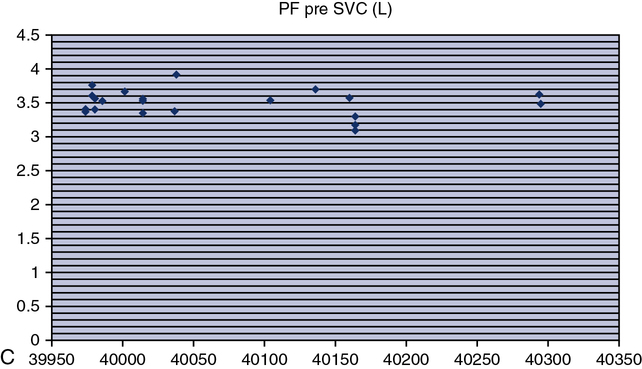
7. A biologic control subject performs multiple FRCpleth maneuvers to check the accuracy of a variable-pressure body box. The control subject’s established FRC is 3.60 L with an SD of 0.15 L. The following FRC values are obtained from the control:
Based on these findings, the pulmonary function technologist should conclude that:
a. The plethysmograph is functioning within acceptable limits.
b. The plethysmograph door seal has a small leak.
c. The mouth pressure transducer has not been calibrated correctly.
8. Which of the following can be used to verify the function of an automated Dlco system?
9. Which of the following are most likely to cause cross-contamination in the pulmonary function laboratory?
10. A pulmonary function technologist simulates Dlcosb maneuvers using a 3-L calibration syringe. She turns the BTPS correction off, but all other settings are configured as for patient testing. Three maneuvers produce the following results:
Trial 2: − 0.20 mL CO/min/mm Hg
On the basis of these results, the technologist should conclude that:
a. BTPS corrections should have been on to simulate Dlco.
b. The CO analyzer is malfunctioning.
11. Which of the following should the pulmonary function technologist do when drawing an arterial blood sample?
1. Use eye protection if there is a possibility of blood splashing.
2. Check the patient history to see whether protective barriers are needed.
3. Wear gloves while drawing and analyzing the specimen.
4. Dispose of needles and syringes in red plastic bags marked “Biohazard.”
12. Which of the following questions does a policy statement answer in the quality manual?
a. How do we obtain reliable spirometry in our laboratory?
b. How is quality control performed for the Dlco system?
c. What is the laboratory’s intent for orientation, training, and competence assessment?
13. The equipment software has been updated. Which of the following processes should be verified to ensure data integrity?
14. The following interpretation turnaround data were included in the annual quality report: