Chapter 9. Quality and patient safety: How do we get there from here?
Rebecca Warburton
Introduction
The journey is turning out to be more complicated than many hoped. There are no ‘quick fixes’, simply pointing out the problem has not changed things. Insights into the reasons why this is so are coming from many other fields including from complex systems, human factors engineering, high-risk industries such as aviation and nuclear power, and from studies into organisational culture and change.
Most healthcare organisations still lack basic measurements of the scope of the safety problem in their own settings. While the previously common ‘don’t ask, don’t tell’ code of silence is fading, recent infant heart surgery scandals in Winnipeg and Bristol (Gillies & Howard 2005) show that it isn’t gone. Similarly, the blame–shame–name culture that focused on weeding out the ‘bad apples’ (the person approach) is giving way to the systems approach (where it is recognised that systems, not careless individuals, create most patient harm) but the shift is far from complete. There is cause for hope, but also a great deal that needs to be done for healthcare to realise its full potential of creating benefit for patients and avoiding harm.
Awareness of the need for improvement now extends well beyond the services that deliver healthcare. Quality and safety recommendations and requirements from accreditation agencies, government departments, drug and equipment vendors and improvement organisations regularly inundate hospitals and other healthcare provider organisations. Yet a key problem for administrators and clinicians is that little guidance is available about the relative priority of desired changes. Other chapters in this book consider quality and safety improvements from the perspective of those working in the organisation that are charged with the responsibility to improve performance. This chapter proposes an economic model to prioritise improvement, recognising that not everything can be done immediately, and that solid research evidence does not yet exist on the costs and effects of many potential improvements.
The chapter argues that if we are to gain the maximum reduction in harm for the resources that hospitals have available to improve safety, we need to collect and use cost-effectiveness evidence both to prioritise proposed safety improvements and to target new research. The chapter:
▪ explains the rationale for the need to prioritise quality and safety initiatives
▪ describes the methods needed to produce evidence of cost effectiveness
▪ suggests a number of promising starting points to improve healthcare safety in the absence of good evidence.
How much safety is enough?
The dictum of ‘first, do no harm’ drives healthcare providers to seek perfect, harm-free performance. Yet modern medicine, like modern life generally, cannot always be made perfectly safe. Holding perfection as an ideal is inspiring and perhaps necessary to discourage complacency (Berwick 2001), but there can be great harm in trying to achieve perfection because near-perfection often imposes near-infinite costs. The closer we get to perfection in any particular area, the more likely it becomes that we could have achieved ‘a better bang for our preventive buck’ somewhere else (Warburton 2003). Therefore actions must be prioritised, and evidence of benefit and cost is needed to do so.
Economists count as a cost anything of value that any person gives up, including money, time or pleasure. Leading advocates of evidence-based medicine have adopted this approach, and suggest that physicians think of costs as ‘other treatments you can’t afford to do if you use your scarce resources to do this one’, noting that ‘when internists borrow a bed from their surgical colleagues in order to admit a medical emergency tonight, the opportunity cost includes tomorrow’s cancelled surgery’ (Sackett et al 1997:100).
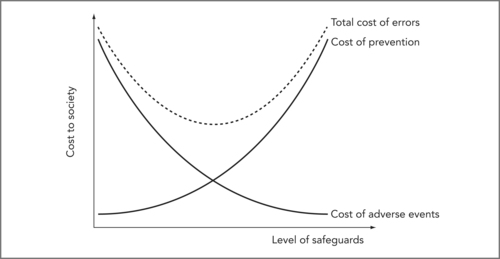
In healthcare terms, the costs of preventable adverse events are the value of the lost quality-adjusted life years (QALYs) of patients harmed plus the QALYs and lifetime productivity lost by health professionals unfairly blamed for ‘committing’11 an error plus the value of the time and resources used trying to mitigate or reverse harm, analyse the error and order compensation (i.e. treatment, risk analysis, legal and court costs). 12 The costs of preventing these events include the direct costs of resources put into safety-improving initiatives, which could otherwise have been spent on healthcare plus the value of QALYs and other resources lost because of delays or new errors caused by safeguards. Decisions to commit resources to improve safety should be undertaken thoughtfully, because successive improvements in safety generally impose progressively higher costs for each increment of improvement gained. Consider the simplified model in Figure 9.1 showing the costs (or value) of both prevention and adverse events at various levels of safety precaution. (Only the costs of preventable adverse events, due to errors, are included in the figure.)
12From the point of view of society as a whole, amounts paid in compensation do not count, as they are simply a transfer from one party to another, though of course these payments matter very much to those who pay or receive them.
 |
| Figure 9.1 |
So how much safety is enough? If we consider only preventable adverse events and ignore the cost of improving safety, then perfect safety should be the goal. Once we consider the costs of prevention, though, we can see that we want to minimise the sum of the costs of adverse events and prevention. This sum is the dotted line in Figure 9.1 and it is U-shaped; we have enough safety at the bottom of the U. Improving safety beyond that point imposes marginal (extra) costs (from new safety precautions) that are larger than the marginal benefits (savings from newly avoided preventable adverse events).
A note about the shape of the curves in Figure 9.1: as drawn, the figure implies that safety improvements are adopted in order of cost effectiveness. Starting at the left, the steep slope of the dotted line indicates that total cost decreases rapidly as we first begin to improve safety, because initial safety improvements are relatively cheap (prevention cost increases very little) and quite effective (preventable adverse event cost drops significantly). The dotted line flattens out as we move towards the bottom of the U because later safety improvements cost a little more, and produce smaller benefits. Past the optimal level of safety (bottom of the U) the curve turns up; total costs increase because extra safety improvements are now quite costly yet produce only small benefits (little reduction in adverse events). This trade-off gets continually worse as we increase safety further past the optimum.
Arguably, healthcare safety will need to increase dramatically before we will be anywhere near the optimal safety level at the bottom of the U. But even in our current situation, we need to remember that every action comes at the expense of not doing something else. In the rush to improve patient safety, we need to remember that putting more effort into safety will likely force hospitals to put less effort into something else, at least in the short run.
Costs and benefits – Why economic evaluation?
If more safety means less of ‘something else’, it becomes essential to ask: Which something else? What must we give up to make healthcare safer? There is no one answer to this question. For example, different safety improvements may either:
▪ cost very little, and create huge healthcare savings by avoiding patient injuries that can be corrected, but at great cost (Berwick 1998)
▪ cost very little, and save lives, but produce little in direct healthcare savings
▪ cost a great deal, and produce only small reductions in risk
▪ delay care or create new risks (Patterson et al 2002)
▪ increase workload, reduce employee satisfaction and make future changes harder
▪ streamline work and make it more rewarding, increasing employee buy-in and making future changes easier.
In clinical terms, as Merry notes subsequently in Chapter 11, extra safety checks may delay care and reduce patient throughput, endangering patients in situations where timeliness is essential. Without a fair assessment of the costs and effects (both intended and unintended) of proposed changes, it can be difficult to set priorities and impossible to know whether the best choice has been made. Yet most of the research now planned or in progress ignores costs and looks only at effects. This must change if we are to make sensible choices. We can turn to established methods in economic evaluation and technology assessment to inform these decisions, because the need to compare costs and effects is not unique to error reduction.
Pause for reflection
What do we give up when we try to make care safer? Do unintended consequences reduce the benefits in terms of safety and quality?
Setting priorities
When costs are not considered before action is taken, higher than acceptable costs can be the result. Most health regions can adopt only a fraction of recommended improvements due to constrained finances and limited staff time to safely implement change. This creates a danger of not adopting improvements in order of their cost effectiveness, and real examples exist: the universal precautions (an occupational health and safety initiative recommended by the US Centers for Disease Control to prevent worksite transmission of HIV to healthcare workers) cost from $100,000 to $1.7 million per QALY. 13 These precautions have been widely implemented in the US and Canada, yet many vaccines with much lower costs per QALY remain underutilised (even by Canadian regional health authorities responsible for both hospitals and immunisation).
13Original estimate of C$8 million to C$128 million in 1990 per case of HIV seroconversion prevented from Stock et al 1990; updated and converted to US$6.5 million to US$104 million in 2002 by the author (Warburton 2005); cost per QALY based on 60 lost QALYs per seroconversion.
Because human preferences must be considered in setting priorities, it is not possible to set rigid rules for the ‘correct’ value of a QALY. Despite general support for the use of QALYs in setting priorities (Bryan et al 2002) allocation preferences are affected by circumstances and patient characteristics (Schwappach 2002). Most people value fairness and are willing to sacrifice some QALY gains to achieve more equality in access (Schwappach 2003). Perhaps healthcare workers are seen as more deserving of protection since they risk exposure to disease in their role caring for others. Alternatively, healthcare employers may have been willing (as in the case of universal precautions mentioned earlier) to incur high costs for prevention because of the difficulty and high costs involved in compensating and replacing skilled employees infected with HIV at work. The argument that the high cost paid to protect healthcare workers reflects preferences would be more compelling, however, if there were evidence that the high costs had been known before universal precautions were implemented; a credible rival hypothesis is that many non-optimal choices result from lack of information. (If employers believed employees to be deserving of special treatment, it means they understood that universal precautions were expensive, but felt the benefits outweighed the costs; alternatively, they might have made the decision not realising how expensive it actually was. It can’t be both ways.)
While preferences might mean that we would not adopt improvements in exact cost-effectiveness order, we still would not expect huge discrepancies. Hence, it is hard to argue against estimating costs per QALY before (rather than after) initiating costly safety improvements.
Adopting costly, ineffective safety improvements when inexpensive but effective ones are available would be a double waste of resources; more would be spent than necessary on safety, and less obtained (in benefits) than was possible. In the US and the UK, reducing errors is seen as central to improving quality while controlling costs (Barach & Small 2000). Yet this hope is unlikely to be realised unless research examines both the costs and the effects of specific changes intended to reduce errors.
Pause for reflection
What information do we need before we embark upon safety improvement activities? How and by whom should this information be obtained?
Producing the evidence
In terms of the evaluation of safety improvements, it is important to apply both formative and summative evaluation tools. Formative evaluation (designed to shape and improve changes on the fly as they proceed) is important to ensure that the change is implemented as well as possible. This will avoid applying summative (after-the-fact) evaluation to a poorly implemented improvement.
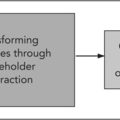
A prime example of a formative tool is Deming’s Plan–Do–Study–Act (PDSA) rapid-cycle change model of continuous quality improvement (Langley et al 1996), also discussed by Boaden & Harvey in Chapter 10. The PDSA cycle (Institute for Healthcare Improvement 2006) as shown in Figure 9.2 is powerful because first attempts to improve a complex system are rarely perfect, and it is important to re-assess and redesign flexibly until the intended results are achieved locally (or shown not to result even when the change is implemented as well as possible). The PDSA cycle holds out this promise. The cycle begins with three questions:
 |
| Figure 9.2 |
1. What are we trying to accomplish?
2. How will we know that a change is an improvement?
3. What changes can we make that will result in an improvement?
Quality improvement based on this model begins with discussion of these questions, leading to design of an improvement (plan). As the improvement is implemented (do), it is monitored (study) to determine effectiveness. Finally, it may be modified (act) as necessary based on experience and evidence. The cycle repeats itself to create continuous quality improvement.
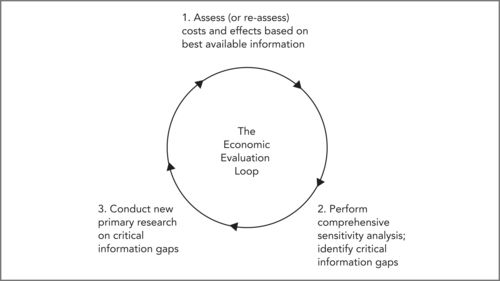
Even where PDSA cycles provide evidence that improvement projects have been successful, priorities for how and when to spread those improvements beyond the pilot sites requires evidence on costs and effects. To establish this stronger evidence, and ensure that the most cost-effective changes are implemented across the system, more rigorous summative evaluation methods are needed. An example is the Economic Evaluation Loop (EEL) (Warburton 2005). This model assesses the costs and benefits of a change, then tests plausible alternatives with a sensitivity analysis. Careful sensitivity analysis can reveal whether or not further information is needed before the results are sufficiently robust to be used in priority setting.
The EEL (shown in Figure 9.3) outlines a process that will ensure scarce research efforts are directed to the areas where new information has greatest value.
 |
| Figure 9.3 |
Box 9.1 sets out the three essential steps of the EEL process.
Box 9.1
Step 1: An initial estimate is made of base-case (expected) costs and benefits (in QALYs) for all alternative strategies. This initial synthesis combines existing research, from whatever source, and may include modelling.
Step 2: The potential impact of uncertainty is explored in a comprehensive sensitivity analysis, again including synthesis of evidence from literature. All plausible alternative assumptions, and alternative values for key variables, are tested to determine what impact they have on results. Any plausible alternative values or assumptions that alter base-case conclusions are identified as critical information gaps; no firm conclusion can be reached until better information is obtained in these areas.
Step 3: New primary research is conducted to fill critical information gaps. The cycle begins again as these results are used to improve the estimates in Step 1, and to refine the sensitivity analysis in Step 2. Conclusions are deemed reliable only when no critical information gaps remain, and the sensitivity analysis reveals consistent conclusions under all plausible assumptions.
This new assessment loop can be used for small and large projects at the clinical, organisational and policy levels. It is consistent with and follows the excellent precedent set by the Technology Assessment Iterative Loop (TAIL) (Tugwell et al., 1986 and Tugwell et al., 1995) in recognising that the job of assessment must continue throughout the useful life of a technology because costs, effects and uses evolve. In the first cycle, the emphasis is on ‘quick and dirty’ assessment (Steps 1 and 2) to target future primary research (Step 3). As new data collection is completed, later cycles incorporate increasingly reliable evidence, and confidence in base-case results increases. Periodic reassessment is required to ensure that results remain reliable.
Where to start, without the evidence?
The preceding sections outline the evidence needed to gain the maximum benefit from improvements in healthcare. Unfortunately this evidence has not yet been generated. So where should improvement start? Because we now understand that healthcare is a high-risk industry and a complex system dependent for its safe operation on human beings, useful evidence to start improvement can come from outside healthcare. As noted earlier, useful insights have come from research in fields including complex systems, human factors engineering, reliable communication, and organisational culture and change, as well as from applications of that research in high-risk industries such as aviation and nuclear power. The single best source of good ideas presently is Don Berwick’s Institute for Healthcare Improvement (IHI) (see Berding, Resources). More information on the following short list of necessary first steps and promising avenues for progress set out in Box 9.2 can be found at the IHI website (see www.ihi.org).
Box 9.2
Research already undertaken into quality improvement and patient safety and discussed throughout this book has shown that to operate safely, a complex high-risk industry needs:
▪ a ‘learning culture’
▪ strong leadership on safety (both top-down and bottom-up)
▪ a clear focus on the goal of changing procedures to make safety easy, and danger/harm hard
▪ appropriate multidisciplinary teams
▪ effective communication within and between teams and divisions.
Leaders can be divided into two types: top-down and bottom-up. Top-down leaders (corporate or lay managers, administrators and policymakers) need to:
▪ have a genuine understanding of patient safety issues
▪ lead by example to foster a learning culture that takes a systems view of mistakes rather than a personal (blame–shame–name) view
▪ provide adequate resources (improvement generally costs more at first, though it may save or make the use of existing resources more efficient, if successful)
▪ continually demand (and support the development of) better data on safety
▪ support the use of appropriate methods for improvement and evaluation.
Bottom-up leaders (staff and point-of-care managers) need to:
▪ regain (or maintain) hope of improvement and regain (or maintain) control of quality improvement in practical terms (make suggestions, learn PDSA, and apply)
▪ be unafraid to make mistakes in improvement, but be afraid to make the same one twice!
▪ celebrate ‘good catches’, and propose improvements to prevent it from happening again.
Specific techniques that need to be in any organisation’s safety toolbox include:
▪ sort out the appropriate roles of boards, administrators, and staff in improving safety (Reinertsen 2003)
▪ improve incident reporting systems of near misses as well as critical incidents
▪ train staff in methods such as the PDSA improvement cycle; root cause analysis (RCA) (Hirsch & Wallace 2003) (RCA is an in-depth analysis when a complex system has failed and the cause is not clear); failure mode effects analysis (FMEA) (DeRosier et al 2002) (FMEA is a method of analysing the riskiness of a process); and safety huddles (routine, short staff meetings focused on safety hazards and fixes)
▪ apply PDSA whenever an improvement is planned
▪ apply RCA to analyse both critical incidents and near misses where causation is unclear; and use FMEA to assess the riskiness of planned process changes before they are implemented
▪ use a trigger tool (Rozich et al 2003) to detect unreported adverse events (which may then require investigation using RCA)
▪ manage shifts and shift transitions to minimise the danger of on-the-job fatigue (Dawson & McCulloch 2005).
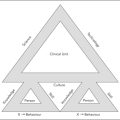
These success factors make clear that improved safety and quality is a shared responsibility of clinicians, support staff, managers, and funders at all levels. Administrators play a significant role in creating an environment that supports improvement and finds resources. Clinical staff must engage with improvement efforts and lead change on the ground. Beyond the health service organisation itself, boards, funders and policymakers can foster supportive environments and influence safety improvements through their policy decisions and recommendations (of the type that Jorm et al outline in Chapter 12).
In keeping with the intent to apply improvements in order of cost effectiveness, it is important to begin improvements in areas likely to provide the greatest benefits in proportion to resources spent, even where costs and benefits cannot be known precisely. This is called going after the low-hanging fruit first.
Box 9.3
These include:
▪ known high-risk activities, drugs or devices, such as:
▪ care transitions (hand-offs or handovers) many problems result from poor attention to medication reconciliation and medical orders when patients are admitted, transferred or discharged, and at shift changes
▪ high-risk medications – the top three are insulin, anticoagulants and sedatives
▪ high-risk devices such as infusion pumps.
The Institute for Health Improvement and other organisations offer collaboratives and campaigns to support organisations as they take action in promising areas of improvement (see Berding, Resources). For an organisation deciding where to start, it is important not to go it alone.
It may seem paradoxical for this chapter to argue for the importance of implementing changes in order of cost effectiveness, and for the need to apply the EEL to changes so as to continually generate rigorous evidence on the costs and benefits of improvements, while recommending a laundry list of improvements whose cost effectiveness has not been demonstrated. The key to reconciling the apparent paradox is simple: implement, but evaluate. The way forward in patient safety is to ensure that as improvements proceed, knowledge of costs and benefits increases so that, over time, the most cost-effective changes can be identified and placed at top priority.
From patient safety to better overall quality of care
Much has been learned about patient safety, although there is still a long way to go. Nonetheless, we can be optimistic about the future because patient safety is the lever for improving quality generally. It is the ‘foot in the door’ for broad, sustained improvements in quality of care. Why might this be so, and why should we be optimistic? It is so because, as noted earlier, no one in healthcare can be complacent about patient safety. The issue is here to stay and new approaches are being tried. This is cause for optimism in terms of overall quality, because while excellent patient safety is necessary for high-quality care, it isn’t sufficient.
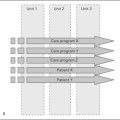
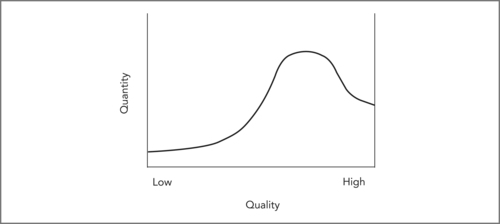
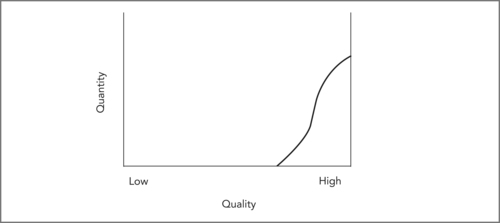
The distinction between safety and quality is important. Safety is more qualitative than quantitative because it requires a cultural shift and a change in the distribution of quality. Think of quality in healthcare (overall, or in one organisation or site of care) as being distributed from low to high, something like Figure 9.4. Quality improvement is more quantitative because it involves incremental improvements in quality, and progresses by taking rigorous measures of patient outcomes and comparing them over time (see Boaden & Harvey, Chapter 10).
 |
| Figure 9.4 |
Patient safety is higher at the high-quality end, but some harm occurs to patients in all parts of the quality distribution. Preventable harm is presumably rare with high-quality care, though harm can still occur in ways that are (at our current stage of knowledge) not predictable, and hence not preventable. Preventable harm is presumably most common with low-quality care yet we hope few organisations or locations consistently provide low-quality care. Most care is routine, delivered at medium or average quality, and this is probably where most harm occurs to patients as well (simply because so much more care is delivered in this part of the quality distribution).
The goal of the patient safety movement is to reduce preventable harm to patients. In light of Figure 9.4, this goal can be seen to have two different components: to truncate or remove the low-quality end of the quality distribution, and to reduce harm in the middle part of the distribution. In general, the key method of improving patient safety is to improve processes of care in order to make safety easier (and risky care more difficult) than at present. However, the overall goal of improving quality is somewhat different. In this case the goal is to shift the entire quality distribution to the right. The ideal quality distribution being sought is more like Figure 9.5. This involves not only reducing harm, but also improving care to ensure that patients obtain the maximum health benefit possible.
 |
| Figure 9.5 |
Why be optimistic that these two different tasks (improving safety and improving quality) are related? Because the actions needed to improve safety are fundamentally the same as those needed to improve quality, even though the initial goals are not the same. Pathways, for instance, as outlined by Boaden & Harvey in Chapter 10, can help ameliorate the poorest-quality care (for example where major delays or missed steps occur) and improve routine care (for example by bundling services that need to be done sequentially yet quickly for effective care). (See Berg, Schellekens & Bergen, Chapter 8.) The design and use of pathways requires a cultural shift from applying the clinical expertise of individual clinicians to individual patients to designing standardised evidence-based protocols for routine care for populations of patients undergoing similar treatment. Focusing on variation and flow, as Boaden & Harvey propose, and standardising processes to reduce the former and streamline the latter, as Berg, Skellekens & Bergen propose, can be formatively evaluated through PDSA cycles. Summative evaluation (comparing overall performance before and after pathway use via the EEL) would be appropriate only after sufficient experience shows that benefit is being gained.
Box 9.4
Steps in prioritising initiatives:
1. Focus on the goal; implement safety improvements in order of cost effectiveness (or likely cost effectiveness, if evidence is lacking).
2. Recognise the importance of leadership and cultural change.
3. Support staff to acquire and master essential tools such as improved incident reporting (including near misses); PDSA improvement cycles; trigger tools; RCA and FMEA.
4. Target improvement to known high-risk activities, drugs or devices such as care transitions, high-risk medications and high-risk devices. Employ both formative evaluation (to implement each change well) and summative evaluation (using the EEL as a framework) to guide the cost-effective spread of improvement based on experience. Collect data and generate evidence on costs and effects of changes.
Conclusion
Basing safety improvement recommendations on existing research evidence will not promote cost-effective reductions in patient harm, because few of the most promising improvements have been rigorously evaluated. However, waiting for complete evidence is not reasonable either; we have enough information to begin. The key to sustained improvements in safety, and perhaps in quality more generally, is to begin with plausible changes that seem likely to be cost effective; use PDSA improvement methods to implement changes as well as possible; and then apply the EEL to produce rigorous evidence on costs and effects. This more rigorously produced evidence can then guide the cost-effective spread of improvements to other settings, to help healthcare achieve its full safety and quality potential.
References
Barach, P.; Small, S.D., Reporting and preventing medical mishaps: lessons from non-medical near miss reporting systems, BMJ (Clinical research ed.) 320 (7237) (2000) 759–763.
Berwick, D.M., As good as it should get: making health care better in the new millennium. (1998) National Coalition for Health Care, Washington DC.
Bryan, S.; Roberts, T.; Heginbotham, C.; et al., QALY-maximisation and public preferences: results from a general population survey, Health economics 11 (8) (2002) 679–693.
Dawson, D.; McCulloch, K., Managing fatigue: It’s about sleep, Sleep Medicine Reviews 9 (2005) 365–380.
DeRosier, J.; Stalhandske, E.; Bagian, J.P.; et al., Using health care Failure Mode and Effect Analysis: the VA National Centre for Patient Safety’s prospective risk analysis system, The Joint Commission journal on quality improvement 28 (5) (2002) 248–267; 209.
Gillies, A.; Howard, J., An international comparison of information in adverse events, International journal of health care quality assurance incorporating Leadership in health services 18 (4–5) (2005) 343–352.
Langley, G.; Nolan, K.; Nolan, T.; et al., The improvement guide: a practical approach to enhancing organizational performance. 1st edn (1996) Jossey-Bass Publishers, San Francisco.
Patterson, E.S.; Cook, R.I.; Render, M.L., Improving patient safety by identifying side effects from introducing bar coding in medication administration, Journal of the American Medical Informatics Association 9 (5) (2002) 540–553.
Rozich, J.D.; Haraden, C.R.; Resar, R.K., Adverse drug event trigger tool: a practical methodology for measuring medication related harm, Qual. Saf Health Care 12 (3) (2003) 194–200.
Sackett, D.L.; Richardson, W.S.; Rosenberg, W.M.C.; et al., Evidence-based medicine: how to practice and teach EBM. (1997) Churchill Livingstone, New York.
Schwappach, D.L., Does it matter who you are or what you gain? An experimental study of preferences for resource allocation, Health economics 12 (4) (2003) 255–267.
Schwappach, D.L., Resource allocation, social values and the QALY: a review of the debate and empirical evidence, Health expectations: an international journal of public participation in health care and health policy 5 (3) (2002) 210–222.
Stock, S.R.; Gafni, S.R.; Bloch, R.F., Universal precautions to prevent HIV transmission to health care workers: an economic analysis, CMAJ 142 (1990) 937–946.
Tugwell, P.; Bennett, K.; Feeny, D.; et al., A framework for the evaluation of technology: the technology assessment iterative loop, In: (Editors: Feeny, D.; Guyatt, G.; Tugwell, P.) Health care technology: effectiveness, efficiency, and public policy (1986) Institute for Research on Public Policy, Montreal, pp. 41–56.
Tugwell, P.; Sitthi-Amorn, C.; O’Connor, A.; et al., Technology assessment. Old, new and needs-based, International Journal of Technology Assessment in Health Care 11 (4) (1995) 650–662.
Warburton, R.N., Patient safety – how much is enough?Health policy 71 (2) (2005) 223–232.
Warburton, R.N., What do we gain from the sixth coronary heart disease drug?BMJ (Clinical research ed.) 327 (7426) (2003) 1237–1238.