[level-membership-for-pulmolory-and-respiratory-category]
Pulmonary Function Testing
A The gas in the respiratory system is divided into four lung volumes and four lung capacities.
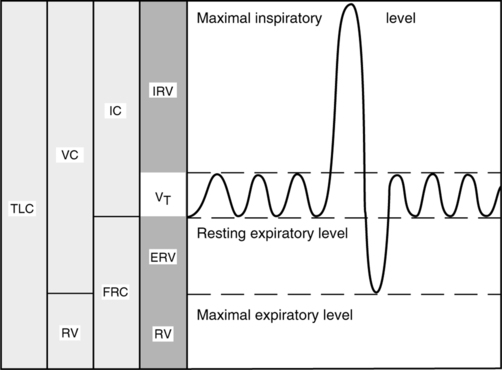
a. Residual volume (RV): Volume of gas remaining in the lung after a maximal exhalation.
b. Expiratory reserve volume (ERV): Volume of gas that can be exhaled after a normal exhalation.
c. Tidal volume (VT or TV): Volume of gas inspired during a normal inspiration.
d. Inspiratory reserve volume (IRV): Volume of gas that can be inspired after a normal inspiration.
2. Lung capacities are composed of two or more lung volumes.
a. Total lung capacity (TLC): Volume of gas contained in the lung at maximum inspiration (RV + ERV + VT + IRV).
b. Inspiratory capacity (IC): Maximum volume of gas that can be inhaled after a normal exhalation (VT + IRV).
c. Vital capacity (VC): Maximum volume of gas that can be exhaled after a maximal inspiration (ERV + VT + IRV).
d. Functional residual capacity (FRC): Volume of gas that remains in the lung after a normal exhalation (RV + ERV).
B Normal lung volumes and capacities for a healthy young male with 1.7 m2 body surface area (165 lb, 6 ft tall, 25 years old) are:
2. VC: 4.80 L, approximately 80% of TLC
3. IC: 3.60 L, approximately 60% of TLC
4. FRC: 2.40 L, approximately 40% of TLC
5. RV: 1.20 L, approximately 20% of TLC
6. ERV: 1.20 L, approximately 20% of TLC
7. VT: 0.5 L, approximately 6.3 ml/kg of ideal body weight (10% of TLC)
C All lung volumes and capacities depicted in Figure 19-1 can be measured by direct spirometry except:
II Spirometry Refers to Simple, Widely Used Tests That Measure VC and Its Subdivisions (Adapted from AARC Clinical Practice Guidelines)
A Slow VC measurement (see Figure 19-1)
1. The subject breathes normally for several breaths, followed by a maximal inspiration and a maximal exhalation.
2. The resting expiratory level must be stable to obtain valid test results.
3. Large TVs or an irregular pattern will result in inaccurate measurements of IC and ERV. These values are used to calculate RV and TLC.
B Forced vital capacity (FVC) and its subdivisions are the most widely used PFTs. The graphic representation of this simple maneuver provides information for the determination of many useful variables or calculations.
1. The subject breathes normally for several breaths, then inspires maximally and exhales as forcefully and fully as possible.
2. FVC and VC should be within 200 ml of each other in healthy patients.
3. Decreased FVC is a nonspecific finding; any disorder that affects the elasticity of the lungs can decrease FVC.
a. With severe airway obstruction, such as emphysema, or small airway collapse, gas is trapped in the alveoli, reducing FVC.
b. Restrictive lung diseases, such as pulmonary fibrosis or pneumonia, can reduce FVC.
4. FEV1 is the forced expiratory volume that can be exhaled in 1 second.
a. FEVT for other time intervals (T) can easily be determined from the FVC curve.
b. FEV1 is reported as volume, although it is essentially a measurement of flow (volume/time).
c. A decrease in FEV1 indicates obstructive changes in small airways.
d. Large airway obstruction from a tumor or a foreign body causes a decrease in FEV1, which continues through the entire FVC.
5. FEVT% is the ratio of the FEV for any given time interval (T) to the FVC (Figure 19-2).
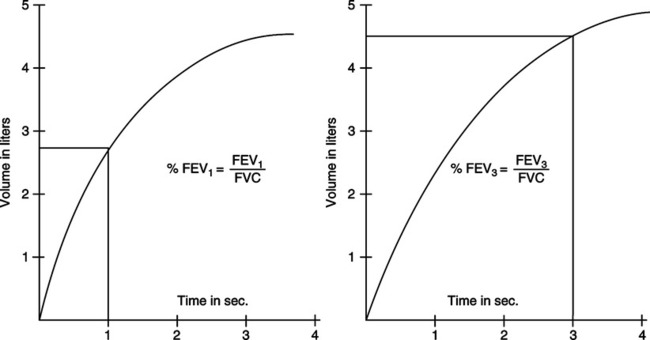
a. The percentage of the FVC that can be expired in 1 second, or FEV1%, is calculated below:
< ?xml:namespace prefix = "mml" />
 (1)
(1)b. FEV1% tends to decrease with age, as the elasticity of the lung decreases.
c. Normal values for young adults
d. A decrease in FEV1% is the most important indicator of obstructive disease.
6. FEF25%-75% is the average expiratory flow rate of the middle 50% of the FVC (Figure 19-3).
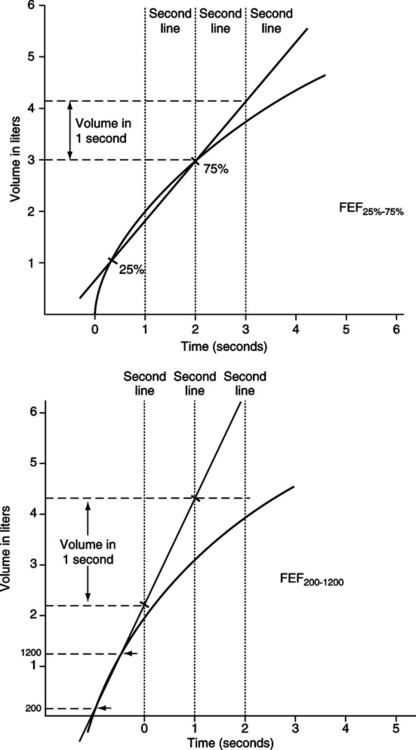
a. Reflects flow from medium and small airways.
b. Smoking causes changes in flow from medium airways before there is evidence of obstruction in small airways.
7. FEF200-1200 is the average expiratory flow rate between the first 200 ml and 1200 ml of exhaled volume during an FVC maneuver (see Figure 19-3).
8. The FEF200-1200 value in L/sec is multiplied by 60 to convert it to L/min.
9. Diagnosis of obstructive disease using PFT results
a. FEF25%-75% for young, healthy adults is 4 to 5 L/sec, but results vary considerably.
b. FVC, FEV1, and FEV1% should be considered together to determine the presence and severity of an obstructive disorder.
c. Other measurements, such as FEF25%-75%, are useful to confirm the diagnosis but should not be used as a primary indicator.
C Maximum voluntary ventilation (MVV)
1. Calculates the maximum volume of gas that a patient can ventilate in 1 minute.
2. The patient is directed to breathe rapidly and deeply for 12 to 15 seconds.
3. The total volume inspired or expired during the testing interval is measured.
4. The volume is extrapolated to 1 minute. For example, if the patient breathed 40 L in 15 seconds:
 (2)
(2)5. MVV must be corrected to body temperature and pressure saturated (BTPS).
6. Normal MVV for young healthy men is 150 to 200 L/min; slightly lower values are normal for women.
7. Decreased values indicate increased airway resistance or obstruction, decreased lung or thoracic compliance, or ventilatory muscle weakness.
D Peak expiratory flow (PEF) rate
1. The highest expiratory flow rate occurs during the early part of exhalation.
2. When PEF is reported with other spirometry values, it is expressed as L/sec. When it is performed alone using a peak flowmeter, it is expressed as L/min.
3. Peak flows normally are equal to 400 to 600 L/min for young, healthy men and 300 to 500 L/min for young, healthy women.
4. Decreased peak flows indicate airway obstruction in large airways.
E Flow-volume (F-V) curves (Figure 19-4)
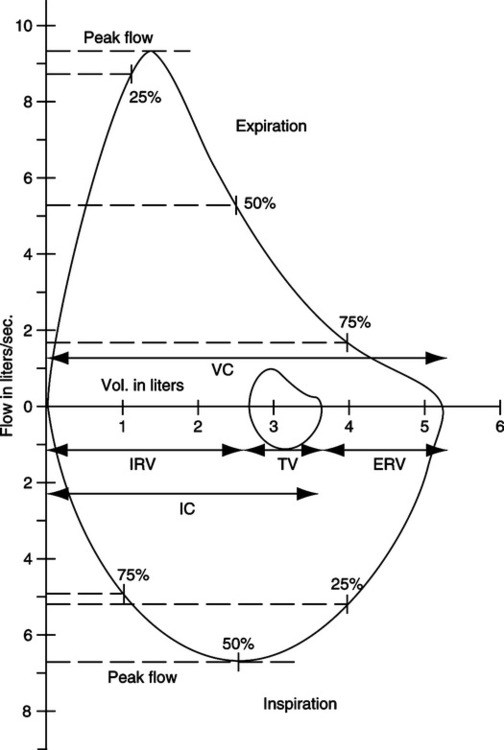
1. An F-V loop graphically depicts flow rate plotted against volume change during an FVC maneuver.
2. To perform this maneuver, the patient maximally inspires, followed by a single forced exhaled vital capacity (FEVC) and forced inspired vital capacity (FIVC).
3. A tidal F-V loop superimposed on a VC loop allows easy determination of many flow and volume variables.
4. Computer-generated graphics allow easy manipulation and comparison of F-V loops.
a. Most computerized spirometers indicate time increments on the curve so that FEV1 can be read from the loop.
b. Successive F-V loops can be superimposed on each other to demonstrate reproducibility or response to bronchodilators (Figure 19-5).
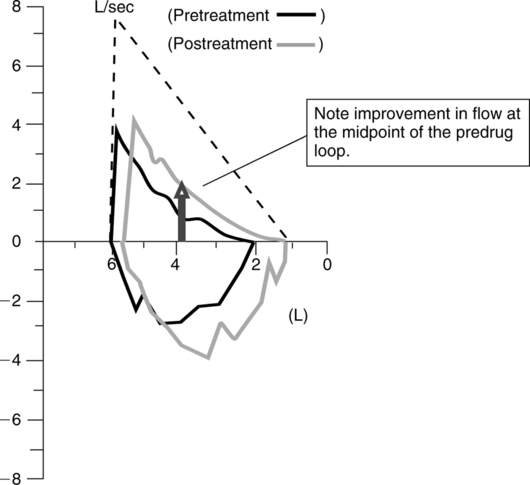
c. Superimposed loops may show decreasing flows with successive efforts. FVC maneuvers can induce bronchospasm in patients with reactive airways.
d. Some pulmonary disorders can be identified from specific, reproducible changes in the shape of the F-V loop (Figure 19-6).
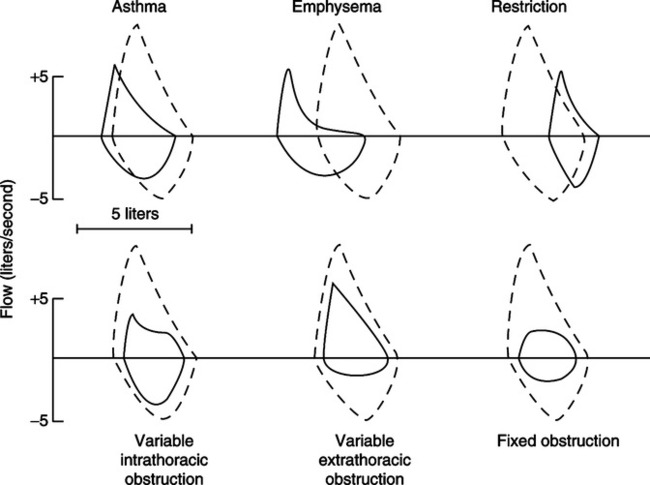
e. Normal or predicted loops can be easily compared with suspected abnormal loops.
III Useful Guidelines for Spirometry Equipment and for Evaluating and Reporting Test Results
A The American Thoracic Society sets standards for spirometry equipment.
1. Volume measurement range of 0.5 to 8 L.
2. Flow measuring range of 0 to 14 L/sec.
3. Capable of accumulating volume for 15 seconds.
4. The maximum acceptable error for volume measurements is ±3% or ±0.050 L, whichever is greater.
5. Resistance and backpressure must be <1.5 cm H2O/L/sec over the standard flow range.
B Criteria to evaluate accuracy of spirometry results
1. Spirometry measurements depend on patient effort. Practitioners should be careful to ensure reproducibility before test values are reported.
2. Evaluation of the volume-time tracing
a. The curve should be smooth and show at least 6 seconds of forced effort.
b. A plateau lasting at least 1 second should be evident. There should be <30 ml of volume change during the plateau.
c. The test can be acceptable when the FVC maneuver is stopped at <6 seconds for a clinical reason, such as excessive coughing or dizziness.
d. Patients with severe airway obstruction may continue to exhale at low flow rates for >15 seconds. Stopping the maneuver at 15 seconds will not significantly change the results.
3. Evaluation of the start-of-test
a. The beginning of the maneuver should be abrupt and distinct.
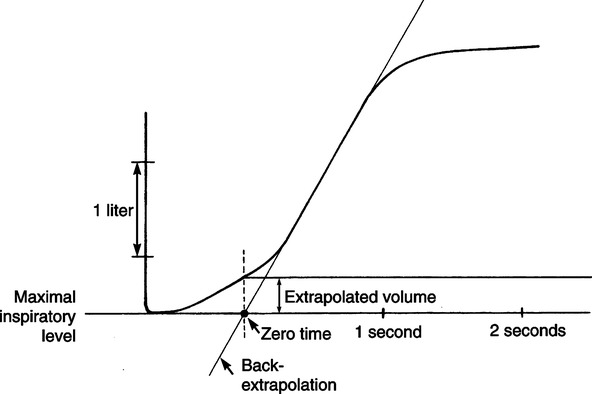
b. Time zero should be calculated by back extrapolation of each FVC curve (i.e., a straight line drawn through the steepest part of the curve is extended until it intersects the x-axis. The point of intersection is time zero.)
c. The volume exhaled at the back-extrapolated time zero should be <5% of the FVC or <0.150 L, whichever is greater (Figure 19-7).
a. A minimum of three acceptable maneuvers should be recorded.
b. A maximum of eight attempts should be performed to show reproducible efforts.
c. If two acceptable maneuvers cannot be recorded after eight attempts, the test should not be reported.
d. The largest and second largest FVC and FEV1 measurements from acceptable curves should be within 200 ml. A maximum of 5% difference has also been used as the reproducibility criterion.
C Reporting of spirometry results
1. Lung volumes are always corrected to BTPS.
2. The largest FVC and FEV1 from acceptable curves are reported even if the two values are from different curves.
3. Flows that depend on the FVC are taken from the single best maneuver.
4. The maneuver with the largest sum of FVC and FEV1 is considered the best effort.
IV Tests Used to Measure Lung Volumes and Gas Distribution (Adapted from the AARC Clinical Practice Guidelines)
A Volumes of gas and lung capacities that can be exhaled from the lung (i.e., VT, VC, IRV, ERV, and IC) can be measured directly with spirometry.
B Lung volumes and capacities that cannot be exhaled (i.e., FRC, TLC, and RV) are determined using indirect methods.
C The FRC value is measured using indirect methods and used to calculate TLC and RV.
D Computed tomography (CT) scans and magnetic resonance imaging (MRI) provide a direct view of gas distribution in the lungs and can be used to determine FRC, TLC, and RV.
E The multiple-breath nitrogen washout study uses an open circuit method to determine FRC (Figure 19-8).
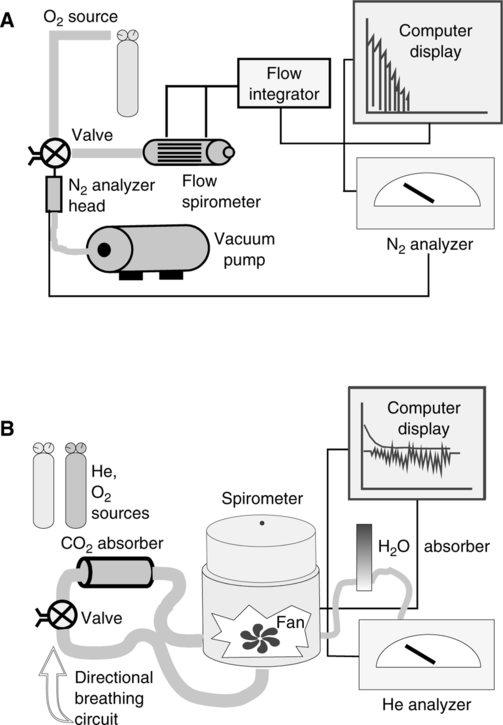
1. Because nitrogen makes up approximately 80% of FRC when the subject is breathing room air, the volume of nitrogen in the total exhaled gas will equal approximately 80% of the FRC.
2. The patient breathes 100% oxygen through a valve-mouthpiece system for 7 minutes or until the alveolar concentration of nitrogen decreases to approximately 1%.
3. Measurements are started at end expiration.
4. A rapid response nitrogen (N2) analyzer and a spirometer measure breath-by-breath N2 concentration and exhaled volume. Values are summed to provide the total volume of N2 washed out.
5. Corrections must be made for the 30 to 40 ml of N2 that are washed out of the blood and tissue during each minute of the test.
6. FRC is calculated using the equations below.
 (3)
(3)7. ERV obtained from a slow VC maneuver is used to calculate RV and TLC

8. The washout time should be reported with the results because the pattern of and the time required for N2 washout are used as indices of distribution of ventilation.
F The multiple-breath helium dilution study uses a closed circuit method to determine FRC (Figure 19-9).
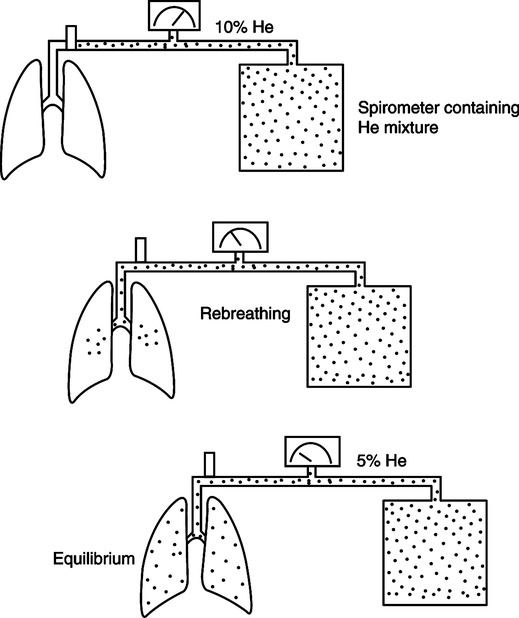
1. Because helium (He) is metabolically inert, a known volume of He may be distributed throughout the lung and the circuit without absorption of a significant volume.
2. A spirometer is filled with a known volume of air. He is added until a concentration of approximately 10% is reached. The exact concentration and volume of He in the system are measured and recorded before the test.
3. The patient breathes through a valve-mouthpiece connected to a rebreathing system containing a CO2 absorber. Oxygen is added to maintain an FIO2 of approximately 0.21.
4. The valve is opened at end-expiration, and the test continues for up to 7 minutes or until a stable He concentration is reached.
5. At the completion of the test, the concentration of He in the system is measured.
6. FRC is calculated using the equations below.
 (4)
(4) (5)
(5)7. A correction factor of 100 ml is sometimes subtracted from the calculated FRC to account for the small amount of He that is absorbed into the blood during the test.
G Advantages and disadvantages are similar for He dilution and N2 washout techniques.
1. Both tests are essentially independent of patient effort. Normal tidal breathing and an adequate seal on the mouthpiece are the only requirements.
2. Any leak in the system will result in the addition of room air to the sample, resulting in overestimation of volume. Leaks are easily detectable on graphic tracings by a spike in N2 concentration or unexpected change in He concentration (Figure 19-10).
3. Accuracy depends on even distribution ventilation of all areas of the lung. Patients with obstructive lung disease have poorly ventilated lung units that require a lengthy time to wash out N2 or mix He, resulting in underestimation of volumes.
4. Both tests are considered reliable, reproducible, and simple for patient and therapist.
H Body plethysmography (Figure 19-11) (adapted from the AARC Clinical Practice Guidelines)
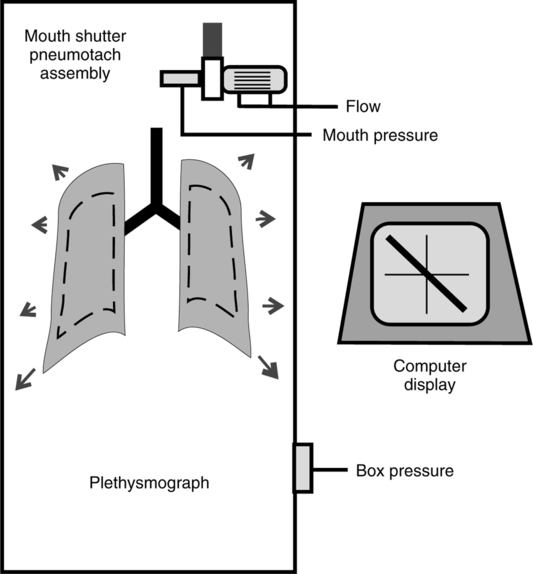
1. This test calculates the total thoracic gas volume (VTG), including gas trapped distal to completely obstructed airways or located in the abdomen or intestines.
2. The patient is placed in the plethysmograph or body box and breathes through a mouthpiece with a shutter valve that, when closed, obstructs airflow. Airway pressure at the mouth is measured using a pressure transducer attached to the mouthpiece.
3. During testing, the patient breathes gas from within the box.
4. The patient pants at a frequency of 1 to 2 breaths/sec while pressures at the mouth and within the box are measured simultaneously.
5. At FRC level the shutter is briefly closed to create an obstruction of the airway, and pressures are again measured. Changes in lung volume are reflected by changes in box pressure.
6. Mouth pressure theoretically equals alveolar pressure when the shutter occludes the airway. Occlusion of the shutter results in no airflow, allowing the two pressures to equilibrate. Esophageal pressure measurements obtained from an esophageal balloon are sometimes used instead of airway pressure.
7. The total volume of the plethysmograph is known, and the volume of gas displaced by the patient can be calculated. The volume of gas in the box surrounding the patient is determined by subtracting the volume the patient occupies from the volume of the box.
8. Boyle’s law relating pressure to volume is used in the following calculations:
 (6)
(6)
9. The difference between V1 and V2 is equal to the decreased volume in the plethysmograph after chest expansion. Because this is a sealed system, the change in volume in the plethysmograph is equal to the change in the volume in the patient’s thorax. The change in volume is calculated below.
 (7)
(7)10. As the patient pants against an obstruction and the volume in the thorax increases, the pressure in the thorax decreases.
 (6)
(6) (9)
(9)where V1 is the volume of gas in the thorax (VTG)
11. Tidal breathing is first measured to determine end-expiration.
12. The shutter automatically closes while the patient pants.
13. Electrical shutter valves and computerized systems eliminate the need to occlude the airway precisely at end-expiration.
14. Patients usually pant at a level slightly above FRC. The computer will add or subtract the change in volume from the volume before panting began to more accurately determine FRC.
15. Mouth and box pressure measurements are plotted continuously on the computer display. The slope of the resulting line is equal to change in alveolar pressure/change in alveolar volume and can be substituted into the above equations.
16. Advantages and disadvantages
a. Patient effort and understanding of the procedure are essential. Some patients cannot tolerate the plethysmograph because of claustrophobia.
b. VTG measures all gas in the thorax, including that trapped distal to collapsed airways. In diseases causing uneven distribution of ventilation and air trapping, FRC measurements are higher than those obtained by He dilution or N2 washout but may be more accurate.
c. However, if those tests are continued for ≥7 minutes, the accuracy of the results will be closer to those measured using the plethysmograph.
d. VTG measurement is considered quick, precise, and reproducible.
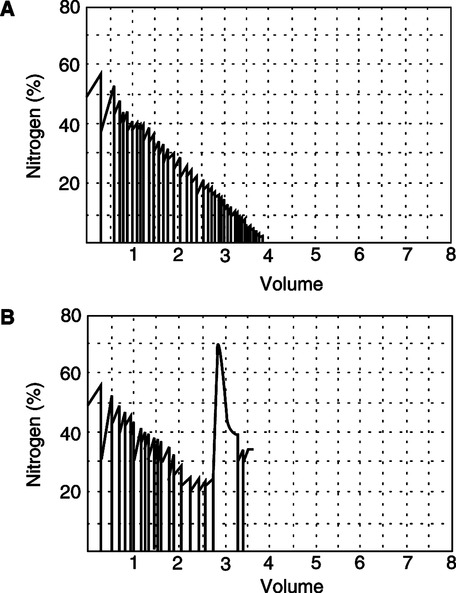
I The single-breath nitrogen washout study (SB N2) is used to measure distribution of ventilation and closing volume (Figure 19-12).
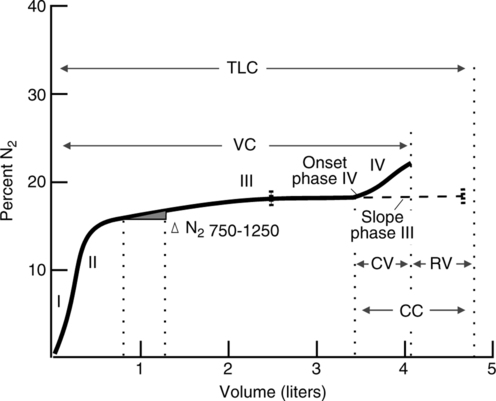
1. Closing volume (CV) is the portion of a slow VC that can be exhaled after the most gravity-dependent airways start to collapse.
2. Normally during a maximal exhalation, peripheral bronchioles collapse as lung volume approaches RV. In many disease states, an increased volume of gas is present in the lungs when these bronchioles begin to collapse.
3. During a maximal inspiration from RV, gas is distributed in the lungs in a predictable pattern because of differences in transpulmonary pressure between the apices and bases caused by gravity and lung position.
a. Initially gas moves into the conducting airways and begins to fill the apices.
b. Before the apices are filled, gas begins to fill the lung bases.
c. Toward the end of inspiration, the bases and apices fill.
d. Alveoli in the apices are described as slow alveoli because they fill first and empty last.
e. Alveoli in the bases are described as fast alveoli because they fill last and empty first.
4. The apparatus used for SB N2 testing is similar to that used for the open-circuit FRC test.
5. The patient exhales to RV level and maximally inspires from a reservoir containing 100% O2. The patient then exhales slowly and evenly to RV at a flow rate of 0.3 to 0.5 L/sec.
6. The N2 concentration is plotted against the exhaled volume, and the resulting graph is divided into four distinct phases.
a. Phase 1: Gas from the conducting airways (anatomic deadspace) is exhaled first. The gas is 100% O2, with N2 concentration near zero.
b. Phase 2: A mixture of bronchial and alveolar gas next is exhaled, and N2 concentration increases sharply.
c. Phase 3: Gas from the alveoli then is exhaled. N2 concentration increases slowly during this phase, resulting in a plateau on the graph.
d. Phase 4: Bronchioles in the lung bases close, and gas from the apices is exhaled. This causes a sharp increase in N2 concentration and indicates the closing volume.
7. CV is expressed as a percentage of the VC.
a. In young, healthy adults, CV is equal to approximately 10% of VC.
b. An increase in CV is considered normal as people age. A normal CV for a 60-year-old person may be 40%.
c. Increases in CV appear to be an early indicator of small airway obstruction.
8. Closing capacity (CC) is a term used to express the percentage of the TLC that the CV + the RV represents. Normally in young, healthy adults CC is approximately 30%, but it varies widely between individuals.
9. Delta percent nitrogen (Δ%N2) is an expression used to indicate the change in nitrogen concentration between the first 750 ml and 1250 ml exhaled.
a. In healthy, young adults Δ%N2 ≤1.5% and for older adults, up to 3%.
b. As the Δ%N2 increases, it indicates uneven distribution of ventilation.
a. Initially used to establish small airway disease because values are increased in most smokers and values are normal in most nonsmokers.
b. Not useful to determine whether patients with small airway disease will develop clinically detectable airflow obstruction.
V Diffusion Studies (Adapted from the AARC Clinical Practice Guidelines)
A Diffusion studies are used to assess the ability of the lungs to exchange gas across the alveolar-capillary membrane.
B Carbon monoxide (CO) is used because of its strong affinity for hemoglobin. The primary factor limiting its diffusion is the status of the alveolar-capillary membrane.
C Normally there is no CO in pulmonary capillary blood; therefore, the partial pressure of CO (Paco) in the alveoli creates a pressure gradient that drives CO uptake.
D All methods are based on the following equation:
 (10)
(10) CO = pulmonary capillary uptake of CO in ml/min at standard temperature and pressure dry (STPD); Paco = mean alveolar partial pressure of CO; and Pcco = mean capillary partial pressure of CO, assumed to be zero
E Two approaches to the measurement of CO uptake from the lung, or CO diffusing capacity (DLCO), have been developed.
1. The single-breath method is the most commonly used method.
a. The patient maximally inspires from a mixture of gases containing 0.3% CO with 10% He balance air, followed by a 10-second breath-hold.
b. The patient exhales, and after a volume approximating that of the anatomic deadspace is exhaled a sample is collected. This sample is analyzed to determine the concentrations of CO and He in exhaled alveolar gas.
c. The change in He concentration reflects dilution and is used to calculate the initial Pcco before any CO is diffused into the blood.
a. During steady-state determinations, the subject breathes a fixed concentration of CO until a steady state is established (a constant value for exhaled CO).
b. DLCO then is calculated from the difference between inhaled and exhaled CO.
c. There are a number of testing methods for steady-state determinations; none are used as widely as the single-breath method.
1. Normal resting DLCO for the average young man is 25 ml/min/mm Hg CO.
2. Women have slightly lower normal values, correlating with smaller lung volumes.
3. DLCO increases as much as two to three times during exercise.
4. DLCO is often decreased in those with restrictive lung diseases resulting from pulmonary fibrosis.
VI Bronchial Provocation Tests
A Uses of bronchial provocation tests
1. To assess patients with normal PFTs and symptoms of bronchospasm.
2. To quantify severity of asthma and assess changes in airway reactivity.
3. Screening of those who may be at risk from or to document the effects of environmental or occupational exposure to toxins.
B Patients must be asymptomatic at baseline.
C Bronchodilators and antihistamines must be withheld before the test. Inhaled corticosteroids should not be withheld (Table 19-1).
TABLE 19-1
Drugs That Should and Should Not Be Withheld Before Bronchial Challenge
| Short-acting β-adrenergic agents (oral or inhaled) | 12 hr |
| Long-acting β-adrenergic agents (oral or inhaled) | 48 hrss |
| Anticholinergic aerosols | 12 hr |
| Sustained-action theophylline preparations | 48 hr |
| Cromolyn sodium and related preparations | 48 hr |
| Leukotriene inhibitors | 24 hr |
| Antihistamines | 48 hr |
| Corticosteroids, inhaled or oral | Subjects should be challenged while taking a normal dose |
| Antihistamines | 72-96 hr |
| H1-receptor antagonists | 48 hr |
| Caffeine-containing drinks (e.g., cola, coffee) | 6 hr |
| β-Blocking agents | May increase the response |
D Appropriate emergency equipment and monitoring devices should be readily available.
E Baseline spirometry tests are measured before the challenge and compared with serial spirometry measurements taken at specified time intervals after the challenge.
F Methacholine challenge (adapted from the AARC Clinical Practice Guidelines)
1. Baseline FEV1 measurements are made before the administration of the aerosolized drug and after each successive dose is administered.
2. The first dose of methacholine administered is 0.025 mg/ml. The dose used for each subsequent administration is determined using a predetermined dosing schedule. Dosing schedules commonly specify doubling the dose each time, up to a maximum of 25 mg/ml (Box 19-1).
3. The methacholine concentration that causes a 20% decrease in the FEV1 from baseline is referred to as the provocative dose or PD20%.
4. The test is stopped once PD20% is reached.
5. Normal, healthy subjects have a PD20% that is greater than the maximum dose used for testing. These individuals do not show a 20% decrease in FEV1 during a methacholine challenge.
6. A PD20% of ≤8 mg/ml is common in patients with hyperreactive airways.
1. Histamine produces bronchoconstriction using a different pathway from methacholine.
2. Histamine has side effects such as flushing and headache, but recovery of baseline function is faster than with methacholine, and it is thought to be less cumulative in its effects.
3. A protocol of increasing dosages of histamine phosphate is followed until the PD20% is determined, similar to the procedure used in the methacholine challenge.
1. Bronchospasm can be induced in individuals with hyperreactive airways.
2. In both testing methods the patient breathes at a high level of ventilation (at or approaching MVV) for a specified number of minutes.
3. During hyperventilation carbon dioxide is mixed with inspired air to prevent respiratory alkalosis.
4. After hyperventilation spirometry values are measured at specific intervals and are compared with those measured at baseline.
5. The test is considered negative if there is no decrease in FEV1 within 20 minutes after hyperventilation.
1. Exercise-induced asthma (EIA)
a. Characterized by bronchospasm that occurs during or just after vigorous exercise.
b. Related to heat and water loss from the upper airway caused by high levels of ventilation required during exertion.
2. Evaluation of EIA is useful in certain situations:
a. Patients with exertional shortness of breath but with normal pulmonary function.
b. Patients with asthma symptoms whose results were negative when they performed other bronchial provocation tests.
c. To assess effectiveness of therapy in patients with known EIA.
d. Screening of patients with asthma before taking part in athletics.
3. The patient’s electrocardiograph (ECG) and blood pressure must be continuously monitored during testing.
4. The patient uses either a treadmill or cycle ergometer and exercises for 6 to 8 minutes at 60% to 85% of the individual’s predicted maximum heart rate.
5. After exercise spirometry measurements are taken at intervals and compared with the individual’s baseline.
6. As with hyperventilation testing if there is no decrease in FEV1 within 20 minutes, the test is considered negative.
7. Most of the time EIA causes bronchospasm after, rather than during, exercise, unless the testing is continued for a longer period.
VII Ventilatory Response Tests
A In healthy, normal individuals CO2 is the primary stimulus to breathe, and O2 is a secondary stimulus.
B Control of breathing and the drive to breathe can be altered in many disease states. These tests may be of value for patients with the following disorders:
1. The P0.1 is the amount of negative pressure generated at the mouth in the first 100 msec of inspiration against an occluded airway.
2. The P0.1 correlates with changes in minute ventilation and changes in hypercapnia or hypoxemia.
3. Because there is no airflow during measurement, P0.1 eliminates interference from mechanical abnormalities of the lung, such as decreased compliance or increased resistance.
4. P0.1 is a reflection of the neural output from the medullary centers in the brain that determine frequency and depth of breathing.
D Ventilatory response to CO2 can be quantified by measuring changes in minute ventilation ( E) that result when the subject breathes low concentrations of CO2.
1. Testing is performed under normoxic conditions (Pao2 ≥90 mm Hg).
2. The measurement is expressed as L/min/mm Hg Pco2.
a. The patient breathes concentrations of CO2 (1% to 7%) through a demand valve or reservoir until equilibrium is reached.
b. Petco2, Paco2, P0.1, and  E are measured at each concentration.
4. Closed-circuit or rebreathing method
a. The patient breathes a gas containing 95% O2 and 5% CO2 from a one-way circuit for 4 minutes or until Petco2 is ≥9% (Figure 19-13).
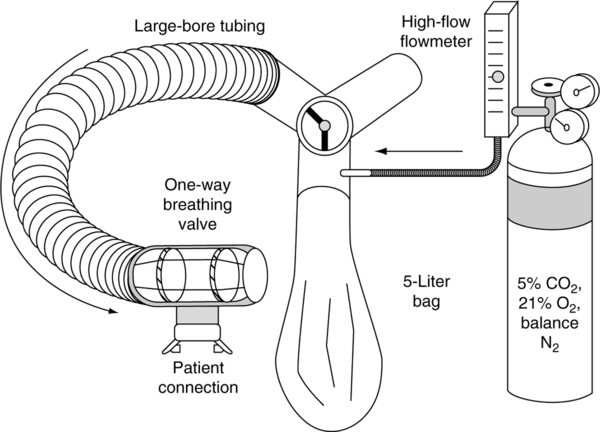
b. Changes in  E are plotted against Petco2 to form a response curve.
5. Normal individuals exhibit a linear increase in  E of approximately 3 L/min/mm Hg Pco2, with a range of responses from 1 to 6 L/min/mm Hg Pco2.
6. It is unclear why some individuals with obstructive disease develop a reduced response to CO2 and others do not.
E Ventilatory response to O2 can be quantified by measuring changes in  E that result when the subject breathes several concentrations of oxygen.
1. Testing is performed under isocapneic conditions (Paco2 = 40 mm Hg).
2. Open-circuit method (step test)
a. The patient breathes gas containing 12% to 20% oxygen, with CO2 added to maintain a constant Paco2.
b. When a steady state is reached, Pao2,  E, and P0.1 are measured.
c. The procedure is repeated at lower oxygen concentrations to create a response curve.
3. Closed-circuit method (progressive hypoxemia)
a. The patient breathes from a one-way circuit containing a CO2 scrubber and an adjustable blower.
b. To maintain isocapnia, CO2 can be added or the blower can be adjusted to direct some of the circuit gas into the scrubber.
c. As O2 is gradually consumed, the FIO2 in the circuit decreases.
 E, P0.1, and Spo2 or Pao2 are recorded.
4. In normal subjects, if Pao2 is in the range of 40 to 60 mm Hg, ventilatory response appears to increase exponentially, but there is a wide range of responses among individuals.
5. Hypoxic response increases if hypercapnia is present and decreases with hypocapnia.
VIII Pulmonary Response to Exercise (Adapted from the AARC Clinical Practice Guidelines)
A Pulmonary exercise testing can be used for the following purposes:
1. To evaluate work capacity and to provide rehabilitative, vocational, or recreational direction.
2. To demonstrate oxygen desaturation and determine appropriate supplemental O2 therapy.
3. To determine whether exercise limitation is caused by pulmonary or cardiovascular insufficiency.
B A variety of protocols can be used for exercise testing.
1. Timed walk (usually 6 or 12 minutes)
a. Distance and number of stops necessary are recorded during a walk lasting a specified time interval.
C Direct measurements made during exercise
D Derived values from basic data
1. Anaerobic threshold is that point during exercise when the oxygen demand exceeds oxygen delivery.
2. Respiratory exchange ratio (R):
 (11)
(11)3. Oxygen pulse is the O2 consumption divided by the heart rate.
E Cardiac versus pulmonary limitation to exercise
1. In cardiac diseases MVV is rarely reached, whereas with respiratory disease it is exceeded.
2. The anaerobic threshold is rarely reached in respiratory disease but is usually exceeded in cardiac disease.
3. Pulse and oxygen saturation decrease in respiratory and cardiac disease but more so with cardiac disease.
IX Reference Values in Pulmonary Function Measurements
A Variation in pulmonary function measurements occurs naturally in healthy individuals and is important when comparing measured and reference values.
B Physical characteristics influence pulmonary function.
1. Age: Lung volumes and capacities decrease as a person ages.
2. Gender: Females generally have smaller body proportions than males and therefore smaller lung volumes and capacities.
3. Body position (standing versus sitting): Lung volumes and capacities are smaller in subjects tested in the sitting position because excursion of the diaphragm is limited.
4. Race or ethnic background: Differences in lung volumes and capacities among races are well documented and exist mainly because of differences in stature and body proportions. There is no single factor that accounts for these differences.
5. Weight or body surface area: Again differences are related to body proportions, and lung volumes and capacities increase in larger subjects.
C The quality of instruction and the patient’s ability to follow instructions influence test results and often result in variation in individuals, especially for spirometry testing.
D Most pulmonary function measurements regress or vary in a predictable way in relation to certain physical factors.
E Reference or predicted values are derived from statistical analysis of the pulmonary function of a group of normal subjects with:
1. No individual or familial history of lung disease.
2. Minimal exposure to risk factors such as smoking or environmental pollution.
F Published reference values such as tables, nomograms, and regression equations are available.
G Computerized testing equipment is used to apply reference values to values measured in patients.
H All lung volumes and capacities are expressed at BTPS. Measured values at atmospheric temperature and pressure saturated (ATPS) must be converted to BTPS using Charles’ law (see Chapter 2).
I There are several methods that can be used to determine the lower limits of normal.
1. The confidence limit method uses a normal bell-shaped distribution to define 95% confidence limits. Values that fall outside 2 SDs from the mean reference value are considered abnormal.
2. The fifth percentile method is used to determine the percentage of the reference value above which 95% of the healthy population falls.
3. The confidence limit and the fifth percentile methods give similar results for variables with normal distributions.
4. The fifth percentile method does not require a normal distribution.
5. Some PFT laboratories use a fixed percentage (e.g., ±20%) to determine the lower limit of normal for all values.
J Considerations when choosing reference values for an individual PFT laboratory
1. Type of equipment used in the reference study: Does it comply with the recommendations of the American Thoracic Society?
2. Methodologies: Were procedures used in the reference study similar to those used in the laboratory, particularly for spirometry, lung volumes, and DLCO?
3. Sample populations: Age ranges in the reference study should be noted. Did the study determine regressions for individual ethnic groups? Were smokers or other potentially unhealthy subjects used as normal control subjects?
4. Statistical data: Are lower limits of normal defined? Are data such as SD and confidence intervals presented so that limits can be calculated?
5. Conditions of the study: Was the study performed at a similar altitude and environmental conditions?
6. Published reference equations: Are values generated in the study similar to other published references?
[/level-membership-for-pulmolory-and-respiratory-category][not-level-membership-for-pulmolory-and-respiratory-category]
Pulmonary Function Testing
A The gas in the respiratory system is divided into four lung volumes and four lung capacities.
a. Residual volume (RV): Volume of gas remaining in the lung after a maximal exhalation.
b. Expiratory reserve volume (ERV): Volume of gas that can be exhaled after a normal exhalation.
c. Tidal volume (VT or TV): Volume of gas inspired during a normal inspiration.
d. Inspiratory reserve volume (IRV): Volume of gas that can be inspired after a normal inspiration.
2. Lung capacities are composed of two or more lung volumes.
a. Total lung capacity (TLC): Volume of gas contained in the lung at maximum inspiration (RV + ERV + VT + IRV).
b. Inspiratory capacity (IC): Maximum volume of gas that can be inhaled after a normal exhalation (VT + IRV).
c. Vital capacity (VC): Maximum volume of gas that can be exhaled after a maximal inspiration (ERV + VT + IRV).
d. Functional residual capacity (FRC): Volume of gas that remains in the lung after a normal exhalation (RV + ERV).
B Normal lung volumes and capacities for a healthy young male with 1.7 m2 body surface area (165 lb, 6 ft tall, 25 years old) are:
2. VC: 4.80 L, approximately 80% of TLC
3. IC: 3.60 L, approximately 60% of TLC
4. FRC: 2.40 L, approximately 40% of TLC
5. RV: 1.20 L, approximately 20% of TLC
6. ERV: 1.20 L, approximately 20% of TLC
7. VT: 0.5 L, approximately 6.3 ml/kg of ideal body weight (10% of TLC)
C All lung volumes and capacities depicted in Figure 19-1 can be measured by direct spirometry except:
II Spirometry Refers to Simple, Widely Used Tests That Measure VC and Its Subdivisions (Adapted from AARC Clinical Practice Guidelines)
A Slow VC measurement (see Figure 19-1)
1. The subject breathes normally for several breaths, followed by a maximal inspiration and a maximal exhalation.
2. The resting expiratory level must be stable to obtain valid test results.
3. Large TVs or an irregular pattern will result in inaccurate measurements of IC and ERV. These values are used to calculate RV and TLC.
B Forced vital capacity (FVC) and its subdivisions are the most widely used PFTs. The graphic representation of this simple maneuver provides information for the determination of many useful variables or calculations.
1. The subject breathes normally for several breaths, then inspires maximally and exhales as forcefully and fully as possible.
2. FVC and VC should be within 200 ml of each other in healthy patients.
3. Decreased FVC is a nonspecific finding; any disorder that affects the elasticity of the lungs can decrease FVC.
a. With severe airway obstruction, such as emphysema, or small airway collapse, gas is trapped in the alveoli, reducing FVC.
b. Restrictive lung diseases, such as pulmonary fibrosis or pneumonia, can reduce FVC.
4. FEV1 is the forced expiratory volume that can be exhaled in 1 second.
a. FEVT for other time intervals (T) can easily be determined from the FVC curve.
b. FEV1 is reported as volume, although it is essentially a measurement of flow (volume/time).
c. A decrease in FEV1 indicates obstructive changes in small airways.
d. Large airway obstruction from a tumor or a foreign body causes a decrease in FEV1, which continues through the entire FVC.
5. FEVT% is the ratio of the FEV for any given time interval (T) to the FVC (Figure 19-2).
a. The percentage of the FVC that can be expired in 1 second, or FEV1%, is calculated below:
< ?xml:namespace prefix = "mml" />
(1)b. FEV1% tends to decrease with age, as the elasticity of the lung decreases.
c. Normal values for young adults
d. A decrease in FEV1% is the most important indicator of obstructive disease.
6. FEF25%-75% is the average expiratory flow rate of the middle 50% of the FVC (Figure 19-3).
a. Reflects flow from medium and small airways.
b. Smoking causes changes in flow from medium airways before there is evidence of obstruction in small airways.
7. FEF200-1200 is the average expiratory flow rate between the first 200 ml and 1200 ml of exhaled volume during an FVC maneuver (see Figure 19-3).
8. The FEF200-1200 value in L/sec is multiplied by 60 to convert it to L/min.
9. Diagnosis of obstructive disease using PFT results
a. FEF25%-75% for young, healthy adults is 4 to 5 L/sec, but results vary considerably.
b. FVC, FEV1, and FEV1% should be considered together to determine the presence and severity of an obstructive disorder.
c. Other measurements, such as FEF25%-75%, are useful to confirm the diagnosis but should not be used as a primary indicator.
C Maximum voluntary ventilation (MVV)
1. Calculates the maximum volume of gas that a patient can ventilate in 1 minute.
2. The patient is directed to breathe rapidly and deeply for 12 to 15 seconds.
3. The total volume inspired or expired during the testing interval is measured.
4. The volume is extrapolated to 1 minute. For example, if the patient breathed 40 L in 15 seconds:
(2)5. MVV must be corrected to body temperature and pressure saturated (BTPS).
6. Normal MVV for young healthy men is 150 to 200 L/min; slightly lower values are normal for women.
7. Decreased values indicate increased airway resistance or obstruction, decreased lung or thoracic compliance, or ventilatory muscle weakness.
D Peak expiratory flow (PEF) rate
1. The highest expiratory flow rate occurs during the early part of exhalation.
2. When PEF is reported with other spirometry values, it is expressed as L/sec. When it is performed alone using a peak flowmeter, it is expressed as L/min.
3. Peak flows normally are equal to 400 to 600 L/min for young, healthy men and 300 to 500 L/min for young, healthy women.
4. Decreased peak flows indicate airway obstruction in large airways.
E Flow-volume (F-V) curves (Figure 19-4)
1. An F-V loop graphically depicts flow rate plotted against volume change during an FVC maneuver.
2. To perform this maneuver, the patient maximally inspires, followed by a single forced exhaled vital capacity (FEVC) and forced inspired vital capacity (FIVC).
3. A tidal F-V loop superimposed on a VC loop allows easy determination of many flow and volume variables.
4. Computer-generated graphics allow easy manipulation and comparison of F-V loops.
a. Most computerized spirometers indicate time increments on the curve so that FEV1 can be read from the loop.
b. Successive F-V loops can be superimposed on each other to demonstrate reproducibility or response to bronchodilators (Figure 19-5).
c. Superimposed loops may show decreasing flows with successive efforts. FVC maneuvers can induce bronchospasm in patients with reactive airways.
d. Some pulmonary disorders can be identified from specific, reproducible changes in the shape of the F-V loop (Figure 19-6).
e. Normal or predicted loops can be easily compared with suspected abnormal loops.
III Useful Guidelines for Spirometry Equipment and for Evaluating and Reporting Test Results
A The American Thoracic Society sets standards for spirometry equipment.
1. Volume measurement range of 0.5 to 8 L.
2. Flow measuring range of 0 to 14 L/sec.
3. Capable of accumulating volume for 15 seconds.
4. The maximum acceptable error for volume measurements is ±3% or ±0.050 L, whichever is greater.
5. Resistance and backpressure must be <1.5 cm H2O/L/sec over the standard flow range.
B Criteria to evaluate accuracy of spirometry results
1. Spirometry measurements depend on patient effort. Practitioners should be careful to ensure reproducibility before test values are reported.
2. Evaluation of the volume-time tracing
a. The curve should be smooth and show at least 6 seconds of forced effort.
b. A plateau lasting at least 1 second should be evident. There should be <30 ml of volume change during the plateau.
c. The test can be acceptable when the FVC maneuver is stopped at <6 seconds for a clinical reason, such as excessive coughing or dizziness.
d. Patients with severe airway obstruction may continue to exhale at low flow rates for >15 seconds. Stopping the maneuver at 15 seconds will not significantly change the results.
3. Evaluation of the start-of-test
a. The beginning of the maneuver should be abrupt and distinct.
b. Time zero should be calculated by back extrapolation of each FVC curve (i.e., a straight line drawn through the steepest part of the curve is extended until it intersects the x-axis. The point of intersection is time zero.)
c. The volume exhaled at the back-extrapolated time zero should be <5% of the FVC or <0.150 L, whichever is greater (Figure 19-7).
a. A minimum of three acceptable maneuvers should be recorded.
b. A maximum of eight attempts should be performed to show reproducible efforts.
c. If two acceptable maneuvers cannot be recorded after eight attempts, the test should not be reported.
d. The largest and second largest FVC and FEV1 measurements from acceptable curves should be within 200 ml. A maximum of 5% difference has also been used as the reproducibility criterion.
C Reporting of spirometry results
1. Lung volumes are always corrected to BTPS.
2. The largest FVC and FEV1 from acceptable curves are reported even if the two values are from different curves.
3. Flows that depend on the FVC are taken from the single best maneuver.
4. The maneuver with the largest sum of FVC and FEV1 is considered the best effort.
IV Tests Used to Measure Lung Volumes and Gas Distribution (Adapted from the AARC Clinical Practice Guidelines)
A Volumes of gas and lung capacities that can be exhaled from the lung (i.e., VT, VC, IRV, ERV, and IC) can be measured directly with spirometry.
B Lung volumes and capacities that cannot be exhaled (i.e., FRC, TLC, and RV) are determined using indirect methods.
C The FRC value is measured using indirect methods and used to calculate TLC and RV.
D Computed tomography (CT) scans and magnetic resonance imaging (MRI) provide a direct view of gas distribution in the lungs and can be used to determine FRC, TLC, and RV.
E The multiple-breath nitrogen washout study uses an open circuit method to determine FRC (Figure 19-8).
1. Because nitrogen makes up approximately 80% of FRC when the subject is breathing room air, the volume of nitrogen in the total exhaled gas will equal approximately 80% of the FRC.
2. The patient breathes 100% oxygen through a valve-mouthpiece system for 7 minutes or until the alveolar concentration of nitrogen decreases to approximately 1%.
3. Measurements are started at end expiration.
4. A rapid response nitrogen (N2) analyzer and a spirometer measure breath-by-breath N2 concentration and exhaled volume. Values are summed to provide the total volume of N2 washed out.
5. Corrections must be made for the 30 to 40 ml of N2 that are washed out of the blood and tissue during each minute of the test.
6. FRC is calculated using the equations below.
(3)7. ERV obtained from a slow VC maneuver is used to calculate RV and TLC
[/not-level-membership-for-pulmolory-and-respiratory-category]
