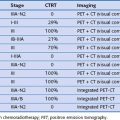
Chapter 9 Pulmonary Function Testing
Testing in the pulmonary function laboratory allows further classification and quantification of lung disease by adding data from the measurement of lung volumes and assessment of gas exchange through measurement of diffusing capacity and arterial blood gases, and from tests of gas distribution. Special testing is available for prethoracotomy evaluation, assessment of upper airway obstruction, bronchoprovocation challenge testing, and cardiopulmonary exercise response (discussed in Chapter 10). Although even comprehensive lung function testing may not provide a specific diagnosis, the pattern of physiologic derangements guides further assessment, and demonstration of the severity of impairment aids in prognosis.
Spirometry
The Forced Expiratory Volume Maneuver
Assessments of vital capacity (VC), or forced vital capacity (FVC) and airflow are based on the forced expiratory volume maneuver, in which the subject inhales maximally to total lung capacity (TLC) and then exhales forcefully and completely to residual volume (RV). The expiratory flow rate at any point during this maneuver is determined by the driving pressure for airflow and the airway resistance. During a forceful exhalation, the intrathoracic pressure that surrounds the central airways exceeds the intraluminal pressure, causing dynamic compression of the airway (see Chapter 3, Figure 3-12). As a result, the effective driving pressure becomes the difference between alveolar pressure and the pleural pressure that compresses airways. This pressure difference (PA − Ppl) is equivalent to the elastic recoil pressure of the lung tissue. Thus, even during a forceful effort, the intrinsic elastic properties of the lung are a major determinant of airflow. Airway resistance upstream from the point of compression is determined primarily by airway caliber, which varies directly with lung volume. Throughout exhalation from TLC, both recoil pressure and airway caliber progressively decrease, so that airflow rates, after an early peak, also progressively decrease. Although the peak expiratory flow rate varies with the rapidity and forcefulness of the expiratory effort, once dynamic compression begins, the flow rate during the middle to later portions of the maneuver is limited and independent of further effort beyond the threshold needed to begin compression. These flows also are independent of added resistance downstream from the point of flow limitation. This physiologic arrangement aids in making the basic measurements of spirometry quite reproducible on repeated efforts.
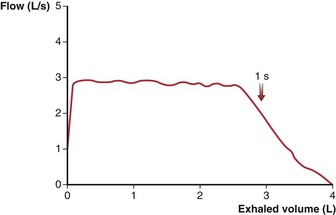
To obtain a satisfactory spirometric tracing, the preceding inspiration must be maximal and the forced expiratory volume maneuver must be continued to cessation of flow or, when emptying is slowed, for at least 6 to10 seconds. The resultant information commonly is displayed in one of two formats. The traditional spirogram (Figure 9-1) plots volume versus time, with flow rate indicated by the steepness of the plot. The orientation of the axes varies with equipment, with time moving to the right and exhaled volume plotted either up or down. In the flow-volume display (Figure 9-2), the instantaneous flow rate is measured continuously and directly plotted on the vertical axis with volume on the horizontal axis. Time is not shown on this plot but may be indicated by tick marks. With this display, the reproducibility of successive efforts and some patterns of abnormality may be more easily seen. It is important to recognize that both the traditional spirogram and the expiratory flow-volume display are obtained from the same maneuver but emphasize different aspects of the information thus obtained.
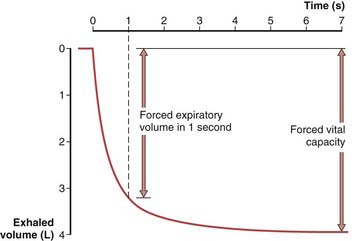
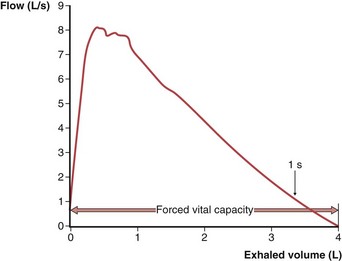
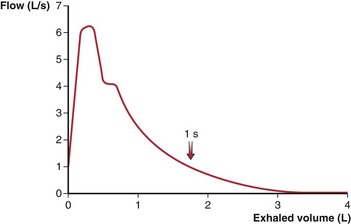
Figure 9-2 Normal expiratory flow-volume curve. The same forced expiratory volume maneuver shown in Figure 9-1 is plotted here as a flow-volume curve. The airflow rate reaches a peak early in the exhalation and then decreases progressively until flow ceases at residual volume.
(Modified from Culver BH: Pulmonary function testing. In Kelly WN, editor: Textbook of internal medicine, Philadelphia, 1988, JB Lippincott.)
Interpretation of Spirometric Abnormalities
Obstructive Impairment
A decrease in airflow is the hallmark of the obstructive diseases; this physiologic diagnosis rests primarily on the demonstration of an FEV1/FVC (or FEV1/VC) value below the age-appropriate LLN. When the FEV1/FVC value is low, even persons with an FEV1 itself as high as 100% of the predicted value (and, necessarily, with a high-normal FVC) are considered to have mild airflow obstruction, which has been shown to be associated with increased morbidity over time. Typically, FVC is normal early in the course of airflow obstruction but is reduced in more severe disease as the RV is increased because of trapped air. The severity of obstructive impairment is best quantified by the decrement in FEV1 as a percent of predicted, because progressive loss of FVC with advanced severity and air trapping limits the reduction in FEV1/FVC. Varying recommendations for categories of severity have been made by different groups, although an apparent consensus suggests that an FEV1 below 50% of the predicted value reflects a “severe” impairment. A simple schema that represents a compromise between one included in the ATS-ERS guidelines and that used in the Global Initiative for Chronic Obstructive Lung Disease (GOLD) guidelines is shown in Table 9-1.
| Degree of Impairment | % Pred FEV1 |
|---|---|
| Mild | 70-100% |
| Moderate | 50-69% |
| Severe | 30-49% |
| Very severe | <30% |
Lung Volumes
Spirometry can measure only those subdivisions of lung volume contained within the VC range (see Chapter 3, Figure 3-4). Measurement of TLC or FRC requires a method of measuring the gas that remains in the lungs at RV. Typically, the gas volume contained in the lungs at FRC is measured, with TLC and RV determined by adding or subtracting the appropriate increments from an accompanying spirogram. The methods used most widely to measure lung volumes include helium dilution, nitrogen washout, and body plethysmography. Also, TLC can be quite accurately determined from calculations based on planimetry of posteroanterior and lateral chest radiographs or from CT scans, using one of several geometric models.
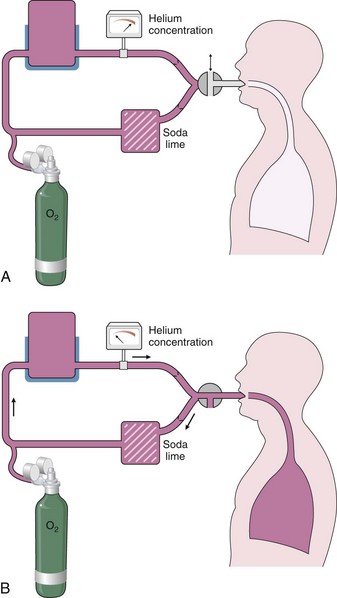
Measurement by Helium Dilution
A spirometer is prepared that contains a known volume and concentration of an inert gas, typically 10% helium (Figure 9-3). While the subject breathes through a mouthpiece with nose clipped, a valve is turned at end-tidal exhalation to connect the airway to this closed system. As normal tidal breathing continues over the course of a few minutes, the gas in the subject’s lung equilibrates with gas in the spirometer, and the helium concentration, which is continuously monitored, falls to a new, lower, steady-state level. Carbon dioxide is removed from the closed system by soda lime absorption, and a low flow of oxygen is added to compensate for the subject’s ongoing oxygen consumption by keeping the mixing chamber or spirometer volume constant. The ratio of the initial to the final concentration of helium allows calculation of the unknown volume (FRC) added to the system. A continuous tracing of the spirogram, including a maximum inspiratory and expiratory effort, allows calculation of the subdivisions of lung volume, and correction for any offset from the relaxed FRC at the moment the valve was opened to start the test.
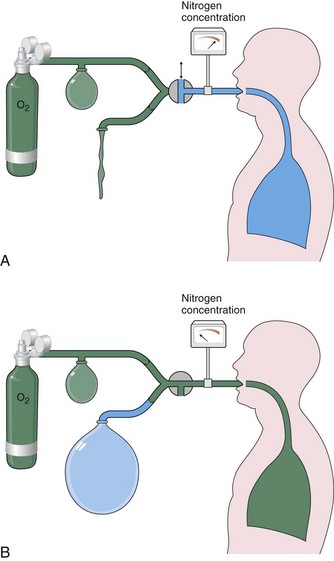
Measurement by Nitrogen Washout
The nitrogen washout technique also is based on the principle of conservation of mass of an inert gas—in this case, the nitrogen normally resident within the lungs. The subject breathes on a mouthpiece that, at the end of a relaxed tidal exhalation, is connected to an inspiratory source of 100% oxygen (Figure 9-4), while the subsequent exhaled gas is directed by one-way valves into a collection bag, previously flushed with oxygen so that it contains no nitrogen. The resident nitrogen is washed out of the lungs progressively and monitored with continuous analysis at the mouthpiece. When the exhaled nitrogen concentration falls below 2%, the test is terminated, and the volume of nitrogen collected is measured. The FRC can be calculated on the basis that this nitrogen volume represents 80% of the lung gas contained at the beginning of the test. Instead of the collection bag, current microprocessors use a calculation based on instantaneous, breath-by-breath measurement of exhaled volume times nitrogen concentration. Washout can be completed in 3 to 4 minutes in normal subjects but may require longer than 15 minutes with severe obstructive airway disease, so that the gas volume in slowly exchanging spaces can be measured.
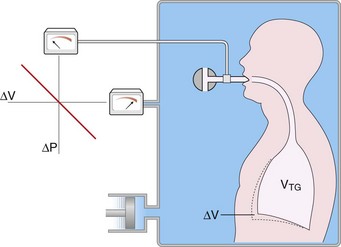
Measurement by Body Plethysmography
The volume of gas within the thorax, whether in communication with airways or not, can be measured by the technique of body plethysmography, based on the physical principles of gas compression described by Boyle’s law. The subject sits within a fully enclosed rigid box and breathes through a mouthpiece connected through a shutter to the internal volume of the box (Figure 9-5). Sensitive manometers monitor the pressure at the airway and inside the chamber. The apparatus is calibrated with the subject in place, so that the volume addition required within the chamber to raise the chamber pressure by 1 cm H2O is known. At the end of a tidal exhalation, the airway shutter is closed, and the subject is asked to make panting efforts with the glottis open. An effort to expand the chest decompresses intrathoracic gas and reciprocally compresses that in the chamber; the opposite occurs during an expiratory effort.
Interpretation of Lung Volume Abnormalities
Restrictive Lung Diseases
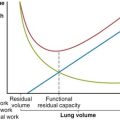
Restrictive lung impairment is defined by a decrease in TLC below its lower limit of normal. In most parenchymal infiltrative processes, this is accompanied by parallel decrements in FRC, RV, and VC. The reduction in FRC reflects a shift in the balance of lung and chest wall recoil forces (see Chapter 3, Figure 3-7) and the reduction in RV occurs as increased tissue recoil delays airway closure. However, some patients with clear interstitial lung disease by radiologic evaluation or biopsy maintain lung volumes within the normal range. Obesity causes true restriction only when extreme but affects lung volumes in a pattern that differs from that of parenchymal lung diseases. The primary effect is on the relaxed end-expiratory volume or FRC, because the large abdomen and heavy chest wall reduce the outward recoil of the thoracic cage, which allows the inward recoil of the lung parenchyma to reduce FRC. RV is determined by airway closure, however, and is therefore less affected, and the TLC achievable using maximum inspiratory force is only minimally reduced until obesity becomes extreme (body mass index [BMI] greater than 40). Thus, the typical spirogram in even moderate obesity shows an end-expiratory volume (FRC) that approaches RV (i.e., the expiratory reserve volume is markedly reduced), but with a relatively large inspiratory capacity and a near-normal TLC and VC.
Obstructive Diseases
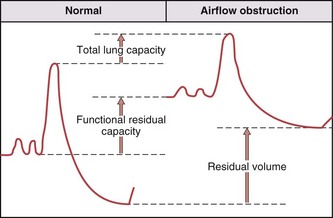
Airflow obstructive processes lead to airway closure that limits exhalation at higher lung volume because of the combined effects on luminal caliber of airway inflammation and loss of tissue recoil. These changes result in a progressive increase in RV (Figure 9-6), as increasing amounts of gas are trapped behind closed airways. Affected patients breathe at an increased FRC because of the combined effects of a decrease in lung recoil force from emphysema and the need to increase luminal caliber to minimize the resistive work of air flow. The TLC is normal to high, which again reflects the loss of lung recoil forces. Because RV increases to a greater extent than that seen in TLC, the VC decreases with severe airway obstruction.
Tests of Gas Distribution
Closing Volume
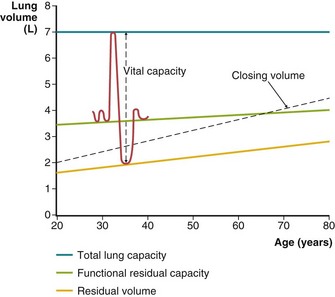
As lung volume decreases, the smaller, intraparenchymal airways decrease in caliber until they close at low lung volume and ventilation to or from alveoli beyond them ceases. Because there is a vertical gradient in the pleural pressure that surrounds the lungs, the lung tissue is less distended in dependent regions than at higher levels in the thorax. In late exhalation, dependent airways close (i.e., these areas reach their regional RV), whereas air continues to flow from the upper portions of the lung until they too close, and overall RV is reached. The beginning of this wave of ascending airway closure can be detected by physiologic tests and is termed closing volume. Closing volume usually is expressed as a percentage of VC. That is, a closing volume of 20% means that airway closure can be detected during a slow exhalation when 20% of the VC remains before RV is attained (Figure 9-7). Alternatively, when RV is measured, this can be added to closing volume, and the sum, termed closing capacity, is expressed as a percentage of TLC.
Arterial Blood Gas Measurement
The normal PCO2 remains in a narrow range, around 40 mm Hg, throughout life, but the normal PO2 diminishes progressively with age. This decline is more marked when PO2 is measured with the subject in the supine position and in both cases reflects the progressive increase in closing volume with age (see Figure 9-7). Abnormal reductions in PO2 are caused by hypoventilation, as reflected (but not caused) by an increase in PCO2, or result from the combined effects of pulmonary blood flow to poorly ventilated areas (low ventilation-perfusion ratio [ ]) and right-to-left shunting. Diffusion abnormalities, unless extremely severe, rarely contribute to a low PO2 in patients at rest. The low PO2 commonly seen in patients who have diffusion abnormalities reflects the concomitant presence of ventilation-perfusion abnormalities associated with their disease. Diffusion limitation may make a small contribution to a reduction in PO2 observed during exercise, but again, the major component is a worsened effect of the ventilation-perfusion abnormalities.
Special Testing
Upper Airway Obstruction
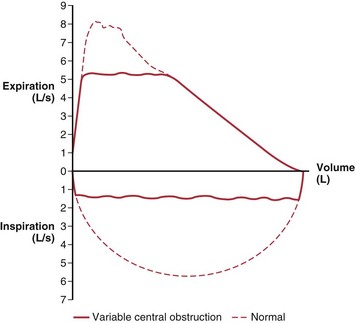
Obstruction in the central airways (e.g., tracheal tumor or stenosis) affects the expiratory flow-volume relationship in a different way than does the more common peripheral airway obstruction of COPD. The latter has its predominant effect late in expiration, with slowing of terminal flow rates, so that peak flow tends to be relatively maintained while the remaining flow-volume curve becomes progressively convex toward the horizontal axis (Figure 9-8). Central obstructions have their primary effect early, which results in a truncated, flat-topped flow-volume curve (Figure 9-9), reflecting a steady effort against a constant resistance. In the latter portion of the expiration, the decreasing lung volume and airway caliber shift the site of major resistance to the more peripheral airways, so that the latter portion of the flow-volume curve is normal.
When a central obstruction is in the extrathoracic airway and has some flexibility (e.g., vocal cord paralysis), its effect is much greater during inspiratory flow than expiratory flow. The negative intraluminal pressure generated during inspiration narrows the airway, which exacerbates the obstruction, whereas during expiration, the positive airway pressure below the site of obstruction tends to distend the airway, which reduces the abnormality. These lesions are assessed by recording on the flow-volume display the maximum effort inspiratory flow curve, as well as that during expiration, to complete a flow-volume “loop.” The normal inspiratory flow pattern has a semicircular shape with peak inspiratory flow at midvolume that consistently exceeds midvolume expiratory flow (Figure 9-10).
Brusasco V, Crapo R, Viegi G, series editors. ATS/ERS task force: standardisation of lung function testing. Eur Respir J. 26, 2005.
MacIntyre N, Crapo RO, Viegi G, et al. Standardisation of the single-breath determination of carbon monoxide uptake in the lung. Eur Respir J. 2005;26:720–735.
Miller MR, Crapo R, Hankinson J, et al. General considerations for lung function testing. Eur Respir J. 2005;26:153–161.
Miller MR, Hankinson J, Brusasco F, et al. Standardisation of spirometry. Eur Respir J. 2005;26:319–338.
Pellegrino R, Viegi G, Brusasco F, et al. Interpretative strategies for lung function tests. Eur Respir J. 2005;26:948–968.
Wanger J, Clausen JL, Coates A, et al. Standardisation of the measurement of lung volumes. Eur Respir J. 2005;26:511–522.
American Thoracic Society. Guidelines for methacholine and exercise challenge testing—1999. Am J Resp Crit Care Med. 2001;161:309–329.
Anderson SD. Indirect challenge tests: airway hyperresponsiveness in asthma: its measurement and clinical significance. Chest. 2010;138:25S–30S.
Crapo RO, Jensen RL, Wanger JS. Single-breath carbon monoxide diffusing capacity. Clin Chest Med. 2001;22:637–649.
Ferguson GT, Enright PL, Buist AS, Higgins MW. Office spirometry for lung health assessment in adults. Chest. 2000;117:1146–1161.
Gardner ZS, Ruppel GL, Kaminsky DA. Grading the severity of obstruction in mixed obstructive-restrictive lung disease. Chest. 2011;140:598–603.
Hankinson JL, Odencratz JR, Fedan KB. Spirometric reference values from a sample of the general US population. Am J Resp Crit Care Med. 1999;159:179–187.
Hayes DJr, Kraman SS. The physiologic basis of spirometry. Respir Care. 2009;54:1717–1726.
Hughes JMB, Pride NB. Lung function tests: physiologic principles and clinical applications. London: WB Saunders; 1999.
Iyer VN, Schroeder DR, Parker KO, et al. The “non-specific” pulmonary function test: longitudinal follow up and outcomes. Chest. 2010.
Jones RL, Nzekwu MM. The effects of body mass index on lung volumes. Chest. 2006;130:827–833.
Stanojevic S, Wade A, Stocks J, et al. Reference ranges for spirometry across all ages. Am J Respir Crit Care Med. 2008;177:253–260.
Vandevoorde J, Verbanck S, Schuermans D, et al. Forced vital capacity and forced expiratory volume in six seconds as predictors of reduced total lung capacity. Eur Respir J. 2008;31:391–395.