Pulmonary Function Study Assessments
After reading this chapter, you will be able to:
• Describe the following lung volumes and capacities:
• Inspiratory reserve volume (IRV)
• Expiratory reserve volume (ERV)
• Functional residual capacity (FRC)
• Residual volume/total lung capacity ratio (RV/TLC)
• List the normal lung volumes and capacities of normal recumbent subjects who are 20 to 30 years of age.
• Identify lung volumes and capacity findings characteristic of restrictive lung disorders.
• Describe the anatomic alterations of the lungs associated with restrictive lung disorders.
• Identify lung volumes and capacity findings characteristic of obstructive lung disorders.
• Describe the anatomic alterations of the lungs associated with obstructive lung disorders.
• List the indirect measurements of the residual volume and lung capacities containing the residual volume.
• Describe expiratory flow rate and volume measurements and their respective normal values:
• Forced expiratory volume timed (FEVT)
• Forced expiratory volume in 1 second/forced vital capacity ratio (FEV1/FVC)
• Forced expiratory flow at 25% to 75% (FEF25%-75%)
• Forced expiratory flow at 50% (FEF50%)
• Forced expiratory flow between 200 and 1200 mL of FVC (FEF200-1200)
• Peak expiratory flow rate (PEFR)
• Maximum voluntary ventilation (MVV)
• Describe how the FVC, FEV1, and FEV1/FVC are used to differentiate restrictive and obstructive lung disorders.
• Identify forced expiratory flow rate findings characteristic of restrictive lung disorders.
• Identify forced expiratory flow rate findings characteristic of obstructive lung disorders.
• Describe the pulmonary diffusion capacity (Dlco).
• Identify Dlco findings characteristic of restrictive lung disorders.
• Identify Dlco findings characteristic of obstructive lung disorders.
• Define key terms and complete self-assessment questions at the end of the chapter and on Evolve.
Normal Lung Volumes and Capacities
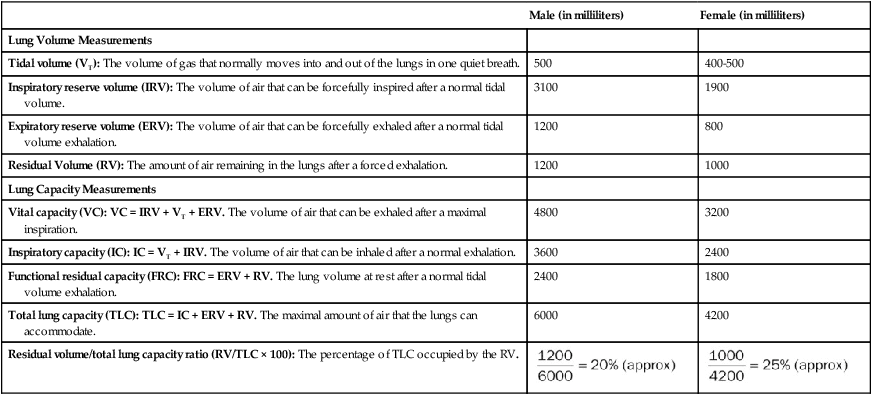
As shown in Table 3-1, gas in the lungs is divided into four lung volumes and four lung capacities. The lung capacities represent different combinations of lung volumes. The amount of air the lungs can accommodate varies with age, weight, height, gender, and, to a much lesser extent, race. Prediction formulas for normal values exist that take these variables into account. Lung volumes and capacities change as a result of pulmonary disorders. These changes are classified as either restrictive lung disorders or obstructive lung disorders.
Table 3-1
Lung Volumes and Capacities of Normal Recumbent Subjects 20 to 30 Years of Age
| Male (in milliliters) | Female (in milliliters) | |
| Lung Volume Measurements | ||
| Tidal volume (VT): The volume of gas that normally moves into and out of the lungs in one quiet breath. | 500 | 400-500 |
| Inspiratory reserve volume (IRV): The volume of air that can be forcefully inspired after a normal tidal volume. | 3100 | 1900 |
| Expiratory reserve volume (ERV): The volume of air that can be forcefully exhaled after a normal tidal volume exhalation. | 1200 | 800 |
| Residual Volume (RV): The amount of air remaining in the lungs after a forced exhalation. | 1200 | 1000 |
| Lung Capacity Measurements | ||
| Vital capacity (VC): VC = IRV + VT + ERV. The volume of air that can be exhaled after a maximal inspiration. | 4800 | 3200 |
| Inspiratory capacity (IC): IC = VT + IRV. The volume of air that can be inhaled after a normal exhalation. | 3600 | 2400 |
| Functional residual capacity (FRC): FRC = ERV + RV. The lung volume at rest after a normal tidal volume exhalation. | 2400 | 1800 |
| Total lung capacity (TLC): TLC = IC + ERV + RV. The maximal amount of air that the lungs can accommodate. | 6000 | 4200 |
| Residual volume/total lung capacity ratio (RV/TLC × 100): The percentage of TLC occupied by the RV. |  |
 |
Restrictive Lung Disorders: Lung Volume and Capacity Findings
Table 3-2 presents an overview of the lung volume and capacity findings characteristic of restrictive lung disorders. Restrictive lung volumes and capacities are associated with pathologic conditions that alter the anatomic structures of the lungs distal to the terminal bronchioles (i.e., the alveoli or the lung parenchyma). Table 3-3 provides some of the more common restrictive anatomic alterations of the lungs and examples of respiratory disorders that cause them. Restrictive lung disorders result in an increased lung rigidity, which in turn decreases lung compliance. When lung compliance decreases, the ventilatory rate increases and the tidal volume (VT) decreases (see Figure 2-23).
Table 3-2
Restrictive Lung Disorders: Lung Volume and Capacity Findings
| VT N or ↓ |
IRV ↓ |
ERV ↓ |
RV ↓ |
|
| VC ↓ |
IC ↓ |
FRC ↓ |
TLC ↓ |
RV/TLC N |
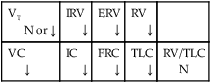
Table 3-3
| Pathology (Anatomic Alteration of the Alveoli) | Examples of Respiratory Disorders Associated with Specific Pathology |
| Atelectasis | Pneumothorax, pleural effusion, flail chest, or mucous plugging |
| Consolidation | Pneumonia, acute respiratory distress syndrome, lung abscess, tuberculosis |
| Increased alveolar-capillary membrane thickness | Pulmonary edema, pneumoconiosis, tuberculosis, fungal disease |
Obstructive Lung Disorders: Lung Volume and Capacity Findings
Table 3-4 provides an overview of the lung volumes and capacity findings characteristic of obstructive lung disorders. These lung volume and capacity findings are associated with pathologic conditions that alter the tracheobronchial tree. Table 3-5 provides some of the more common obstructive anatomic alterations of the lungs and examples of respiratory disorders that cause them.
Table 3-4
Obstructive Lung Disorders: (Lung Volume and Capacity Findings)
| VT N or ↑ |
IRV N or ↓ |
ERV N or ↓ |
RV ↑ |
|
| VC ↓ |
IC N or ↓ |
FRC ↑ |
TLC N or ↑ |
RV/TLC ratio N or ↑ |

Table 3-5
| Pathology (Anatomic Alteration of the Bronchial Airways) | Examples of Respiratory Disorders Associated with Specific Pathology |
| Excessive mucous production and accumulation | Chronic bronchitis, asthma, respiratory syncytial virus |
| Bronchospasm | Asthma |
| Distal airway weakening | Emphysema |
In obstructive lung disorders, the gas that enters the alveoli during inspiration (when the bronchial airways are naturally wider) is prevented from leaving the alveoli during expiration (when the bronchial airways narrow). As a result, the alveoli become overdistended with gas, a condition known as air trapping. Figure 3-1 provides a visual comparison of obstructive and restrictive lung disorders.

Forced Expiratory Flow Rate and Volume Measurements
Forced Vital Capacity
The forced vital capacity (FVC) is the total volume of gas that can be exhaled as forcefully and rapidly as possible after a maximal inspiration. In the healthy individual, the total expiratory time (TET) necessary to perform a FVC is 4 to 6 seconds. In obstructive lung disease (e.g., chronic bronchitis or emphysema), the TET increases because of the increased airway resistance and air trapping associated with the disorder. TETs of more than 10 seconds have been reported in these patients. In the normal individual the FVC equals the vital capacity (VC). Clinically, the lungs are considered normal if the FVC and the VC are within 200 mL of each other. In the patient with obstructive lung disease the FVC is lower than the VC because of increased airway resistance and air trapping with maximal effort (Figure 3-2).

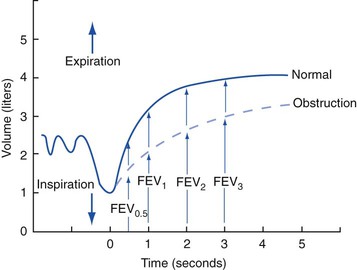
Forced Expiratory Volume Timed
The maximum volume of gas that can be exhaled over a specific period is the forced expiratory volume timed (FEVT). This measurement is obtained from an FVC measurement. Commonly used time periods are 0.5, 1.0, 2.0, 3.0, and 6.0 seconds. The most commonly used time period is 1 second (forced expiratory volume in 1 second [FEV1]). In the normal adult the percentages of the total volume exhaled during these time periods are as follows: FEV0.5, 60%; FEV1, 83%; FEV2, 94%; and FEV3, 97%. In obstructive disease the FEVT is decreased because the time necessary to exhale a certain volume forcefully is increased (Figure 3-3). Although the FEVT may be normal in restrictive lung disorders (e.g., pneumonia, acute respiratory distress syndrome, atelectasis), it is commonly decreased because of the decreased VC associated with restrictive disorders (similar to the FVC in restrictive disorders). The FEVT progressively decreases with age.

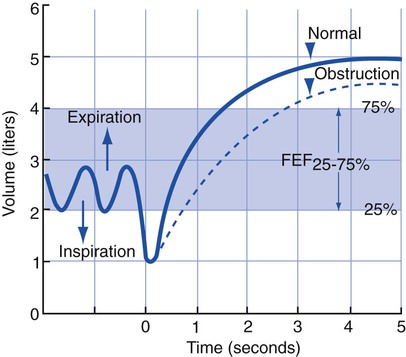
Forced Expiratory Flow 25%-75% (FEF25%-75%)
The FEF25%-75% is the average flow rate generated by the patient during the middle 50% of an FVC measurement (Figure 3-4). This expiratory maneuver is used to evaluate the status of medium-to-small airways in obstructive lung disorders. The normal FEF25%-75% in a healthy man 20 to 30 years of age is about 4.5 L/sec (270 L/min). The normal FEF25%-75% in a healthy woman 20 to 30 years of age is about 3.5 L/sec (210 L/min). The FEF25%-75% is somewhat effort-dependent because it depends on the FVC exhaled.
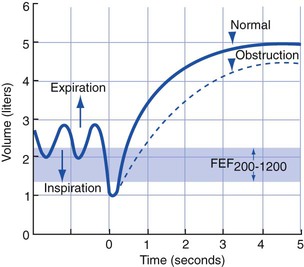
Forced Expiratory Flow 200-1200 (FEF200-1200)
The FEF200-1200 measures the average flow rate between 200 and 1200 mL of an FVC (Figure 3-5). The first 200 mL of the FVC is usually exhaled more slowly than at the average flow rate because of (1) the normal inertia involved in the respiratory maneuver and (2) the initial slow response time of the pulmonary function equipment. Because the FEF200-1200 measures expiratory flows at high lung volumes (i.e., the initial part of the FVC), it provides a good assessment of the large upper airways. The FEF200-1200 is relatively effort-dependent.

Peak Expiratory Flow Rate (PEFR)
The PEFR (also known as the peak flow rate) is the maximum flow rate generated during an FVC maneuver (Figure 3-6). The PEFR provides a good assessment of the large upper airways. It is quite effort-dependent. The normal PEFR in the average healthy man 20 to 30 years of age is approximately 10 L/sec (600 L/min). The normal PEFR in the average healthy woman 20 to 30 years of age is approximately 7.5 L/sec (450 L/min). The PEFR decreases in obstructive lung diseases. In restrictive lung disorders, the PEFR is usually normal because it measures the early expiratory flow rates during the first part of an FVC maneuver (i.e., when the patient’s VC is at its highest level). The PEFR progressively decreases with age.

 ).
).Maximum Voluntary Ventilation (MVV)
The MVV is the largest volume of gas that can be breathed voluntarily in and out of the lungs in 1 minute (Figure 3-7). The normal MVV in the average healthy man 20 to 30 years of age is approximately 170 L/min. The normal MVV in the average healthy woman 20 to 30 years of age is approximately 110 L/min. The MVV progressively decreases in obstructive pulmonary disorders. In restrictive pulmonary disorders, the MVV may be normal or decreased.

Flow-Volume Loop
The flow-volume loop is a graphic illustration of both a forced vital capacity (FVC) maneuver and a forced inspiratory volume (FIV) maneuver. The FVC and FIV are plotted together as two curves that form what is called a flow-volume loop. As shown in Figure 3-8, the upper half of the flow-volume loop (above the zero flow axis) represents the maximum expiratory flow generated at various lung volumes during an FVC maneuver plotted against volume. This portion of the curve shows the flow generated between the TLC and RV.

• Peak inspiratory flow rate (PIFR)
• Forced expiratory flow at 50% (FEF50%)
• Instantaneous flow at any given lung volume during forced inhalation and exhalation
In the normal subject the expiratory flow rate decreases linearly during an FVC maneuver, immediately after the PEFR has been achieved. In the patient with an obstructive lung disease, however, the flow rate decreases in a nonlinear fashion after the PEFR has been reached. This nonlinear flow rate causes a cuplike or scooped-out appearance in the expiratory flow curve when 50% of the FVC has been exhaled. This portion of the flow curve is the FEF50%, or (Figure 3-9). Table 3-6 summarizes (1) the forced expiratory flow rate and volume measurements and (2) the normal values found in healthy men and women ages 20 to 30 years.
Table 3-6
Normal Forced Expiratory Flow Rate Measurements in Healthy Men and Women 20 to 30 Years of Age
| Forced Expiratory Flow Rate Measurement | Men | Women |
 Forced vital capacity (FVC). A is the point of maximal inspiration and the starting point of an FVC maneuver. Note the reduction in FVC in obstructive pulmonary disease, caused by dynamic compression of the airways. |
Usually equals vital capacity (VC) (FVC and VC should be within 200 mL of each other) | Usually equals VC (FVC and VC should be within 200 mL of each other) |
 Forced expiratory volume timed (FEVT): FEV0.5, FEV1.0, FEV2.0, FEV3.0. In obstructive disorders, more time is needed to exhale a specified volume. |
Should be > 70%
Should be > 70%

Forced expiratory flow 25%-75% (FEF25%-75%). This test measures the average rate of flow between 25% and 75% of an FVC maneuver. The flow rate is measured when 25% of the FVC has been exhaled and again when 75% of the FVC has been exhaled. The average rate of flow is derived by dividing the combined flow rates by 2.
Forced expiratory flow 200-1200 (FEF200-1200). This test measures the average rate of flow between 200 mL and 1200 mL of an FVC maneuver. The flow rate is measured when 200 mL have been exhaled and again when 1200 mL have been exhaled. The average rate of flow is derived by dividing the combined flow rates by 2.

Peak expiratory flow rate (PEFR). The maximum flow rate (steepest slope of the volume-time trace) generated during an FVC maneuver.

Maximum voluntary ventilation (MVV). The largest volume of gas that can be breathed voluntarily in and out of the lungs in 1 minute.
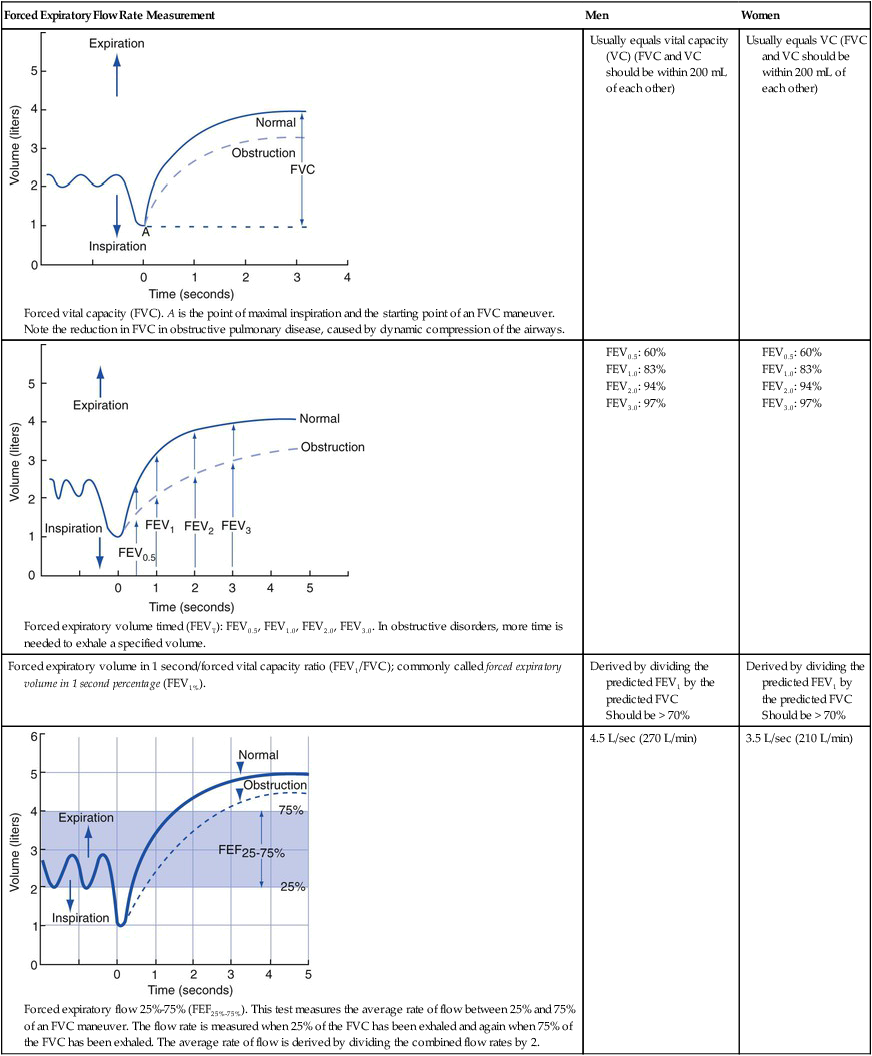


Table 3-7 provides an overview of the expiratory flow rate measurements characteristic of restrictive lung disorders. In restrictive lung disorders, flow and volume are, in general, reduced equally. Clinically, this phenomenon is referred to as symmetric reduction in flows and volumes. The flow-volume loop therefore is a small version of normal in restrictive pulmonary disease (Figure 3-10).
Table 3-7
Restrictive Lung Disease: Forced Expiratory Flow Rate and Volume Findings
| FVC ↓ |
FEVT N or ↓ |
FEV1/FVC N or ↑ |
FEF25%-75% N or ↓ |
| FEF50% N or ↓ |
FEF200-1200 N or ↓ |
PEFR N or ↓ |
MVV N or ↓ |
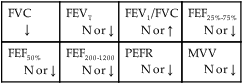

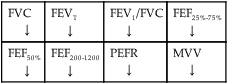
Table 3-8 provides an overview of the expiratory flow rate measurements characteristic of obstructive lung disorders. Obstructive lung disorders cause increased airway resistance (Raw) and airway closure during expiration. When Raw becomes high, the patient’s ventilatory rate decreases and the VT increases. This ventilatory pattern is thought to be an adaptation to reduce the work of breathing (see Figure 2-23).
Table 3-8
Obstructive Lung Diseases: Forced Expiratory Flow Rate and Volume Findings
| FVC ↓ |
FEVT ↓ |
FEV1/FVC ↓ |
FEF25%-75% ↓ |
| FEF50% ↓ |
FEF200-1200 ↓ |
PEFR ↓ |
MVV ↓ |
Pulmonary Diffusion Capacity
The pulmonary diffusion capacity of carbon monoxide (Dlco) measures the amount of carbon monoxide (CO) that moves across the alveolar-capillary membrane. When the patient has a normal hemoglobin concentration, pulmonary capillary blood volume, and ventilatory status, the only limiting factor to the diffusion of CO is the alveolar-capillary membrane. Under normal conditions the average Dlco value for the resting man is 25 mL/min/mm Hg (STPD). This value is slightly lower in women, presumably because of their smaller normal lung volumes. Table 3-9 provides a general guide to conditions that alter the patient’s Dlco.
Table 3-9
Pulmonary Diffusion Capacity of Carbon Monoxide (Dlco)
| Obstructive Lung Disorders* N or ↓ |
Restrictive Lung Disorders† N or ↓ |
*A decreased Dlco is a hallmark clinical manifestation in emphysema (because of the destruction of the alveolar pulmonary capillaries and decreased surface area for gas diffusion associated with the disease). The Dlco is usually normal in all other obstructive lung disorders.
†This is usually decreased when moderate to severe alveolar atelectasis, alveolar consolidation, or increased alveolar-capillary membrane thickness is present in the restrictive lung disorder.
