Pulmonary Function Measurements
After reading this chapter, you will be able to:
• Describe how the normal range of human pulmonary function values are obtained
• Explain why dilution or washout measurements of functional residual capacity (FRC) in severe obstructive airways disease generally differ from values obtained by the plethysmographic method
• Explain why both restrictive and obstructive disease mechanisms reduce the vital capacity
• Explain why restrictive and obstructive diseases affect the FRC, the residual volume, and the work of breathing differently
• Differentiate between purely obstructive and restrictive patterns of pulmonary function tests
• Explain why large and small airways resistance affects certain spirometric tests in different ways
• Explain why the results of some spirometric tests can be improved with greater effort, but the results of others are independent of effort
• Describe the theory behind the test that detects grossly uneven ventilation of the lungs
• Explain why the relationship between maximum voluntary ventilation and ventilation attained during maximal exercise is different for individuals with severe obstructive pulmonary disease compared to healthy people
• Explain the basic theory behind tests that are especially sensitive to increases in small airways resistance

Static Lung Volumes
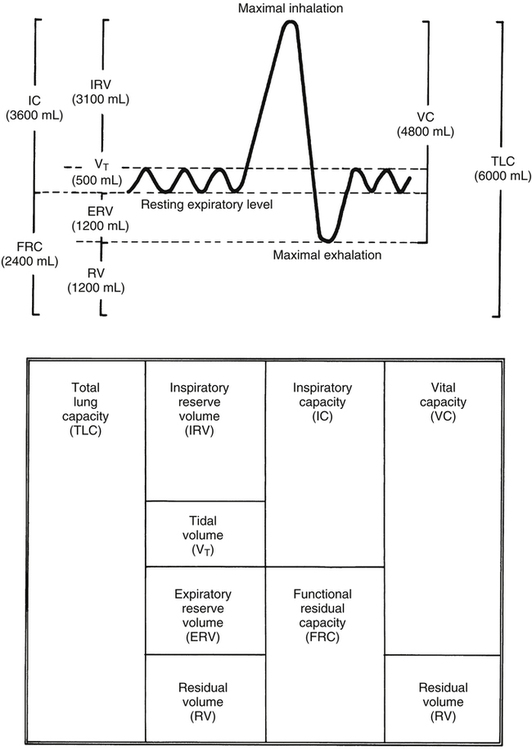
Static lung volumes and their spirometric measurement are discussed in Chapter 3. Normal values and interrelationships among volumes and capacities are illustrated in Figure 5-1. Anthropometric differences (differences in body type and size) affect normal values, creating ranges in which normal function is presumed. Normal ranges are derived from a statistical analysis of large populations of “normal” people (i.e., people who are healthy, have no history of lung disease, and have minimal exposure to risk factors such as smoking and environmental pollution). Physical characteristics that influence pulmonary function most are age, gender, height, ethnic origin, and body size or surface area.1 Normal values are predicted for an individual based on these physical characteristics. Function is generally classified as normal if values are within 20% of the predicted value (i.e., 80% to 120% of the predicted value). Table 5-1 displays the relationship between the percentage of the predicted normal value and the degree of functional impairment.
TABLE 5-1
| Degree of Impairment | Percentage of Predicted | SD Above and Below Mean |
| Normal | 80-120 | ±1 |
| Mild | 65-79 | ±1-2 |
| Moderate | 50-64 | ±2-3 |
| Severe | 35-49 | > ±3 |
| Extremely severe | <35 | — |
Modified from Wilkins RL, Stoller JK, Scanlan CL: Egan’s fundamentals of respiratory care, ed 8, St Louis, 2003, Mosby.
Theoretical Basis for Measurement
Because residual volume (RV) cannot be exhaled, it cannot be measured via direct spirometry. Therefore, no capacity containing RV can be directly measured. RV and capacities containing it are measured indirectly via one of the following methods: helium dilution, nitrogen washout, or body plethysmography. The dilution and washout techniques measure gas in the lung only if the gas communicates with unobstructed airways. These tests are started at the end of a normal expiration (i.e., the functional residual capacity [FRC] level). Washout and dilution tests measure the FRC, which is the logical starting point because it is highly reproducible and its achievement requires no patient effort—only ventilatory muscle relaxation. As shown in Figure 5-1, after FRC is determined, spirometric measurement of the expiratory reserve volume (ERV) allows the RV to be calculated (RV = FRC − ERV). Likewise, spirometric measurement of inspiratory capacity (IC) allows total lung capacity (TLC) to be calculated (FRC + IC = TLC). Alternatively, if RV is measured, TLC can be calculated as follows: RV + vital capacity (VC) = TLC.
Helium Dilution Method
The helium dilution method requires the person to rebreathe a helium gas mixture through a closed circuit from a spirometer of known volume (Figure 5-2). Helium is a foreign gas to the lung and is inert and insoluble in the blood. Therefore, the blood does not absorb helium during the test. The lung contains no helium initially (Figure 5-2, A), but rebreathing causes lung and spirometric gases to mix (Figure 5-2, B). A helium analyzer in the circuit continuously monitors helium concentration. As rebreathing progresses, lung gases dilute the helium in the spirometer. Consequently, helium concentration decreases in the spirometer and increases in the lung until equilibrium is reached (Figure 5-2, C). During the rebreathing process, the spirometric volume is kept constant through the addition of oxygen to the circuit to replace oxygen taken up by the blood. Likewise, a chemical in the circuit absorbs carbon dioxide entering the lung from the blood.
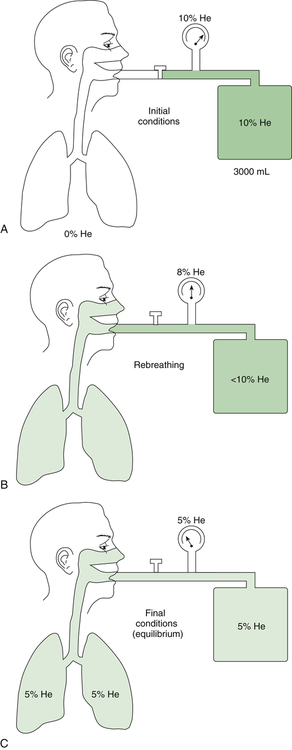
The principle of the closed-circuit helium dilution method is that the amount of helium in the lung spirometric system is the same at the end of the test as at the beginning. For example, after it is charged with helium, the spirometer’s volume may be 3000 mL and the helium concentration 10% (see Figure 5-2, A). In this example, the amount of helium present at the beginning of the test is 10% of 3000, or 300 mL (0.10 × 3000 = 300 mL). Because the lung contains no helium initially, 300 mL of helium must be present in the lung spirometer system at the end of the test after helium equilibrium is achieved. Consider an example in which the helium concentration at equilibrium is 5% (see Figure 5-2, C). The lung volume diluting the spirometer’s helium mixture is the FRC if the first inspiration of the helium mixture started from the resting FRC level. In principle, the FRC is calculated as follows:2
 1.
1.With the values from the previous example, the following can be calculated:
 2.
2. 3.
3. 4.
4. 5.
5. 6.
6.Nitrogen Washout Method
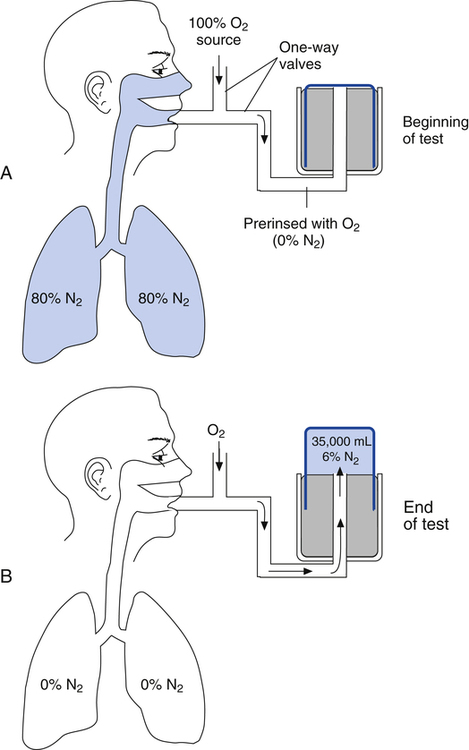
In the open-circuit nitrogen washout procedure (Figure 5-3), the person breathes through a one-way valve, inspiring 100% oxygen and expiring into a large gas-collecting spirometer previously flushed with 100% oxygen. Each inspiration is nitrogen-free, and each expiration eliminates some of the nitrogen in the lung. Normally, less than 7 minutes is required to eliminate most of the nitrogen in the lung, but patients with poorly ventilated areas may require longer washout times. The test usually ends when the expired nitrogen is less than 2%. The amount of nitrogen exhaled is calculated by analyzing the spirometer’s nitrogen concentration (FN2) and multiplying it by the Vs (Nitrogen [mL] = FN2 × Vs). If 35 L (35,000 mL) of expired gas is collected during the test and its nitrogen content is 6%, the amount of nitrogen exhaled is calculated as follows: 35,000 × 0.06 = 2100 mL. As the following indicates, 2100 mL is 80% of the lung volume:

The measured FRC must be corrected to reflect the volume it occupies under BTPS conditions.
Body Plethysmographic Method
The body plethysmograph is an airtight chamber, or “body box,” in which the patient sits while breathing through a mouthpiece (Figure 5-4). Sensitive pressure transducers measure mouthpiece and box pressures. Box calibration is carried out with an empty, sealed box; a known volume of gas is injected into the box with a large calibration syringe, and the change in box pressure is noted. This calibration procedure allows subsequent box pressure changes to be converted to volume changes.
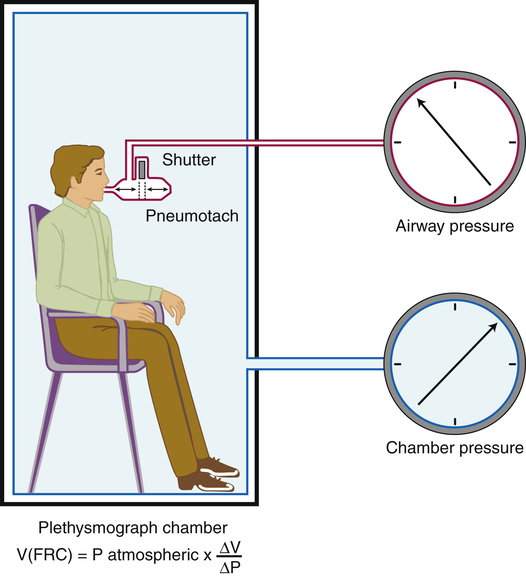
At the end of expiration when gas flow ceases, mouthpiece pressure equals alveolar pressure. The lung volume at this point (the FRC) is unknown. An electrically controlled shutter occludes the mouthpiece precisely at the end expiratory point. The subsequent inspiratory effort cannot move gas. However, the respiratory muscles enlarge the thorax, decompressing the gas in the lung, decreasing its pressure (see Figure 5-4). In the absence of gas flow, intrapulmonary pressure equals mouthpiece pressure. At the same time, the enlarging thorax compresses air inside the box around the patient, increasing the box pressure. The change in box pressure is converted to the change in volume from the initial calibration procedure. The variables in Boyle’s law are assigned as follows: P1 equals initial mouth pressure (atmospheric pressure), V1 equals FRC (unknown), P2 equals final mouth pressure (measured during inspiratory effort through the occluded mouthpiece), and V2 equals FRC plus the change in lung volume (ΔV). The ΔV is known. In principle, the FRC is calculated as follows:
Significance of Changes in Functional Residual Capacity and Residual Volume
Physical factors that change FRC and RV are summarized in Box 5-1. Changes in lung recoil affect FRC because FRC is determined by the balance point between lung and thoracic recoil forces. An abnormally increased FRC represents hyperinflation, which may be caused by a loss of elastic recoil or partial airway obstruction. Partial airway obstruction caused by bronchospasm is generally reversed by bronchodilator drugs, and the associated increase in FRC is reversible. Increased FRC caused by a permanent loss of elastic recoil is irreversible. In severe emphysema, this loss of lung elasticity is associated with passive airway compression and collapse during expiration, causing air trapping. Bronchodilator drugs are not useful in these circumstances. (See the discussion on air trapping and auto-PEEP in Chapter 3).
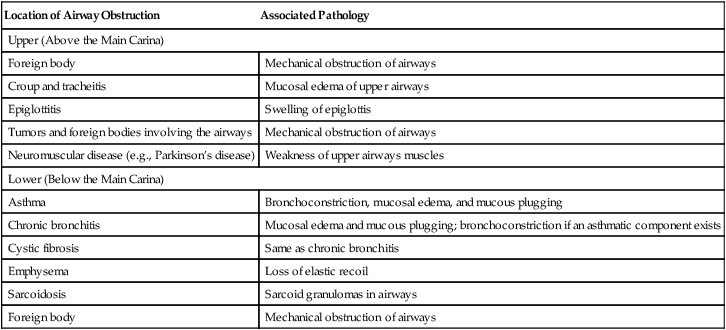
FRC and RV usually increase together, reducing the IC and VC. Regardless of the mechanism by which FRC is increased, hyperinflation flattens the diaphragm, placing it at a mechanical disadvantage. Shortened muscle fibers in flattened diaphragms have decreased contractility. In addition, flattened diaphragms cannot move downward much farther; thus, greater effort is required to inspire the tidal volume, often requiring the use of accessory muscles. Diseases increasing FRC and RV are generally classified as obstructive. An exception is neuromuscular disease in which FRC is normal but RV is increased because of weak expiratory muscles. A weak, forced exhalation reduces the ERV, increasing the RV. Table 5-2 summarizes some conditions associated with airway obstruction.
TABLE 5-2
Conditions Associated with Obstruction to Airflow
| Location of Airway Obstruction | Associated Pathology |
| Upper (Above the Main Carina) | |
| Foreign body | Mechanical obstruction of airways |
| Croup and tracheitis | Mucosal edema of upper airways |
| Epiglottitis | Swelling of epiglottis |
| Tumors and foreign bodies involving the airways | Mechanical obstruction of airways |
| Neuromuscular disease (e.g., Parkinson’s disease) | Weakness of upper airways muscles |
| Lower (Below the Main Carina) | |
| Asthma | Bronchoconstriction, mucosal edema, and mucous plugging |
| Chronic bronchitis | Mucosal edema and mucous plugging; bronchoconstriction if an asthmatic component exists |
| Cystic fibrosis | Same as chronic bronchitis |
| Emphysema | Loss of elastic recoil |
| Sarcoidosis | Sarcoid granulomas in airways |
| Foreign body | Mechanical obstruction of airways |
Modified from Martin L: Pulmonary physiology in clinical practice: the essentials for patient care and evaluation, St Louis, 1987, Mosby.
Pulmonary or extrapulmonary factors may decrease RV and FRC (Box 5-1). Fibrotic lung diseases increase lung elastic recoil, shrinking all volumes and capacities. Increased alveolar-capillary membrane permeability, characteristic of acute respiratory distress syndrome (ARDS), disrupts surfactant synthesis and increases alveolar surface tension; this decreases FRC and RV by causing widespread alveolar collapse. Extrapulmonary restriction of lung expansion by skeletal deformities also reduces all lung volumes and capacities. Regardless of the mechanisms involved, reduced FRC and high lung recoil increase the work of breathing. Diseases decreasing FRC and RV are generally classified as restrictive. Table 5-3 summarizes some conditions associated with restrictive diseases.
TABLE 5-3
Respiratory Conditions Commonly Associated with a Restrictive Breathing Pattern
| Involving the Chest Bellows | Involving the Lungs |
| Myasthenia gravis | Atelectasis |
| Guillain-Barré syndrome | Pulmonary sarcoidosis |
| Pleural effusion and pleural disease | Pulmonary fibrosis |
| Flail chest (multiple broken ribs) | Pulmonary edema |
| Morbid obesity | Pneumonia |
| Diaphragm paralysis | Congestive heart failure |
Modified from Martin L: Pulmonary physiology in clinical practice: the essentials for patient care and evaluation, St Louis, 1987, Mosby.
In obstructive disease, the TLC is often normal, or it may be moderately increased in severe emphysema secondary to loss of lung recoil force. However, the major feature of obstructive disease is a reduced maximum expiratory flow rate. Obstructive diseases increase the work of breathing primarily by increasing airway resistance. In contrast, the major features of restrictive disease are reduced lung volumes and capacities. This reduction is usually accompanied by normal expiratory flow rates. Restrictive diseases generally increase the work of breathing by decreasing lung compliance, making expansion difficult. Table 5-4 summarizes the differences between obstructive and restrictive disease.
TABLE 5-4
Characteristics of Obstructive and Restrictive Diseases
| Characteristic | Obstructive | Restrictive |
| Main pulmonary function characteristic | Decreased expiratory flow | Decreased volumes and capacities |
| Mechanism increasing work of breathing | High airway resistance | Low lung compliance |
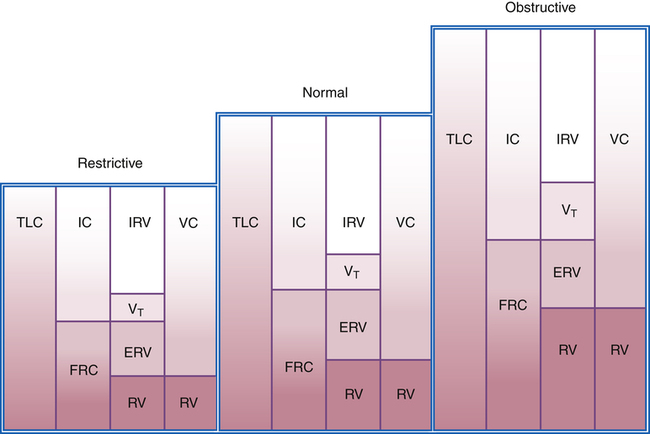
Figure 5-5 illustrates lung volumes and capacities in normal, obstructive, and restrictive lung diseases. The normal RV/TLC ratio is 20% to 25% in healthy adults up to age 49 years; in people older than 50, the RV/TLC ratio may range as high as 35%, reflecting a normal loss of elastic recoil with aging. Abnormally increased RV/TLC ratios generally indicate hyperinflation, although RV/TLC may be increased in some restrictive diseases in which the VC (and the TLC) is reduced more than the RV.1
Dynamic Pulmonary Mechanics Measurements
Volume-Time Measurements
Forced Vital Capacity
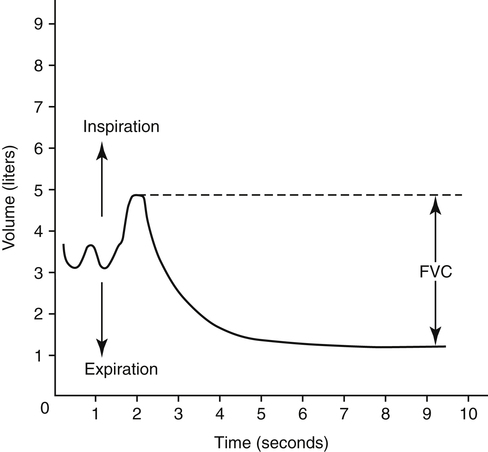
The forced vital capacity (FVC) measurement requires the person to exhale the VC as forcefully and rapidly as possible. FVC is the most frequently performed pulmonary function test because it provides much information about large and small airways function. It is an effort-dependent test, requiring thorough patient instruction, understanding, and maximal effort. A valid test is assumed if the person can repeat three FVC maneuvers with a variation no greater than 5%.1 FVC displayed as volume versus time is illustrated in Figure 5-6, with upward deflections denoting inspiration.
Forced Expiratory Volumes
Measuring the amount of FVC that can be exhaled within a given time interval provides additional information about airway obstruction. The time intervals often measured are 1.0 second, 2.0 seconds, and 3.0 seconds (Figure 5-7). The most commonly assessed forced expiratory volume (FEV) interval is FEV1, the amount of FVC exhaled in 1 second. Because FEV values refer to volume measured over time, they reflect the average flow rates over their time intervals.
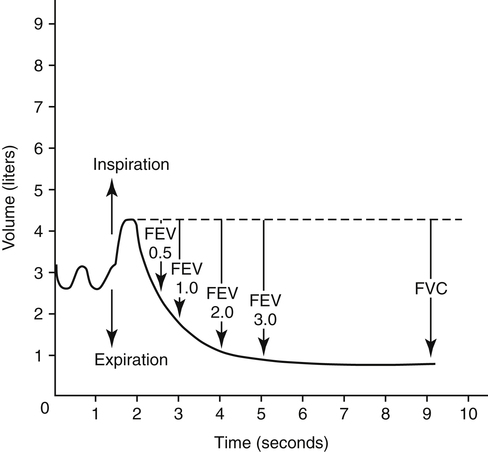
FEV1 is an index of severity in chronic obstructive pulmonary disease (COPD). The ability to work and likelihood of dying of respiratory disease are statistically correlated with the FEV1. Healthy adults with normal pulmonary function exhale about 83% of the FVC in 1 second (FEV1), 94% in 2 seconds (FEV2), and 97% in 3 seconds (FEV3). Age causes the FEV1/FVC ratio to decrease because of reduced elastic recoil. An FEV1/FVC ratio lower than 70% indicates that abnormal airways obstruction is present.1
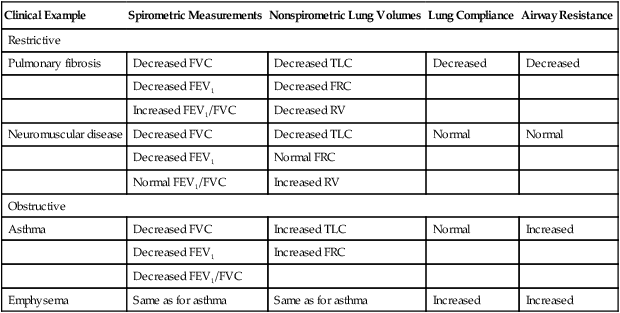
The FVC, FEV1, and FEV1/FVC ratio are the three most common variables used to distinguish between obstructive and restrictive pulmonary function patterns. Table 5-5 illustrates various pulmonary function measurements in obstructive and restrictive diseases.
TABLE 5-5
Spirometric and Physiological Correlates of Restrictive and Obstructive Lung Disease
| Clinical Example | Spirometric Measurements | Nonspirometric Lung Volumes | Lung Compliance | Airway Resistance |
| Restrictive | ||||
| Pulmonary fibrosis | Decreased FVC | Decreased TLC | Decreased | Decreased |
| Decreased FEV1 | Decreased FRC | |||
| Increased FEV1/FVC | Decreased RV | |||
| Neuromuscular disease | Decreased FVC | Decreased TLC | Normal | Normal |
| Decreased FEV1 | Normal FRC | |||
| Normal FEV1/FVC | Increased RV | |||
| Obstructive | ||||
| Asthma | Decreased FVC | Increased TLC | Normal | Increased |
| Decreased FEV1 | Increased FRC | |||
| Decreased FEV1/FVC | ||||
| Emphysema | Same as for asthma | Same as for asthma | Increased | Increased |
Modified from Martin L: Pulmonary physiology in clinical practice: the essentials for patient care and evaluation, St Louis, 1987, Mosby.
Forced Expired Flows: FEF25%-75% and Peak Expiratory Flow
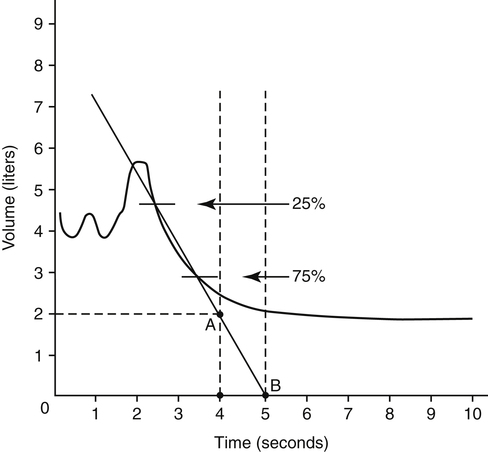
Forced expired flow (FEF) rates are derived from the volume-versus-time FVC curve. FEF25%-75% is the average flow rate over the middle 50% of the FVC (Figure 5-8). A volume-time graph is necessary to calculate FEF25%-75% manually. The points at which 25% and 75% of the FVC have been exhaled are identified by multiplying the FVC by 0.25 and 0.75. A straight line drawn through these two points on the FVC curve is extended to intersect two vertical time lines on the graph 1 second apart. The volume between the two intersection points on the time lines is the FEF25%-75% in liters per second. As with all pulmonary function measurements, the volume must be corrected to BTPS.
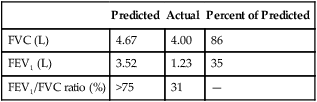
Clinical Focus 5-2 Differentiating Obstructive and Restrictive Disease Patterns
| Predicted | Actual | Percent of Predicted | |
| FVC (L) | 4.67 | 4.00 | 86 |
| FEV1 (L) | 3.52 | 1.23 | 35 |
| FEV1/FVC ratio (%) | >75 | 31 | — |
programs, respiratory therapists teach patients how to use small, inexpensive peak flowmeters to detect early onset of an asthma exacerbation before it becomes life threatening and how to use the device to assess response to bronchodilator drugs. Peak flows obtained in these settings should be periodically compared with more accurate laboratory spirometry.
PEF is not sensitive to flow coming from small airways. In early small airway obstruction, flows achieved at the beginning of the FVC are often normal because small airway collapse has not yet occurred. FEF25%-75% is more sensitive to flow coming from medium to small airways. The primary resistance to expiratory flow during the middle half of the FVC is created by the rapidly narrowing small airways as the lung deflates. Normal FEF25%-75% for a healthy young adult is about 4 to 5 L per second. This test has more variance than other measures of flow, even in people with normal pulmonary function. FEF25%-75% equal to 65% of the predicted value may still be within statistically normal limits.1 Because FEF25%-75% is so variable, its validity is questionable; FEV1 is more useful and reliable in assessing the response to bronchodilators.
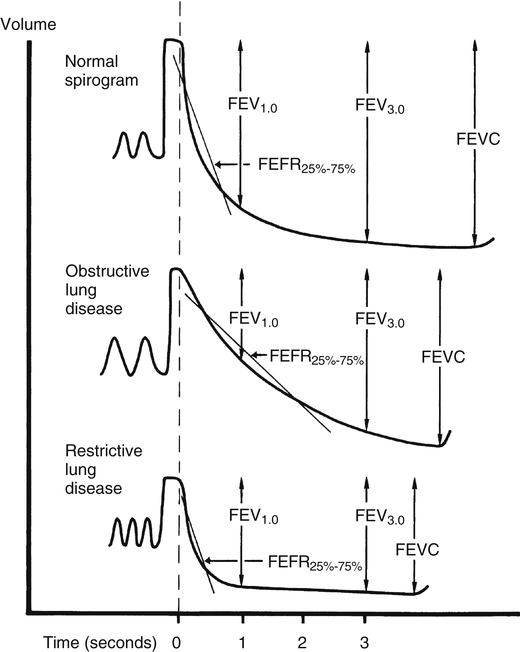
FEF25%-75% and PEF have no value in differentiating between obstructive and restrictive patterns. These flows should be considered only after the severity of obstruction has been determined from the FVC, FEV1, and FEV1/FVC ratio. FEF25%-75% might be valuable in further confirming or ruling out obstructive defects in asymptomatic people with a borderline low FEV1/FVC ratio. Figure 5-9 illustrates obstructive, restrictive, and normal spirograms, including FEF25%-75%, FEV1, and FVC.
Flow-Volume Measurements
Spirometric measurements are often assessed from the perspective of flow versus volume. Figure 5-10 illustrates the FVC flow-volume curve (F-V curve). Flow is plotted vertically on the y-axis in liters per second; volume is plotted horizontally on the x-axis in liters. The expiratory (above baseline) and inspiratory (below baseline) portions of the flow-volume graph form a loop—hence the term flow-volume loop (F-V loop). The F-V loop is most commonly formed by having the person complete an FVC maneuver and then inspire forcefully back to TLC. The inspiratory maneuver is called the forced inspiratory volume (FIV).
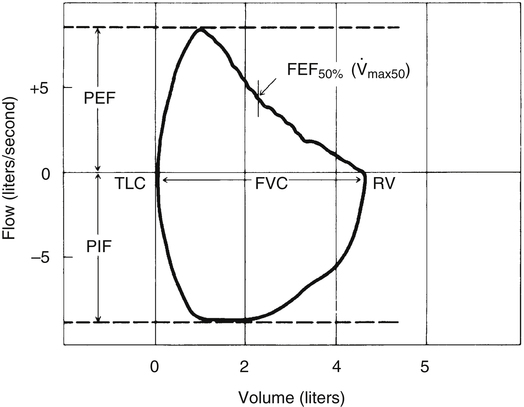
As the FVC is exhaled, the instantaneous flow at any lung volume from TLC to RV can be directly observed. For example, the maximum expiratory flow that can be generated when the lung is deflating through the 50% point of the FVC ( max50) can be determined directly from the graph in Figure 5-10. Likewise, PEF and peak inspiratory flow (PIF) are simply the highest and lowest deflections of the F-V loop. The F-V loop is actually a continuous plot of all the maximum flows achievable at an infinite number of lung volumes ranging from TLC to RV.


Figure 5-11, A, compares normal (black line), restrictive (red line), and obstructive (blue line) F-V curves adjusted such that points of maximum inspiration coincide. This comparison does not consider the actual amount of gas in the lungs at the maximum inspiratory point. In addressing this problem, Figure 5-11, B, plots the same three curves with respect to the total amount of gas in the lungs at maximum inspiration (i.e., TGV). Clearly, the maximum inspiratory points are associated with different TGVs. The increases in TLC and RV are obvious in the obstructive curve (blue line), as are the severely reduced flows early in the FVC. Although high lung volume (normally associated with high lung recoil force) should increase expiratory flow, it is still abnormally low throughout the FVC in obstructive disease.
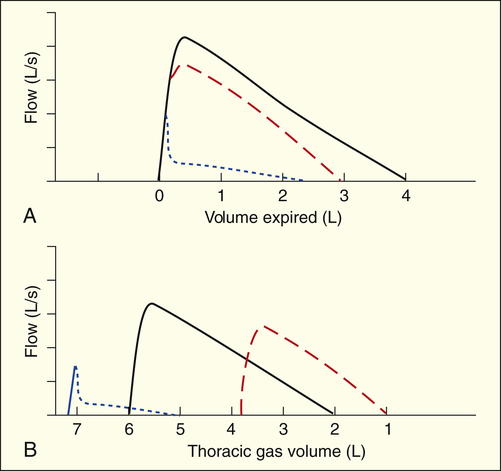
Severe reductions in TLC and RV are equally obvious in the restrictive curve (red line). Compared with the total lung volume at which they are measured, flows in the restrictive curve are above normal, even though absolute flows are reduced. For example, at a TGV of 3 L, flow is greater in the restrictive curve than the normal curve (see Figure 5-11, B). At the same time, flows are below normal throughout the FVC, as shown in Figure 5-11, A (red curve).
As explained in Chapter 3, the first 20% to 25% of an FVC maneuver is effort-dependent and the last 75% to 80% is effort-independent, which means that the slope of the last 80% of the F-V curve is independent of patient effort. For this reason, the expiratory F-V curve of the healthy lung descends in a linear fashion after peak flow is achieved (see Figure 5-10). PEF and FEF25% occur early in the FVC, reflecting effort-dependent flow from large airways; large airways pose the major resistance to expiratory flow at high lung volumes. FEF25%-75%, FEF50%, and FEF75% occur later in the effort-independent portion of the FVC, reflecting flow from small airways; small airways pose the major resistance to expiratory flow at low lung volumes.
The decreased expiratory flow in obstructive disease is particularly evident at low lung volumes. FEF50% and FEF75% are most affected. When these flows are decreased, the expiratory F-V curve assumes a concave, or scooped-out, shape, as illustrated by the blue line in Figure 5-11, A. The sharp decrease in flow immediately after peak flow is achieved indicates severe small airway compression and collapse. The flows in restrictive disease are reduced compared with normal values because the lung volumes at which flows are measured are reduced, not because airway obstruction is present (see Figure 5-11, A, red line).
Maximum Voluntary Ventilation
The MVV reflects the overall integrated function of the ventilatory apparatus, including muscle strength, endurance, airway diameter, lung compliance, and neural control mechanisms. As such, MVV is a nonspecific test. MVV varies considerably in healthy people up to 30% from the mean. Therefore, only large reductions in MVV are significant.1
In COPD, the MVV is reduced proportionally with the FEV1 and can be predicted by the following formula: MVV = FEV1 × 40.2 If measured MVV is much less than FEV1 multiplied by 40, the person is probably not exerting maximal effort.
Maximum Sustainable Ventilation
The MVV can be helpful in evaluating endurance, or the maximum sustainable ventilation (MSV). One definition of MSV is the maximum voluntary hyperventilation sustainable for 10 to 15 minutes. The ratio of MSV to MVV is relatively constant in populations with normal pulmonary function and populations with stable pulmonary disease.3 MSV is about 50% of the 15-second MVV in patients with stable COPD4 and 60% to 80% or more in healthy people.5 However, the MSV obtained under sedentary, nonstressed conditions does not reflect the true MSV in maximally exercising patients with severe COPD. The maximum ventilation attained during strenuous exercise in these patients can exceed 100% of the 15-second MVV6; this is probably because the MVV is so low in the first place. In contrast, the maximum ventilation that healthy individuals with normal pulmonary function can attain during strenuous exercise is only 55% to 65% of their MVVs.7
Tests For Small Airways Disease
Inspiratory flow is directed into millions of small airways, greatly reducing flow velocity. (See the section in Chapter 3 on the distribution of airway resistance.) For this reason, small airways less than 2 mm in diameter account for less than 20% of total airway resistance—this means a significant amount of small airway obstruction may remain undetected by conventional spirometry. The earliest pathological changes of COPD occur in small airways. Detection of these early changes is important because they are generally reversible if appropriate therapeutic and preventive actions are taken. The more complex tests sensitive to small airway obstruction include the following: frequency dependence of compliance, closing volume, and low-density gas spirometry.
Frequency Dependence of Compliance
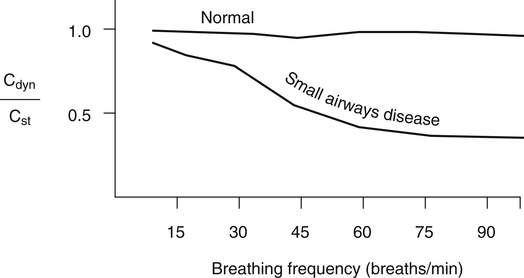
Frequency dependence of compliance is based on the principle that high breathing frequencies create high expiratory flows, which exaggerate the resistive effect of small airway obstruction, decreasing dynamic compliance. In healthy people with normal pulmonary function, dynamic and static compliance are nearly equal, even at breathing frequencies of 60 breaths per minute. The dynamic compliance in people with abnormally high small airway resistance decreases as breathing frequency increases. A reduction in dynamic compliance as respiratory rates increase to 60 breaths per minute is a sensitive marker for abnormally high small airway resistance. Frequency dependence of compliance is usually expressed as the ratio of dynamic compliance to static compliance (Cdyn/Cst) for a given tidal volume at various breathing rates. In individuals with normal pulmonary function, Cdyn/Cst is greater than 0.8 in breathing rates up to 60 breaths per minute (Figure 5-12); in patients with small airway disease, this ratio is markedly decreased, even at lower breathing rates.8
Closing Volume
The closing volume test is mentioned in Chapter 3 in the section on the distribution of inspired air. It is exactly the same test as the single breath nitrogen elimination test (the Fowler technique) for measuring anatomical dead space (see Chapter 4). This test is based on the principle that as a person inspires from RV to TLC, basal alveoli undergo greater volume changes than apical alveoli. In the closing volume test, a VC of 100% oxygen is inspired (i.e., from RV to TLC). When TLC is reached, basal nitrogen concentration is less than apical nitrogen concentration because basal units receive a greater share of the inspired 100% oxygen VC. Continuous nitrogen concentration analysis of the subsequent expiration from TLC to RV is the basis for the single breath nitrogen elimination or closing volume curve (Figure 5-13). The curve plots the percentage of nitrogen against the VC and is separated into four distinct phases: I, exhalation of nitrogen-free dead space gas; II, transition from dead space gas to alveolar gas; III, exhalation of alveolar gas; and IV, exhalation of only apical alveolar gas because of basal airway closure.
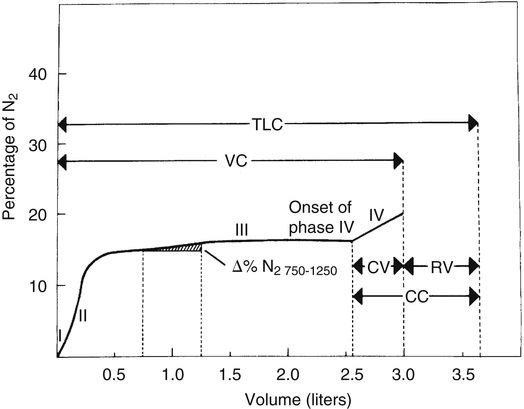
The alveolar phase is relatively flat (plateau phase) in healthy people because all alveoli empty synchronously. Even if some alveoli empty faster than others, they do so at a relatively constant ratio so that the nitrogen percentage of the exhaled alveolar gas mixture remains constant. To the extent that the emptying rates of different portions of the lung change, the slope of alveolar phase III increases. In other words, if emptying rates of basal alveoli steadily decrease while emptying rates of apical alveoli steadily increase, progressively greater portions of the exhaled gas stream become nitrogen because exhaled gas comes increasingly from the less diluted, nitrogen-rich apical alveoli. The increase in nitrogen percentage in the liter of gas expired after the first 750 mL has been exhaled (Δ% N2 750-1250) is a measure of nonuniform alveolar emptying; it is less than 1.5% in healthy adults.1
Phase IV is a dramatic illustration of nonuniform alveolar emptying. Basal alveoli abruptly cease to contribute to the expired gas stream as RV is neared because their airways suddenly close. (See the section on dynamic airway compression in Chapter 3.) The sharp increase in nitrogen percentage is evidence that all gas now originates from apical alveoli. The onset of phase IV marks the point of basal small airways closure; the volume from this point to RV is the closing volume (see Figure 5-13). The volume of gas in the lung at the onset of phase IV is the closing capacity.
People with small airways obstruction experience basal airway closure earlier in the exhaled VC, which increases the closing volume. The closing volume in healthy adults is about 10% to 20% of the VC, increasing with age. This test is sensitive to small airways disease, especially in smokers with otherwise normal spirometry.1 The closing volume cannot be determined in people who have severe obstructive disease and nonuniform distribution of ventilation. The gross variation in alveolar emptying rates creates such a steep phase III slope that it is indistinguishable from phase IV.
Low-Density Gas Spirometry (Helium-Oxygen Flow-Volume Curve)
Low-density gas spirometry involves comparing FVC flow-volume curves produced while the patient breathes room air with curves produced while breathing a mixture of 80% helium and 20% oxygen. The two curves are superimposed, as shown in Figure 5-14. The test is based on the principle that breathing a low-density gas mixture improves the flow rate for a given effort when the flow pattern is turbulent. This improvement does not occur when the flow pattern is laminar. The high flow early in the FVC is turbulent, and breathing helium and oxygen increases the flow rate for a given effort compared with air breathing (see Figure 5-14). Small airway compression greatly decreases expiratory flow velocity during the latter portion of the FVC, creating a laminar flow pattern. Because laminar flow is density independent, the helium-oxygen mixture offers no flow advantage over air breathing. The convergence of air and helium-oxygen curves marks the point at which flow changes from a turbulent to laminar pattern (see Figure 5-14). This point coincides with dynamic airway compression in small, noncartilaginous bronchioles.
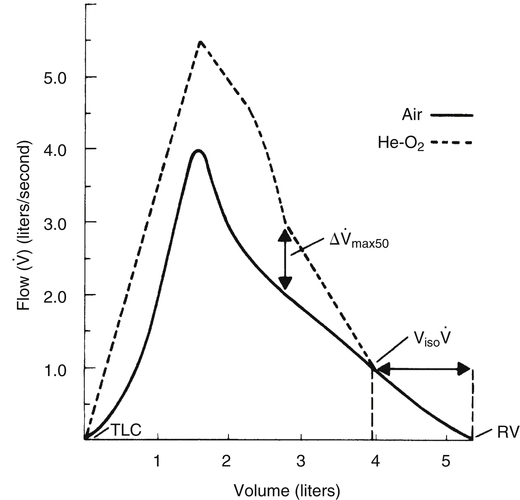

To perform the test, an F-V curve is first produced with room air (see Figure 5-14, solid line). Then a mixture of 80% helium and 20% oxygen is breathed over several minutes, after which a second F-V curve is produced (dotted line) and superimposed on the first. The volume of isoflow (Viso ) is the volume between the curves’ convergence point and the RV. In adults with normal pulmonary function, the Viso
 ranges from 10% to 20% of the FVC. If dynamic airway compression occurs earlier in the FVC, laminar flow develops earlier, increasing the Viso
 ; this indicates increased small airway resistance and premature airway collapse. The Viso
 test is more sensitive to small airway obstruction than the FEF25%-75% or FEV1.
The difference between flows in the two curves at 50% of the FVC (Δ max50) decreases in small airway obstructive disease (see Figure 5-14). In small airways obstruction, dynamic airway compression occurs earlier in the FVC, causing earlier development of laminar flow and less difference between
  max50 values. The Δ
 max50 is particularly sensitive to changes in small airways resistance.