[level-membership-for-critical-care-medicine-category]
9 Pulmonary Disorders
 Be sure to check out the supplementary content available at
 Pearls
• Acute disease of the respiratory tract is the most common cause of illness in infancy and childhood.
• Respiratory disease is frequently present in critically ill or injured children; it may be present as a primary clinical problem or as a secondary complication.
• Altered level of consciousness in an infant or child with respiratory disease is often an ominous sign of deterioration.
• Children can have adequate oxygen saturation as documented by pulse oximetry, but they may be hypoxic because of inadequate oxygen delivery.
• Airway resistance increases exponentially as airway lumen size decreases.
• Once the PaO2 falls below 60 mm Hg, even small additional decreases in PaO2 are associated with a significant fall in arterial oxygen saturation and therefore in arterial oxygen content.
Essential anatomy and physiology
Embryology of the Lung
The respiratory system begins to develop by the fourth week of gestation. A lung bud branches from the primitive esophagus and eventually forms the airways and alveolar spaces. The pulmonary arteries form near the branching airways and their growth matches the growth of the airways. Although virtually all other body systems are physiologically ready for extrauterine life by as early as 25 weeks’ gestation, the lungs require more time to mature. Thus lung maturity is the single most important factor that determines whether a premature infant can survive extrauterine life. Table 9-1 summarizes development of the respiratory system. Although the number of airway branches is fixed at birth, airway dimensions increase until the child is approximately 8 years old.202 Alveoli multiply rapidly from an estimated 20 million alveoli at birth to 200 million by 3 years of age, and the number decreases thereafter. The alveolar surface is lined with type I and type II epithelial cells that are well developed at birth.99
| Period of Gestation | Development |
| 26 days | Lower respiratory system begins to develop until separation of the respiratory tract from the foregut is achieved |
| 5 weeks | Lung buds form and begin to differentiate into the bronchi |
| 7-10 weeks | Development of the larynx |
| 5-16 weeks | Twenty-four orders of airway branches are formed |
| 13-25 weeks | Canalicular period; bronchi enlarge and lung tissue becomes highly vascular |
| 26-28 weeks | Lungs are capable of gas exchange; type II alveolar cells secrete surfactant |
| 24 weeks to birth | Capillary network proliferates around the alveoli; approximately 8%-10% of cardiac output flows through the lung; pulmonary vascular resistance is high |
Anatomy of the Chest
The thoracic cavity is formed by the ribs, intercostal muscles, and diaphragm, and it contains both lungs and the mediastinal structures. The right lung is composed of three lobes, and the left lung is composed of two lobes.49 The heart, great vessels, nerves, trachea, and esophagus are located within the mediastinum. Pleural tissue covers each lung and adheres to the surface of the diaphragm and inner surface of the chest wall.
The diaphragm is innervated on each side of the chest by the phrenic nerve, which is formed by the third, fourth, and fifth cervical spinal nerves. In older children and adults, the chest wall is relatively rigid compared with the chest wall of the neonate and infant. Therefore, when the diaphragm contracts in older patients, intrathoracic pressure falls in proportion to the movement of the diaphragm, and air moves into the lungs (Fig. 9-1).
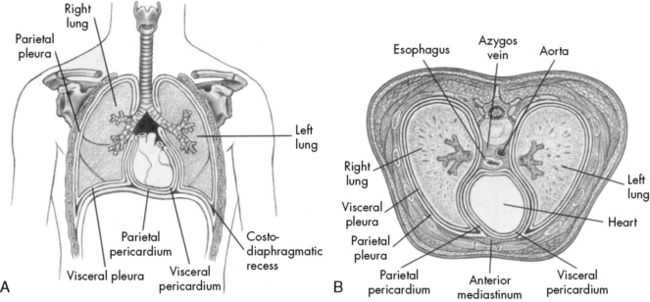
Fig. 9-1 Chest cavity and related structures. A, Anterior view. B, Cross section.
(From Thompson JM, et al: Mosby’s manual of clinical nursing, ed 2, St Louis, 1989, Mosby.)
The ribs angle downward, from back to front, so that contraction of the external intercostal muscles will elevate the rib cage. The chest wall of an infant is compliant, and the external intercostal muscles stabilize the chest wall. When respiratory disease develops, pulmonary compliance is reduced. When the diaphragm contracts and produces a decrease in intrathoracic pressure, intercostal and sternal retractions develop rather than inflation of the lungs (Fig. 9-2). The more the chest wall retracts, the less the lungs inflate.
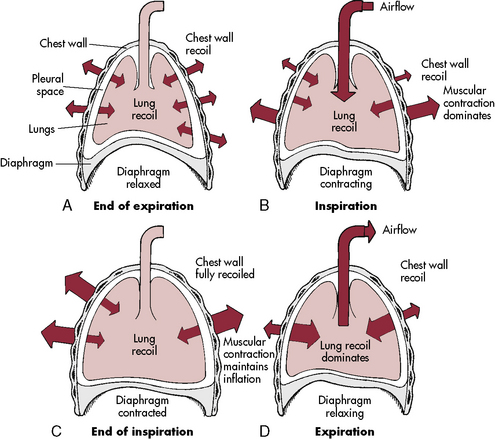
The diaphragm inserts more horizontally in infants than in older children or adults, and diaphragm contraction can contribute to subcostal retractions, particularly when the infant is supine.49 The greater the retractions present, the more the diaphragm will need to contract or shorten to generate an adequate VT. Retractions make ventilation inefficient, with the result that the diaphragm must shorten and move as much as 130% of normal to generate a VT; this increases the work of breathing and can lead to respiratory muscle fatigue.
The Upper Airway
The airways of infants and children are much smaller than the airways of adults. Resistance to air flow in any airway will increase exponentially if the airway radius is compromised (see Box 9-1 and Fig. 9-3). This means that any decrease in airway radius can significantly compromise effective gas flow or increase the work of breathing. Relatively small amounts of mucus accumulation, airway constriction, or edema can substantially reduce airway radius in the infant or child, resulting in an increase in the resistance to air flow and the work of breathing.
Box 9-1 Poiseuille’s Law
R = 8nl/πr4 when flow is laminar (substitute r5 power if flow is turbulent)
l, Length of tube; n, gas viscosity; r, radius of tube.
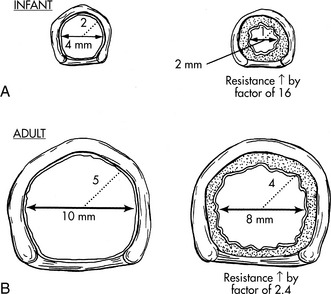
The infant upper airway is shaped like a funnel, whereas the upper airway of the older child and adult is more tubular. The glottis of an infant is located more anteriorly and more cephalad than in an older child, and the epiglottis is longer, making intubation of the trachea more difficult in the small infant, especially when the neck is hyperextended. The narrowest portion of the infant’s airway is at the level of the cricoid, whereas the narrowest portion of the airway in the adult is at the level of the vocal cords. Small amounts of edema or obstruction in the cricoid (subglottic) area will produce an increase in airway resistance and can lead to respiratory failure. Postnatally the airways increase in both length and diameter and major changes occur in the terminal respiratory units as the number and size of the alveoli increase.49,182
Compliance and Resistance
From the time of the first breath, elastic fibers in the lung tissue create a tendency for the lungs to recoil inward (away from the chest wall). This recoil tendency is balanced by the propensity of the chest wall to spring outward. The net effect of these two opposing forces is to create a subatmospheric pressure in the intrathoracic space at the end of a normal breath (Fig. 9-2). During inspiration, the volume of the thoracic cavity is increased, and intrathoracic pressure becomes more negative with respect to atmospheric pressure. As a result, air moves from the mouth to the alveolar spaces. At the end of inspiration, the elastic recoil of the lungs and chest wall cause alveolar pressure to rise above atmospheric pressure, producing expiratory flow. In a person with normal lungs, expiration is passive and requires no muscular work.92

In addition, resistance to air flow is inversely proportional to the fourth power of the airway radius (Box 9-1) when flow is laminar.110 Any reduction in the infant’s airway radius will result in exponential increases in the resistance to air flow and work of breathing (Fig. 9-3). Resistance to airflow is inversely related to the fifth power of the airway radius when air flow is turbulent (e.g., with upper airway obstruction).
Ventilation
 ) is the product of respiratory frequency and tidal volume:

The rate of removal of carbon dioxide from alveoli and the rate of oxygen delivery to the alveoli are directly related to alveolar ventilation. Normal alveolar ventilation is defined as the level of ventilation that results in normal partial pressures of oxygen and carbon dioxide in arterial blood.103
Anatomic dead space is just one part of the total dead space ventilation. A more clinically significant portion of dead space is the physiologic dead space. This space represents the volume of ventilation that reaches the alveoli that do not receive any pulmonary blood flow; therefore it is ventilation that does not participate in gas exchange. Ventilation of this portion of the lung is wasted. This concept is illustrated in Fig. 9-4. Normally, physiologic and anatomic dead space volumes are similar, but physiologic dead space can be significant in patients with pulmonary vascular disease or when positive end-expiratory pressure (PEEP) reduces pulmonary blood flow or whenever right ventricular output is reduced.
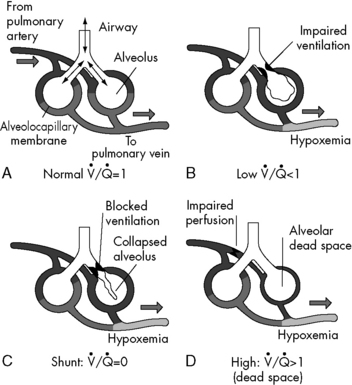
 . B and C, Lung diseases characterized by a loss of alveolar volume (e.g., acute respiratory distress syndrome) create V/Q ratios that are either low (
 )—shown in B—or zero (
 which is the definition for intrapulmonary shunt)—shown in C. Importantly, low
  alveolar units are responsive to oxygen administration (i.e., results in an increase in PaO2), whereas
  alveolar units (intrapulmonary shunt) are not responsive to oxygen administration. D, High
  units (dead space ventilation) are created under any circumstances in which pulmonary perfusion is reduced while alveolar ventilation is maintained. Thus any clinical condition that decreases right ventricular output (e.g., full cardiac arrest) or increases pulmonary vascular resistance (e.g., excessive PEEP) will result in increased dead space ventilation.
Lung Volumes
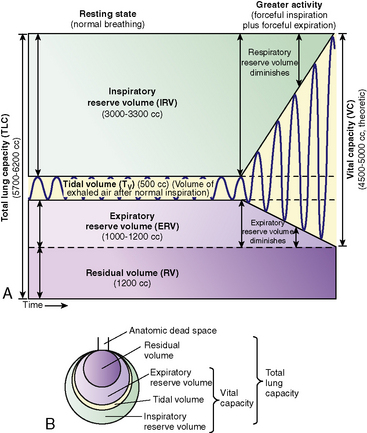
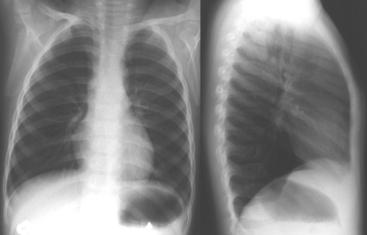
The total volume of the gas contained in the lung at maximum inspiration is the total lung capacity, Fig. 9-5. The volume that can be expired after a maximal inspiratory effort is the vital capacity (VC). This important and useful measurement of lung function is discussed in detail later in this chapter. VC can be reduced by any acute or chronic lung disease that increases lung stiffness (i.e., reduces lung compliance) or by conditions that limit available intrathoracic space (e.g., scoliosis, pneumonia, pleural effusion).
Ventilation-Perfusion Relationships
Intrapulmonary shunting exists in areas of the lung where alveolar ventilation is absent, but blood flow to the nonventilated alveoli persists (i.e., alveoli are not ventilated but are perfused, so  is 0; see Fig. 9-4, C). Intrapulmonary shunting is the cause of reduced PaO2 (hypoxemia) in diseases such as cardiogenic and noncardiogenic pulmonary edema (acute respiratory distress syndrome [ARDS]). By definition, hypoxemia associated with intrapulmonary shunting does not respond to supplementary oxygen administration, because the oxygen does not reach the nonventilated alveoli. This finding is in contrast to hypoxemia caused by partially ventilated alveoli (
 ), which do respond to administration of supplementary oxygen (i.e., the PaO2 increases). An important distinction is that alveoli that are not ventilated (i.e.,
  ) must be recruited (opened) for supplementary oxygen to improve oxygenation. With treatment, the
  ratio is converted from zero
  (shunt) to low or normal
  (i.e., to oxygen-responsive hypoxemia).
 match are the most common causes of hypoxemia in pediatric lung disorders. These physiologic or abnormal intrapulmonary shunts do not result in hypercapnia (increased PaCO2), because CO2 is highly soluble in capillary blood and rapidly diffuses into the alveoli, and it is eliminated during expiration (exhalation).
During the first days of life, neonates demonstrate both cardiac and intrapulmonary shunting of blood. The cardiovascular shunt is caused by the patent ductus arteriosus with some desaturated pulmonary arterial blood shunted through the ductus into the arterial circulation (the aorta) without passing through the lungs. This right-to-left shunt occurs because pulmonary vascular resistance is high at birth. Once pulmonary vascular resistance begins to fall, the volume of right-to-left shunt falls. In infants with a patent ductus arteriosus, a PaO2 of 60 to 80 mm Hg may be normal in the first day of life, but the PaO2 typically exceeds 80 mm Hg within 2 or 3 days after birth (Table 9-2) as pulmonary vascular resistance falls and the right-to-left shunt ceases. A small amount of right-to-left shunting can also occur in the immediate newborn period through a patent foramen ovale.
| Neonate at Birth | Child | |
| pH | 7.32-7.42 | 7.35-7.45 |
| PCO2 | 30-40 mm Hg | 35-45 mm Hg |
| HCO3 | 20-26 mEq/L | 22-28 mEq/L |
| PO2 | 60-80 mm Hg | 80-100 mm Hg |
The neonatal values represent normal values for neonates during the first days of life. Values for the child are the same as for the adult.
Gas Transport
Oxygen Tension and Oxygen Content
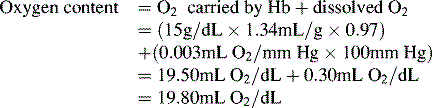
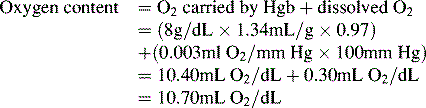
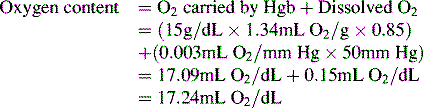
Oxygen is carried most efficiently when it is bound to hemoglobin and each gram of hemoglobin is able to carry 1.34 mL oxygen. The total oxygen content is determined by multiplying the hemoglobin (in g/dL) by 1.34 mL O2/g of saturated hemoglobin and then multiplying that number by the actual hemoglobin saturation. The small amount of oxygen carried in the dissolved form is then added to the amount of O2 carried by hemoglobin. The normal arterial O2 content is approximately 18 to 20 mL O2 per dL blood (Box 9-2).271


To emphasize the difference between PaO2 and arterial O2 content, consider the effects of varying hemoglobin concentration in three patients. If the patients all breathe room air, as noted previously, the PaO2 of all patients will equal approximately 110 mm Hg, regardless of hemoglobin concentration. If the three patients have normal lungs, their hemoglobin will be fully saturated (99%), so their total arterial oxygen content will differ according to their hemoglobin concentration. If the first patient has no hemoglobin at all (concentration of 0 g/dL), the patient’s PaO2 is still 110 mm Hg, but the patient’s arterial oxygen content is 0.33 mL/dL (equal to the amount of dissolved oxygen, or 0.003 × PaO2). This example is not realistic, but it makes the point that the PaO2 is not the same as O2 content. Consider a second patient with a hemoglobin concentration of 8 g/dL; the second patient’s PaO2 is 110 mm Hg, with a total arterial oxygen content of approximately 11 mL O2 per dL blood (slightly more than half normal). The third patient has a hemoglobin concentration of 15 g/dL; this patient’s PaO2 is 110 mm Hg, and the patient’s arterial oxygen content is approximately 20 mL O2 per dL blood (normal). Although all three patients have exactly the same PaO2 and oxygen saturation, the second patient must almost double cardiac output to maintain the same oxygen delivery as the third patient (DO2 = CO × CaO2). These examples illustrate the importance of evaluating hemoglobin concentration, PaO2, and arterial oxygen saturation when interpreting blood gas results. Additional patient examples are included in Box 9-3.
The Oxyhemoglobin Dissociation Curve
The relationship between the PaO2 and the hemoglobin saturation is expressed by the oxyhemoglobin dissociation curve, as shown in Fig. 9-6, with the PaO2 on the horizontal axis and the hemoglobin saturation on the vertical axis. The curve is not linear but S-shaped, with a large plateau at the higher levels of PaO2. There are several important things to note about the oxyhemoglobin dissociation curve. As noted, the curve flattens when the PaO2 exceeds 80 to 100 mm Hg; this means that although the PaO2 continues to rise beyond 100 mm Hg, the hemoglobin cannot become more saturated than 100%, and it cannot carry any more oxygen. Any additional rise in the PaO2 will result only in increases in the amount of dissolved oxygen in the blood, which contributes only 0.003 mL O2 per mm Hg rise in PaO2. Therefore a rise in PaO2 from 100 to 700 torr does not mean that sevenfold more oxygen is carried in the blood; it is associated with an approximately 10% increase in oxygen content. Because the hemoglobin is fully saturated once the PaO2 reaches 100 mm Hg, there is usually no advantage to maintaining the patient’s PaO2 any higher than this value.
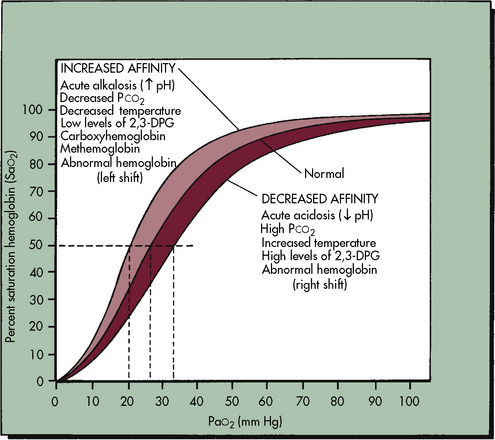
As shown in Fig. 9-6, the slope of the oxyhemoglobin dissociation curve becomes extremely steep once the PaO2 is less than 60 mm Hg. Thus when the patient’s PaO2 falls below 60 mm Hg, even small additional decreases in the PaO2 will be associated with a significant fall in the hemoglobin saturation and arterial oxygen content. Therefore the patient’s PaO2 should be maintained above 60 mm Hg, if possible.
The position of the oxyhemoglobin curve can be altered by several factors (Table 9-3). If the curve is shifted to the right, then hemoglobin has less affinity for oxygen (it is less well saturated) at any partial pressure of oxygen (PaO2). Conversely, if the curve is shifted to the left, then hemoglobin has a higher affinity for oxygen (the hemoglobin is better saturated) at any given PaO2.
| Shift to Left (Higher oxygen affinity) | Shift to Right (Lower oxygen affinity) |
| Alkalosis | Acidosis |
| Hypocapnia | Hypercapnia |
| Hypothermia | Hyperthermia |
| Fetal hemoglobin (decreased 2,3 DPG) | Increased 2,3 DPG |
| Methemoglobinemia | Adult hemoglobin |
Factors that shift the curve to the right include acidosis, hypercapnia, and hyperthermia. Under these conditions the oxyhemoglobin saturation and oxygen content is lower at any given PaO2, but within the normal range the amount of oxygen released to tissues is enhanced, which is an adaptive response that makes oxygen more available in the tissue beds of patients who are likely to need it (e.g., those who are acidotic, hypercapnic, febrile).271 Factors that shift the oxyhemoglobin dissociation curve to the left include alkalosis, hypocapnia, and hypothermia. Although these factors increase oxyhemoglobin saturation at any given PaO2, oxygen will not be as readily released to the tissues,271 because oxygen is more tightly bound to the hemoglobin molecule.
Regulation of Carbon Dioxide Tension and Hydrogen Ion Concentration

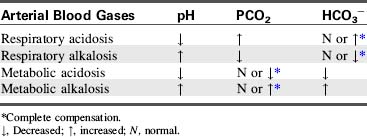
The net result of these reactions is a rise in hydrogen ion concentration and a fall in pH, or respiratory acidosis. If this condition persists for several hours, the kidney will respond with the excretion of more hydrogen ions and reabsorption of more bicarbonate. Renal compensation can restore the arterial pH to nearly normal levels (see discussion of renal disorders in Chapter 13).
Alveolar ventilation will decrease when metabolic alkalosis is present. Carbon dioxide may be retained until the PaCO2 is extremely high. Carbon dioxide will combine with water to form carbonic acid, which will dissociate to form hydrogen ions and bicarbonate ions. Hydrogen ions accumulate and the arterial pH decreases. An example of this compensation is a patient who develops hypokalemic, hypochloremic metabolic alkalosis and slows respirations; the PaCO2 rises and the pH falls toward normal. Table 9-4 summarizes changes in the arterial pH, PaCO2, and serum bicarbonate (HCO3−) that occur with respiratory and metabolic acidosis and alkalosis.
Common clinical conditions
Upper Airway Obstruction
The upper airway is composed of many structures, including the nose pharynx, larynx, and trachea. The functions of the upper airway are to warm, filter, and humidify inspired gases before they reach the trachea.92
Etiology
Upper airway obstruction can occur anywhere in the extrathoracic areas. There are several developmental factors that increase the risk of upper airway obstruction in infants and young children. The larynx of the infant or child is more anterior and cephalad than the larynx of the adult. As a result, the sniffing position optimizes the airway opening during bag-mask ventilation or intubation of the infant or young child. Extreme extension of the neck can lead to obstruction of the airway.243
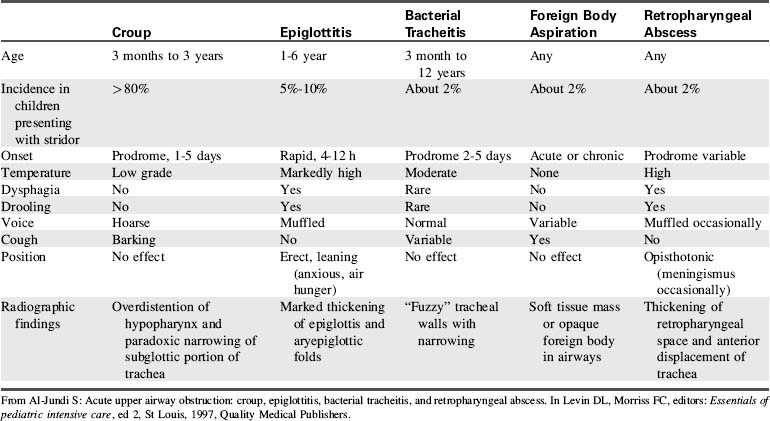
Upper airway obstruction in infants and children may be caused by conditions such as congenital or acquired anatomic abnormalities, acute infectious processes, or compression from other organ systems (Table 9-5). Additional potential causes of upper airway obstruction are listed as follows:
1. Recent history of airway manipulation (e.g., intubation, bronchoscopy, airway surgery)
2. Mucus plugging of an artificial airway (e.g., endotracheal tube or tracheostomy tube)
3. Mechanical obstruction from a foreign body aspiration, with secondary laryngospasm that may result in further airway obstruction
4. Infections associated with acute inflammation and swelling of the upper airway (e.g., croup, epiglottitis, retropharyngeal abscess, peritonsillar abscess)
5. Recent history of general anesthesia or sedation, leading to decreased upper airway tone and collapse of upper airway or tongue falling to back of throat
6. Trauma or congenital malformations of the head or neck (e.g., choanal stenosis)
7. Any disease that results in excessive mucus production such as asthma or cystic fibrosis
10. Rapid-eye-movement sleep with decreased pharyngeal muscle tone.
Management
Treatment includes administration of warmed, humidified oxygen by face mask, hood, tent, or blow-by tubing. Minimize noxious stimulation, because agitation can worsen airway obstruction. Inhaled racemic epinephrine is an accepted treatment for upper airway obstruction related to moderate-to-severe croup or postextubation edema. The mechanism of action is thought to be related to α-adrenergic constriction of precapillary arterioles, with resulting fluid reabsorption from the interstitial space and decreased laryngeal mucosal edema. These effects increase airway diameter and ease of gas flow. Doses may be given as often as every 20 minutes. Inhaled l-epinephrine is as effective as racemic epinephrine. These inhaled agents are to be used with caution in patients with tachycardia, arrhythmias, or underlying congenital heart disease, because the agents can potentiate tachycardia.201
Inhalation treatment with a helium-oxygen mixture (heliox) provides a lower density gas compared with a nitrogen and oxygen mixture. Helium is an odorless, tasteless inert gas that can be substituted for nitrogen in inhaled gaseous mixtures.94,167 The benefit of providing inhaled gas with a lower density is that it promotes laminar flow within the upper and lower airways. Laminar gas flow promotes the delivery of oxygen and inhaled medications through the areas of obstruction and facilitates drug deposition (Fig. 9-7). Effects of the helium and oxygen mixture are noted almost immediately; if it is effective, then the patient’s work of breathing decreases and aeration improves. If the child is verbal, gas delivery is confirmed if the child speaks in a high-pitched voice. A higher pitched cry may be noted during therapy in preverbal infants.
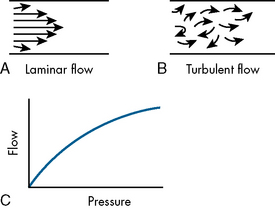
Administration of heliox during mechanical ventilation necessitates close monitoring of the child and the circuit, because the helium may interfere with the pneumotachometers and ventilator function. Because heliox improves flow through areas of airway obstruction, it can be used to treat disease processes that produce turbulent flow (e.g., asthma). It is often used until therapeutic medications take effect, or it can be used until resolution of the disease process.94 Most institutions develop specific protocols for management of acute, life-threatening upper airway obstruction to support efficient care (Box 9-4).6
Box 9-4 Sample Protocol for Management of Epiglottitis
I. Once the diagnosis of epiglottitis is suspected, follow these steps without exception:
II. Once the airway team has arrived, perform the following:
Modified from Al-Sundi S: Acute upper airway obstruction: croup, epiglottitis, bacterial tracheitis, and retropharyngeal abrasions. In Levin D, Morriss F, editors: Essentials of pediatric intensive care, New York, 1997, Churchill Livingstone.
Lower Airway Obstruction
Etiology
Obstruction in the lower airways can result from airway plugging caused by inflammation with mucosal edema and increased production of thick secretions, or it can result from hyperreactivity of the bronchial smooth muscle that leads to bronchospasm. Some lower airway obstruction results from both causes. Although asthma is the most common cause of lower airways disease and obstruction in pediatric patients, the obstruction can result from other causes, including infections and chronic lung disease.92
Pathophysiology
Airflow obstruction results from decreased airway caliber, which causes increased resistance to the flow of both inspired and expired gas. However, exhalation is predominantly affected. Mucus plugging within the small airways results in air trapping and hyperinflation of the lungs, causing the diaphragm to be flattened instead of a typical dome shape at rest92 (Fig. 9-8).
Management
A variety of pharmacologic agents is available for management of lower airways obstruction. These medications will be discussed in more detail in the sections on status asthmaticus and bronchiolitis. In addition to pharmacologic agents, heliox can be used to manage lower airway obstruction. Refer to additional information on heliox in the Upper Airway Obstruction section. Heliox may have additional therapeutic effects, because it may attenuate lung inflammation and reduce mechanical and oxidative stress in the management of acute lung injury.169 Assisted ventilation, either noninvasive or invasive, is needed in some patients (see section, Status Asthmaticus later in this chapter).
Apnea
Apnea is a common problem in premature infants, and the incidence is inversely related to gestational age. Apnea must not be confused with normal neonatal periodic breathing. Apnea is generally defined as lack of airflow for 20 seconds or longer. Lack of airflow over shorter periods of time is labeled apnea if it is associated with significant bradycardia or cyanosis.224 More than half of infants younger than 32 weeks postconceptual age will demonstrate some degree of apnea.224 Apnea in a term infant is never a normal finding and needs further investigation.
Etiology
The etiology of apnea in the preterm infant may be multifactorial, with delayed maturation of cardiorespiratory control a likely factor. Infants and children with apnea must be evaluated for a variety of abnormalities (Box 9-5). Apnea in older children may be chronic, as when related to an underlying neurologic condition (e.g., brain tumor, hydrocephalus), or it may be acute as in conditions such as toxic ingestions or traumatic brain injury.
Box 9-5 Etiology of Apnea
Central apnea
• Infection—particularly respiratory syncytial virus (RSV)
• Hypoxia with decreased cardiac output
• Central nervous system pathology, brainstem injuries (infection, stroke, tumor, trauma including inflicted trauma)
• Metabolic disorder—disorders of fatty acid oxidation
• Pharmacologic side effects—especially anesthetics, narcotics
Management
In obstructive sleep apnea (OSA), management focuses on relieving the obstruction. Polysomnography can be used to quantify the respiratory distress index and document the severity of OSA. Surgical management (i.e., tonsillectomy, adenoidectomy, or both) is often needed for moderate to severe OSA. Nonsurgical management includes positive pressure ventilation, using either CPAP or bilevel positive airway pressure. Patients with severe obstruction may not achieve cure with surgical intervention alone and may need noninvasive positive pressure support after surgical intervention. Commonly, obese children with OSA will achieve improvement in their respiratory distress index and quality of life postoperatively, but OSA does not resolve completely in the majority. In these cases, chronic noninvasive ventilation support may be needed.160
Hypoventilation
Hypoventilation is a result of decreased respiratory effort. It leads to decreased renewal of alveolar gas, so the PaCO2 rises and the PaO2 falls.79
Etiology
True hypoventilation is uncommon. When it occurs, it is most likely to result from central nervous system dysfunction.79 The condition can be challenging to detect unless the patient is already being monitored or the condition is associated with additional clinical findings such as upper airway obstruction. The differential diagnosis for hypoventilation includes central nervous system injury, use of narcotic or anesthetic agents, neuromuscular disorders, infant botulism, and congenital central hypoventilation syndrome (Ondine’s curse).
Head trauma—especially when it is associated with ischemia, an intracranial mass, or infection—can decrease the brainstem response to chemoreceptor stimulation (i.e., hypercarbia or hypoxia). Pharmacologic agents and metabolic toxins can lead to similar clinical findings. In particular, opioid medications decrease the respiratory drive, leading to hypoventilation. This effect may be desirable when using this class of medication to facilitate mechanical ventilation, but it may be a hindrance when working toward extubation or when opioids are administered to children who are not intubated.80
Clinical Manifestations
When hypoventilation is present, the rise in PaCO2 approximately equals the fall in PaO2, so oxyhemoglobin saturation (via pulse oximetry) will fall. Hypercarbia secondary to hypoventilation often produces nonspecific findings. If hypercarbia is severe, somnolence may be noted. Mild hypercapnia is often not associated with any clinical findings, so it is difficult to diagnose in the absence of other findings. Children with reduced respiratory effort associated with hypercarbia and hypoxemia need central nervous system evaluation.80
Airways Malacias
The term malacia is derived from a Greek word that means softness. Malacia is generally used to describe a weak or insufficiently rigid (i.e., supporting cartilage is insufficiently rigid) portion of the airway that collapses during respiration. The distal third of the trachea is most commonly affected, although any portion of the airway can be involved.65,152
The incidence of tracheomalacia is unknown. Although uncommon, it is the most frequent cause of stridor in infants and children. Most children have mild or moderate symptoms that improve with time, as the cartilage becomes more firm. An increased incidence has been described in premature infants.267
Etiology
Malacia can be primary or secondary. Primary tracheomalacia occurs when the trachea is unusually collapsible from incomplete hardening of the tracheal cartilage. Secondary malacia occurs in association with conditions that compress the trachea (Table 9-6).
| Primary | Secondary |
| Congenital absence of tracheal cartilage | Esophageal atresia and tracheoesophageal fistula |
| Vascular rings | |
| Tracheal compression from an innominate artery | |
| Tetralogy of Fallot with absent pulmonary valve | |
| Compression from mediastinal mass | |
| Connective tissue disease disorder | |
| Prolonged mechanical ventilation |
Adapted from McNamara VM, Crabbe DCG: Traceomalacia, Paediatric Resp Rev 5:147, 2004.
Pathophysiology
Collapse of the extrathoracic airway (e.g., trachea) during inspiration causes narrowing of the airway lumen, resulting in inspiratory airflow obstruction. This effect can lead to severe respiratory distress and is exaggerated by increased respiratory effort or agitation, particularly during feeding, crying, and coughing, or by the presence of an intercurrent illness.65,152
Management
Symptoms may be alleviated by positioning. Prone positioning will allow gravity to contribute to enlarging or opening of the airway lumen. Conversely, supine positioning can lead to decreased airway lumen diameter and airway collapse.65 Positioning with the head of the bed elevated may prevent episodes of gastroesophageal reflux, decreasing the risk for gastric contents irritating airways and further compromising airway diameter. Irritating an already collapsing airway can exacerbate symptoms. In addition, proton pump inhibitors, histamine blockers, and prokinetic agents are used often to reduce the effects of gastroesophageal reflux.267
Fortunately most cases of malacia are mild. In cases of moderate to severe malacia, conservative measures may not be adequate. Parents should be taught basic life support techniques. These children may also need cardiorespiratory monitoring, oxygen, and noninvasive PPV in the home.152
Surgical options for severe tracheomalacia include aortopexy and segmental tracheal resection. The goal of aortopexy is to suspend the aorta in a ventral position to prevent tracheal collapse. Through either a thoracotomy or median sternotomy, the aortic root is exposed and the thymus is resected or retracted.267 Sutures are placed in the pericardial tissue over the aortic root and in the adventitia of the aortic arch and are tied to the underside of the sternum. As the aorta is pulled forward (i.e., toward the sternum), the front wall of the trachea is also pulled forward by fibrous attachments between the aorta and trachea. Intraoperative bronchoscopy can be used to visualize the trachea and to ensure adequate suspension and reduction of the tracheal compression.152,267 There are few complications associated with aortopexy surgery. Recurrence (incidence is approximately 10% to 25%) may necessitate additional surgery in some patients. Other less common complications include phrenic nerve palsy, pneumonia, chylopericardium, and wound infections.267
If aortopexy does not successfully improve the diameter of the tracheal lumen, another option is to resect the region of malacia. This procedure may cure the malacia, but candidacy for it can be limited by the length of the segment involved, because long segments of malacia cannot be resected.152
Additional treatment strategies include placing indwelling endotracheal or endobronchial stents to stabilize the collapsing airway. Expandable metallic airway stents have been used in adults since the 1980s to palliate airway strictures caused by malignancy. Expandable metallic coronary artery stents have been used in children, although experience is limited. In the short term, stents are highly effective in treating malacia. However, because indwelling airway stents do not epithelialize in the same way as endovascular stents, airway stents promote formation of granulation tissue that can contribute to recurrent airway obstruction and bleeding. There is also a risk that the stent may erode into neighboring vessels, causing catastrophic hemorrhage. Newer biodegradable stents are under development.152
Vocal Cord Paralysis
Vocal cord paralysis is the absence of movement of the cords owing to motor nerve dysfunction in the larynx. The paralysis can be unilateral or bilateral. In cases of bilateral paralysis, most cases are abductor palsies, with the cords in close apposition to each other. The cords may not move at all (paralysis), or they may have decreased or abnormal movement (paresis). Although vocal cord paralysis is uncommon, this condition is the second leading cause of stridor in infancy.58
Etiology
Vocal cord paralysis may be idiopathic, or it may be associated with surgical procedures or related to a neurologic disorder, birth trauma, or brachial plexus injury. Cardiac procedures such as ligation of a patent ductus arteriosus or manipulation or repair of the aortic arch have been associated with vocal cord dysfunction. The recurrent laryngeal nerve loops around the aortic arch on the left and the subclavian artery on the right before it travels superiorly and enters the larynx. Surgery near these areas can result in manipulation of the nerve, producing vocal cord dysfunction.250
Neurologic conditions associated with vocal cord paralysis include midbrain/brainstem dysgenesis, Arnold-Chiari malformation, congenital hydrocephalus, neurofibromatosis, and global hypotonia.58,162 Neurosurgical procedures near the brainstem also can result in vocal cord paralysis.
Clinical Manifestations
Common clinical signs and symptoms include stridor, weak cry or voice, hoarseness, and swallowing dysfunction. In cases of bilateral paresis or paralysis, the stridor is more severe; in fact, children with bilateral paresis will have more significant clinical findings in general.58 Swallowing dysfunction associated with vocal cord paralysis can lead to aspiration of saliva or food, placing the child at risk for aspiration pneumonitis.250
The diagnosis of vocal cord paralysis can be established using either direct bronchoscopy in the operating room or through dynamic assessment of the larynx using flexible fiberoptic laryngoscopy (generally performed at the bedside) to evaluate the motion of the vocal cords. Ultrasonography of the larynx is a useful adjunctive diagnostic technique.58 The condition is confirmed when the there is no motion or abnormal motion of one or both of the vocal cords.250
Management
Some children will need only thickened foods and positioning with the head of the bed elevated during feeding. In addition, they will need close observation for signs of aspiration. Other children will need alternative enteral nutrition delivery (e.g., gastric tube) to bypass the paretic area. Speech therapy evaluation is crucial to determine the safest method for feeding.250 Rarely, a tracheostomy is needed to relieve airway obstruction associated with vocal cord paresis and to protect the lungs from soiling.127
For children with unilateral vocal cord paresis, surgical intervention is an option, using a CO2 laser to bring the paralyzed cord into a more medial position (i.e., medialization); this facilitates adduction of the paretic cord with the functional cord. Another method of medialization of the paralyzed vocal cord is to inject it with silicone elastomers. Injection with Teflon (DuPont, Wilmington, DE) is no longer used because it has been associated with granuloma development.69
Respiratory Failure
Etiology
Respiratory failure is defined as exchange of O2 and CO2 that is insufficient to meet the metabolic demands of the body; this results in hypoxemia, hypercarbia, or both. Virtually any critically ill or injured child is at risk for respiratory failure. Respiratory failure results from hypoventilation, ventilation or perfusion ( ) mismatch, diffusion abnormalities, and intrapulmonary shunting.9,82,243
Pathophysiology
Respiratory failure can be caused by failure of any component of the respiratory system, including central nervous system control of ventilation, airways, the chest wall, respiratory muscles, or lung tissue including the alveolar-capillary membrane (Box 9-6).
Box 9-6 Major Components of the Respiratory System and Potential Contribution to Respiratory Failure
• Brain or central nervous system control of breathing


 Extremely compliant in young children, so it may collapse during episodes of respiratory distress, resulting in further compromise in efficiency of respiratory function
 If any respiratory muscles lack tone, power, or coordination, the upper or lower airway patency may be compromised, reducing inspiratory effort.


• Alveolar-pulmonary capillary interface (diffusion surface)


Respiratory failure and hypoxemia result from: hypoventilation, low  (O2 responsive),
  (shunt, not O2 responsive), diffusion disturbances, decreased PaO2 (decreased SaO2), and high altitude.9
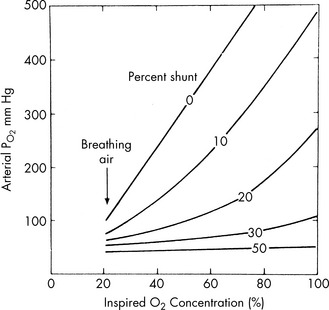
The diagnosis of respiratory failure is based on both clinical and physiologic criteria. For example, oxygen criteria alone can be misleading in a child with cyanotic heart disease who is hypoxemic while breathing room air (i.e., intracardiac shunt). Physiologic criteria include hypoxemia while breathing room air and hypercarbia with acidosis. Oxygen therapy may result in a normalization of the PaO2 in a patient with respiratory failure.260 The response to oxygen in a patient with lung disease is determined by the percent of alveoli represented by intrapulmonary shunting. If greater than 40% of the lung units are involved in the shunt, positive pressure ventilation and lung recruitment will be needed before oxygen therapy will increase the PaO2.
Respiratory failure may be present despite oxygen therapy. Hypoxemia can result in inadequate tissue oxygenation and development of lactic acidosis. Cardiac output and pulmonary blood flow increase initially in response to hypoxemia. In addition, the hemoglobin affinity for oxygen is decreased (the oxyhemoglobin dissociation curve shifts to the right; see Fig. 9-6) so that oxygen is released more easily to the tissues.64 These compensatory mechanisms will help maintain adequate oxygen delivery. With progressive hypoxemia, cardiac output falls and alveolar hypoxia may produce inadequate oxygen delivery.
Clinical Signs and Symptoms of Respiratory Failure
The clinical and physiologic indicators of respiratory failure in children are listed in Box 9-7. These indicators include hypoxemia despite oxygen therapy and hypercarbia with acidosis. The child’s baseline oxygenation and respiratory function must also be considered (Box 9-8).
Box 9-7 Clinical and Physiologic Indicators of Respiratory Failure
• Depressed level of consciousness
• Increased respiratory rate and effort, including retractions or grunting, decreased chest wall movement
• Absent or significantly decreased breath sounds
• Cardiovascular signs of distress, including tachycardia, peripheral vasoconstriction, mottled color, and pulsus paradoxus
• Signs of diaphragm muscle fatigue:


• Late signs: apnea or gasping, agonal respirations, bradycardia, or hypotension
• Cyanosis and hypoxemia despite supplementary oxygen therapy (e.g., PaO2 < 75 mm Hg despite FiO2 of 1.00)*
• Hypercarbia (PaCO2 > 50-75 mm Hg)†, especially with acute acidosis
• Rising alveolar-arterial oxygen difference (normal, < 25 mm Hg) or decreasing PaO2/FiO2 ratio
Respiratory failure in the child with chronic lung disease
Respiratory failure in the child with neuromuscular disease
• Decreased respiratory effort
• Weak cough, incompetent swallow or gag
• Use of accessory muscles of respiration
• Decreased inspiratory force: cannot generate force more negative than − 20 cm H2O (normal is at least − 60 to − 100 cm H2O, and forceful cough is thought to require at least − 25 cm H2O)


where R = Respiratory exchange quotient, which can be estimated as 1.
Note: If not at sea level, substitute barometric pressure for 760.
The A-a DO2 is the difference between the calculated PAO2 and the PaO2 and is calculated as follows:

where normal is < 25 to 50 mm Hg.
The difference between PiO2 and the child’s arterial oxygen tension increases when perfusion of nonventilated alveoli occurs; this is called an intrapulmonary shunt. The severity of intrapulmonary shunting is estimated using a shunt graph (Fig. 9-9). The PaO2/FiO2 (P/F) ratio is more commonly used in clinical practice to estimate the degree of intrapulmonary shunting (e.g., P/F <200 is consistent with ARDS).
Management
Pulse Oximetry
Pulse oximetry allows continuous evaluation of oxyhemoglobin saturation (SaO2). To estimate the child’s PaO2 from the SaO2, consult an illustration of the oxyhemoglobin dissociation curve (see Fig. 9-6). The pulse oximeter uses a photodetector with light-emitting diodes. The photodetector is placed across a pulsatile tissue bed from the diodes. The diodes emit a red light and an infrared light through tissue containing both venous and arterial blood, and a photodetector captures the red and infrared light on the other side of the tissue bed. Oxygenated hemoglobin absorbs little red light, but a large amount of infrared light. A microprocessor determines the difference between the absorption of the red and infrared light and can determine the percentage of the total normal hemoglobin that is oxygenated in the tissue.206 The pulse oximeter also displays the strength of the pulse and a digital pulse rate.
In addition to light and motion artifact, accuracy of pulse oximetry is limited when tissue perfusion is poor, and it is limited by hemoglobinopathies and by dyes or pigments in the blood and hemoglobin. Poor tissue perfusion decreases the pulsatile flow needed for the detectors and for the calculation. Pulse oximeters calculate only O2 saturation in normal hemoglobin, so they do not recognize carboxyhemoglobin or methemoglobin. As a result, the oxyhemoglobin saturation displayed by the monitor will overestimate total hemoglobin saturation in patients with these conditions, because it will reflect only the percent of normal hemoglobin that is saturated with oxygen and does not reflect the abnormal hemoglobin compounds. For example, if a child has 15% carboxyhemoglobin, the child’s maximum possible oxyhemoglobin saturation is 85%. If the pulse oximeter displays an SaO2 of 90%, the child’s actual oxyhemoglobin saturation is probably 90% of the 85% of hemoglobin that is not bound to carbon monoxide, for an actual saturation of 76% (i.e., 0.85 × 0.9 = 76.5%). If carbon monoxide poisoning or methemoglobinemia are suspected or confirmed, the hemoglobin saturation must be measured by cooximetry in the blood gas laboratory.206
Pulse oximeters are generally accurate over a wide range of hemoglobin saturations, although most have a lower limit or threshold hemoglobin concentration below which they are no longer accurate. In addition, clinicians must be aware that a child with severe anemia can have extremely low arterial oxygen content despite a normal oxyhemoglobin saturation, because oxygen-carrying capacity is reduced. In the child with severe anemia, oxygen delivery will fall unless cardiac output increases (see Box 9-2).
Oxygen Administration
Venturi masks are designed to provide more predictable oxygen concentrations, and they are particularly effective at delivering inspired O2 concentrations between 24% and 50%. The Venturi mask differs from the conventional mask in that it can successfully deliver specific inspired O2 concentrations, because its total liter flow usually exceeds the patient’s inspiratory flow. Therefore all inspired gas contains the same, premeasured O2 concentration (FiO2), and no ambient air is entrained. Table 9-7 summarizes the advantages and disadvantages of various oxygen delivery systems (see Chapter 21).
Table 9-7 Advantages and Disadvantages of Typical Oxygen Delivery Systems
| System | Advantages | Disadvantages |
| Oxygen masks | Many sizes available | Skin irritation |
| Provides predictable concentration of oxygen (with Venturi mask) whether child breathes through nose or mouth | Fear of suffocation | |
| Accumulation of moisture on face | ||
| Possible aspiration of vomitus | ||
| Difficulty controlling inspired oxygen concentrations | ||
| Nasal cannula | Provides constant oxygen flow even while the child eats and talks | May be uncomfortable or irritating |
| Enables more complete observation of child because nose and mouth remain unobstructed | May causing abdominal distension and discomfort or vomiting | |
| Difficult to control inspired oxygen concentration if child breathes through mouth | ||
| Inability to provide mist if desired | ||
| Oxygen hood | Provides high concentrations of oxygen (FiO2 up to 1.00) | High humidity environment |
| Enables ready access to patient’s chest for assessment | Need to remove patient for feeding and care |
Use of Oral or Nasal Airways
Oropharyngeal airways may prevent occlusion of the pharynx by the tongue of an unconscious patient; they cannot be inserted in a conscious child because they may stimulate vomiting.194 Occasionally an oral airway is maintained in the obtunded child with an oral endotracheal tube in place to prevent biting on the tube, but a bite block is more appropriate for this purpose.
The size of the oropharyngeal airway is evaluated before insertion by placing the airway on the outside of the child’s cheek, with the bite block segment at the lips. The end of the airway should reach the angle of the jaw so that it will reach to the level of the central incisors.43 Using a tongue blade may be helpful to depress the tongue during insertion.194 Do not force the airway into the patient, because it can push the tongue back into the pharynx and obstruct the airway.
Nasopharyngeal airways are soft rubber or plastic tubes that provide a conduit for air flow from the nares to the posterior pharyngeal wall and for suctioning of the posterior pharynx.194 These airways can be used in conscious or unconscious children, and they will maintain airway patency and provide a channel for suctioning the pharynx.
The diameter of the nasopharyngeal airway is sized by comparing the inner circumference of the nare to the outer circumference of the nasopharyngeal airway to be used. The length of the nasopharyngeal airway is equivalent to the distance from the tip of the nose to the tragus of the ear.194 Lubricate the airway with a water-soluble lubricant before insertion, and do not force it into place if resistance is encountered. If any blanching of the nare is noted after placement, the diameter of the nasopharyngeal airway is too big and a smaller airway is needed. Small or extremely soft airways can become obstructed by mucus, vomitus, or soft tissues, so the airway must be suctioned frequently and its effectiveness needs to be evaluated repeatedly.194
Bag-Mask Ventilation
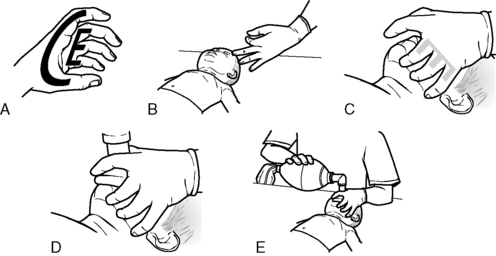
To provide effective bag-mask ventilation, use a self-inflating bag and select a mask to fit properly over the child’s nose and mouth. Extend the child’s neck slightly, unless cervical spinal injury is suspected in a trauma victim, and lift the jaw. Create a seal between the patient’s face and the mask by grasping the mask between the thumb and index fingers of the nondominant hand while lifting the child’s lower jaw against the mask using the third, fourth, and fifth fingers; this creates the E-C clamp depicted in Fig. 9-10.
(Developed by the New York City EMS project and NYC*EMS! Adapted from the Center for Pediatric Emergency Medicine: Teaching resource for instructors in prehospital pediatrics, ed 2. Available at http://cpem.med.nyu.edu/teaching-materials/tripp-bls. (Modified from Foltin GL, et al: Teaching resource for instructors in prehospital pediatrics, New York, 1998, Center for Pediatric Emergency Medicine, Maternal Child Health Bureau, Emergency Medical Services for Children Grant.)
Intubation
The decision to intubate is primarily a clinical decision, based on assessment of gas exchange and respiratory effort. Indications for intubation in the critically ill child include respiratory arrest or apnea, inability to maintain an effective airway (as a result of a depressed level of consciousness), obstructed airway, or edema with stridor, and/or severe hypoxemia or progressive hypercarbia. Intubation will be needed for the child who has multisystem failure or increased intracranial pressure (Box 9-9).
Box 9-9 Indications for Intubation and Mechanical Ventilation
• Respiratory arrest, gasping, or agonal respirations
• Upper airway obstruction (anatomic or functional) or potential obstruction (e.g., facial trauma, inhalation injuries)
• Actual or potential decrease in airway protective reflexes (i.e., cough, gag)
• Shock (especially septic shock)
• Anticipated need for mechanical ventilation support (e.g., impending acute respiratory failure, chest trauma, shock, increased intracranial pressure, neuromuscular disease)
• Hypoxemia despite supplementary oxygen (PaO2 < 60 mm Hg with FiO2 > 0.6) in the absence of cyanotic congenital heart disease
• Inadequate ventilation (PaCO2 > 60 mm Hg acutely or unresponsive to other interventions)
• Need for airway and ventilation control for deep sedation or patient transport
• Emergency drug administration
• Glasgow Coma Scale score less than 8 (see Chapter 11, Table 11-6)
Selection of Tube Type
In the past, all children 8 years of age and younger were intubated with uncuffed endotracheal tubes, because the cricoid cartilage (the narrowest point of the airway) creates a natural seal around the tube. There was concern that use of a cuffed tube could create inflammation and injury to this area, although it is now clear that both cuffed and uncuffed tubes may be used safely in children, provided cuff pressure is monitored and kept at 20 to 25 cm H2O. The use of cuffed ETTs may be preferred over uncuffed tubes in children with decreased lung compliance or in those who have a large air leak when an uncuffed tube is used. When using cuffed endotracheal tubes, the cuff must be a low-pressure, high-volume cuff to reduce the risk of pressure injury to the tissues. Monitor and maintain cuff pressure at 20 to 25 cm H2O pressure (or per manufacturer’s specifications).122a,171
Selection of Tube Size
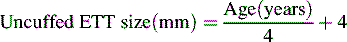
When the child is critically ill and is at risk for respiratory failure, intubation equipment should be readily available in a cart at the bedside. Proper ETT size is estimated most accurately from the child’s length, and the use of the color-coded Broselow Resuscitation Tape (Vital Signs, Armstrong Medical, Lincolnshire, IL) facilitates determination of proper tube size.139 If the tape is not available, the uncuffed endotracheal tube size can be estimated roughly from the child’s age according to the following formula (accurate in children 1-10 years old)122a:
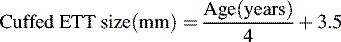
The cuffed endotracheal tube can be estimated by the child’s age using the following formula122a:
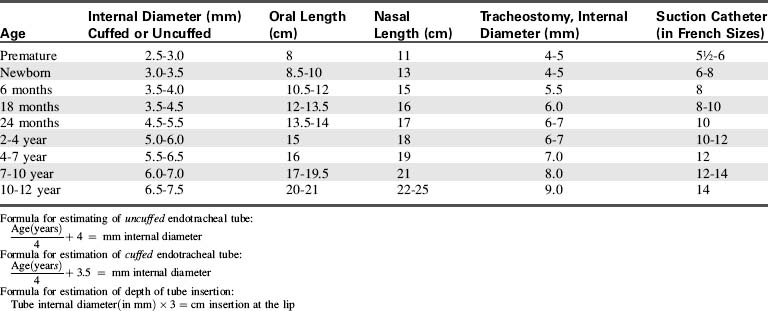
The diameter of the ETT is approximately the diameter of the child’s small finger. A reference table also can be used to estimate the proper tube size (Table 9-8).
Insertion of the Tube
Before the intubation attempt, assemble all necessary equipment at the bedside (Box 9-10). Monitor the child’s heart rate continuously and make certain the heart rate (QRS tone) is audible.
Box 9-10 Intubation Equipment
• Bag, mask, and oxygen source, cardiac monitor with audible QRS tone
• Endotracheal tube: estimated size for body length and age (see Table 9-8) plus tubes sized 0.5 mm larger and 0.5 mm smaller
• Laryngeal mask airways in a variety of sizes (if available)
• Laryngoscope blade and handle (and extra bulbs and batteries)


• Exhaled CO2 detector, capnography
• Suction equipment: wall or portable suction
• Appropriate catheter to pass easily through endotracheal tube (usually the next French size above twice the ETT size (in millimeters) will pass readily into any ETT > 3.0 mm)
• Tonsillar suction or 12-14 French suction catheter
• Tape, liquid adhesive applicators, water-soluble lubricant
• Neuromuscular blocking agents, sedatives, analgesics, lidocaine
Oxygen is administered before and between any intubation attempts to ensure that the child is well oxygenated. If a short-acting nondepolarizing or depolarizing neuromuscular blocking agent is administered to facilitate intubation, then atropine may be administered to prevent bradycardia (refer to section, Nursing Care of the Child during Mechanical Ventilation and Chapter 5). Routine administration of atropine before intubation attempts is discouraged, however, because it might prevent or minimize hypoxemic-induced bradycardia and delay the recognition of hypoxemia during intubation.
Suction devices are often needed to remove secretions, vomitus, or blood from the pharynx so that the intubating clinician can visualize the vocal chords. Once the tube is in place, the suction control is set to provide approximately − 60 to − 150 cm H2O suction, based on the age of the child (Table 9-9).
Table 9-9 Typical Maximum Negative Pressure for Pediatric Airway Suctioning Based on Age
| Age | Typical Negative Pressure (cm H2O) |
| Infant | 60-80 |
| Child | 80-120 |
| Older child | 120-150 |
Rapid Sequence Intubation
The critically ill or injured infant or child who needs intubation may have a full stomach. In such a child, the goal is to safely insert an airway, without stimulating vomiting. For a patient who needs urgent intubation, rapid sequence intubation (RSI) may be performed (Box 9-11 shows the indications for RSI). RSI is defined as nearly simultaneous delivery of oxygenation, sedation, and neuromuscular blockade for the purpose of intubation.209 The goal is to provide near immediate intubating conditions.284
[/level-membership-for-critical-care-medicine-category][not-level-membership-for-critical-care-medicine-category]
9 Pulmonary Disorders
Pearls
• Acute disease of the respiratory tract is the most common cause of illness in infancy and childhood.
• Respiratory disease is frequently present in critically ill or injured children; it may be present as a primary clinical problem or as a secondary complication.
• Altered level of consciousness in an infant or child with respiratory disease is often an ominous sign of deterioration.
• Children can have adequate oxygen saturation as documented by pulse oximetry, but they may be hypoxic because of inadequate oxygen delivery.
• Airway resistance increases exponentially as airway lumen size decreases.
• Once the PaO2 falls below 60 mm Hg, even small additional decreases in PaO2 are associated with a significant fall in arterial oxygen saturation and therefore in arterial oxygen content.
Essential anatomy and physiology
Embryology of the Lung
The respiratory system begins to develop by the fourth week of gestation. A lung bud branches from the primitive esophagus and eventually forms the airways and alveolar spaces. The pulmonary arteries form near the branching airways and their growth matches the growth of the airways. Although virtually all other body systems are physiologically ready for extrauterine life by as early as 25 weeks’ gestation, the lungs require more time to mature. Thus lung maturity is the single most important factor that determines whether a premature infant can survive extrauterine life. Table 9-1 summarizes development of the respiratory system. Although the number of airway branches is fixed at birth, airway dimensions increase until the child is approximately 8 years old.202 Alveoli multiply rapidly from an estimated 20 million alveoli at birth to 200 million by 3 years of age, and the number decreases thereafter. The alveolar surface is lined with type I and type II epithelial cells that are well developed at birth.99
| Period of Gestation | Development |
| 26 days | Lower respiratory system begins to develop until separation of the respiratory tract from the foregut is achieved |
| 5 weeks | Lung buds form and begin to differentiate into the bronchi |
| 7-10 weeks | Development of the larynx |
| 5-16 weeks | Twenty-four orders of airway branches are formed |
| 13-25 weeks | Canalicular period; bronchi enlarge and lung tissue becomes highly vascular |
| 26-28 weeks | Lungs are capable of gas exchange; type II alveolar cells secrete surfactant |
| 24 weeks to birth | Capillary network proliferates around the alveoli; approximately 8%-10% of cardiac output flows through the lung; pulmonary vascular resistance is high |
Anatomy of the Chest
The thoracic cavity is formed by the ribs, intercostal muscles, and diaphragm, and it contains both lungs and the mediastinal structures. The right lung is composed of three lobes, and the left lung is composed of two lobes.49 The heart, great vessels, nerves, trachea, and esophagus are located within the mediastinum. Pleural tissue covers each lung and adheres to the surface of the diaphragm and inner surface of the chest wall.
The diaphragm is innervated on each side of the chest by the phrenic nerve, which is formed by the third, fourth, and fifth cervical spinal nerves. In older children and adults, the chest wall is relatively rigid compared with the chest wall of the neonate and infant. Therefore, when the diaphragm contracts in older patients, intrathoracic pressure falls in proportion to the movement of the diaphragm, and air moves into the lungs (Fig. 9-1).
Fig. 9-1 Chest cavity and related structures. A, Anterior view. B, Cross section.
(From Thompson JM, et al: Mosby’s manual of clinical nursing, ed 2, St Louis, 1989, Mosby.)
The ribs angle downward, from back to front, so that contraction of the external intercostal muscles will elevate the rib cage. The chest wall of an infant is compliant, and the external intercostal muscles stabilize the chest wall. When respiratory disease develops, pulmonary compliance is reduced. When the diaphragm contracts and produces a decrease in intrathoracic pressure, intercostal and sternal retractions develop rather than inflation of the lungs (Fig. 9-2). The more the chest wall retracts, the less the lungs inflate.
The diaphragm inserts more horizontally in infants than in older children or adults, and diaphragm contraction can contribute to subcostal retractions, particularly when the infant is supine.49 The greater the retractions present, the more the diaphragm will need to contract or shorten to generate an adequate VT. Retractions make ventilation inefficient, with the result that the diaphragm must shorten and move as much as 130% of normal to generate a VT; this increases the work of breathing and can lead to respiratory muscle fatigue.
The Upper Airway
The airways of infants and children are much smaller than the airways of adults. Resistance to air flow in any airway will increase exponentially if the airway radius is compromised (see Box 9-1 and Fig. 9-3). This means that any decrease in airway radius can significantly compromise effective gas flow or increase the work of breathing. Relatively small amounts of mucus accumulation, airway constriction, or edema can substantially reduce airway radius in the infant or child, resulting in an increase in the resistance to air flow and the work of breathing.
Box 9-1 Poiseuille’s Law
R = 8nl/πr4 when flow is laminar (substitute r5 power if flow is turbulent)
l, Length of tube; n, gas viscosity; r, radius of tube.
The infant upper airway is shaped like a funnel, whereas the upper airway of the older child and adult is more tubular. The glottis of an infant is located more anteriorly and more cephalad than in an older child, and the epiglottis is longer, making intubation of the trachea more difficult in the small infant, especially when the neck is hyperextended. The narrowest portion of the infant’s airway is at the level of the cricoid, whereas the narrowest portion of the airway in the adult is at the level of the vocal cords. Small amounts of edema or obstruction in the cricoid (subglottic) area will produce an increase in airway resistance and can lead to respiratory failure. Postnatally the airways increase in both length and diameter and major changes occur in the terminal respiratory units as the number and size of the alveoli increase.49,182
Compliance and Resistance
From the time of the first breath, elastic fibers in the lung tissue create a tendency for the lungs to recoil inward (away from the chest wall). This recoil tendency is balanced by the propensity of the chest wall to spring outward. The net effect of these two opposing forces is to create a subatmospheric pressure in the intrathoracic space at the end of a normal breath (Fig. 9-2). During inspiration, the volume of the thoracic cavity is increased, and intrathoracic pressure becomes more negative with respect to atmospheric pressure. As a result, air moves from the mouth to the alveolar spaces. At the end of inspiration, the elastic recoil of the lungs and chest wall cause alveolar pressure to rise above atmospheric pressure, producing expiratory flow. In a person with normal lungs, expiration is passive and requires no muscular work.92
In addition, resistance to air flow is inversely proportional to the fourth power of the airway radius (Box 9-1) when flow is laminar.110 Any reduction in the infant’s airway radius will result in exponential increases in the resistance to air flow and work of breathing (Fig. 9-3). Resistance to airflow is inversely related to the fifth power of the airway radius when air flow is turbulent (e.g., with upper airway obstruction).
Ventilation
The rate of removal of carbon dioxide from alveoli and the rate of oxygen delivery to the alveoli are directly related to alveolar ventilation. Normal alveolar ventilation is defined as the level of ventilation that results in normal partial pressures of oxygen and carbon dioxide in arterial blood.103
Anatomic dead space is just one part of the total dead space ventilation. A more clinically significant portion of dead space is the physiologic dead space. This space represents the volume of ventilation that reaches the alveoli that do not receive any pulmonary blood flow; therefore it is ventilation that does not participate in gas exchange. Ventilation of this portion of the lung is wasted. This concept is illustrated in Fig. 9-4. Normally, physiologic and anatomic dead space volumes are similar, but physiologic dead space can be significant in patients with pulmonary vascular disease or when positive end-expiratory pressure (PEEP) reduces pulmonary blood flow or whenever right ventricular output is reduced.
Lung Volumes
The total volume of the gas contained in the lung at maximum inspiration is the total lung capacity, Fig. 9-5. The volume that can be expired after a maximal inspiratory effort is the vital capacity (VC). This important and useful measurement of lung function is discussed in detail later in this chapter. VC can be reduced by any acute or chronic lung disease that increases lung stiffness (i.e., reduces lung compliance) or by conditions that limit available intrathoracic space (e.g., scoliosis, pneumonia, pleural effusion).
Ventilation-Perfusion Relationships
Intrapulmonary shunting exists in areas of the lung where alveolar ventilation is absent, but blood flow to the nonventilated alveoli persists (i.e., alveoli are not ventilated but are perfused, so is 0; see Fig. 9-4, C). Intrapulmonary shunting is the cause of reduced PaO2 (hypoxemia) in diseases such as cardiogenic and noncardiogenic pulmonary edema (acute respiratory distress syndrome [ARDS]). By definition, hypoxemia associated with intrapulmonary shunting does not respond to supplementary oxygen administration, because the oxygen does not reach the nonventilated alveoli. This finding is in contrast to hypoxemia caused by partially ventilated alveoli (), which do respond to administration of supplementary oxygen (i.e., the PaO2 increases). An important distinction is that alveoli that are not ventilated (i.e., ) must be recruited (opened) for supplementary oxygen to improve oxygenation. With treatment, the ratio is converted from zero (shunt) to low or normal (i.e., to oxygen-responsive hypoxemia).
During the first days of life, neonates demonstrate both cardiac and intrapulmonary shunting of blood. The cardiovascular shunt is caused by the patent ductus arteriosus with some desaturated pulmonary arterial blood shunted through the ductus into the arterial circulation (the aorta) without passing through the lungs. This right-to-left shunt occurs because pulmonary vascular resistance is high at birth. Once pulmonary vascular resistance begins to fall, the volume of right-to-left shunt falls. In infants with a patent ductus arteriosus, a PaO2 of 60 to 80 mm Hg may be normal in the first day of life, but the PaO2 typically exceeds 80 mm Hg within 2 or 3 days after birth (Table 9-2) as pulmonary vascular resistance falls and the right-to-left shunt ceases. A small amount of right-to-left shunting can also occur in the immediate newborn period through a patent foramen ovale.
| Neonate at Birth | Child | |
| pH | 7.32-7.42 | 7.35-7.45 |
| PCO2 | 30-40 mm Hg | 35-45 mm Hg |
| HCO3 | 20-26 mEq/L | 22-28 mEq/L |
| PO2 | 60-80 mm Hg | 80-100 mm Hg |
The neonatal values represent normal values for neonates during the first days of life. Values for the child are the same as for the adult.
Gas Transport
Oxygen Tension and Oxygen Content
Oxygen is carried most efficiently when it is bound to hemoglobin and each gram of hemoglobin is able to carry 1.34 mL oxygen. The total oxygen content is determined by multiplying the hemoglobin (in g/dL) by 1.34 mL O2/g of saturated hemoglobin and then multiplying that number by the actual hemoglobin saturation. The small amount of oxygen carried in the dissolved form is then added to the amount of O2 carried by hemoglobin. The normal arterial O2 content is approximately 18 to 20 mL O2 per dL blood (Box 9-2).271
To emphasize the difference between PaO2 and arterial O2 content, consider the effects of varying hemoglobin concentration in three patients. If the patients all breathe room air, as noted previously, the PaO2 of all patients will equal approximately 110 mm Hg, regardless of hemoglobin concentration. If the three patients have normal lungs, their hemoglobin will be fully saturated (99%), so their total arterial oxygen content will differ according to their hemoglobin concentration. If the first patient has no hemoglobin at all (concentration of 0 g/dL), the patient’s PaO2 is still 110 mm Hg, but the patient’s arterial oxygen content is 0.33 mL/dL (equal to the amount of dissolved oxygen, or 0.003 × PaO2). This example is not realistic, but it makes the point that the PaO2 is not the same as O2 content. Consider a second patient with a hemoglobin concentration of 8 g/dL; the second patient’s PaO2 is 110 mm Hg, with a total arterial oxygen content of approximately 11 mL O2 per dL blood (slightly more than half normal). The third patient has a hemoglobin concentration of 15 g/dL; this patient’s PaO2 is 110 mm Hg, and the patient’s arterial oxygen content is approximately 20 mL O2 per dL blood (normal). Although all three patients have exactly the same PaO2 and oxygen saturation, the second patient must almost double cardiac output to maintain the same oxygen delivery as the third patient (DO2 = CO × CaO2). These examples illustrate the importance of evaluating hemoglobin concentration, PaO2, and arterial oxygen saturation when interpreting blood gas results. Additional patient examples are included in Box 9-3.
The Oxyhemoglobin Dissociation Curve
The relationship between the PaO2 and the hemoglobin saturation is expressed by the oxyhemoglobin dissociation curve, as shown in Fig. 9-6, with the PaO2 on the horizontal axis and the hemoglobin saturation on the vertical axis. The curve is not linear but S-shaped, with a large plateau at the higher levels of PaO2. There are several important things to note about the oxyhemoglobin dissociation curve. As noted, the curve flattens when the PaO2 exceeds 80 to 100 mm Hg; this means that although the PaO2 continues to rise beyond 100 mm Hg, the hemoglobin cannot become more saturated than 100%, and it cannot carry any more oxygen. Any additional rise in the PaO2 will result only in increases in the amount of dissolved oxygen in the blood, which contributes only 0.003 mL O2 per mm Hg rise in PaO2. Therefore a rise in PaO2 from 100 to 700 torr does not mean that sevenfold more oxygen is carried in the blood; it is associated with an approximately 10% increase in oxygen content. Because the hemoglobin is fully saturated once the PaO2 reaches 100 mm Hg, there is usually no advantage to maintaining the patient’s PaO2 any higher than this value.
As shown in Fig. 9-6, the slope of the oxyhemoglobin dissociation curve becomes extremely steep once the PaO2 is less than 60 mm Hg. Thus when the patient’s PaO2 falls below 60 mm Hg, even small additional decreases in the PaO2 will be associated with a significant fall in the hemoglobin saturation and arterial oxygen content. Therefore the patient’s PaO2 should be maintained above 60 mm Hg, if possible.
The position of the oxyhemoglobin curve can be altered by several factors (Table 9-3). If the curve is shifted to the right, then hemoglobin has less affinity for oxygen (it is less well saturated) at any partial pressure of oxygen (PaO2). Conversely, if the curve is shifted to the left, then hemoglobin has a higher affinity for oxygen (the hemoglobin is better saturated) at any given PaO2.
| Shift to Left (Higher oxygen affinity) | Shift to Right (Lower oxygen affinity) |
| Alkalosis | Acidosis |
| Hypocapnia | Hypercapnia |
| Hypothermia | Hyperthermia |
| Fetal hemoglobin (decreased 2,3 DPG) | Increased 2,3 DPG |
| Methemoglobinemia | Adult hemoglobin |
Factors that shift the curve to the right include acidosis, hypercapnia, and hyperthermia. Under these conditions the oxyhemoglobin saturation and oxygen content is lower at any given PaO2, but within the normal range the amount of oxygen released to tissues is enhanced, which is an adaptive response that makes oxygen more available in the tissue beds of patients who are likely to need it (e.g., those who are acidotic, hypercapnic, febrile).271 Factors that shift the oxyhemoglobin dissociation curve to the left include alkalosis, hypocapnia, and hypothermia. Although these factors increase oxyhemoglobin saturation at any given PaO2, oxygen will not be as readily released to the tissues,271 because oxygen is more tightly bound to the hemoglobin molecule.
[/not-level-membership-for-critical-care-medicine-category]
