[level-membership-for-pulmolory-and-respiratory-category]Chapter 6
Pulmonary Blood Flow
After reading this chapter, you will be able to:
• Describe how the pulmonary and systemic circulations differ anatomically and functionally
• Explain how blood flow, pressure, and vascular resistance in the pulmonary circulation can be assessed through pulmonary artery catheterization
• Distinguish among causes of high pulmonary artery pressure through data obtained from the pulmonary artery catheter
• Explain how right and left ventricular pumping function can be assessed through pulmonary artery catheterization
• Calculate pulmonary vascular resistance
• Differentiate between passive and active factors that affect pulmonary vascular resistance
• Explain how the pulmonary vasculature can accommodate great increases in blood flow during exercise without significantly increasing blood pressure
• Explain why hypoxemia affects the right ventricle differently than the left ventricle
• Explain how hypoxic pulmonary vasoconstriction can be both beneficial and harmful
• Explain why the hypoxic pulmonary vasoconstriction response is diminished in certain pulmonary diseases
• Explain why inhaled vasodilators can bring about beneficial physiological changes that are not possible through systemic administration routes
• Explain why gravity creates three distinct physiological blood flow zones in the lung, and how they differ physiologically from one another
• Describe how mechanical and physiological changes can convert a blood flow zone in the lung to a different type of zone
• Explain why the match between blood flow and ventilation in an upright individual is different in the lung base than in the lung apex
• Describe the kinds of circulatory abnormalities cause pulmonary edema
cyclic guanosine monophosphate (cGMP)
endothelium-derived relaxing factor (EDRF)
hypoxic pulmonary vasoconstriction (HPV)
persistent pulmonary hypertension of the newborn (PPHN)
pulmonary artery pressure (PAP)
pulmonary capillary wedge pressure (PCWP)
pulmonary vascular resistance (PVR)
systemic vascular resistance (SVR)
ventilation-perfusion ratio (< ?xml:namespace prefix = "mml" /> )
)
Pulmonary Vasculature
The vascular system of the body consists of separate pulmonary and systemic circulations operating in series (Figure 6-1). Each circulation receives its blood from the other; each has its own reservoir, pump, and set of vessels. The right ventricle receives mixed venous blood through the tricuspid valve from its reservoir, the right atrium, and pumps it through the pulmonic valve, which marks the beginning of the pulmonary circulation.1 This relatively deoxygenated blood flows through pulmonary arteries and arterioles to an immense alveolar capillary bed where it is reoxygenated. The capillary bed consists of extremely short, interconnected segments spreading 75 to 100 mL of blood over a 70-m2 area, or about half the size of a tennis court.1 Comroe2 described the capillary bed as two sheets of endothelium held apart in places by posts, similar to an underground parking garage. Rather than flowing through numerous individual tubes (as in systemic capillaries), pulmonary blood flows more like a sheet over the alveoli, maximizing its exposure to alveolar gases. This structural arrangement shortens the distance for oxygen and carbon dioxide diffusion between air and blood to one tenth of the diffusion distance that exists between systemic capillaries and tissue cells.1
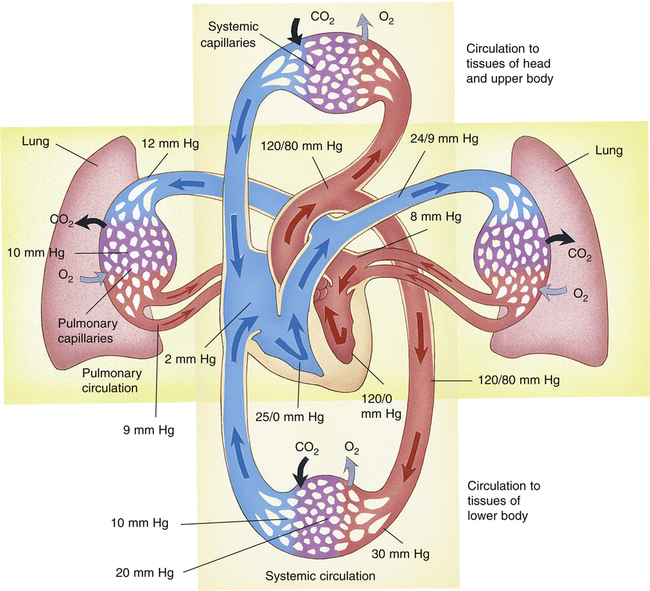
After leaving the alveoli, the capillaries converge to form venules and veins. The newly oxygenated blood flows through four major pulmonary veins (two from each lung) into the left atrium, the reservoir for the left ventricle. The pulmonary vein orifices in the left atrial wall mark the end of the pulmonary circulation.1 Blood continues to flow out of the left atrium through the mitral valve into the left ventricle, which pumps the blood through the aortic valve into the aorta. The aortic valve marks the beginning of the systemic circulation. The aorta distributes the oxygenated blood through its many branches to systemic arteries, arterioles, and capillary beds throughout the body, supplying oxygen to tissue cells and removing the carbon dioxide they produce. Beyond the capillary beds, systemic venules and veins converge to return the oxygen-poor blood to the right atrium via the vena cavae, which mark the end of the systemic circulation.
The total cardiac output ( ) is simultaneously pumped through both circulations each minute. Right and left ventricular outputs must be essentially equal over time; otherwise, blood would accumulate in one of the circulations. Small differences in outputs may occur briefly for a few heartbeats, but over time, individual ventricular outputs are equal in healthy hearts. Figure 6-1 illustrates pulmonary and systemic circulations with their associated pressures.
The pulmonary arteries and arterioles have much thinner walls and less smooth muscle than systemic arteries and arterioles. Therefore, pulmonary arterioles cannot constrict as effectively as systemic arterioles. Pulmonary veins and venules also have sparse smooth muscle, differing little in structure from pulmonary arteries and arterioles. Pulmonary arteries generally follow a course parallel with bronchi, whereas pulmonary veins leave the lung through different routes. Without this anatomical difference, distinguishing pulmonary arteries from veins on a chest x-ray image would be difficult because of their structural similarities.2
Bronchial Vasculature
The supporting tissues of the tracheobronchial tree, including airways down through the terminal bronchioles, are supplied with oxygenated blood through the systemic bronchial arteries. (See the section on blood supply to the lungs in Chapter 1.) Bronchial systemic venous blood drains directly into the pulmonary veins, mixing oxygen-poor blood with freshly oxygenated pulmonary venous blood on its way to the left ventricle.3 Bronchial blood flow is only 1% to 2% of the cardiac output, which means that the anatomical shunt from this source is usually less than 2%; this also means that left ventricular output is about 1% to 2% greater than right ventricular output.3
Pulmonary and Systemic Pressures
Figure 6-1 shows that the pulmonary circulation is a low-pressure, low-resistance system compared with the systemic circulation. The lower resistance in the pulmonary circulation is manifested by the fact that its pressures are lower even though it receives the same cardiac output as the systemic circulation receives. The resistance to blood flow in the pulmonary circulation is about one tenth as great as it is in the systemic circulation.1
Blood flow through the pulmonary circulation is highly pulsatile rather than continuous as in systemic capillaries. The total volume of blood in the pulmonary circulation is about 450 mL, which is only 9% of the total circulating blood volume. About 70 mL of this blood is in the capillaries at any given moment; the rest is distributed equally between pulmonary arterial and venous vessels.3 The capillary blood volume of 70 mL is about equal to the volume ejected by the right ventricle with each contraction (the right ventricular stroke volume). Pulmonary capillary blood is thus almost completely replaced with each heartbeat, which means a red blood cell travels through the capillaries in about 0.75 second. Pulmonary blood flow almost stops between each ventricular beat, which explains its pulsatile nature.1,3
Clinical Measurement of Pulmonary Blood Pressures and Flows
Measurement of Pulmonary Blood Pressures
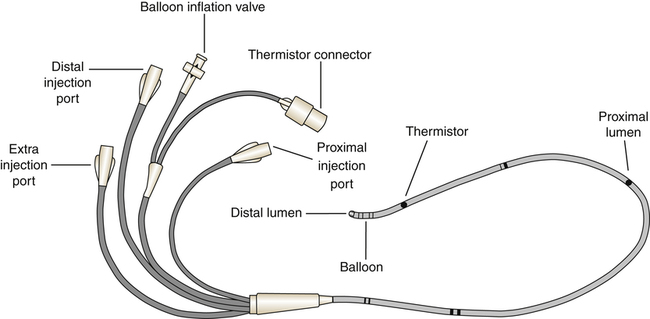
Systemic blood pressure is easily measured by simple noninvasive means. However, measurement of pressures in the pulmonary circulation requires an invasive procedure called pulmonary artery catheterization. The special catheter used for this purpose was the subject of a study published in 1970 by Swan, Ganz, and others. Since then, the catheter has been marketed under the brand name Swan-Ganz, and the term Swan-Ganz catheter has become synonymous with pulmonary artery catheter. This catheter is a very thin, multilumen flexible tube with a balloon located at its distal end. The balloon can be inflated through a separate channel inside the catheter. The catheter contains at least two additional internal channels: the distal channel, leading to an opening at the tip of the catheter, and the proximal channel, leading to an opening located several centimeters back from the tip. Pressures can be measured or blood can be withdrawn through these channels via the proximal and distal ports of the catheter (Figure 6-2).
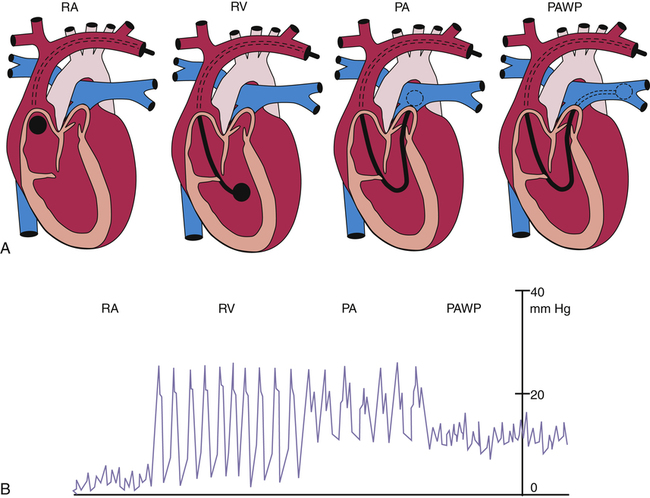
A physician inserts the catheter under surgically sterile conditions, sometimes at the bedside of a critically ill patient in a hospital intensive care unit. Proximal and distal channels are first filled with sterile fluid to remove all air; the catheter is then inserted into a large systemic vein, usually the right internal jugular or subclavian vein, and advanced until the tip enters the right atrium. At this point the balloon is inflated, allowing the bloodstream to direct the catheter tip across the tricuspid valve into the right ventricle—hence, the term flow-directed, balloon-tipped catheter. The physician advances the catheter until the bloodstream carries it through the pulmonic valve and into the pulmonary artery (Figure 6-3). During insertion, pressures at the catheter tip are continuously recorded by an electronic pressure transducer connected to the distal port. The stationary fluid column inside the distal channel reflects these pressures precisely because it is in direct contact with the blood at the catheter’s tip. The pressure waveforms are continuously displayed on the bedside monitor as the catheter is advanced; this helps the physician identify the position of the catheter tip because each cardiovascular structure produces unique pressure waveforms (Figure 6-4, A and B).
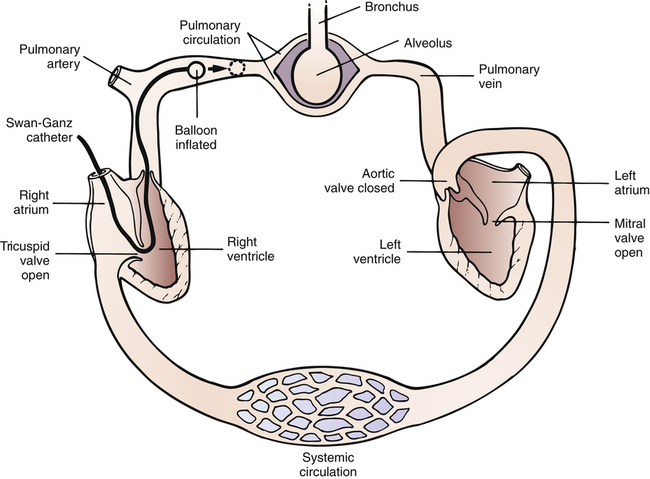
When the catheter is advanced far enough to wedge in a small branch of the pulmonary artery, the inflated balloon completely blocks blood flow to the downstream vessels supplied by that artery (see Figure 6-3, dotted circle). The pressure measured from the catheter tip in this wedged position is called the pulmonary capillary wedge pressure (PCWP). (When the balloon is deflated, flow resumes, and the catheter tip simply measures the pulmonary artery pressure [PAP].) The vessels extending beyond the artery blocked by the inflated balloon are in direct communication with the pulmonary capillaries and the pulmonary veins. Pulmonary venous pressure is nearly equal to left atrial pressure (LAP), which is essentially equal to left ventricular end-diastolic pressure (LVEDP), the pressure inside the filled ventricle just before it contracts (see Figure 6-3). This so-called filling pressure is also known as preload of the left ventricle. The PCWP is only slightly greater than the filling pressure of the left ventricle.3 The PCWP accurately reflects changes in LAP (or ventricular filling pressure) because the stationary fluid column inside the catheter is functionally extended from the catheter tip to the left atrium. For this reason, the PCWP is commonly used to assess the pumping function of the left ventricle. For example, if the left ventricle fails to contract with normal force, blood flowing into it dams up in the left atrium, pulmonary veins, and capillaries; consequently, the PCWP increases. In certain rare circumstances, the PCWP might not accurately reflect left atrial pressure: (1) if the pulmonary veins constrict and downstream resistance beyond the catheter tip increases or (2) if the catheter tip is in an area in the lung where alveolar pressure exceeds pulmonary venous pressure, as might occur in positive pressure mechanical ventilation. In the latter instance, high alveolar pressure compresses capillaries distal to the catheter tip, blocking its communication with the left atrium.
The pulmonary artery catheter also can be used to assess right ventricular preload and pumping function because the proximal channel (see Figure 6-2) communicates with the right atrium. The pressure measured at the catheter’s proximal port reflects right atrial pressure (RAP), sometimes called central venous pressure (CVP).
Blood drawn from the proximal channel is a mixture of superior and inferior vena cava venous blood. Because oxygen contents of these two sources may differ considerably, proximal channel blood is not a clinically acceptable mixed venous blood sample for purposes of measuring the average venous oxygen content of the body. A thoroughly mixed venous blood sample reflecting the true average venous oxygen content of the body must be obtained from the pulmonary artery, through the distal channel of the catheter (see Figure 6-2). By comparing the oxygen content of mixed venous blood with the oxygen content of systemic arterial blood, the oxygen consumption of the body can be assessed. (This is discussed in Chapters 8 and 12.)
clinician can evaluate right and left ventricular function, differentiate the causes of increased PAP, and assess the risk of pulmonary edema. PAP might be increased because of excessive blood volume (hypervolemia) or because of left ventricular pumping failure in which blood dams up in the entire pulmonary circulation. The PAP might also be increased as a result of increased pulmonary vascular resistance (PVR). Increased pressures in either ventricle at the end of diastole, coupled with a low cardiac output, signal a loss of ventricular pumping ability, or a loss of contractility. Increased PCWP, regardless of the cause, means that the pulmonary capillaries are engorged with blood, increasing the likelihood that fluid will be forced into interstitial lung spaces and cause pulmonary edema. Understanding these relationships is essential for taking appropriate therapeutic actions.
Measurement of Pulmonary Blood Flow or Cardiac Output
The amount of blood the heart pumps each minute can be clinically measured with a pulmonary artery catheter via a thermodilution technique. In this method, a known volume of room temperature fluid (e.g., saline) is rapidly injected into the right atrium through the proximal injection port (see Figure 6-2). This volume of cool fluid rapidly flows into the right ventricle where it is pumped into the pulmonary artery. A temperature-sensing thermistor near the end of the catheter (see Figure 6-2) in the pulmonary artery records a sudden decrease in temperature as the bolus of cool saline passes by. If cardiac output is increased, blood temperature rapidly returns to its original value; if it is decreased, the temperature increases more slowly to the original value. A microprocessor receives information from the thermistor and computes the area under the temperature-time curve. The area under the curve is small for rapid blood flow and large for slow blood flow. The microprocessor uses the area under the curve and the volume of the injected fluid to compute the blood flow rate, or the cardiac output ( ). Several determinations of cardiac output can be made within minutes in this fashion.
Pulmonary Vascular Resistance
Calculation of Pulmonary Vascular Resistance


A pressure of 1.2 mm Hg is needed to produce a flow of 1 L per minute through the pulmonary circulation. In classic physics, pressure is measured in dynes per square centimeter (force per unit of area), and blood flow is measured in milliliters per second (cubic centimeters per second). Using these measurement units, PVR is calculated as follows:2

The pressure difference between beginning and ending points of the systemic circulation is the difference between mean arterial pressure (MAP) and RAP (or CVP). Systemic vascular resistance (SVR) is calculated as follows (using values from Figure 6-1):
A pressure gradient of 18.2 mm Hg is needed to drive 1 L per minute of blood through the systemic circulation (compared with 1.2 mm Hg in the pulmonary circulation). This pressure converts to about 1456 dynes • sec • cm−5. PVR is normally less than one tenth of SVR.1 Thus, right ventricular work is about one tenth of left ventricular work, which explains why the left ventricular muscle mass is normally much greater than the right ventricular mass.
Distribution of Pulmonary Vascular Resistance
Figure 6-1 shows that the pressure decreases from the pulmonary arterioles to the pulmonary capillaries to the pulmonary veins are similar—that is, from 12 mm Hg to 10 mm Hg to 9 mm Hg as shown in the right lung of the diagram in Figure 6-1. This means the individual resistances of these three components are nearly equal; at rest, each accounts for about one third of the total PVR. In contrast to the more muscular systemic arterioles, pulmonary arterioles do not normally function to regulate and redistribute blood flow.4 In contrast to the pulmonary vasculature, systemic arterioles account for about two thirds of the total SVR.
Factors Affecting Pulmonary Vascular Resistance
Passive Factors
Lung Volume: Effects on Alveolar and Extraalveolar Vessels
Pulmonary vessels can be classified into two groups: vessels in direct contact with alveoli, exposed to alveolar pressure (alveolar vessels), and vessels not in contact with alveoli, exposed to intrapleural pressure (extraalveolar vessels). Alveolar vessels are pulmonary capillaries in intimate contact with alveolar walls. The state of alveolar inflation determines the diameters of alveolar vessels. As the lung inflates, alveolar vessels are compressed, and their resistances increase (Figure 6-5, A and B).1,3
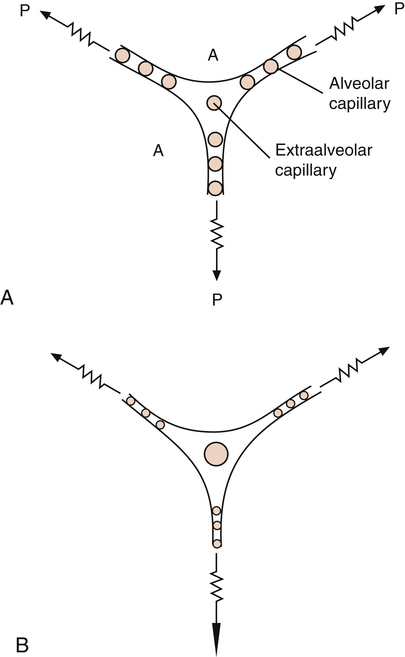
Extraalveolar vessels include all pulmonary arteries, arterioles, venules, and veins not in direct contact with alveoli. The lung’s elastic fibers have a tethering effect on these vessels (similar to their effect on small airways), stretching them to larger diameters as the lung inflates. In addition, during lung inflation, subatmospheric intrapleural pressure increasingly dilates these vessels, decreasing their resistance.1,3 Extraalveolar vessels also include certain capillaries between alveoli in corners formed by the junctions of adjacent alveoli (see Figure 6-5, A and B). As the lung inflates, these corner spaces enlarge, stretching and dilating the “corner vessels” (see Figure 6-5, B).
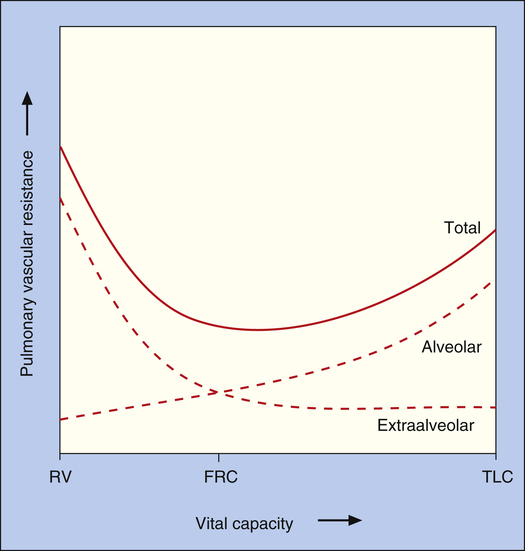
Because alveolar and extraalveolar vessel resistances are in series with each other, their effects are additive.1 Thus, total PVR is the composite of alveolar and extraalveolar vessel resistances, creating a U-shaped curve (Figure 6-6). Overall, PVR is lowest at functional residual capacity (FRC). At volumes less than FRC, elastic retractile forces and subatmospheric intrapleural pressures are weak, allowing extraalveolar vessels to narrow, shorten, and kink. The resulting increase in extraalveolar vessel resistance predominates, increasing total PVR. At volumes greater than FRC, increased alveolar vessel resistance caused by capillary compression becomes the predominant factor, again increasing total PVR (see Figure 6-6).
Vascular Pressure: Recruitment and Distention
An increase in either PAP or LAP decreases PVR. One reason is that both PAP and LAP cause an increase in distending pressure across vessel walls (transmural pressure), which dilates them.1,4 This dilating effect is amplified if PAP and LAP increase together (Figure 6-7).1,3 For example, consider an increasing LAP caused by inadequate left ventricular pumping action; the elevated LAP is reflected back throughout the pulmonary veins, capillaries, and arteries, dilating them and decreasing their vascular resistance.
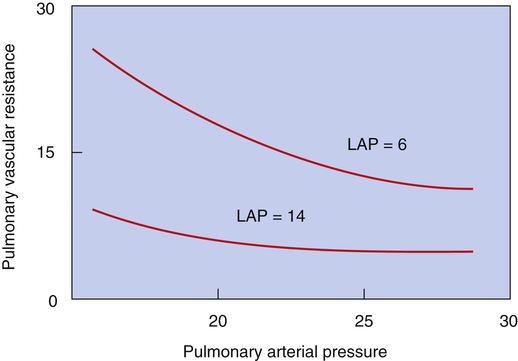
The second mechanism responsible for the decrease in PVR when vascular pressures increase is recruitment.1,4 Under normal resting conditions, some pulmonary capillaries in the upper regions of the lungs are completely collapsed.1,4 As intravascular pressure increases, these collapsed capillaries are forced open (recruited), increasing the total cross-sectional area of the pulmonary capillary bed. As vascular pressures increase further, individual capillaries widen or distend, decreasing PVR even more. If vascular pressure increases from an initially low level, recruitment is the chief mechanism whereby PVR decreases; conversely, if vascular pressure increases further from an initially high level when all vessels are already open, distention is the main reason why PVR decreases.4 Recruitment and distention help explain why PAP changes little during exercise. As cardiac output increases, recruitment and distention dramatically decrease PVR, allowing PAP to increase only a few millimeters of mercury. The opposite effect is equally important; decreased cardiac output and vascular pressures cause derecruitment, or collapse, of pulmonary capillaries.
Blood Volume
Pulmonary blood volume is generally constant, but it may change under certain circumstances. For example, a sustained Valsalva maneuver (forced expiration against a closed glottis) can squeeze 250 mL of blood into the systemic circulation.3 Systemic blood loss can also decrease pulmonary blood volume. Left ventricular failure causes blood to dam up in pulmonary vessels, potentially increasing pulmonary blood volume by 100%.3 Regardless of the mechanism, increased blood volume distends and recruits capillaries, decreasing the PVR.
Active Factors
Neurogenic Stimuli
There is little evidence to suggest that neurogenic stimuli play a role in controlling pulmonary blood flow in healthy adults.1,4 Although sympathetic and parasympathetic nerves innervate the pulmonary vasculature (mostly larger arteries), their functional significance is marginally important and not well understood.1 Some investigators have shown that sympathetic stimulation causes a slight increase in PVR, but others have shown only a stiffening of the arteries with no change in calculated resistance.4 Parasympathetic (vagal) stimulation causes a slight decrease in vascular resistance, but its physiological significance is unknown. Overall, the effects of autonomic stimulation on the pulmonary circulation are controversial and not well understood; autonomic stimulation produces only minor changes in the smooth muscle tone of vessels in the adult lung.1
Humoral Agents and Nitric Oxide
The most important substance that regulates pulmonary vascular tone is nitric oxide (NO), derived from the endothelial cells lining the blood vessels.5 Naturally occurring (endogenous) humoral substances in the body produce vasodilation by stimulating the production of NO, previously called endothelium-derived relaxing factor (EDRF). Endogenous substances include acetylcholine, bradykinin, histamine, thrombin, serotonin, adenosine diphosphate (ADP), and some prostaglandins.6 In 1987, Furchgott6 noted that acetylcholine did not cause smooth muscle relaxation in vessels stripped of their endothelium; he postulated that endothelial cells produce a smooth muscle relaxing factor. Palmer et al.7 and Ignarro et al.8 later identified EDRF as NO. The 1998 Nobel Prize in physiology or medicine was awarded to Furchgott, Ignarro, and Murad for their discovery of the role of NO in the human body.9
Nitric oxide is a potent vasodilator in the human circulation, and it plays an important role in regulating pulmonary vascular smooth muscle tone.5 The endogenous substances previously listed are considered to be endothelial-dependent vasodilators because they depend on the endothelial release of NO for their effects. The elaboration of NO accounts for the vasodilating mechanism of nitrate drugs such as nitroglycerin (used to improve coronary blood flow) and nitroprusside (used to treat dangerously high blood pressure).10
NO is produced in vascular endothelial cells (Figure 6-8) by oxidation of an amino acid, l-arginine, catalyzed by an enzyme, nitric oxide synthase (NOS).11–13 As stated in Chapter 1, there are three forms of NOS: neuronal NOS (nNOS), which is constituted in nonadrenergic noncholinergic neurons (a form of constitutive NOS [cNOS]); inducible NOS (iNOS), which is induced in airway epithelial cells by inflammation; and endothelial NOS (eNOS), another constitutive form of NOS that is generated in vascular endothelial cells (referred to as cNOS in Figure 6-8).5,13 Production of eNOS is controlled by endothelial cell surface receptors that are stimulated by the various humoral substances previously listed. Besides these substances, mechanical factors such as stretching and shear stress stimulate cell surface receptors.11 Whether the stress is humoral or mechanical, receptor stimulation activates eNOS but only in the presence of calcium ions (Ca++). Calcium-activated cNOS catalyzes the oxidation of l-arginine, producing small bursts of NO.
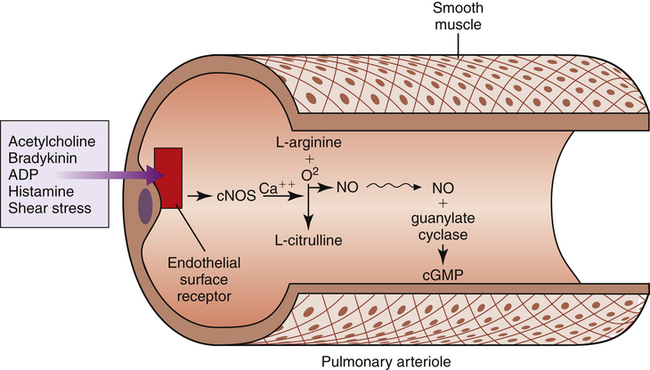
NO is highly soluble in cell membranes and diffuses instantly into vascular smooth muscle cells. In vascular smooth muscle cells, NO activates another enzyme, guanylate cyclase, which catalyzes the production of cyclic guanosine monophosphate (cGMP), as shown in Figure 6-8. cGMP causes vascular smooth muscle relaxation. Physical exercise induces cNOS production, presumably by increasing vascular pressure, and may be a factor, along with recruitment and distention, in preventing significant increases in PVR during exercise.11
Endothelial cells synthesize NO in small amounts on demand, exerting a regulatory vasodilating influence on pulmonary arterioles under normal resting conditions.11,12 A calcium-independent form of NOS (inducible NOS [iNOS]) can be induced in endothelial and inflammatory cells by endotoxins associated with bacterial blood infections (septicemia) and by various other inflammatory mediators in the body.5 In contrast to eNOS, which is released in small pulses as needed, iNOS is always “turned on,” releasing large, continuous amounts of NO not controlled by cell receptor–dependent mechanisms. Excessive induced NO production is linked to the massive vasodilation and hypotension of septic shock syndrome.14,15 Sepsis-induced vasodilation does not respond well to vasoconstrictor drugs. If an effective iNOS-inhibiting drug could be given to patients with septic shock, it would seem that the vasodilation and associated hypotension might be reversed, increasing the blood pressure.
This hypothesis was studied in a large multicenter clinical trial in which humans with septic shock were given a drug known to inhibit NOS activity. The NOS inhibitor reduced blood nitrate levels, increased pulmonary and systemic vascular tone, maintained systemic blood pressure in an acceptable range, and reduced the need for conventional vasoconstrictor drugs, such as norepinephrine.14 However, overall patient outcome was not improved. Although general inhibition of NOS is not ultimately beneficial in septic shock, selective inhibition of the inducible form (iNOS) was found to be more beneficial than norepinephrine in an animal study.16
Inhaled NO gas in extremely low concentrations has been used therapeutically to treat severe pulmonary hypertension and to selectively dilate pulmonary vessels in well-ventilated regions of the lungs. In the latter instance, inhaled NO of necessity enters the best-ventilated lung areas, selectively lowering vascular resistance in those regions. Because blood flow follows the path of least resistance, it is diverted from poorly ventilated to well-ventilated areas. NO inhalation has been especially beneficial in treating infants with persistent pulmonary hypertension of the newborn (PPHN) (see Chapter 16).
Chemical Factors
The most important chemical factor causing pulmonary vasoconstriction is low alveolar oxygen pressure (PAO2)—that is, alveolar hypoxia. A PAO2 of less than 70 mm Hg usually elicits this effect, known as hypoxic pulmonary vasoconstriction (HPV).1 HPV is brought about by alveolar hypoxia, as opposed to arterial or mixed venous hypoxemia. The elements of the vasculature that constrict are predominantly the small precapillary arterioles; small pulmonary veins also constrict to some extent but produce only 20% or less of the HPV-induced increase in PVR.17 This constrictive venous response might explain the acute pulmonary edema sometimes seen in individuals who travel to high altitudes in the mountains where atmospheric oxygen pressure is low; hypoxia-induced venous constriction could increase pulmonary capillary pressure, which is a feature of high-altitude pulmonary edema.17
The constrictive response to hypoxia is unique to the pulmonary circulation; hypoxia evokes vasodilation in the systemic circulation. High PAO2 (hyperoxia) has little effect on normal pulmonary circulation, probably because pulmonary vessels in normal lungs have little muscle tone, and their vasodilating ability is minimal.18 However, in hypoxic individuals, improved oxygenation markedly dilates pulmonary vessels and dramatically decreases PVR.
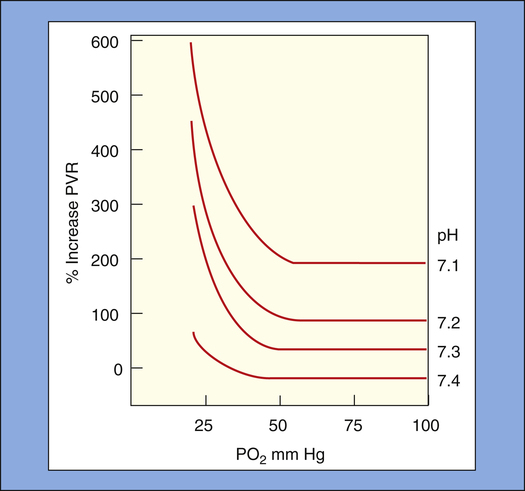
HPV is enhanced by low arterial blood pH (acidemia); HPV becomes progressively greater for a given PAO2 as pH decreases. At a normal arterial pH of 7.40, the maximal vasoconstrictive response occurs at a PAO2 of 60 to 70 mm Hg18; this corresponds with a PaO2 of about 50 to 60 mm Hg when the normal alveolar-to-arterial PO2 gradient is taken into account. A classic animal experiment showed that at arterial pH less than 7.30, a PaO2 less than 50 mm Hg causes a sudden, sharp increase in PVR (Figure 6-9).19 At a normal PaO2, arterial pH must decrease to less than 7.25 to cause a significant increase in PVR.18 High PaCO2 increases PVR indirectly by generating carbonic acid, which causes acidemia. HPV is also enhanced by NOS-inhibiting agents, suggesting that reduced endothelial NO release may be an underlying mechanism in HPV.17
HPV is inhibited by various mediators present in the blood that cause vasodilation, such as the endothelial-derived substances NO and prostacyclin.17 HPV is also inhibited by drugs that block alpha-adrenergic or stimulate beta-adrenergic receptors. In addition, it is inhibited by increased LAP (a vascular distending effect), high alveolar pressure, and high blood pH (alkalemia).17
Physiological Function of Hypoxic Pulmonary Vasoconstriction
Mechanism of Hypoxic Pulmonary Vasoconstriction
The exact mechanism of HPV is poorly understood.1 The response is localized, occurring only in areas of alveolar hypoxia. HPV does not depend on nervous or humoral control because it occurs in surgically removed, mechanically perfused lungs ventilated with hypoxic gas mixtures17; this explains why HPV occurs even in patients who receive heart-lung transplants.
Animal and human studies strongly suggest that lack of normal NO release by the endothelium plays a role in the HPV mechanism. Decreased PO2 in vascular endothelial cells diminishes NO synthesis, suggesting that reduced NO formation is a mechanism underlying HPV.1, 20 HPV is abolished by breathing NO gas mixtures or by drugs that stimulate endothelial NO production.1, 20 Conversely, blocking NO synthesis enhances HPV, which means that NO must have a regulating effect on HPV, holding its severity in check.17 Even in persons without hypoxia, drugs inhibiting NO synthesis induce pulmonary vasoconstriction, confirming that the normally oxygenated pulmonary vasculature is in a continuous state of NO-mediated dilation.20
Whatever the cause of HPV, Ca++ entry into the vascular smooth muscle cell must be involved to cause muscle contraction.1 A mechanism has been proposed whereby hypoxia directly affects vascular smooth muscle; it has been shown that hypoxia depolarizes smooth muscle cell membranes, probably by inhibiting potassium ion (K+) channels, which is accompanied by the opening of Ca++ channels and Ca++ entry into the cell.1,17 Ca++ are essential in the smooth muscle contraction process. Consistent with this proposed mechanism is the fact that Ca++ channel blocking drugs inhibit HPV, whereas Ca++ agonists enhance it.1
Loss of Hypoxic Pulmonary Vasoconstriction
The HPV response is often diminished in patients with acute lung injuries, such as burn and smoke inhalation, sepsis, and acute respiratory distress syndrome (ARDS).13,14,17,21,22 This diminished response may account for the severe systemic hypoxemia these diseases cause. Acute lung injury causes the release of inflammatory mediators that induce formation of iNOS and subsequent NO release; this prevents the normal vasoconstrictive response of vessels in hypoxic lung regions. When the HPV response is lost, poorly oxygenated mixed venous blood flows unchecked through underventilated and nonventilated lung regions, creating severe shunting and systemic arterial hypoxemia. This type of intrapulmonary shunting responds poorly to oxygen inhalation because the supplemental oxygen cannot enter nonventilated alveoli.
Inflammatory mediators are also released in response to overinflation of the alveoli, which has implications for patients who are dependent on mechanical ventilatory assistance. Patients with acute lung injuries often require positive pressure mechanical ventilation. High pressures during mechanical ventilation can overstretch and injure the alveoli. This type of stretch injury is known to release inflammatory cytokines that induce iNOS and subsequent NO release, which counteracts HPV.23–25
A purely mechanical explanation for why acute lung injury might diminish the effect of HPV also has been proposed.21 Injury to the alveolar-capillary membrane increases its permeability, allowing fluid to enter the alveolus and deactivate surfactant. The resulting high surface tension causes alveoli to shrink and collapse. Animal studies using an in vivo microscope revealed that as alveoli shrink, they place a tethering force on the extraalveolar vessels, causing them to dilate. In this way, portions of the pulmonary vasculature are mechanically dilated in injured, poorly ventilated lung regions, possibly negating or minimizing the effects HPV might have.21
Inhaled Vasodilators in Acute Respiratory Distress Syndrome
Despite the reduction of the effectiveness of HPV in acute lung injury, the overall PVR is nevertheless often elevated in ARDS.17 For this reason, inhaled NO and other pulmonary vasodilators have been used clinically to decrease PVR. Besides decreasing PVR, an added benefit of inhaled vasodilators (as a gas or an aerosol mist) is that they selectively dilate pulmonary vessels only in well-ventilated lung regions, diverting mixed venous blood to these areas. The effect is to match blood flow with ventilation better, reducing intrapulmonary shunt and improving arterial oxygenation—in effect, enhancing the benefits of HPV. Selective dilation occurs because inhaled vasodilators can enter only ventilated portions of the lung.
Alternatives to inhaled NO have been sought because of the complex technology associated with NO administration, high NO costs, potential NO toxicity, and the failure of NO to decrease overall mortality in patients with ARDS.26 Some of these alternative vasodilators, which are inhaled as aerosols,
include prostacyclin (PGI2), sildenafil (Viagra), nitroprusside, and nitroglycerin.26–28 Similar to NO, prostacyclin is synthesized in the pulmonary vascular endothelial cells; it exerts its effects by activating specialized endothelial receptors. Sildenafil exerts its effects by inhibiting phosphodiesterase, an enzyme that deactivates cyclic adenosine monophosphate (cAMP); cAMP is the intracellular substance responsible for smooth muscle relaxation. Nitroprusside and nitroglycerin induce the enzymatic release of NO. All of these NO alternatives reduce both pulmonary and systemic blood pressures if given intravenously or orally. Intravenous or oral administration of these agents not only could dangerously lower the systemic blood pressure but also indiscriminately dilate all pulmonary vessels; this would hinder HPV and worsen intrapulmonary shunt and hypoxemia. However, when administered by inhalation, these vasodilators affect only the pulmonary circulation and only in well-ventilated lung regions; this tends to preserve HPV in poorly ventilated areas.26
Distribution of Pulmonary Blood Flow
Gravitational and Pressure Effects: Zones of Blood Flow
Because pressures in the thin, distensible pulmonary blood vessels are low, gravity and pressures surrounding the vessels greatly affect blood flow distribution in the lung. The effects of gravity create three distinct zones of blood flow, as described in the classic model by West4 (shown in Figure 6-10). Blood enters the lung at the hilum through the pulmonary artery. The same average PAP of about 15 mm Hg is applied to arterial vessels in all zones. Arteries in zone III (lung base) are about 12 cm below the hilum. Thus, the weight of a column of blood 12 cm high is added to the pressure in zone III vessels. A column of blood 12 cm high exerts a pressure of about 9 mm Hg, causing arterial pressure in zone III to be 9 mm Hg higher than arterial pressure in zone II (see Figure 6-10). Blood flows down into zone III with the aid of gravity.
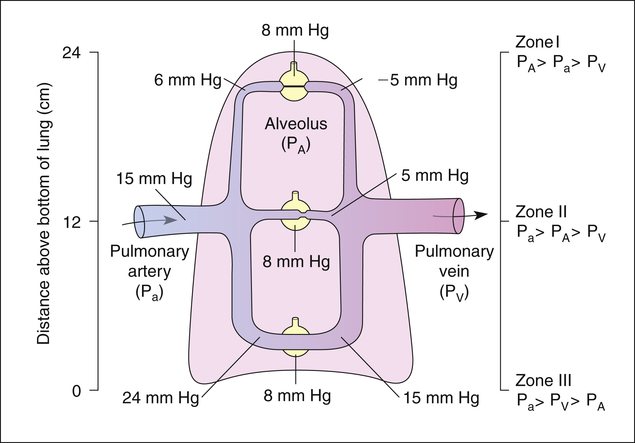
In contrast, blood is pumped up into zone I (lung apex) against gravitational forces. Zone I arteries are about 12 cm above the main pulmonary artery, causing the arterial pressures to be 9 mm Hg less than the arterial pressure in the main pulmonary artery. Figure 6-10 shows an upright lung (i.e., the person is standing). If the person is supine, zones I to III are redistributed from anterior to posterior lung regions, rather than from the lung apex to the lung base.4
Zone I Blood Flow
To illustrate zone I conditions, which are not normally present in spontaneously breathing individuals, the lung model in Figure 6-10 is receiving positive pressure mechanical ventilation such that the average alveolar pressure is about 8 mm Hg in all alveoli. In the lung apex or zone I, gravitational effects cause both arterial and venous pressures to be lower than alveolar pressure. Consequently, alveolar pressure compresses the surrounding capillaries, totally occluding them and stopping blood flow. Only extraalveolar corner vessels may still have some blood flow in this zone. In zone I, alveoli are ventilated but have no blood flow, which constitutes alveolar dead space ventilation. In spontaneously breathing healthy individuals with normal cardiac outputs and blood pressures, arterial pressures always exceed alveolar pressures, even in the uppermost apical lung regions, and zone I does not exist. However, a severe decrease in blood pressure can lower PAP so much that zone I conditions are created in the lung.
Zone II Blood Flow
Figure 6-10 shows that arterial pressure in zone II considerably exceeds alveolar pressure, but alveolar pressure still exceeds venous pressure; this produces intermittent flow through alveolar capillaries. Blood flows into a capillary at its arterial end because its pressure exceeds the surrounding alveolar pressure. As blood flows down the length of the capillary, approaching the venous end, capillary pressure progressively decreases until it falls below alveolar pressure. At this point, alveolar pressure collapses the capillary, stopping blood flow. (This is similar to the situation described in Chapter 3 in which forced expiration causes dynamic airway compression after an equal pressure point is formed.) The pressure of the stationary column of blood in the capillary quickly equalizes with its source, the arterial pressure, which is greater than alveolar pressure. This action momentarily forces the capillary open, allowing blood flow to resume. As blood flows through the opened capillary, pressure again decreases down its length, falling below alveolar pressure, recollapsing the capillary near its venous end. The cycle repeats, causing capillaries to flutter rapidly between open and closed states, producing intermittent flow.
II flow characteristic is sometimes called the waterfall effect. In this analogy, the rate of flow over the waterfall’s edge is proportional to the pressure difference between a point upstream (arterial pressure) and a point at the waterfall’s edge (alveolar pressure). Neither the pressure in the stream below the waterfall’s edge (venous pressure) nor the height of the waterfall influences the rate of flow over the edge.
Factors Affecting Zones of Blood Flow
Blood flow zones are not fixed, anatomical boundaries; rather, they are dependent on physiological conditions. Certain respiratory maneuvers, such as exhaling against a closed glottis, blowing through a wind instrument, or coughing, can momentarily increase alveolar pressures above arterial pressure, creating zone I conditions in gravity-independent (uppermost) lung regions. Positive-pressure mechanical ventilation may increase alveolar pressure enough to convert some zone II regions to zone I. This is one mechanism whereby positive pressure ventilation increases alveolar dead space. Likewise, a loss of blood volume or massive vasodilation, as in septic shock, may decrease PAP enough to create zone I conditions. Conversely, exercise increases cardiac output and PAP, recruiting any zone I to zone II or zone II to zone III. The lung volume also affects regional distribution of blood flow, as implied in the earlier discussion regarding the effect of lung volume on PVR (see Figure 6-7). At total lung capacity when alveoli are maximally expanded, apical regions are more likely to produce zone I conditions.
Normal Matching of Ventilation and Blood Flow
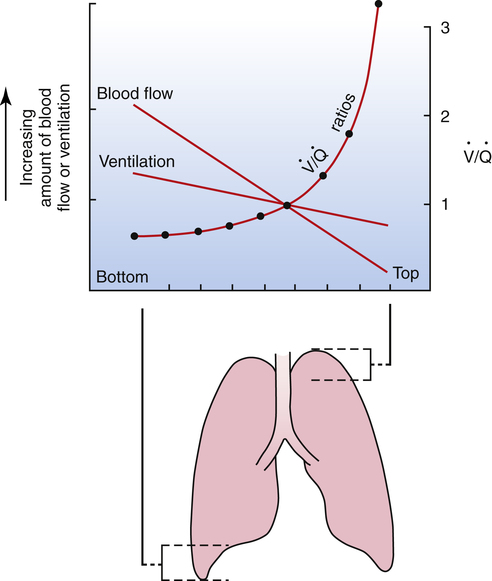
As discussed in Chapter 3, tidal inspiration is preferentially distributed to basal alveoli. This distribution occurs because at FRC, the beginning point for a tidal inspiration, apical alveoli are more distended and less compliant than basal alveoli. Although apical alveoli contain more volume at FRC, their decreased compliance allows less volume change per breath and less ventilation per minute. Similar to blood flow, ventilation is least in the lung apex and greatest in the lung base. However, the decrease in blood flow from base to apex is greater than the corresponding decrease in ventilation, which means that the lung apex has relatively more ventilation than blood flow. Likewise, the lung base has relatively more blood flow than ventilation. As a result, the ventilation-perfusion ratio ( ) increases from the lung base to the lung apex (Figure 6-11).


Dead Space and Shunt Effects in the Normal Lung
Shunt refers to deoxygenated blood flowing through the capillaries of unventilated alveoli; dead space refers to the ventilation of alveoli that have no capillary blood flow. Between these two extremes are shuntlike and dead space–like effects, corresponding with low and high  ratios. Because the lung apices have relatively more ventilation than blood flow (high
  ), a dead space–like effect is produced. Likewise, because lung bases have relatively less ventilation with respect to blood flow (low
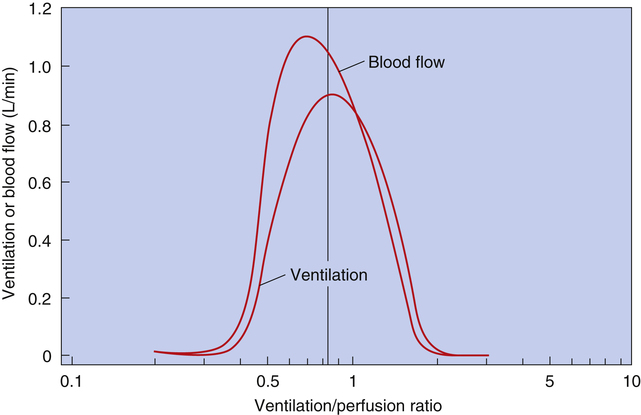
  ), a shuntlike effect is produced. The overall average
  ratio in the normal resting lung is about 0.8, which means ventilation on average is slightly less than blood flow (Figure 6-12). During exercise, the tremendous increase in ventilation causes the
  ratio to increase. (Ventilation-perfusion relationships and their effects on blood gases are discussed in Chapter 12.)


Liquid Movement Across the Alveolar Capillary Membrane
Capillary Fluid Dynamics
Figure 6-13 illustrates hydrostatic and osmotic forces governing fluid movement across pulmonary capillary walls. The pulmonary capillary acts as a semipermeable membrane, freely permeable to water molecules but much less permeable to larger molecules. The capillary endothelial membrane is relatively impermeable to large high-molecular-weight proteins, although the membrane’s leakiness allows some proteins to enter the interstitial space. Large protein molecules create osmotic pressure in solution. The influence of proteins on the osmotic pressure of blood plasma is called oncotic pressure. The greater the protein concentration in blood plasma, the greater the oncotic pressure. One can think of oncotic pressure as a force that “pulls” water molecules from areas of low oncotic pressure into areas of high oncotic pressure. This is the opposite of hydrostatic pressure, a force that “pushes” fluid from high to low pressures.
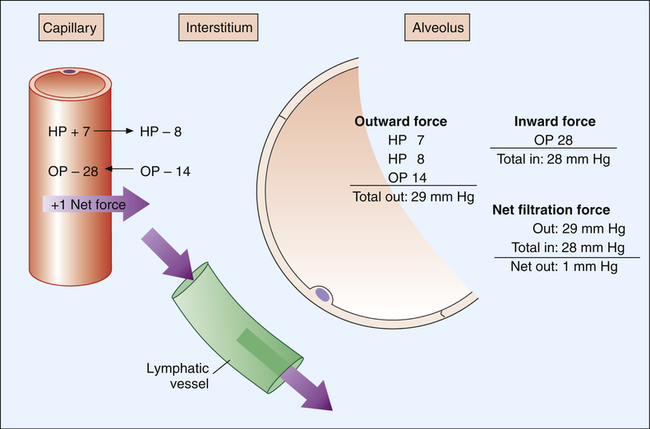
As shown in Figure 6-13, pulmonary capillary hydrostatic blood pressure is about 7 mm Hg, and interstitial hydrostatic fluid pressure is about 8 mm Hg. Interstitial fluid pressure is “negative” because inward alveolar recoil and lymphatic removal of fluid from this area create subatmospheric pressure. The combined effect of interstitial and capillary hydrostatic pressures is a force of 15 mm Hg, which tends to move fluid out of the capillary. Adding to this force is an interstitial oncotic pressure of about 14 mm Hg, which tends to pull fluid out of the capillary into the interstitial space. Hydrostatic and oncotic forces combine for a total of 29 mm Hg, favoring fluid movement out of the capillary into the interstitial space. The only force that moves fluid into the capillary is the blood’s oncotic pressure of about 28 mm Hg. The total force favoring fluid movement out of the capillary is 29 mm Hg, whereas the total force favoring inward movement is 28 mm Hg. This yields a net mean filtration pressure of 1 mm Hg.3
The following Starling equation describes fluid movement across the capillary endothelium:4


This filtration pressure causes a slight amount of fluid to flow continuously from capillaries into interstitial spaces. The lymphatic system, a natural sump for draining interstitial fluid, immediately removes this fluid. Lymphatic action is extremely important for preventing fluid leakage into alveoli; the alveolar epithelium is so thin and weak that positive interstitial pressure can rupture it, allowing fluid to flow into alveoli.3
Pulmonary Edema
Pulmonary edema is the accumulation of fluid in the interstitial spaces between capillaries and alveoli. Causes of pulmonary edema include (1) increased hydrostatic pressure, (2) increased capillary permeability, (3) decreased plasma oncotic pressure, and (4) insufficient lymphatic drainage.3
Increased Hydrostatic Pressure
If hydrostatic pressure in the pulmonary capillary increases enough, fluid filtration into the interstitial space may exceed lymphatic drainage, flooding the interstitial spaces. The interstitial fluid volume cannot increase by much more than 100 mL before alveolar membranes rupture, causing alveolar edema.3 Some fluid enters alveoli even in mild pulmonary edema.
Decreased Plasma Oncotic Pressure
Capillary blood oncotic pressure is the only force favoring fluid retention inside the capillary. If it is abnormally low, fluid easily moves out of the capillary, overwhelming the removal capacity of the lymphatic system (see Figure 6-13). Oncotic pulmonary edema may be caused by protein starvation,∗ blood dilution as a result of overadministration of intravenous fluids (hemodilution), or certain renal diseases that allow urinary protein loss (proteinuria).
Lymphatic Insufficiency
A normal lymphatic system responds to chronic, pathologically elevated capillary pressure by expanding and producing up to a 10-fold increase in lymphatic drainage.3 This response is a large safety factor in chronic conditions that elevate pulmonary
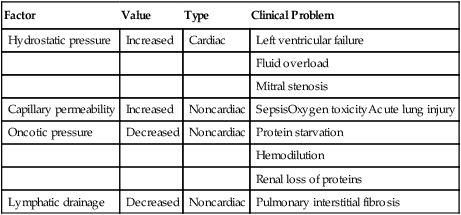
hydrostatic blood pressure, such as mitral valve stenosis. In chronic conditions, capillary pressures may reach 35 to 45 mm Hg without causing significant pulmonary edema, whereas an acute capillary pressure increase to 20 mm Hg normally causes significant edema.3 Table 6-1 summarizes the mechanisms causing pulmonary edema.
TABLE 6-1
| Factor | Value | Type | Clinical Problem |
| Hydrostatic pressure | Increased | Cardiac | Left ventricular failure |
| Fluid overload | |||
| Mitral stenosis | |||
| Capillary permeability | Increased | Noncardiac | SepsisOxygen toxicityAcute lung injury |
| Oncotic pressure | Decreased | Noncardiac | Protein starvation |
| Hemodilution | |||
| Renal loss of proteins | |||
| Lymphatic drainage | Decreased | Noncardiac | Pulmonary interstitial fibrosis |
∗MAP is estimated by doubling diastolic pressure, adding this value to systolic pressure and dividing by 3. (Normal diastolic time is approximately double the systolic time.) In this example, the approximate MAP is calculated as follows: [120 + 2(80)]/3 = 93.3 mm Hg.
[/level-membership-for-pulmolory-and-respiratory-category][not-level-membership-for-pulmolory-and-respiratory-category]Chapter 6
Pulmonary Blood Flow
After reading this chapter, you will be able to:
• Describe how the pulmonary and systemic circulations differ anatomically and functionally
• Explain how blood flow, pressure, and vascular resistance in the pulmonary circulation can be assessed through pulmonary artery catheterization
• Distinguish among causes of high pulmonary artery pressure through data obtained from the pulmonary artery catheter
• Explain how right and left ventricular pumping function can be assessed through pulmonary artery catheterization
• Calculate pulmonary vascular resistance
• Differentiate between passive and active factors that affect pulmonary vascular resistance
• Explain how the pulmonary vasculature can accommodate great increases in blood flow during exercise without significantly increasing blood pressure
• Explain why hypoxemia affects the right ventricle differently than the left ventricle
• Explain how hypoxic pulmonary vasoconstriction can be both beneficial and harmful
• Explain why the hypoxic pulmonary vasoconstriction response is diminished in certain pulmonary diseases
• Explain why inhaled vasodilators can bring about beneficial physiological changes that are not possible through systemic administration routes
• Explain why gravity creates three distinct physiological blood flow zones in the lung, and how they differ physiologically from one another
• Describe how mechanical and physiological changes can convert a blood flow zone in the lung to a different type of zone
• Explain why the match between blood flow and ventilation in an upright individual is different in the lung base than in the lung apex
• Describe the kinds of circulatory abnormalities cause pulmonary edema
cyclic guanosine monophosphate (cGMP)
endothelium-derived relaxing factor (EDRF)
hypoxic pulmonary vasoconstriction (HPV)
persistent pulmonary hypertension of the newborn (PPHN)
pulmonary artery pressure (PAP)
pulmonary capillary wedge pressure (PCWP)
pulmonary vascular resistance (PVR)
systemic vascular resistance (SVR)
ventilation-perfusion ratio (< ?xml:namespace prefix = "mml" />)
Pulmonary Vasculature
The vascular system of the body consists of separate pulmonary and systemic circulations operating in series (Figure 6-1). Each circulation receives its blood from the other; each has its own reservoir, pump, and set of vessels. The right ventricle receives mixed venous blood through the tricuspid valve from its reservoir, the right atrium, and pumps it through the pulmonic valve, which marks the beginning of the pulmonary circulation.1 This relatively deoxygenated blood flows through pulmonary arteries and arterioles to an immense alveolar capillary bed where it is reoxygenated. The capillary bed consists of extremely short, interconnected segments spreading 75 to 100 mL of blood over a 70-m2 area, or about half the size of a tennis court.1 Comroe2 described the capillary bed as two sheets of endothelium held apart in places by posts, similar to an underground parking garage. Rather than flowing through numerous individual tubes (as in systemic capillaries), pulmonary blood flows more like a sheet over the alveoli, maximizing its exposure to alveolar gases. This structural arrangement shortens the distance for oxygen and carbon dioxide diffusion between air and blood to one tenth of the diffusion distance that exists between systemic capillaries and tissue cells.1
After leaving the alveoli, the capillaries converge to form venules and veins. The newly oxygenated blood flows through four major pulmonary veins (two from each lung) into the left atrium, the reservoir for the left ventricle. The pulmonary vein orifices in the left atrial wall mark the end of the pulmonary circulation.1 Blood continues to flow out of the left atrium through the mitral valve into the left ventricle, which pumps the blood through the aortic valve into the aorta. The aortic valve marks the beginning of the systemic circulation. The aorta distributes the oxygenated blood through its many branches to systemic arteries, arterioles, and capillary beds throughout the body, supplying oxygen to tissue cells and removing the carbon dioxide they produce. Beyond the capillary beds, systemic venules and veins converge to return the oxygen-poor blood to the right atrium via the vena cavae, which mark the end of the systemic circulation.
The total cardiac output () is simultaneously pumped through both circulations each minute. Right and left ventricular outputs must be essentially equal over time; otherwise, blood would accumulate in one of the circulations. Small differences in outputs may occur briefly for a few heartbeats, but over time, individual ventricular outputs are equal in healthy hearts. Figure 6-1 illustrates pulmonary and systemic circulations with their associated pressures.
The pulmonary arteries and arterioles have much thinner walls and less smooth muscle than systemic arteries and arterioles. Therefore, pulmonary arterioles cannot constrict as effectively as systemic arterioles. Pulmonary veins and venules also have sparse smooth muscle, differing little in structure from pulmonary arteries and arterioles. Pulmonary arteries generally follow a course parallel with bronchi, whereas pulmonary veins leave the lung through different routes. Without this anatomical difference, distinguishing pulmonary arteries from veins on a chest x-ray image would be difficult because of their structural similarities.2
Bronchial Vasculature
The supporting tissues of the tracheobronchial tree, including airways down through the terminal bronchioles, are supplied with oxygenated blood through the systemic bronchial arteries. (See the section on blood supply to the lungs in Chapter 1.) Bronchial systemic venous blood drains directly into the pulmonary veins, mixing oxygen-poor blood with freshly oxygenated pulmonary venous blood on its way to the left ventricle.3 Bronchial blood flow is only 1% to 2% of the cardiac output, which means that the anatomical shunt from this source is usually less than 2%; this also means that left ventricular output is about 1% to 2% greater than right ventricular output.3
Pulmonary and Systemic Pressures
Figure 6-1 shows that the pulmonary circulation is a low-pressure, low-resistance system compared with the systemic circulation. The lower resistance in the pulmonary circulation is manifested by the fact that its pressures are lower even though it receives the same cardiac output as the systemic circulation receives. The resistance to blood flow in the pulmonary circulation is about one tenth as great as it is in the systemic circulation.1
Blood flow through the pulmonary circulation is highly pulsatile rather than continuous as in systemic capillaries. The total volume of blood in the pulmonary circulation is about 450 mL, which is only 9% of the total circulating blood volume. About 70 mL of this blood is in the capillaries at any given moment; the rest is distributed equally between pulmonary arterial and venous vessels.3 The capillary blood volume of 70 mL is about equal to the volume ejected by the right ventricle with each contraction (the right ventricular stroke volume). Pulmonary capillary blood is thus almost completely replaced with each heartbeat, which means a red blood cell travels through the capillaries in about 0.75 second. Pulmonary blood flow almost stops between each ventricular beat, which explains its pulsatile nature.1,3
Clinical Measurement of Pulmonary Blood Pressures and Flows
Measurement of Pulmonary Blood Pressures
Systemic blood pressure is easily measured by simple noninvasive means. However, measurement of pressures in the pulmonary circulation requires an invasive procedure called pulmonary artery catheterization. The special catheter used for this purpose was the subject of a study published in 1970 by Swan, Ganz, and others. Since then, the catheter has been marketed under the brand name Swan-Ganz, and the term Swan-Ganz catheter has become synonymous with pulmonary artery catheter. This catheter is a very thin, multilumen flexible tube with a balloon located at its distal end. The balloon can be inflated through a separate channel inside the catheter. The catheter contains at least two additional internal channels: the distal channel, leading to an opening at the tip of the catheter, and the proximal channel, leading to an opening located several centimeters back from the tip. Pressures can be measured or blood can be withdrawn through these channels via the proximal and distal ports of the catheter (Figure 6-2).
A physician inserts the catheter under surgically sterile conditions, sometimes at the bedside of a critically ill patient in a hospital intensive care unit. Proximal and distal channels are first filled with sterile fluid to remove all air; the catheter is then inserted into a large systemic vein, usually the right internal jugular or subclavian vein, and advanced until the tip enters the right atrium. At this point the balloon is inflated, allowing the bloodstream to direct the catheter tip across the tricuspid valve into the right ventricle—hence, the term flow-directed, balloon-tipped catheter. The physician advances the catheter until the bloodstream carries it through the pulmonic valve and into the pulmonary artery (Figure 6-3). During insertion, pressures at the catheter tip are continuously recorded by an electronic pressure transducer connected to the distal port. The stationary fluid column inside the distal channel reflects these pressures precisely because it is in direct contact with the blood at the catheter’s tip. The pressure waveforms are continuously displayed on the bedside monitor as the catheter is advanced; this helps the physician identify the position of the catheter tip because each cardiovascular structure produces unique pressure waveforms (Figure 6-4, A and B).
When the catheter is advanced far enough to wedge in a small branch of the pulmonary artery, the inflated balloon completely blocks blood flow to the downstream vessels supplied by that artery (see Figure 6-3, dotted circle). The pressure measured from the catheter tip in this wedged position is called the pulmonary capillary wedge pressure (PCWP). (When the balloon is deflated, flow resumes, and the catheter tip simply measures the pulmonary artery pressure [PAP].) The vessels extending beyond the artery blocked by the inflated balloon are in direct communication with the pulmonary capillaries and the pulmonary veins. Pulmonary venous pressure is nearly equal to left atrial pressure (LAP), which is essentially equal to left ventricular end-diastolic pressure (LVEDP), the pressure inside the filled ventricle just before it contracts (see Figure 6-3). This so-called filling pressure is also known as preload of the left ventricle. The PCWP is only slightly greater than the filling pressure of the left ventricle.3 The PCWP accurately reflects changes in LAP (or ventricular filling pressure) because the stationary fluid column inside the catheter is functionally extended from the catheter tip to the left atrium. For this reason, the PCWP is commonly used to assess the pumping function of the left ventricle. For example, if the left ventricle fails to contract with normal force, blood flowing into it dams up in the left atrium, pulmonary veins, and capillaries; consequently, the PCWP increases. In certain rare circumstances, the PCWP might not accurately reflect left atrial pressure: (1) if the pulmonary veins constrict and downstream resistance beyond the catheter tip increases or (2) if the catheter tip is in an area in the lung where alveolar pressure exceeds pulmonary venous pressure, as might occur in positive pressure mechanical ventilation. In the latter instance, high alveolar pressure compresses capillaries distal to the catheter tip, blocking its communication with the left atrium.
The pulmonary artery catheter also can be used to assess right ventricular preload and pumping function because the proximal channel (see Figure 6-2) communicates with the right atrium. The pressure measured at the catheter’s proximal port reflects right atrial pressure (RAP), sometimes called central venous pressure (CVP).
Blood drawn from the proximal channel is a mixture of superior and inferior vena cava venous blood. Because oxygen contents of these two sources may differ considerably, proximal channel blood is not a clinically acceptable mixed venous blood sample for purposes of measuring the average venous oxygen content of the body. A thoroughly mixed venous blood sample reflecting the true average venous oxygen content of the body must be obtained from the pulmonary artery, through the distal channel of the catheter (see Figure 6-2). By comparing the oxygen content of mixed venous blood with the oxygen content of systemic arterial blood, the oxygen consumption of the body can be assessed. (This is discussed in Chapters 8 and 12.)
clinician can evaluate right and left ventricular function, differentiate the causes of increased PAP, and assess the risk of pulmonary edema. PAP might be increased because of excessive blood volume (hypervolemia) or because of left ventricular pumping failure in which blood dams up in the entire pulmonary circulation. The PAP might also be increased as a result of increased pulmonary vascular resistance (PVR). Increased pressures in either ventricle at the end of diastole, coupled with a low cardiac output, signal a loss of ventricular pumping ability, or a loss of contractility. Increased PCWP, regardless of the cause, means that the pulmonary capillaries are engorged with blood, increasing the likelihood that fluid will be forced into interstitial lung spaces and cause pulmonary edema. Understanding these relationships is essential for taking appropriate therapeutic actions.
Measurement of Pulmonary Blood Flow or Cardiac Output
The amount of blood the heart pumps each minute can be clinically measured with a pulmonary artery catheter via a thermodilution technique. In this method, a known volume of room temperature fluid (e.g., saline) is rapidly injected into the right atrium through the proximal injection port (see Figure 6-2). This volume of cool fluid rapidly flows into the right ventricle where it is pumped into the pulmonary artery. A temperature-sensing thermistor near the end of the catheter (see Figure 6-2) in the pulmonary artery records a sudden decrease in temperature as the bolus of cool saline passes by. If cardiac output is increased, blood temperature rapidly returns to its original value; if it is decreased, the temperature increases more slowly to the original value. A microprocessor receives information from the thermistor and computes the area under the temperature-time curve. The area under the curve is small for rapid blood flow and large for slow blood flow. The microprocessor uses the area under the curve and the volume of the injected fluid to compute the blood flow rate, or the cardiac output (). Several determinations of cardiac output can be made within minutes in this fashion.
Pulmonary Vascular Resistance
Calculation of Pulmonary Vascular Resistance
A pressure of 1.2 mm Hg is needed to produce a flow of 1 L per minute through the pulmonary circulation. In classic physics, pressure is measured in dynes per square centimeter (force per unit of area), and blood flow is measured in milliliters per second (cubic centimeters per second). Using these measurement units, PVR is calculated as follows:2
[/not-level-membership-for-pulmolory-and-respiratory-category]
