[level-membership-for-critical-care-medicine-category]
44 Principles of Gas Exchange
 Oxygen Exchange

Except in extreme conditions under which Hb is unable to bind O2 (e.g., carbon monoxide intoxication, methemoglobinemia) or under which very severe anemia limits the amount of O2 that can bind to Hb, dissolved O2 accounts for a very small percentage of the total.1 In fact, Hb is such an effective carrier for O2 that the quest to develop an effective blood substitute for clinical use has been only partially successful. Intravascularly delivered products based on stroma-free Hb (an avid oxygen binder) and perfluorocarbon (an efficient dissolver of oxygen) are potentially effective but have encountered problems with stability, toxicity, and cost.2 For the present, blood substitutes must be considered impractical for the clinical setting.
Oxygen Delivery
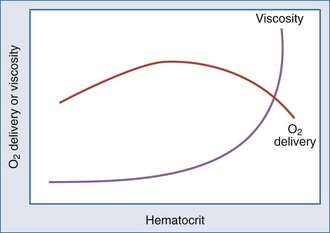
Metabolizing tissues require an adequate supply of oxygen to efficiently produce the energy needed for cellular function. The quantity of oxygen loaded onto the arterial bloodstream per unit time (O2 delivery) is the product of the cardiac output and the oxygen contained within each milliliter of blood. Therefore, a deficiency of either cofactor can be partially offset by a compensatory increase of the other. Conversely, sluggish blood flow, whether caused by low cardiac output or high resistance through the tissues, can limit the O2 actually delivered to the cell. Increased blood viscosity impedes the transit of erythrocytes through the capillary bed, tending to limit oxygen consumption (VO2).3 For this reason, paraproteinemia, extreme leukocytosis, and polycythemia can pose life-threatening challenges to O2 consumption that are independent of any impact on cardiac output.3 Studies performed in animal models demonstrate that hematocrit (Hct), a primary determinant of viscosity, bears a nonlinear relationship to oxygen delivery that varies somewhat with circulating blood volume.4 At low values of Hct, a rising Hb concentration predictably adds to O2 content and delivery. Above a Hct of 30% to 34%, however, it is difficult to demonstrate in critically ill patients an increase in oxygen consumption or an outcome benefit that derive from increases of O2 content arising from further increments of Hb.5 At an Hct of around 55% to 57%, O2 delivery reaches its maximum in normal subjects, falling sharply with each further rise in Hct (Figure 44-1). Above an Hct of approximately 65%, phlebotomy may be required to avert a hemodynamic crisis, as vital tissues may be deprived of delivered oxygen. Viscosity, and therefore tolerance for higher Hct, is partially determined by the circulating blood volume; the polycythemia associated with intravascular volume contraction is much less well tolerated than that of polycythemia vera, a condition in which circulating blood volume is expanded.3 As might be expected, patients with vascular disease are less tolerant to the adverse rheologic effects of high Hct.
At the mitochondrial level, oxygen acts as the terminal acceptor in a chain of organic electron donors known as cytochromes. The PO2 within the mitochondrion needed to sustain this process is very low—estimated to be much less than 1 mm Hg.6 To provide that needed level of mitochondrial oxygen tension, an appropriate oxygen diffusion gradient must be established from the arterial blood, across tissue and cellular boundaries, and into the cellular organelles. At sea level, normal levels of mitochondrial O2 are achieved at a PaO2 of about 95 mm Hg. The actual PO2 within the mitochondrion, however, is affected by many factors other than arterial PO2: tissue metabolic rate, microvascular control, tissue properties, and blood flow. Over time, varying degrees of accommodation to subnormal PaO2 occur by adjustments of the cardiovascular system, Hb concentration, capillary system, and mitochondrial density.7 Although this adaptive phenomenon is commonly observed in patients with chronic lung diseases, the extent to which gradual accommodation to hypoxemia can occur and should be encouraged in patients who are critically ill is a provocative and largely unexplored question.
Oxygen Transfer Across the Lung
Low FIO2 is an important mechanism of hypoxemia occurring at altitude and in fires that occur in confined spaces. Although the relationship is not a strictly linear function, as a rough estimate, inspired O2 declines approximately 15 mm Hg for each 1000 meters of altitude above sea level.8 For practical purposes, however, a reduced concentration of inspired oxygen does not account for hypoxemia that occurs in the setting of critical illness. Hypoventilation alters the alveolar oxygen tension (PAO2) in proportion to the rise of PaCO2 (and PACO2) and becomes an important factor when it occurs during breathing of room air (as in narcotic overdose) or of relatively low inspired concentrations of supplemental oxygen (e.g., via nasal cannulae). The importance of impaired diffusion as a hypoxemic mechanism is sometimes debated, since the transfer of O2 from alveolus to Hb usually requires only a brief time for completion—somewhat less than the normal transit time of the erythrocyte through the capillary.9 Yet under many conditions that are commonly encountered, fewer capillaries are available to accept the cardiac output, so the rate at which blood flows through the lung is accelerated. Simultaneously, diffusion distances are lengthened, and the driving gradient is reduced by disease. For this reason, impaired diffusion is likely to contribute to hypoxemia occurring in the stressed patient with critical illness who receives near-normal FIO2.
Whereas the relationship of FIO2 to PaO2 is more or less linear for the first three oxygen-responsive mechanisms already covered, the response to oxygen supplementation for V/Q imbalance depends on the distribution of abnormal V/Q units contributing to the problem.10 Hypoxemia due to a relatively small number of lung units with very low V/Q characteristics may not respond noticeably to supplemental oxygen unless a very high FIO2 is employed. Conversely, a lung comprised predominantly of lung units with mild V/Q impairment tends to respond in more linear fashion (Figure 44-2). It is also possible to convert very poorly ventilated lung units into airless, unventilated units with inspired gas having a very high FIO2, owing to replacement of unabsorbable nitrogen with diffusible oxygen, leading to the unit’s contraction and eventual collapse as this process continues below the closing volume of the compromised region (absorption atelectasis).11 Unless compensation by hypoxic vasoconstriction is complete, raising FIO2 can paradoxically increase shunt even as it improves O2 transfer in units that remain patent.
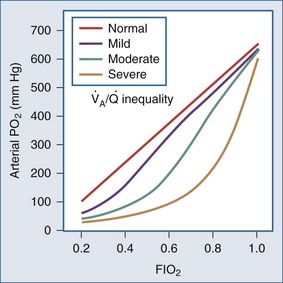
Figure 44-2 Influence of severity of ventilation/perfusion inequality on the FIO2/arterial PO2 relationship.
Given the importance of matching blood flow to ventilation, it is not surprising that several mechanisms have developed to effect pulmonary microvascular regulation. Autonomic control, although less prominent and less precise than in the peripheral vasculature, is important nonetheless. Severe head injury, for example, can cause dysregulation and hypoxemia via this mechanism.12 Local acidosis, such as that existing in poorly ventilated areas, tends to vasoconstrict the pulmonary arterial microvessels. The strength of this reflex, however, pales before that of hypoxic pulmonary vasoconstriction, which for most individuals is a well-developed protection against the consequences of perfusing underventilated areas.13 These mechanisms may be overpowered by pathologic processes or by pharmacologic interventions. For example, local release of inflammatory mediators or use of certain vasoactive drugs (e.g., nitroprusside) may counter these protective reflexes,14 and an abrupt rise of pulmonary artery pressure may overwhelm them.
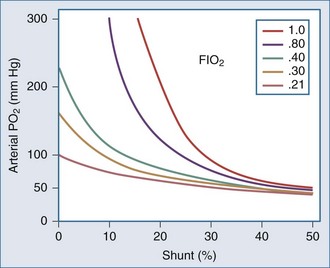
Shunting occurs when systemic venous blood is not brought into close proximity with the inspired gas. Shunt can originate in the heart (e.g., through a patent communication at the atrial or ventricular level). Rarely, direct venous-to-arterial transfer occurs through micro- or macrovascular defects known as pulmonary arteriovenous fistulae. Such communications are encountered in relatively common diseases such as hepatic cirrhosis as well as in other settings, exemplified by the heritable Osler-Weber-Rendu abnormality. Diseases that affect the lung parenchyma are much more common causes of shunt than these cardiovascular disorders. Filling of the airspaces with fluid (e.g., edema) or cellular infiltrate (e.g., pneumonia) prevents effective gas-blood interchange. Inflammatory conditions may inhibit hypoxic vasoconstriction, worsening arterial hypoxemia, as does hypocapnic alkalosis.15 Collapse of lung units may occur on any anatomic scale, resulting in shunt through the affected regions. Causes for collapse vary from compression (e.g., by a pleural effusion), to disease-induced surfactant depletion or inactivation, to airway plugging, such as by retained secretions or a misplaced endotracheal tube. Sustained reversal of atelectasis requires attention to the inciting cause as well as recruitment of the problem area by deep lung expansion. Pure oxygen breathing will not improve hypoxemia due to shunting. Conversely, reduction of FIO2 will not cause shunt-related hypoxemia to worsen and may spare ventilated areas the exposure to potentially toxic concentrations of inspired O2 (Figure 44-3).
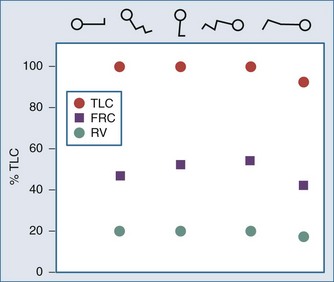
Modification of body position may dramatically affect shunting and blood oxygenation when the lungs are injured, especially when disease is asymmetrically distributed. Prone positioning routinely improves oxygen exchange by altering the distribution of transpulmonary pressure as it modifies chest wall compliance and allows the heart to sink to a dependent position that does not compress the lungs. The dorsal lung zones, which are generally the best perfused, tend to reopen when prone. Drainage of secretions and lymphatic efficiency may also improve (Figure 44-4).
 with a fiberoptic Swan-Ganz catheter enable venous desaturation to be detected and monitored.
Venous oxygen saturation is a clinical tool to evaluate the relationship between oxygen uptake and delivery for the whole body. In the absence of pulmonary artery catheter–derived mixed venous oxygen saturation ( ), the central venous oxygen saturation (ScvO2) is increasingly being used as an imprecise but convenient surrogate measure. Central venous catheters are simpler to insert, less expensive, and associated with fewer complications than pulmonary artery catheters. Blood sampling through central venous catheters allows measurement of ScvO2 or even continuous monitoring if a fiberoptic oximetric catheter is used. The normal range for
  is 68% to 77%, and ScvO2 is considered to be approximately 5% above these values.16,17
 (or Scv
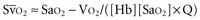
 are linked by a simple equation:

In human studies, dysoxia is usually present when  falls below 45%. Tissue oxygen privation may occur at higher levels of
  when oxygen extraction is impaired. Ideally, efforts to boost cardiac output (by intravenous fluids or inotropes), Hb, and/or arterial oxygen saturation return
  to levels above 65% (or ScvO2 to ≥70%).16,18
Relationship of PO2 to Blood O2 Content
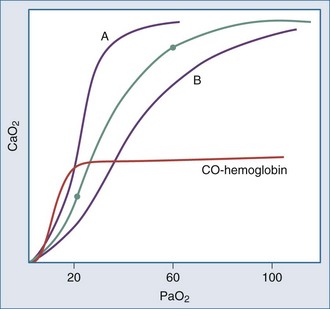
Even though the oxyhemoglobin dissociation relationship is implicitly used for clinical decision making, there are important nuances (Figure 44-5). Over the clinically relevant range, the oxyhemoglobin dissociation curve is highly nonlinear, so that a drop of a few percentage points in SaO2 over the 95% to 100% interval reflects a much larger change in PaO2 than does a similar decrement that occurs over the 80% to 85% interval. Pulse oximeters record the relative absorption of light by oxyhemoglobin and deoxyhemoglobin. For a fixed value of Hb, the O2 saturation parallels its relative O2 content, but a high saturation guarantees neither its total O2 content nor the adequacy of tissue O2 delivery. For example, a patient may have a “full” SaO2 after inhaling a high concentration of carbon monoxide, and yet directly measuring arterial oxygen content per deciliter of blood (e.g., using a co-oximeter) may demonstrate profound arterial O2 depletion (see Figure 44-5). Moreover, a patient in circulatory shock may maintain a perfectly normal SaO2 despite serious O2 privation. Because cyanide blocks the uptake of oxygen by the tissues, O2 consumption is low in cyanide poisoning, even though arterial and mixed venous saturations are normal or increased. It is occasionally forgotten that arterial oxygen saturation bears no direct relationship to the adequacy of ventilation; a patient breathing a high inspired concentration of oxygen will maintain a nearly normal SaO2 for a brief period in the face of a full respiratory arrest.
Controversy has surrounded the concept of supply dependency of oxygen consumption for patients who have sustained trauma, massive surgery, or sepsis. Prognosis in these conditions is somewhat better for critically ill patients in whom higher oxygen delivery is manifest. By inference, it has been suggested that in these settings, supranormal oxygen delivery is needed to satisfy the oxygen demands of key vital organs. There is little doubt that prompt and vigorous resuscitation must be carried out, or that patients who do not spontaneously generate sufficient oxygen delivery or who cannot extract oxygen effectively have a worse prognosis than other patients undergoing the same stress who do. But it is inappropriate to sustain oxygen delivery at supranormal values in critically ill patients. Some data even suggest potential harm.18
A multicenter Italian trial demonstrated that aggressive fluid administration toward supranormal values for oxygen delivery conferred no routine benefit for patients in the medical/critical care unit.19 For nonmoribund patients with sepsis and/or acute respiratory distress syndrome (ARDS), supply dependency may not, in fact, exist. Therefore, without better evidence, maximizing oxygen delivery cannot be accepted as a goal for circulatory support in patients admitted to the ICU. An often cited study of patients in septic shock provides strong evidence in support of aggressive, early resuscitation in improvement of outcome. This trial was directed at early normalization of central venous oxygen saturation rather than a supranormal physiologic response.20
Two studies emanating from a large National Institutes of Health (NIH)-sponsored multicenter trial provide additional data in regard to fluid resuscitation and end-organ function. In the first, fluid management protocols compared the impact of central venous versus pulmonary artery catheter monitoring in patients sustaining acute lung injury.17 Mortality in the first 60 days was similar in patients whose fluid management was guided by data from central venous and pulmonary arterial catheters. Pulmonary artery catheter–guided therapy did not improve outcomes for patients in shock at the time of enrollment in the study. There were no differences between groups in renal or pulmonary function or the use of other end-organ support. Patients receiving pulmonary artery catheterization experienced approximately twice as many catheter-related complications (mainly arrhythmias). In the second article from this seminal study, conservative and liberal strategies for fluid management were compared in patients with acute lung injury. In this trial, the difference in fluid administration was approximately 7 liters over 7 days. The rate of death at 60 days was comparable between patients receiving a conservative fluid administration strategy and a more liberal fluid administration strategy. Conservative fluid management was associated with improved pulmonary function, reduced duration of mechanical ventilation, and shorter ICU stay. These outcomes were achieved without increasing the incidence or severity of nonpulmonary organ failure.21
Assessing the Efficiency of Oxygen Exchange


For example, at sea level with a normally ventilated patient breathing room air:
Alveolar-Arterial Oxygen Tension Difference P(A-a)O2
The difference between alveolar and arterial oxygen tensions, P(A-a)O2, takes account of alveolar CO2 tension, thereby eliminating hypoventilation and hypercapnia from consideration as the sole cause of hypoxemia. However, a single value of P(A-a)O2 does not characterize the efficiency of gas exchange across all FIO2 values—even in normal subjects. The P(A-a)O2 normally ranges from approximately 10 mm Hg (on room air) to approximately 100 mm Hg (on an FIO2 of 1.0). Moreover, PAO2 changes nonlinearly with respect to FIO2 as the extent of V/Q mismatch increases. Thus, when the V/Q abnormality is severe and nonhomogeneously distributed among gas exchanging units, the PAO2 may vary little with FIO2 until high fractions of inspired oxygen are given (see Figure 44-2). Finally, the P(A-a)O2 may be influenced by fluctuations in venous oxygen content.
Simplified Measures of Oxygen Exchange
Several pragmatic approaches have been taken to simplify bedside assessment of O2 exchange efficiency. The first is to quantitate P(A-a)O2 during the administration of pure O2. After a suitable wash-in time (5-15 minutes depending on the severity of the disease), shunt (uncontaminated by V/Q mismatch) accounts for the entire P(A-a)O2. Furthermore, if Hb is fully saturated with O2, dividing the P(A-a)O2 by 20 approximates shunt percentage (at FIO2 = 1). As pure O2 replaces alveolar nitrogen, some patent but poorly ventilated units may collapse—the process of absorption atelectasis.11 Moreover, because shunt percentage is affected by changes in cardiac output and mixed venous O2 saturation, these simplified measures may give a misleading impression of changes within the lung itself.
 and does not remain equally sensitive across the entire range of F
 (Hb and the balance between oxygen consumption and delivery).
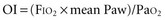
 Carbon Dioxide Exchange
Physiologic Effects of CO2
The adrenergic stimulation that accompanies acute hypercapnia causes cardiac output to rise and peripheral vascular resistance to increase. During acute respiratory acidosis, these effects may partially offset those of hydrogen ion on cardiovascular function, allowing better tolerance of lower pH than with metabolic acidosis of a similar degree. Constriction of glomerular arterioles also occurs by adrenergic stimulation, producing oliguria in some patients. Plethora, diaphoresis, muscular twitching, asterixis, and seizures may be observed at extreme levels of hypercapnia in patients made susceptible by electrolyte or neural disorders. Prompted by a favorable experience with “permissive hypercapnia” on important clinical outcomes of life-threatening asthma22 and ARDS,23 considerable attention has been directed toward the beneficial actions of CO2 as an antioxidant and antiinflammatory agent.24,25 It is conceivable that in selected circumstances, hypercapnia may not only be acceptable but desirable.
The major cardiovascular effects of acute hypocapnia relate to alkalosis and diminished cerebral blood flow.26 Abrupt lowering of PaCO2 reduces cerebral blood flow and raises neuronal pH, altering cortical and peripheral nerve function. Lightheadedness, circumoral and fingertip paresthesia, and muscular tetany can result in this setting. Rarely, sudden major reductions of PaCO2 (e.g., shortly after initiating mechanical ventilation) produce life-threatening arrhythmias and seizures, especially in those patients with elevated levels of serum bicarbonate. Because of the importance of adrenergic compensation for the vasodilatory effects of hypercapnic acidosis, hemodynamic manifestations of acute hypercapnia are more profound in the presence of β- and/or α-adrenergic blockade.
CO2 Production and Storage
 usually ranges between 50 and 75%).
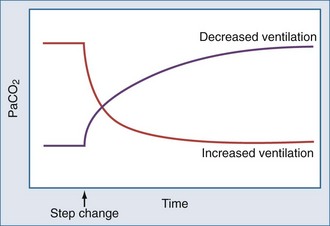
Carbon dioxide stores are held in several forms (dissolved, bound to protein, fixed as bicarbonate) and distributed in compartments that differ in their volumetric capacity and ability to exchange CO2 rapidly with the blood.27 Well-perfused organs constitute a small reservoir for CO2 that is capable of quick turnover; skeletal muscle is a larger compartment with sluggish exchange, and bone and fat are high capacity chambers with very slow filling and release. From a practical point of view, the existence of large CO2 reservoirs with different capacities and time constants of filling and emptying means that equilibration to a new steady-state PaCO2 after a step change in ventilation (assuming a constant rate of CO2 production, VCO2) takes longer than generally appreciated—especially for step reductions in alveolar ventilation (Figure 44-6). With such a large capacity and only a modest rate of metabolic CO2 production, the CO2 reservoir fills rather slowly, so that PaCO2 rises only 6 to 9 mm Hg during the first minute of apnea and 3 to 6 mm Hg each minute thereafter. Depletion of this reservoir can occur at a considerably faster rate.
 ) and the expired fraction of CO2 in the expelled gas. If gas collection is timed accurately and the sample is adequately mixed and analyzed, an accurate value for excreted CO2 can be obtained. However, whether this value faithfully represents metabolic CO2 production depends on the stability of the patient during the period of gas collection—not only with regard to VO2, but also in terms of acid-base fluctuations, perfusion constancy, and ventilation status with respect to metabolic needs. During acute hyperventilation or rapidly developing metabolic acidosis, for example, the rate of CO2 excretion overestimates metabolic rate until surplus body stores of CO2 are washed out or bicarbonate stores reach equilibrium. The opposite situation occurs during abrupt hypoventilation or transient reduction in cardiac output.
Efficiency of CO2 Exchange
The volume of CO2 produced by the body tissues varies with metabolic rate (and is affected by conditions such as fever, pain, agitation, and sepsis). In the mechanically ventilated patient, many vagaries of CO2 flux can be eliminated by controlling ventilation and quieting muscle activity with deep sedation with or without paralysis. PaCO2 must be interpreted in conjunction with the  . For example, the gas exchanging ability of the lung may be unimpaired even though PaCO2 rises when reduced alveolar ventilation is the result of diminished respiratory drive or marked neuromuscular weakness. As already noted, alveolar and arterial CO2 concentrations respond quasi-exponentially after step changes in ventilation, with a half-time of about 3 minutes during hyperventilation, but a slower half-time (16 minutes) during hypoventilation.28 These differing time courses should be taken into account when sampling blood gases after making ventilator adjustments.
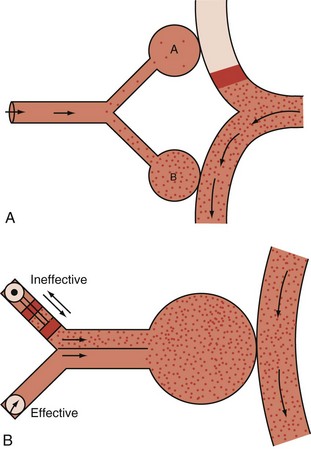
Dead Space
The physiologic dead space (VD) refers to the “wasted” portion of the tidal breath that fails to participate in CO2 exchange. A breath can fail to accomplish CO2 elimination either because fresh (CO2-free) gas is not brought to the alveoli or because fresh gas fails to contact systemic venous blood. Thus, tidal ventilation is wasted whenever CO2-laden gas is recycled to the alveoli with the next tidal breath. Alternatively, a portion of the tidal volume is wasted if fresh gas distributes to inadequately perfused alveoli so that CO2-poor gas is exhausted during exhalation (Figure 44-7). If this concept is understood, it becomes clear why VD should not be considered as a composite of physical volumes. Nonetheless, wasted ventilation traditionally is characterized as the sum of the “anatomic” (or “series”) dead space, and the “alveolar” dead space. Because the airways fill with CO2-containing alveolar gas at the end of the tidal breath, the physical volume of the airways corresponds rather closely to their contribution to wasted ventilation (the series or “anatomic” dead space) provided that mixed alveolar gas is similar in composition to the gas within a well-perfused alveolus. This is almost true for a quietly breathing normal subject in whom the alveolar dead space (poorly perfused alveolar volume) is very small. When the lung parenchyma is well aerated and well perfused, the anatomic dead space is relatively fixed at approximately 1 mL per pound (0.4 kg) of body weight.29 Of note, patients with endotracheal tubes and tracheostomies have less series dead space, while those with attached breathing apparatus may have more.
Dead-Space Fraction
In healthy persons, the normal VD/VT during spontaneous breathing varies from roughly 0.35 to 0.15, depending on the factors noted earlier (e.g., position, exercise, age, tidal volume, pulmonary capillary distention, breath holding). In the setting of critical illness, however, it is not uncommon for VD/VT to rise to values that exceed 0.7. Indeed, increased dead-space ventilation usually accounts for most of the increase in the  requirement and CO2 retention that occur in the terminal phase of acute hypoxemic respiratory failure. High and increasing dead-space values may portend an adverse outcome in ARDS.30 Conversely, improving dead space has been reported as a propitious sign in prone positioning.31 In addition to pathologic processes that increase dead space, changes in VD/VT occur during periods of hypovolemia or overdistention by high airway pressures. This phenomenon often is apparent when progressive levels of PEEP are applied to support oxygenation. Conversely, recruitment of functioning lung tissue tends to reduce the dead-space fraction. Examination of the airway pressure tracing under conditions of controlled, constant inspiratory flow ventilation may demonstrate concavity or a clear point of upward inflection, indicating overdistention, accelerated dead-space formation, and escalating risk of barotrauma. Small reductions in PEEP or tidal volume may then dramatically reduce peak cycling pressure and VD/VT.

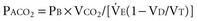
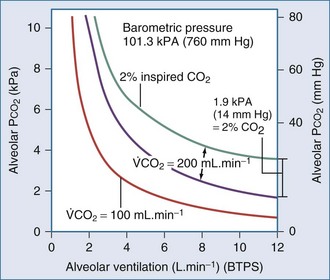
Here PACO2, VA and PB refer to alveolar PCO2, alveolar ventilation, and barometric pressure, respectively. In view of the hyperbolic relationship of PaCO2 to alveolar ventilation (Figure 44-8), it can be understood that relatively small changes of effective ventilation can profoundly influence PaCO2 and pH when alveolar ventilation is low and PaCO2 is high. Once PaCO2 has climbed to approximately double its normal value, fluctuations of pH and PaCO2, with their attendant adverse effects on hemodynamics and pulmonary artery pressure, place the critically ill patient at increased risk. Moreover, ventilatory drive is blunted when PaCO2 values are increased, while small changes in ventilation may cause PaCO2 to plummet. In the context of increased PaCO2, it is interesting to consider tracheal gas insufflation (TGI), a novel technique in which fresh gas is injected near the carina so as to wash the proximal airway free of carbon dioxide during exhalation and thereby improve ventilation efficiency with little effect in inspiratory airway pressure.32 In the setting of extreme hypercapnia, the ordinarily small improvement in alveolar ventilation that TGI affords proves valuable in reducing PaCO2 and its attendant consequences.
Monitoring of Exhaled Gas
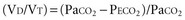
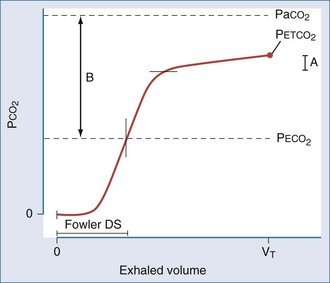
When plotted against a volume axis, as opposed to the more commonly encountered time axis, the capnogram offers data of considerable clinical value. Inspection of such tracings can yield estimates for the “anatomic” (Fowler) dead space, as well as for the end-tidal and mixed expired CO2 concentrations (Figure 44-9). Knowing the barometric pressure, the mixed expired value can be expressed as a percentage of the exhaled volume, which is also immediately available from the tracing. If the VT remains constant, the product of the PECO2 : PB ratio and  is the VCO2, and the mixed expired CO2 concentration can be used in the Enghoff-modified Bohr equation to estimate the physiologic dead-space fraction.
 and breathing pattern (f, V
Key Points
Pontoppidan H, Geffin B, Lowenstein E. Acute respiratory failure in the adult. Parts 1-3. N Engl J Med. 1972;287:690-698. 743-52; 799-806
West JB. State of the art: ventilation-perfusion relationships. Am Rev Respir Dis. 1977;116:919-943.
Gattinoni L, Brazzi L, Pelosi P, et al. A trial of goal-oriented hemodynamic therapy in critically ill patients. SvO2 Collaborative Group. N Engl J Med. 1995;333:1025-1032.
Rivers E, Nguyen B, Havstad S, et al. Early goal-directed therapy in the treatment of severe sepsis and septic shock. N Engl J Med. 2001;345:1368-1377.
Laffey JG. Protective effects of acidosis. Anaesthesia. 2001;56:1013-1014.
Nuckton TJ, Alonso JA, Kallet RH, et al. Pulmonary dead-space fraction as a risk factor for death in the acute respiratory distress syndrome. N Eng J Med. 2002;346:1281-1286.
1 Pontoppidan H, Geffin B, Lowenstein E. Acute respiratory failure in the adult. N Engl J Med. 1972;287(14):690-698. Part 2. 287(15):743-752; Part 3. 287(16):799-806 Part 1
2 Winslow RM. Alternative oxygen therapeutics: Products, status of clinical trials, and future prospects. Curr Hemat Rep. 2003;2(6):503-510.
3 Becker RC. Seminars in thrombosis, thrombolysis, and vascular biology. Part 5: Cellular rheology and plasma viscosity. Cardiology. 1991;79(4):265-270.
4 Murray JF, Escobar E, Rapaport E. Effects of blood viscosity on hemodynamic responses in acute normovolemic anemia. Am J Physiol. 1969;216(3):638-642.
5 Lorente JA, Landin L, DePablo R, et al. Effects of blood transfusion on oxygen transport variables in severe sepsis. Crit Care Med. 1993;21(9):1312-1318.
6 Connett RJ, Honig CR, Gayeski TE, Brooks GA. Defining hypoxia: A systems view of VO2, glycolysis, energetics, and intracellular PO2. J Appl Physiol. 1990;68(3):833-842.
7 West JB. Tolerance to severe hypoxia: Lessons from Mt. Everest. Acta Anaesthesiol Scand Suppl. 1990;94:18-23.
8 Schoene RB. Adaptation and maladaptation to high altitude. Chapter 45 in Textbook of Pulmonary diseases. Baum GI, Crapo JD, Celli BR, Karlinsky JB, editors. 6th ed. Lippincott Raven: Philadelphia; 1998:883-900.
9 Staub NC. Alveolar-arterial oxygen tension gradient due to diffusion. J Appl Physiol. 1963;18:673-680.
10 West JB. State of the art: Ventilation-perfusion relationships. Am Rev Respir Dis. 1977;116(5):919-943.
11 Dantzker DR, Wagner PD, West JB. Instability of lung units with low Va/Q ratios during O2 breathing. J Appl Physiol. 1975;38(5):886-895.
12 Schumacker PT, Rhodes GR, Newell JC, et al. Ventilation-perfusion imbalance after head trauma. Am Rev Respir Dis. 1979;119(1):33-43.
13 Morrell NW, Nijran KS, Biggs T, Seed WA. Magnitude and time course of acute hypoxic pulmonary vasoconstriction in man. Respir Physiol. 1995;100(3):271-281.
14 Colley PS, Cheney FW. Sodium nitroprusside increases Qs/Qt in dogs with regional atelectasis. Anesthesiology. 1977;47(4):338-341.
15 Lloyd TCJr. Influence of blood pH on hypoxic pulmonary vasoconstriction. J Appl Physiol. 1966;21(2):358-364.
16 Reinhart K, Kuhn HJ, Hartog C, Bredle DL. Continuous central venous and pulmonary artery oxygen saturation monitoring in the critically ill. Intensive Care Med. 2004;30(8):1572-1578.
17 National Heart, Lung, and Blood Institute Acute Respiratory Distress Syndrome (ARDS) Clinical Trials NetworkWheeler AP, Bernard GR, et al. Pulmonary-artery versus central venous catheter to guide treatment of acute lung injury. N Engl J Med. 2006;354(21):2213-2224.
18 Blinman T, Maggard M. Rational manipulation of oxygen delivery. J Surg Res. 2000;92(1):120-141.
19 Gattinoni L, Brazzi L, Pelosi P, et al. A trial of goal-oriented hemodynamic therapy in critically ill patients. SvO2 Collaborative Group. N Engl J Med. 1995;333(16):1025-1032.
20 Rivers E, Nguyen B, Havstad S, et al. Early goal-directed therapy in the treatment of severe sepsis and septic shock. N Engl J Med. 2001;345(19):1368-1377.
21 National Heart, Lung, and Blood Institute Acute Respiratory Distress Syndrome (ARDS) Clinical Trials NetworkWiedemann HP, Wheeler AP, et al. Comparison of two fluid-management strategies in acute lung injury. N Engl J Med. 2006;354(24):2564-2575.
22 Darioli R, Perret C. Mechanical controlled hypoventilation in status asthmaticus. Am Rev Respir Dis. 1984;129(3):385-387.
23 Feihl F, Perret C, Permissive hypercapnia. How permissive should we be? Am J Respir Crit Care Med. 1994;150(6 Part 1):1722-1737.
24 Hickling KG. Lung-protective ventilation in acute respiratory distress syndrome: Protection by reduced lung stress or by therapeutic hypercapnia? Am J Respir Crit Care Med. 2000;162(6):2021-2022.
25 Laffey JG. Protective effects of acidosis. Anaesthesia. 2001;56(10):1013-1014.
26 Laffey JG, Kavanaugh BP. Hypocapnia. N Eng J Med. 2002;347(1):43-53.
27 Klocke RA. Carbon dioxide transport. In: Fishman AP, editor. Handbook of Physiology: Section 3: The Respiratory System. Bethesda MD: American Physiological Society; 1987:173-197.
28 Ivanov SD, Nunn JF. Influence of the duration of hyperventilation on the rise time of PCO2 after step reduction of ventilation. Respir Physiol. 1968;5(2):243-249.
29 Fowler WS. Lung function studies: The respiratory dead space. Am J Physiol. 1948;154(3):405-416.
30 Nuckton TJ, Alonso JA, Kallet RH, et al. Pulmonary dead-space fraction as a risk factor for death in the acute respiratory distress syndrome. N Eng J Med. 2002;346(17):1281-1286.
31 Gattinoni L, Vagginelli F, Carlesso E, et al. Prone-Supine Study Group. Decrease in PaCO2 with prone position is predictive of improved outcome in acute respiratory distress syndrome. Crit Care Med. 2003;31(12):2727-2733.
32 Marini JJ. Tracheal gas insufflation: A useful adjunct to ventilation? Thorax. 1994;49(8):735-737.
[/level-membership-for-critical-care-medicine-category][not-level-membership-for-critical-care-medicine-category]
44 Principles of Gas Exchange
Oxygen Exchange
Except in extreme conditions under which Hb is unable to bind O2 (e.g., carbon monoxide intoxication, methemoglobinemia) or under which very severe anemia limits the amount of O2 that can bind to Hb, dissolved O2 accounts for a very small percentage of the total.1 In fact, Hb is such an effective carrier for O2 that the quest to develop an effective blood substitute for clinical use has been only partially successful. Intravascularly delivered products based on stroma-free Hb (an avid oxygen binder) and perfluorocarbon (an efficient dissolver of oxygen) are potentially effective but have encountered problems with stability, toxicity, and cost.2 For the present, blood substitutes must be considered impractical for the clinical setting.
Oxygen Delivery
Metabolizing tissues require an adequate supply of oxygen to efficiently produce the energy needed for cellular function. The quantity of oxygen loaded onto the arterial bloodstream per unit time (O2 delivery) is the product of the cardiac output and the oxygen contained within each milliliter of blood. Therefore, a deficiency of either cofactor can be partially offset by a compensatory increase of the other. Conversely, sluggish blood flow, whether caused by low cardiac output or high resistance through the tissues, can limit the O2 actually delivered to the cell. Increased blood viscosity impedes the transit of erythrocytes through the capillary bed, tending to limit oxygen consumption (VO2).3 For this reason, paraproteinemia, extreme leukocytosis, and polycythemia can pose life-threatening challenges to O2 consumption that are independent of any impact on cardiac output.3 Studies performed in animal models demonstrate that hematocrit (Hct), a primary determinant of viscosity, bears a nonlinear relationship to oxygen delivery that varies somewhat with circulating blood volume.4 At low values of Hct, a rising Hb concentration predictably adds to O2 content and delivery. Above a Hct of 30% to 34%, however, it is difficult to demonstrate in critically ill patients an increase in oxygen consumption or an outcome benefit that derive from increases of O2 content arising from further increments of Hb.5 At an Hct of around 55% to 57%, O2 delivery reaches its maximum in normal subjects, falling sharply with each further rise in Hct (Figure 44-1). Above an Hct of approximately 65%, phlebotomy may be required to avert a hemodynamic crisis, as vital tissues may be deprived of delivered oxygen. Viscosity, and therefore tolerance for higher Hct, is partially determined by the circulating blood volume; the polycythemia associated with intravascular volume contraction is much less well tolerated than that of polycythemia vera, a condition in which circulating blood volume is expanded.3 As might be expected, patients with vascular disease are less tolerant to the adverse rheologic effects of high Hct.
At the mitochondrial level, oxygen acts as the terminal acceptor in a chain of organic electron donors known as cytochromes. The PO2 within the mitochondrion needed to sustain this process is very low—estimated to be much less than 1 mm Hg.6 To provide that needed level of mitochondrial oxygen tension, an appropriate oxygen diffusion gradient must be established from the arterial blood, across tissue and cellular boundaries, and into the cellular organelles. At sea level, normal levels of mitochondrial O2 are achieved at a PaO2 of about 95 mm Hg. The actual PO2 within the mitochondrion, however, is affected by many factors other than arterial PO2: tissue metabolic rate, microvascular control, tissue properties, and blood flow. Over time, varying degrees of accommodation to subnormal PaO2 occur by adjustments of the cardiovascular system, Hb concentration, capillary system, and mitochondrial density.7 Although this adaptive phenomenon is commonly observed in patients with chronic lung diseases, the extent to which gradual accommodation to hypoxemia can occur and should be encouraged in patients who are critically ill is a provocative and largely unexplored question.
Oxygen Transfer Across the Lung
Low FIO2 is an important mechanism of hypoxemia occurring at altitude and in fires that occur in confined spaces. Although the relationship is not a strictly linear function, as a rough estimate, inspired O2 declines approximately 15 mm Hg for each 1000 meters of altitude above sea level.8 For practical purposes, however, a reduced concentration of inspired oxygen does not account for hypoxemia that occurs in the setting of critical illness. Hypoventilation alters the alveolar oxygen tension (PAO2) in proportion to the rise of PaCO2 (and PACO2) and becomes an important factor when it occurs during breathing of room air (as in narcotic overdose) or of relatively low inspired concentrations of supplemental oxygen (e.g., via nasal cannulae). The importance of impaired diffusion as a hypoxemic mechanism is sometimes debated, since the transfer of O2 from alveolus to Hb usually requires only a brief time for completion—somewhat less than the normal transit time of the erythrocyte through the capillary.9 Yet under many conditions that are commonly encountered, fewer capillaries are available to accept the cardiac output, so the rate at which blood flows through the lung is accelerated. Simultaneously, diffusion distances are lengthened, and the driving gradient is reduced by disease. For this reason, impaired diffusion is likely to contribute to hypoxemia occurring in the stressed patient with critical illness who receives near-normal FIO2.
Whereas the relationship of FIO2 to PaO2 is more or less linear for the first three oxygen-responsive mechanisms already covered, the response to oxygen supplementation for V/Q imbalance depends on the distribution of abnormal V/Q units contributing to the problem.10 Hypoxemia due to a relatively small number of lung units with very low V/Q characteristics may not respond noticeably to supplemental oxygen unless a very high FIO2 is employed. Conversely, a lung comprised predominantly of lung units with mild V/Q impairment tends to respond in more linear fashion (Figure 44-2). It is also possible to convert very poorly ventilated lung units into airless, unventilated units with inspired gas having a very high FIO2, owing to replacement of unabsorbable nitrogen with diffusible oxygen, leading to the unit’s contraction and eventual collapse as this process continues below the closing volume of the compromised region (absorption atelectasis).11 Unless compensation by hypoxic vasoconstriction is complete, raising FIO2 can paradoxically increase shunt even as it improves O2 transfer in units that remain patent.
Figure 44-2 Influence of severity of ventilation/perfusion inequality on the FIO2/arterial PO2 relationship.
Given the importance of matching blood flow to ventilation, it is not surprising that several mechanisms have developed to effect pulmonary microvascular regulation. Autonomic control, although less prominent and less precise than in the peripheral vasculature, is important nonetheless. Severe head injury, for example, can cause dysregulation and hypoxemia via this mechanism.12 Local acidosis, such as that existing in poorly ventilated areas, tends to vasoconstrict the pulmonary arterial microvessels. The strength of this reflex, however, pales before that of hypoxic pulmonary vasoconstriction, which for most individuals is a well-developed protection against the consequences of perfusing underventilated areas.13 These mechanisms may be overpowered by pathologic processes or by pharmacologic interventions. For example, local release of inflammatory mediators or use of certain vasoactive drugs (e.g., nitroprusside) may counter these protective reflexes,14 and an abrupt rise of pulmonary artery pressure may overwhelm them.
Shunting occurs when systemic venous blood is not brought into close proximity with the inspired gas. Shunt can originate in the heart (e.g., through a patent communication at the atrial or ventricular level). Rarely, direct venous-to-arterial transfer occurs through micro- or macrovascular defects known as pulmonary arteriovenous fistulae. Such communications are encountered in relatively common diseases such as hepatic cirrhosis as well as in other settings, exemplified by the heritable Osler-Weber-Rendu abnormality. Diseases that affect the lung parenchyma are much more common causes of shunt than these cardiovascular disorders. Filling of the airspaces with fluid (e.g., edema) or cellular infiltrate (e.g., pneumonia) prevents effective gas-blood interchange. Inflammatory conditions may inhibit hypoxic vasoconstriction, worsening arterial hypoxemia, as does hypocapnic alkalosis.15 Collapse of lung units may occur on any anatomic scale, resulting in shunt through the affected regions. Causes for collapse vary from compression (e.g., by a pleural effusion), to disease-induced surfactant depletion or inactivation, to airway plugging, such as by retained secretions or a misplaced endotracheal tube. Sustained reversal of atelectasis requires attention to the inciting cause as well as recruitment of the problem area by deep lung expansion. Pure oxygen breathing will not improve hypoxemia due to shunting. Conversely, reduction of FIO2 will not cause shunt-related hypoxemia to worsen and may spare ventilated areas the exposure to potentially toxic concentrations of inspired O2 (Figure 44-3).
Modification of body position may dramatically affect shunting and blood oxygenation when the lungs are injured, especially when disease is asymmetrically distributed. Prone positioning routinely improves oxygen exchange by altering the distribution of transpulmonary pressure as it modifies chest wall compliance and allows the heart to sink to a dependent position that does not compress the lungs. The dorsal lung zones, which are generally the best perfused, tend to reopen when prone. Drainage of secretions and lymphatic efficiency may also improve (Figure 44-4).
Venous oxygen saturation is a clinical tool to evaluate the relationship between oxygen uptake and delivery for the whole body. In the absence of pulmonary artery catheter–derived mixed venous oxygen saturation (), the central venous oxygen saturation (ScvO2) is increasingly being used as an imprecise but convenient surrogate measure. Central venous catheters are simpler to insert, less expensive, and associated with fewer complications than pulmonary artery catheters. Blood sampling through central venous catheters allows measurement of ScvO2 or even continuous monitoring if a fiberoptic oximetric catheter is used. The normal range for is 68% to 77%, and ScvO2 is considered to be approximately 5% above these values.16,17
In human studies, dysoxia is usually present when falls below 45%. Tissue oxygen privation may occur at higher levels of when oxygen extraction is impaired. Ideally, efforts to boost cardiac output (by intravenous fluids or inotropes), Hb, and/or arterial oxygen saturation return to levels above 65% (or ScvO2 to ≥70%).16,18
Relationship of PO2 to Blood O2 Content
Even though the oxyhemoglobin dissociation relationship is implicitly used for clinical decision making, there are important nuances (Figure 44-5). Over the clinically relevant range, the oxyhemoglobin dissociation curve is highly nonlinear, so that a drop of a few percentage points in SaO2 over the 95% to 100% interval reflects a much larger change in PaO2 than does a similar decrement that occurs over the 80% to 85% interval. Pulse oximeters record the relative absorption of light by oxyhemoglobin and deoxyhemoglobin. For a fixed value of Hb, the O2 saturation parallels its relative O2 content, but a high saturation guarantees neither its total O2 content nor the adequacy of tissue O2
[/not-level-membership-for-critical-care-medicine-category]
