Principles of Doppler Ultrasound

Published on 06/02/2015 by admin

Filed under Anesthesiology

Last modified 22/04/2025

Print this page

rate 1 star rate 2 star rate 3 star rate 4 star rate 5 star
Your rating: none, Average: 0 (0 votes)

This article have been viewed 2252 times

Principles of Doppler Ultrasound

Jonathan Kraidin, Steven Ginsberg, William Jian and Kevin A. Jian

Doppler works with sound. Sound is a mechanical, longitudinal wave that alternates between expanding and compressing the medium through which it propagates. This is analogous to a wave moving through the water. Normally, the ear perceives sounds up to 20 KHz. Higher frequencies are referred to as ultrasound, and unless you are a dog or bat you are not going to hear them. The rapid vibration of a piezoelectric crystal produces the ultrasound waves. The properties that describe the wave are1:

Doppler echocardiography allows the non-invasive assessment of blood flow, velocity and direction.2 It is based on the principle that a moving target will shift the reflected frequency higher or lower depending on whether it is moving toward or away from the transmitter. Using this principle, if one knows the frequency shift one can determine the velocity and direction of the blood flow.

Waves of energy, such as light and sound, can be defined by the wavelength and frequency. This gives us a third parameter, which is the propagation speed through the medium.

The equation is

image

in which f is the frequency, λ is the wavelength and c is the speed of sound in tissue, which is 1540 m/sec.

When a pure frequency of sound hits a stationary object, the sound bounces back at the same frequency. If the object is moving when the sound hits, the returning wave will have a slightly different frequency. The difference in the outgoing and incoming frequency is called the Doppler shift.

You can see the derivation of the Doppler Shift equation in the section, Derivation of the Doppler Shift Equation.

The Doppler Shift Equation

For a returning signal the equation is:

image

Let us break this equation down:

f0 is the original frequency of the ultrasound wave, v is the velocity of the object hit by the wave, and c is the speed of the wave as it propagates through the medium. Theta (θ) is the incident angle the beam makes with the axis of flow.

This is not just theoretical physics. This stuff really happens. Recall the sound of an approaching train. When the train is coming towards us, the pitch is higher (v is positive); when the train is moving away from us the pitch is lower (v is negative).

Let’s look at some real numbers:

What can we do with this information? By knowing the Doppler shift, we can use the equation in reverse and determine the velocity of the blood:

image

How is such a small change in the frequency measured? The truth is that the frequency is not measured. The machine actually measures the phase shift between the outgoing and incoming signal. The phase difference correlates with the Doppler shift as a first-order approximation.3

So, now that we have an understanding of the Doppler shift equation and how the machine makes measurements, what can we do with this information?

Basic Principle for Tissue Reconstruction Using Ultrasound

A sound wave is emitted from the transducer. When this wave encounters differences in density it gets reflected back. If you scream over the ocean shore you don’t hear your voice reflected off of the air because it has a constant density. If you scream across a canyon you hear an echo because the sound encounters a change of density when it hits the rocks, resulting in the sound getting reflected back. The amount of sound that gets reflected not only depends on the change in density at the interface, but on the orientation of the object. The orientation can scatter the sound in different directions. Software analyzes the amplitude of the sound at different times in order to reconstruct the tissue density at a specific depth from the probe, giving an image.

M-Mode

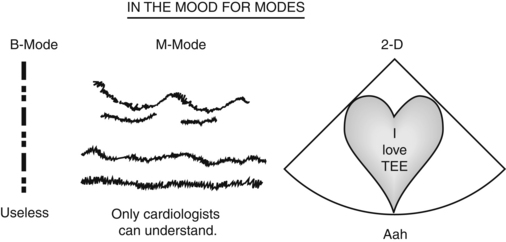
Once upon a time this stood for time-motion mode. It was shortened to M-mode for motion mode. M-mode is multiple B-mode dots plotted on a straight line. The amplitude of the signal is recorded at various times; each time corresponds to a different distance from the probe. A vertical line is constructed where the brightness of each pixel corresponds to the strength of the echo at each point. The constructed line is moved leftwards and a new scan line is created up to 1000 times/sec. Using this methodology, time is represented on the x-axis and the distance of the tissue from the probe is on the y-axis. This is useful for watching anatomical motion of the myocardium and valves along a single line of sight. This is useful for timing the movement of valve leaflets when assessing regurgitant blood flow.

Color Doppler

Remember the theory about Doppler shift? By sending a beam of sound at moving blood cells one obtains blood velocities. The velocities are represented by colors. If the object is moving towards the probe the machine tags it with a shade of red; if it is moving away it gets tagged with a shade of blue (BART: blue away red towards). A jet of blood moving toward the probe will appear as a red flame. The fastest part will be a bright red, which will fade to a duller red as the velocity slows down. If the blood is swirling (turbulent flow) the color will appear as a mosaic pattern because the velocity and direction are rapidly changing. The color will jump from red to blue, and all the shades in between these two colors. The color representation of the velocities is superimposed on a 2-D image of the underlying tissue.

Color Doppler allows one to get a rapid understanding of the blood flow in a window of interest. One can determine that blood is moving in the wrong direction, if the flow is laminar or turbulent, or if there is flow where there should be none such as through a defect.

Continuous Wave Doppler

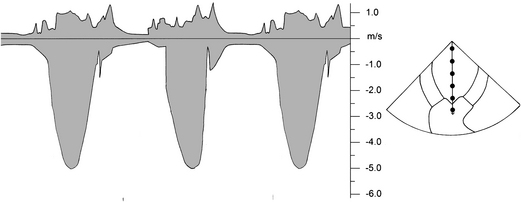
Continuous wave (CW) Doppler allows one to measure fast blood velocities. CW Doppler is exactly as the name describes: a transducer continuously transmits a beam of sound while a receiver continuously measures the returning signal. As the transducer emits sound, the beam encounters moving blood cells at varying points. The returning sound contains multiple shifted frequencies because it bounces off of blood cells at different depths, moving at different velocities. CW Doppler is unable to tell where these velocities are occurring; it can only report a range of velocity values. These velocities are all mixed together in a velocity envelope and occur along the line of sight of the probe.

image

How does this help if the machine is getting back a myriad of velocities? One uses CW when there is an interest in measuring fast velocities. True, all of the velocities are mixed together, but the operator only cares about the fastest velocity. The peak of the envelope represents the fastest velocity; everything inside the envelope represents all other velocities, which one ignores. For example, if one is looking at a stenotic aortic valve, the jet of blood traveling through the valve will give the fastest velocity. Even though the CW Doppler does not know where the fastest velocity is coming from, the operator knows the fastest velocity measured must be coming from the jet going through the stenotic valve.

Pulse Wave Doppler

Sometimes one needs to know the velocity at a specific point. Pulsed wave Doppler (PW), unlike CW, can give velocities within a specific volume of blood. PW Doppler sends out a pulse train (several pulses) of sound at a fixed carrier frequency. The machine waits an appropriate period of time for the pulse to travel a known distance and back before looking at the shifted signal. By sampling the pulse at a fixed time interval, and rejecting others, the operator can position a cursor at a specific location and measure that velocity (see figure below). PW Doppler can measure velocities close to 1.2 m/sec.

image

Look at it this way. You have three walls 1540, 3080, and 4620 meters away. You ring a bell and the sound travels at 1540 m/sec. If you cover your ears and listen only after 4 seconds you will hear the sound reflecting back from the wall 3080 meters away; if you wait 6 seconds you will hear sound bouncing back from the wall 6420 meters away. By waiting just the right amount of time you can target from which wall you want to hear the echo.

Range Ambiguity

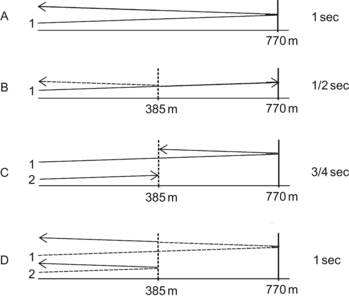
Some of the sound will travel farther than the target and get reflected back during a sampling interval. Also, some of the sound will get reflected back sooner and get sampled with some of the pulses that were sent out earlier. This will give some velocities at other ranges. When velocity information is recorded at other locations and is mixed with the sample, we call this range ambiguity (see figure below) because it is giving ambiguous information.

image

Other than the problem with range ambiguity, why is PW not used for all Doppler measurements and just do away with CW? After all, it does give information at a specific location. Sampling theory dictates that at least two points are needed for each wave oscillation in order to reconstruct the correct frequency. If the wall is 1540 meters away one needs to wait 2 seconds before the Doppler-shifted sound comes back. This corresponds to a frequency of ½ Hz. The sound will not travel any faster than this. Two measurements take 4 seconds. This means that the shift frequency can go no faster than ¼ Hz (frequency (Hz) = 1/time).

Nyquist Limit and Aliasing

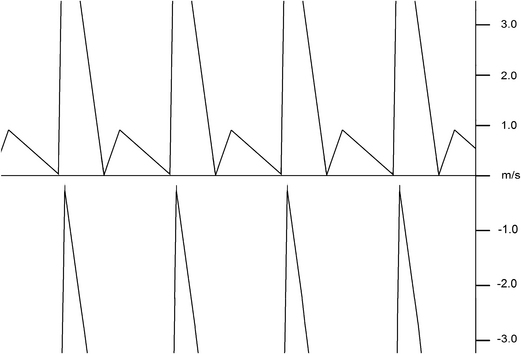
If we do not take enough samples of the signal, the measured velocity direction will appear reversed, or aliased. The velocity waveform will appear cut off at the top of the display and reappear at the bottom.

image

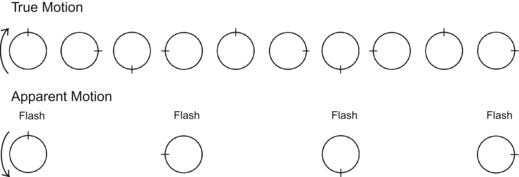
The figure is the strange-looking effect from not taking enough samples. Remember seeing a rotating wheel appear to spin backwards? Remember the song: “the wheels on the bus go round and round…”. Well, the bus wheels sometimes appear to spin in reverse. Let’s analyze this by referring to the figure of a spinning wheel, where the top spoke is marked (see figure below).
image

The wheel spins at 1 revolution per second clockwise in a dark room. If we use a strobe light and send a flash once per second we will illuminate the wheel when the top spoke is in the same position. By observing the wheel in the same position each second we do not know if the wheel is spinning once per second, twice per second or is even moving at all. If we sample it every ¾ of a second we will first see the marked spoke ¾ of a revolution around. After the next strobe it will move another ¾ of a revolution and we will see it half way around. The third strobe will occur when the spoke is ¼ of the way around.

Even though the wheel is rotating clockwise it appears that the wheel is moving counterclockwise. This is aliasing. In order to avoid this we need to send out a strobe at least every ½ second, or twice the revolution frequency. In this case, the Nyquist limit is ½ Hz, and if the wheel spins any faster than 1 Hz it will appear to move backwards. Similarly, if the blood velocity is fast enough to yield a shift frequency above the Nyquist limit, the blood will appear to move in the opposite direction.

If you would like to see the derivation of the Nyquist limit please refer to Derivation of the Nyquist Limit for PW Echo.

Just remember these points: Aliasing occurs when the sampling frequency is below a calculated limit called the Nyquist limit. PW allows one to measure the velocity of a volume of fluid at a specific depth from the probe. Shifting the baseline or switching to CW Doppler enables one to measure faster velocities, and work around the Nyquist limit. Sometimes you can even use CW for fast velocities if the blood flow is isolated to a small enough region.

HPRF (High Pulse Repetition Frequency) Mode3

Sometimes one wants to know a velocity at a specific location, but the velocity is too high to get a true reading. What can one do? Many echo machines have a HPRF mode that allows one to exceed the Nyquist limit. It does not have a range as high as CW, but it is higher than plain PW. How does it do it? Pulses are sent out before the time is reached to send out the next allowed pulse. If the object is 770 meters away we normally have to wait 1 second before sending another pulse so we are sure it is an echo from that distance. If we send a pulse every ½ second we can measure twice the shift frequency. The downside is that there is some range-ambiguity: one will get a mixing of the velocity at two locations, shown by two cursor location markers.

Beam Angle
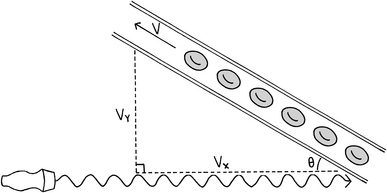
The most accurate reading from the PW or CW interrogation is when the beam is parallel to the flow. As the beam moves off of the axis of flow it begins to underestimate the true value. The value is directly related to the cosine of the angle between the beam and the blood flow. The effect becomes significant when the angle is greater than 20 degrees, and this corresponds to an underestimation error of about 6%. After 20 degrees, the error gets significantly larger at a faster rate.

image

(WARNING: Math alert! Proceed with caution!)

Derivation of the Doppler Shift Equation

We are going to derive the shift equation in order to get a better understanding of it.
image

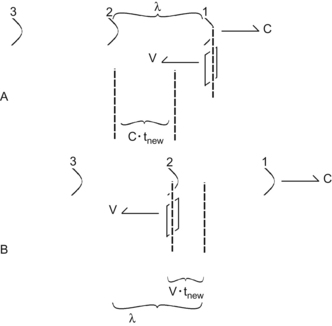
If the object is stationary, the wavelength seen by an observer positioned on the object is unchanged. An observer on the object will encounter each wave crest at the same time it is transmitted. If the object is moving forward with a velocity v, the moving observer will encounter each wave crest sooner. It will appear that the wavelength is decreased and the frequency is increased.

t0 = λ/c is the time, t0, it takes for the next crest of our sound wave to hit the stationary object.

tnew is the faster time that it takes for our object, moving at speed v, to hit the next crest.

The object moves a distance v * tnew; the next wave crest moved a distance c * tnew. The sum of both distances, c * tnew + v * tnew, equals one original wavelength, λ. The perceived wavelength is v * tnew.

Doing a little math we find:

image

image

image

This means that the frequency has increased for our observer on the moving object. But we are not interested in the shifted frequency seen by an observer on the object; we are interested in the frequency that is reflected back from this object.

We have already shown that the crest of the wave hits the moving object in a shorter time, tnew, when the object is moving towards the source. The listener on the object perceives a shorter wavelength. This is the first Doppler shift. When a wave is reflected off of the object back to the source, the distance between each wave crest is shortened once again, giving a second Doppler shift. The wavelength is shortened a second time because the object is following the reflected waves.

Here is another way to think of this: You are standing still and there is a row of evenly spaced balls, traveling at the same speed, that are coming towards you. The number of them that passes you each second is the frequency. If you start to move towards the balls you will pass a new ball faster than if you stood still. The frequency of passing a ball has increased. This is the first Doppler shift, which is from the perspective of the observer, and not the person sending out the balls.

Now imagine that you let the balls bounce off a board that you are holding. If you are standing still the balls will travel away from you at the same frequency as when they were coming towards you. The spacing between each ball will also be the same. If you are walking towards the incoming balls, and they bounce off a board you are holding, they will not move away from you as quickly as when you stood still. This is because you are walking toward the ball as it recedes from you. So not only has the distance between each oncoming ball decreased because you are walking towards them (first Dopper shift), but the distance decreases even further for the reflected balls because you are walking toward the balls as they move away (second Doppler shift). We can derive a mathematical relationship demonstrating this fact.
image

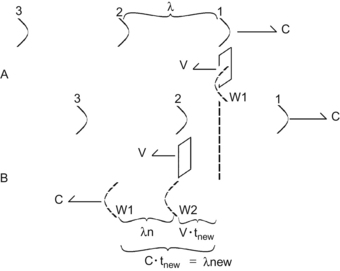
Referring to the above figure, we see that, at time A, the first wave crest hits the object, reflecting back wave W1. This wave moves towards the left at a speed c. The original wave also moves towards the right at speed c. The object moves towards the left at speed v and hits the next wave crest at time tnew. We derived this value earlier. When the object hits the next wave crest it reflects back wave W2.

Now, W1 moved a distance c * tnew during the time it took to hit the next crest. The object moved a distance v * tnew. The difference, c * tnew – v * tnew is the new wavelength, λn, of our reflected wave, and it moves at the same speed, c. The frequency of the returning waves is

image

Let’s bang out the derivation:

And there it is. Bam!

Questions (Doppler Physics)

Answers

1. D. The average speed of sound in tissue is 1540 m/sec

2. A. You can solve this by looking at the units: speed (m/s) = wavelength (m) × frequency (1/sec)

3. C. The measured velocity will be less than the true velocity by cos(θ)

4. B. HPRF is used with PW Doppler and allows you to measure faster blood velocities

5. D. The correction factor, cos(θ), becomes significant when the angle is greater than 20 degrees

6. True. When the scanning depth decreases, it takes less time for the sound to travel back

7. False. PW Doppler measures velocity within a specific volume

8. True. The measurement of fast velocities is the benefit of CW Doppler

9. False. The Nyquist Limit is the fastest velocity one can measure, not frequency

10. True. Color Doppler shows blood velocity, represented by colors, on top of the 2-D image